MR spectroscopy in Alzheimer’s disease
Abstract
MR Spectroscopy (MRS) has been used for diagnosis of many neurological disorders such as central nervous system tumors and neuro-inflammatory diseases. Despite many studies on MRS in neurodegenerative disorders and particularly Alzheimer’s disease, its utility has been hampered by lack of standard techniques across studies and limited data on the association between the level of metabolites in MRS and pathological changes of AD. In this review we have summarized the findings of MRS in Alzheimer’s disease, discussed the limitation of the current data and the pitfalls in interpretation of the MRS results and also we presented the latest developments in this field and potential future steps in order to utilize MRS more effectively in clinical practice.
1.Introduction
A number of studies in the past two decades have investigated the role of MR Spectroscopy (MRS) in neurodegenerative disorders. Brain metabolites could act as surrogate markers for different pathological processes such as neuronal damage, glial proliferation, loss of membrane integrity, and even inflammatory changes. Therefore, MRS has the potential of detecting the early metabolic changes in Alzheimer’s disease (AD) while the structural MRI remains normal [14,49,55]. In addition, MRS is a readily available technique and relatively inexpensive with no risk of radiation. These characteristics make MRS a valuable potential biomarker to bridge the gap between the pathological changes [5,45] and clinical presentation of AD particularly in the clinical setting where access to PET is limited.
2.Changes in the level of MRS metabolites in Alzheimer’s disease
2.1.N-acetylaspartate
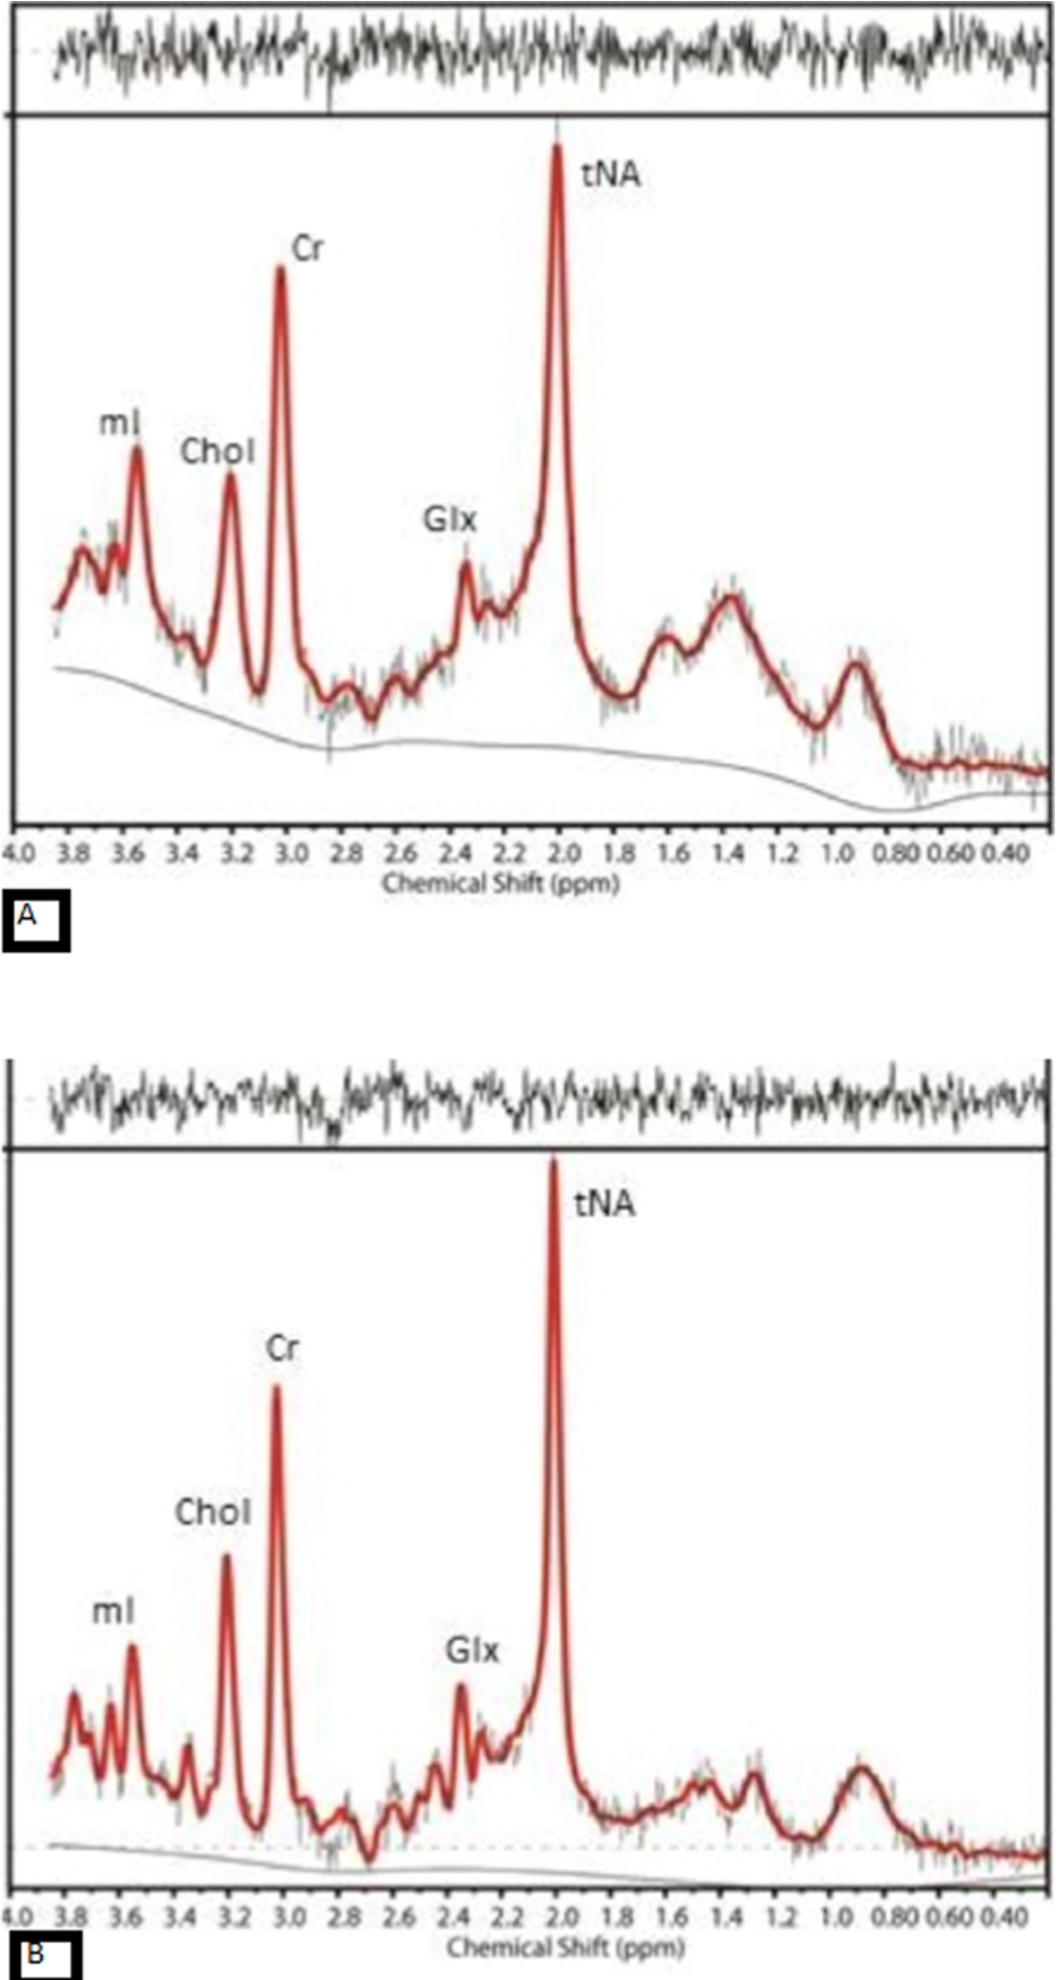
Decrease in N-acetylaspartate (NAA) is one of the main reported findings in AD [15,37,56] (Fig. 1). NAA is an amino acid that is predominantly synthesized intraneuronally in the mitochondria of the neuronal cell body, axons, and dendrites but not the glial cells. Its normal concentration is around 10–12 mmol/L [61] and it is a marker of neuroaxonal density and viability. It has been shown in different neurological disorders that the level of NAA indicates the neuronal vitality and function [34,46,57,58,60].
Fig. 1.
The MR spectra from posterior cingulate gyrus of (A) an AD case with amyloid deposition and (B) an aged-match control with no evidence of amyloid in the brain, show reduction in NAA and increase in mI in AD compared to control.
Both NAA absolute value and the ratio of NAA over Creatine (NAA/Cr) have been assessed in separate brain regions as well as the whole brain [12]. Reduction of NAA has been reported in the medial temporal lobe [1,8], hippocampi [1,4,15,52], and posterior cingulate gyrus [7,10,24]. Hippocampal NAA/Cr value has been reported to have the highest sensitivity and specificity to differentiate AD from HC [10]. A study using Serial MRS confirmed longitudinal reduction of NAA in the posterior cingulate gyrus of AD cases [37]. It has been claimed that the combination of NAA and [Cr + PCr] has a 74% accuracy in distinguishing AD from healthy control (HC) [15].
Although reduction of NAA is a known feature in AD, the results are not very consistent in those with mild cognitive impairment (MCI). Some studies claimed significant difference in the level of NAA in MCI cases compared to HC [16,28,37], while others found a difference between MCI and AD but not between MCI and HC [15]. Moreover, some studies found an intermediate reduction of NAA in MCI which was not significantly different from either AD or HC [56]. Some studies have shown that reduction of NAA in MCI cases may predict future conversion to AD [25,38]. Compared with non-converters, converter MCI cases appear to have lower levels of NAA at baseline and further significant reductions in follow up studies in posteromedial parietal cortex [37].
2.2.Myoinositol
In addition to NAA reduction, increase in myoinositol (mI) in several brain regions is considered another feature of AD [2,23,55] (Fig. 1). mI is a glial marker and increase in the level of mI can be a sign of increased glial content, size, and activation [11,58]. Increase in mI or mI/Cr is assumed to be an early event in the course of AD pathology and can precede the NAA reduction [7,23,35]. This means glial proliferation can potentially happen prior to neural dysfunction in the course of AD [20,23]. Moreover, there is no evidence of longitudinal increase in the level of mI corroborating the assumption that elevation of mI is an early change in the course of the disease and reaches the plateau relatively early on [22]. Compared to HC population, higher levels of mI/Cr have also been reported in MCI cases. Detection of NAA reduction and mI increase in AD compared to MCI and HC improves the specificity and accuracy of the clinical diagnosis significantly (100% for distinguishing AD from HC) [61]. These two metabolites provide complementary information about AD pathology and the combined ratio of these two metabolites (NAA/mI) has the strongest association with the pathological severity of the disease [26].
2.3.Choline
Elevation of Choline (Chol) in AD is another finding reported in some of the studies [23,61] with no significant longitudinal change in serial MRS scans during the course of the disease [2,10]. Chol in MR spectrum is the product of membrane phosphotidylcholine breakdown and its elevation in AD cases might be a consequence of increased membrane turnover secondary to neural damage and degeneration. Alternatively, raised Chol peak could be due to a compensatory mechanism to overcome the deficit in the acetylcholine production in AD by increasing in the catabolism of the phosphotidylcholine membrane to provide free Chol [32,65]. There are, however, some studies which didn’t find any significant difference in the level of Chol between AD and HC [29,36,39,43,52]. Most of the studies that didn’t find any change in Chol, measured metabolites in temporal lobes or hippocampi while region of interest in studies with increased Chol were mainly in posterior cingulate gyrus (PCG). This may explain the contradictory results between different studies. Raised Chol/Cr has also been reported in MCI cases compared to HC with no difference between stable and converter MCI at the baseline. Interestingly, the stable MCI cases had more reduction in the level of Chol/Cr over time compared with converter MCI and control. The authors hypothesized that these findings were suggestive of compensatory mechanism by upregulation of the choline transferase in stable MCI cases [37].
2.4.Glutamate + glutamine
The level of Glutamate + Glutamine (GLx) is also reported in some studies to be lower in those with AD and MCI [3,13,17]. Glutamate (Glu) is the most prevalent and the main excitatory neurotransmitter in the central nervous system [67]. Glutamine (Gln) is the product of Glu conversion in presynaptic neurons. The continuous cycle of Glu–Gln mediates glutamatergic neurotransmission [64]. The reduction in the level of Glx in AD is seen in the anterior cingulate cortex, hippocampi [19], medial temporal lobe [63], and PCG [17]. Its level has also been reported to be reduced in MCI cases[48]. There are, however, other studies which didn’t identify any significant difference in the level of Glx between AD and healthy controls [24]. Limitation of the current MRS techniques is a possible explanation for these conflicting results. With the current MRS technique, it is challenging to separate Glu from Gln, hence the combined peak is measured as Glx, even separating Glx peak from other metabolites and quantification of Glx in both normal and diseased individuals is proven to be difficult with low field MRS.
3.MRS metabolites, amyloid and tau
There are limited data on the spatial and temporal associations between changes in the level of MRS metabolites and presence or load of misfolded proteins as the hallmarks of AD. In one study, the correlation between the level of NAA/Cr in different brain regions and CSF biomarkers revealed an association between hippocampal NAA/Cr and CSF AB and parietal NAA/Cr and CSF-tau [4]. In another study, however, no significant correlation was identified between global cortical AB load as measured by 11C-Pittsburgh Compound B (11C-PiB) PET scan and the level of NAA/Cr in cognitively normal older adults [27]. In autopsy samples, the NAA/Cr was associated with neurotic AB plaques [26] and also with reduction of the synaptic vesicle immunoreactivity and accumulation of early neuritic and pre-tangle tau in the posterior cingulate gyrus but not with the extracellular Neurofibrillary tangle of tau. Based on these findings, the authors postulated that NAA/Cr is a marker of early tau-mediated dynamic processes in AD [39].
The mI/Cr ratio is also associated with both neuritic and diffuse AB plaques in autopsy samples [26,39]. Histopathology studies have also confirmed that there are foci of proliferated glial cells, source of increased mI, in the proximity of AB plaques [42]. Furthermore, global cortical and regional PiB uptake in the posterior cingulate gyrus (PCG) showed a correlation between amyloid burden and elevation of mI/Cr in cognitively normal elderly [27]. More recently, Voevodskaya et al showed similar associations between mI/Cr and 18F-flutemetamol uptake in the PCG in cognitively healthy adults [62].
Despite extensive literatures on the relationship between AB and Cholinergic system in animal models and in-vitro [6,31,40], the same results cannot be replicated in human. In human studies, elevation of Chol/Cr ratio was reported to be associated with higher amyloid uptake in PiB-PET in posterior cingulate gyrus in cognitively normal elderly [27]. The level of Chol/Cr was also higher in PCG/ precuneus of AB + MCI individuals compared to AB – controls [62]. Histopathology studies, however, have shown conflicting results; some studies did not find any association between level of Chol and neuritic or diffuse AB plaques [26,39], while in another study, Choline acetyltransferase (ChAT) activity was shown to be inversely associated with PiB binding in precuneus area in autopsy samples of subjects with AD, but not in MCI [21]. Moreover MCI subjects have shown up-regulation of ChAT in the frontal lobes despite high AB load [9]. The underlying mechanism for the region-specific differences in the relationship between AB and cholinergic activity at early stages of disease is unclear [21].
The relationship between Glx and AB is also not completely understood. Many in-vitro and animal studies have shown that AB affects the glutamatergic synapses and causes the dysregulation and excitotoxic neuronal damage [18,44]. However, the results of human studies are contradictory. In some studies, the reduction in the level of Glx in posterior cingulate gyrus was associated with higher total cortical PiB uptake [66] while others didn’t find any association between reduced Glx in PCG and AB load [48]. Tau is also shown to affect glutamate receptors in preclinical research [59], but there is lack of data on human to confirm this association. On the other hand, the association between Glx and FDG has been reported in many conditions such as epilepsy [47], tumor [50] and behavior variant of frontotemporal dementia (bvFTD) [30].
4.Controversial results and limitations of the previous studies
Although the results of the initial MRS studies in AD were promising, there is lack of transition to the clinical setting. The main reasons for the limited use of MRS in diagnosis of AD are lack of specificity and also the controversial results at early stage of the disease, particularly for metabolites such as Chol and Glx.
The discrepancy seen in the literature might be due to several factors:
1 Heterogeneity and different selection criteria for the MCI/preclinical AD in different studies.
2 Technical differences in acquiring MRS data across studies.
3 Voxel position variations between different studies as the level of some of the metabolites are region dependent.
4 Different composition of voxels (the percentage of gray matter, white matter and CSF) since metabolites also have different ratios in white and gray matter.
5 Lack of knowledge about presence of underlying pathological changes such as presence of amyloid B (AB), tau, Lewy body
6 Inherent limitations of lower field MRS to detect some of the metabolites (such as Glx, or GABA) reliably.
7 Limited data on validation of the MRS changes against other more established imaging biomarkers and pathology results. The association between changes in the level of metabolites and other disease biomarkers have not been thoroughly investigated in human.
5.Recent developments
New developments in the field of MRS can potentially address some of the above-mentioned limitations. In the first PET-guided MRS study, level of metabolites was measured in the regions of AB deposition and hypometabolism identified by PET in order to assess the regional and temporal relationships between PET markers of AD and the level of metabolites. Despite its modest sample size, the study showed that the level of NAA had regional associations with both AB and hypometabolism identified by PiB and FDG-PET respectively. However, when the regression model was corrected for clinical diagnosis NAA was only associated with hypometabolism as a marker of neurodegeneration. There was also a stepwise reduction in the level of NAA from healthy controls to MCI to AD, while neither of PET SUVRs could differentiate MCI from early AD in the same cohort. In the same study, the level of mI was found to have strong regional and temporal associations with AB, presenting the same pattern of changes across the disease spectrum [53].
It has also been shown that the association between Chol and AB in PET-guided MRS becomes significant only after correcting for the voxel position, which confirms the regional variations in the level of Chol in the brain. It may also explain the discrepancy between the results of previous studies. The same study showed the level of Glx was associated with FDG uptake again only when the regression model was adjusted for voxel position [54]. These results however, need to be confirmed in larger studies and in different cohorts.
Utilizing ultra-high field MRI can also overcome many of the current limitations of the MRS studies. The main advantages of ultra-high field MRS are:
1 Significantly higher signal to noise ratio and capability of reducing the voxel size if required.
2 The ability to detect a higher number (14–15) metabolite peaks in the spectrum compared with lower field MRS. High field MRI is particularly beneficial for metabolites such as GABA or Glx as main inhibitory or excitatory neurotransmitters respectively as well as Ascorbate or Glutathione as main antioxidants markers in the brain. Many preclinical studies have confirmed the relationship between the level of neurotransmitters, connectivity and misfolded proteins in animal models and in vitro. However, they haven’t been translated into human study because of the limitation of current in vivo techniques. The initial data on 7T MRS are very promising [33,41] and indicating the potential role of this technique for better measurement of neurotransmitters.
There are also many on-going developments to improve the acquisition techniques, separating the overlapping peaks and measuring the level of metabolites more accurately and only in gray matter [51]. These advances are particularly very crucial for Alzheimer’s study as the PET markers of AB, tau and FDG are based on gray matter uptake only.
6.Conclusion
MRS can potentially fill the gap between the low sensitivity and specificity structural images currently used in the clinical setting and more advanced, very expensive and not widely available techniques, such as amyloid and tau PET, that are currently only used in research.
Changes in the level of certain metabolites in MRS can be surrogate markers of underlying pathological alterations in AD and potentially MRS can improve the diagnosis, predict the prognosis or assess the response to treatment.
The limitations of the previous studies have hampered the utility of MRS, however, recent advances can overcome some of those shortcomings.
Standardization of MRS techniques and validation of the regional and temporal changes of the metabolites against the known pathological hallmarks of AD with longitudinal follow up across the spectrum of the disease are required to prove the utility of MRS as a potential imaging biomarker for AD.
Conflict of interest
The author has no conflict of interest to report.
References
[1] | N. Ackl, M. Ising, Y.A. Schreiber, M. Atiya, A. Sonntag and D.P. Auer, Hippocampal metabolic abnormalities in mild cognitive impairment and Alzheimer’s disease, Neuosci Lett 384: (1–2) ((2005) ), 23–28. |
[2] | E. Adalsteinsson et al., Longitudinal decline of the neuronal marker N-acetyl aspartate in Alzheimer’s disease, Lancet ((2000) ), 1696–1697. |
[3] | P.G. Antuono et al., Decreased glutamate + glutamine in Alzheimer’s disease detected in vivo with (1)H-MRS at 0.5 T, Neurology 56: (6) ((2001) ), 737–742. |
[4] | D.M. Bittner, H.J. Heinze and J. Kaufmann, Association of 1H-MR spectroscopy and cerebrospinal fluid biomarkers in Alzheimer’s disease: Diverging behavior at three different brain regions, J Alzheimers Dis 36: (1) ((2013) ), 155–163. doi:10.3233/JAD-120778. |
[5] | G. Blessed, B. Tomlinson and M. Roth, The association between quantitative measures of dementia and of senile change in the cerebral grey matter of elderly subjects, Br J Psychiatry. 114: (512) ((1968) ), 797–811. doi:10.1192/bjp.114.512.797. |
[6] | J.D. Buxbaum et al., Cholinergic agonists and interleukin 1 regulate processing and secretion of the Alzheimer beta/A4 amyloid protein precursor, Proc Natl Acad Sci USA 89: (21) ((1992) ), 10075–10078. doi:10.1073/pnas.89.21.10075. |
[7] | M. Catani et al., (1)H-MR spectroscopy differentiates mild cognitive impairment from normal brain aging, Neuroreport. 12: (11) ((2001) ), 2315–2317. |
[8] | L.L. Chao, N. Schuff, J.H. Kramer, A.T. Du, A.A. Capizzano, J. O’Neill, O.M. Wolkowitz, W.J. Jagust, H.C. Chui, B.L. Miller, K. Yaffe and M.W. Weiner, Reduced medial temporal lobe N-acetylaspartate in cognitively impaired but nondemented patients, Neurology. 64: (2) ((2005) ), 282–289. doi:10.1212/01.WNL.0000149638.45635.FF. |
[9] | S.T. DeKosky et al., Upregulation of choline acetyltransferase activity in hippocampus and frontal cortex of elderly subjects with mild cognitive impairment, Ann Neurol 51: (2) ((2002) ), 145–155. doi:10.1002/ana.10069. |
[10] | R.M. Dixon et al., Longitudinal quantitative proton magnetic resonance spectroscopy of the hippocampus in Alzheimer’s disease, Brain 125: (10) ((2002) ), 2332–2341. doi:10.1093/brain/awf226. |
[11] | T. Ernst et al., Frontotemporal dementia and early Alzheimer disease: Differentiation with frontal lobe H-1 MR spectroscopy, Radiology 203: (3) ((1997) ), 829–836. |
[12] | A. Falini, M. Bozzali, G. Magnani, G. Pero, A. Gambini, B. Benedetti, R. Mossini, M. Franceschi, G. Comi, G. Scotti and M. Filippi, A whole brain MR spectroscopy study from patients with Alzheimer’s disease and mild cognitive impairment, Neuroimage. 26: (4) ((2005) ), 1159–1163. doi:10.1016/j.neuroimage.2005.03.005. |
[13] | N. Fayed et al., Brain glutamate levels are decreased in Alzheimer’s disease: A magnetic resonance spectroscopy study, Am J Alzheimers Dis Other Demen 26: (6) ((2011) ), 450–456. doi:10.1177/1533317511421780. |
[14] | M.J. Firbank, R.M. Harrison and J.T. O’Brien, A comprehensive review of proton magnetic resonance spectroscopy studies in dementia and Parkinson’s disease, Dement Geriatr Cogn Disord 14: (2) ((2002) ), 64–76. doi:10.1159/000064927. |
[15] | C.M. Foy, E. Daly, A. Glover, R. O’Gorman, A. Simmons, D.G. Murphy and S. Lovestone, Hippocampal proton MR spectroscopy in early Alzheimer’s disease and mild cognitive impairment, Brain Topogr 24: (3–4) ((2011) ), 316–322. |
[16] | I. Hancu et al., 1H MR spectroscopy using TE averaged PRESS: A more sensitive technique to detect neurodegeneration associated with Alzheimer’s disease, Magn Reson Med 53: (4) ((2005) ), 777–782. doi:10.1002/mrm.20419. |
[17] | N. Hattori et al., Proton MR spectroscopic study at 3 Tesla on glutamate/glutamine in Alzheimer’s disease, Neuroreport 13: (1) ((2002) ), 183–186. |
[18] | N.W. Hu, T. Ondrejcak and M.J. Rowan, Glutamate receptors in preclinical research on Alzheimer’s disease: update on recent advances, Pharmacol Biochem Behav. 100: (4) ((2012) ), 855–862. |
[19] | D. Huang et al., Glutamate-glutamine and GABA in brain of normal aged and patients with cognitive impairment, Eur Radiol 27: (7) ((2017) ), 2698–2705. doi:10.1007/s00330-016-4669-8. |
[20] | W. Huang, G. Alexander, L. Chang, H.U. Shetty, J.S. Krasuski, S.I. Rapoport and M.B. Schapiro, Brain metabolite concentration and dementia severity in Alzheimer’s disease: a (1) H MRS study, Neurology. 57: (4) ((2001) ), 626–632. doi:10.1212/WNL.57.4.626. |
[21] | M.D. Ikonomovic et al., Precuneus amyloid burden is associated with reduced cholinergic activity in Alzheimer disease, Neurology 77: (1) ((2011) ), 39–47. doi:10.1212/WNL.0b013e3182231419. |
[22] | K. Kantarci, Magnetic resonance spectroscopy in common dementias, Neuroimaging Clin N Am 23: (3) ((2013) ), 393–406. doi:10.1016/j.nic.2012.10.004. |
[23] | K. Kantarci et al., Regional metabolic patterns in mild cognitive impairment and Alzheimer’s disease: A 1H MRS study, Neurology 55: (2) ((2000) ), 210–217. doi:10.1212/WNL.55.2.210. |
[24] | K. Kantarci et al., Proton MR spectroscopy in mild cognitive impairment and Alzheimer disease: Comparison of 1.5 and 3 T, AJNR Am J Neuroradiol 24: (5) ((2003) ), 843–849. |
[25] | K. Kantarci et al., Longitudinal 1H MRS changes in mild cognitive impairment and Alzheimer’s disease, Neurobiol Aging 28: (9) ((2007) ), 1330–1339. doi:10.1016/j.neurobiolaging.2006.06.018. |
[26] | K. Kantarci et al., Alzheimer disease: Postmortem neuropathologic correlates of antemortem 1H MR spectroscopy metabolite measurements, Radiology 248: (1) ((2008) ), 210–220. doi:10.1148/radiol.2481071590. |
[27] | K. Kantarci et al., Magnetic resonance spectroscopy, beta-amyloid load, and cognition in a population-based sample of cognitively normal older adults, Neurology 77: (10) ((2011) ), 951–958. doi:10.1212/WNL.0b013e31822dc7e1. |
[28] | K. Kantarci, Y. Xu, M.M. Shiung, P.C. O’Brien, R.H. Cha, G.E. Smith, R.J. Ivnik, B.F. Boeve, S.D. Edland, E. Kokmen, E.G. Tangalos, R.C. Petersen and C.R. Jack Jr., Comparative diagnostic utility of different MR modalities in mild cognitive impairment and Alzheimer’s disease, Dement Geriatr Cogn Disord 14: (4) ((2002) ), 198–207. doi:10.1159/000066021. |
[29] | K.R. Krishnan et al., Randomized, placebo-controlled trial of the effects of donepezil on neuronal markers and hippocampal volumes in Alzheimer’s disease, Am J Psychiatry 160: (11) ((2003) ), 2003–2011. doi:10.1176/appi.ajp.160.11.2003. |
[30] | A. Leuzy et al., In vivo characterization of metabotropic glutamate receptor type 5 abnormalities in behavioral variant FTD, Brain Struct Funct 221: (3) ((2016) ), 1387–1402. doi:10.1007/s00429-014-0978-3. |
[31] | W. Liskowsky and R. Schliebs, Muscarinic acetylcholine receptor inhibition in transgenic Alzheimer-like Tg2576 mice by scopolamine favours the amyloidogenic route of processing of amyloid precursor protein, Int. J. Dev. Neurosci. 24: (2–3) ((2006) ), 149–156. |
[32] | S. MacKay et al., Alzheimer disease and subcortical ischemic vascular dementia: Evaluation by combining MR imaging segmentation and H-1 MR spectroscopic imaging, Radiology 198: (2) ((1996) ), 537–545. doi:10.1148/radiology.198.2.8596863. |
[33] | M. Marjańska et al., Distinctive neurochemistry in Alzheimer’s Disease via 7 T in vivo magnetic resonance spectroscopy, J Alzheimers Dis 68: (2) ((2019) ), 559–569. doi:10.3233/JAD-180861. |
[34] | B.L. Miller, A review of chemical issues in 1H NMR spectroscopy: N-acetyl-L-aspartate, creatine and choline, NMR Biomed. 4: (2) ((1991) ), 47–52. |
[35] | B.L. Miller et al., Alzheimer disease: Depiction of increased cerebral myo-inositol with proton MR spectroscopy, Radiology 187: (2) ((1993) ), 433–437. doi:10.1148/radiology.187.2.8475286. |
[36] | R.A. Moats et al., Abnormal cerebral metabolite concentrations in patients with probable Alzheimer disease, Magn Reson Med 32: (1) ((1994) ), 110–115. doi:10.1002/mrm.1910320115. |
[37] | P.J. Modrego, N. Fayed, Longitudinal magnetic resonance spectroscopy as marker of cognitive deterioration in mild cognitive impairment, Am J Alzheimers Dis Other Demen. 26: (8) ((2011) ), 631–636. doi:10.1177/1533317511433809. |
[38] | P.J. Modrego, N. Fayed and M.A. Pina, Conversion from mild cognitive impairment to probable Alzheimer’s disease predicted by brain magnetic resonance spectroscopy, Am J Psychiatry 162: (4) ((2005) ), 667–675. doi:10.1176/appi.ajp.162.4.667. |
[39] | M.E. Murray et al., Early Alzheimer’s disease neuropathology detected by proton MR spectroscopy, J Neurosci 34: (49) ((2014) ), 16247–16255. doi:10.1523/JNEUROSCI.2027-14.2014. |
[40] | N. Nunes-Tavares et al., Inhibition of choline acetyltransferase as a mechanism for cholinergic dysfunction induced by amyloid-beta peptide oligomers, J Biol Chem 287: (23) ((2012) ), 19377–19385. |
[41] | G. Oeltzschner, S. Wijtenburg, M. Mikkelsen, R.A.E. Edden, P.B. Barker, J.H. Joo and J.S. Leoutsakos, Neurometabolites and associations with cognitive deficits in mild cognitive impairment: A magnetic resonance spectroscopy study at 7 Tesla, Neurobiol Aging 73: ((2019) ), 211–218. |
[42] | A. Olmos-Alonso et al., Pharmacological targeting of CSF1R inhibits microglial proliferation and prevents the progression of Alzheimer’s-like pathology, Brain 139: (3) ((2016) ), 891–907. doi:10.1093/brain/awv379. |
[43] | L. Parnetti et al., Proton magnetic resonance spectroscopy can differentiate Alzheimer’s disease from normal aging, Mech Ageing Dev 97: (1) ((1997) ), 9–14. doi:10.1016/S0047-6374(97)01877-0. |
[44] | A.C. Paula-Lima, J. Brito-Moreira and S.T. Ferreira, Deregulation of excitatory neurotransmission underlying synapse failure in Alzheimer’s disease, J Neurochem 126: (2) ((2013) ), 191–202. doi:10.1111/jnc.12304. |
[45] | E.K. Perry, B. Tomlinson, G. Blessed, K. Bergmann, P.H. Gibson and R.H. Perry, Correlation of cholinergic abnormalities with senile plaques and mental test scores in senile dementia, Br Med J 2: (6150) ((1978) ), 1457–1459. doi:10.1136/bmj.2.6150.1457. |
[46] | A. Pfefferbaum et al., In vivo brain concentrations of N-acetyl compounds, creatine, and choline in Alzheimer disease, Arch Gen Psychiatry 56: (2) ((1999) ), 185–192. doi:10.1001/archpsyc.56.2.185. |
[47] | Z. Pfund et al., Evidence for coupling between glucose metabolism and glutamate cycling using FDG PET and 1H magnetic resonance spectroscopy in patients with epilepsy, J Cereb Blood Flow Metab 20: (5) ((2000) ), 871–878. doi:10.1097/00004647-200005000-00014. |
[48] | F. Riese et al., Posterior cingulate gamma-aminobutyric acid and glutamate/glutamine are reduced in amnestic mild cognitive impairment and are unrelated to amyloid deposition and apolipoprotein E genotype, Neurobiol Aging 36: (1) ((2015) ), 53–59. doi:10.1016/j.neurobiolaging.2014.07.030. |
[49] | B.D. Ross, S. Bluml, R. Cowan, E. Danielsen, N. Farrow and R. Gruetter, In vivo magnetic resonance spectroscopy of human brain: The biophysical basis of dementia, Biophys Chem. 68: (1–3) ((1997) ), 161–172. |
[50] | K.K.S. Sai et al., Metabolic PET imaging in oncology, AJR Am J Roentgenol 209: (2) ((2017) ), 270–276. |
[51] | S.J. Schreiner et al., Brain amyloid burden and cerebrovascular disease are synergistically associated with neurometabolism in cognitively unimpaired older adults, Neurobiol Aging 63: ((2018) ), 152–161. |
[52] | N. Schuff et al., Changes of hippocampal N-acetyl aspartate and volume in Alzheimer’s disease. A proton MR spectroscopic imaging and MRI study, Neurology 49: (6) ((1997) ), 1513–1521. |
[53] | N. Sheikh-Bahaei et al., PET-guided MR spectroscopy in Alzheimer’s disease, Ann Neurol 83: (4) ((2018) ), 771–778. doi:10.1002/ana.25202. |
[54] | N. Sheikh-Bahaei, S.A. Sajjadi, M. Mclean, J.T. O’Brein and J.H. Gillard, The effect of voxel position and tissue composition on the level of brain metabolites in PET-guided MR Spectroscopy in Alzheimer’s disease, The Western Neuroradiological Society. 2018: Dana Point. |
[55] | T.K. Shonk et al., Probable Alzheimer disease: Diagnosis with proton MR spectroscopy, Radiology 195: (1) ((1995) ), 65–72. doi:10.1148/radiology.195.1.7892497. |
[56] | A. Silveira de Souza et al., Contribution of 1H spectroscopy to a brief cognitive-functional test battery for the diagnosis of mild Alzheimer’s disease, Dement Geriatr Cogn Disord 32: (5) ((2011) ), 351–361. doi:10.1159/000334656. |
[57] | M.L. Simmons, C. Frondoza and J.T. Coyle, Immunocytochemical localization of N-acetyl-aspartate with monoclonal antibodies, Neuroscience. 45: (1) ((1991) ), 37–45. doi:10.1016/0306-4522(91)90101-S. |
[58] | D.P. Soares and M. Law, Magnetic resonance spectroscopy of the brain: Review of metabolites and clinical applications, Clin Radiol 64: (1) ((2009) ), 12–21. doi:10.1016/j.crad.2008.07.002. |
[59] | T.E. Tracy and L. Gan, Acetylated tau in Alzheimer’s disease: An instigator of synaptic dysfunction underlying memory loss: Increased levels of acetylated tau blocks the postsynaptic signaling required for plasticity and promotes memory deficits associated with tauopathy, Bioessays. 39: (4) ((2017) ). |
[60] | G. Tsai and J.T. Coyle, N-acetylaspartate in neuropsychiatric disorders, Progress in Neurobiology 46: (5) ((1995) ). doi:10.1016/0301-0082(95)00014-M. |
[61] | M.J. Valenzuela and P. Sachdev, Magnetic resonance spectroscopy in AD, Neurology 56: (5) ((2001) ), 592–598. doi:10.1212/WNL.56.5.592. |
[62] | O. Voevodskaya et al., Myo-inositol changes precede amyloid pathology and relate to APOE genotype in Alzheimer disease, Neurology 86: (19) ((2016) ), 1754–1761. doi:10.1212/WNL.0000000000002672. |
[63] | J. Walecki et al., N-acetylaspartate, choline, myoinositol, glutamine and glutamate (glx) concentration changes in proton MR spectroscopy (1H MRS) in patients with mild cognitive impairment (MCI), Med Sci Monit 17: (12) ((2011) ), 105–111. |
[64] | H.S. Walton and P.R. Dodd, Glutamate-glutamine cycling in Alzheimer’s disease, Neurochem Int 50: (7–8) ((2007) ), 1052–1066. |
[65] | R.J. Wurtman, J.K. Blusztajn and J.C. Maire, “Autocannibalism” of choline-containing membrane phospholipids in the pathogenesis of Alzheimer’s disease-A hypothesis, Neurochem Int. 7: (2) ((1985) ), 369–372. |
[66] | B. Zeydan, D. Deelchand, N. Tosakulwong et al., Decreased glutamate levels in patients with amnestic mild cognitive impairment: An sLASER proton MR spectroscopy and PiB-PET study, J Neuroimaging 27: (6) ((2017) ), 630–636. doi:10.1111/jon.12454. |
[67] | Y. Zhang and J. Shen, Regional and tissue-specific differences in brain glutamate concentration measured by in vivo single voxel MRS, J Neurosci Methods 239: ((2015) ), 94–99. |