Tumor-associated CD3- and CD8-positive immune cells in colorectal cancer: The additional prognostic value of CD8+-to-CD3+ ratio remains debatable
Abstract
BACKGROUND:
A large number of infiltrating CD3- and CD8-positive inflammatory cells indicates an improved survival in colorectal cancer (CRC), similar to many other cancers.
OBJECTIVE:
We investigated the prognostic value of different combinations of CD3- and CD8-positive immune cells in CRC patients.
METHODS:
The densities of CD3- and CD8-positive cells in intratumoral and stromal tissues were evaluated from 539 patients, for which we calculated a CD3 tumor–stroma index, a CD8 tumor–stroma index, and a CD3–CD8 tumor–stroma index.
RESULTS:
High CD3 and CD8 tumor–stroma indices associated with stage I to II disease (p < 0.001 for both). The CD3 tumor–stroma index associated with a colonic tumor location (p = 0.006), while the CD8 tumor–stroma index associated with right-sided tumors (p < 0.001) and histological grade 3 tumors (p = 0.032). High intratumoral and stromal densities for CD3- and CD8-positive immune cells, the CD3 tumor–stroma index, the CD8 tumor–stroma index, and the CD3–CD8 tumor–stroma index all indicated a better DSS.
CONCLUSIONS:
The CD3 tumor–stroma index carries a strong prognostic value in CRC, and none of the CD3 and CD8 combinations we analyzed proved superior.
1Introduction
Colorectal cancer (CRC) is the third most common malignancy globally. With an incidence of approximately 1 850 000 cases and over 800 000 reported deaths in 2018, CRC causes a considerable disease burden [1]. Disease recurrence after surgically treated CRC is clearly related to TNM stage, which primarily guides adjuvant treatment [2–5]. To more accurately predict cancer prognosis and guide adjuvant treatment, identifying new histopathological and molecular biomarkers is crucial.
In addition to the molecular properties of the tumor cells themselves, the properties of the complex tumor microenvironment strongly affect cancer progression [6]. The number of infiltrating inflammatory cells within the tumor and the surrounding stroma correlates with the cancer recurrence rate and survival, not only in CRC but in many other cancers as well (e.g., melanoma, breast, ovarian, head and neck, non-small cell lung, hepatocellular, and urothelial cancer) [7–15]. Solid tumors comprise a wide variety of different cells in the host immune system, whereby some immune cell subtypes associate with a good prognosis and others seem to impact prognosis unfavorably [8, 16].
Tumor-infiltrating cytotoxic T-lymphocytes (CTLs) with a direct capacity to destroy cancerous cells associate with a good prognosis in most cancers. The other T-cell subgroups that may produce cytokines with both immune-stimulating and suppressing activities affect prognosis in varying ways in different cancers [17]. CTLs and T-helper 1 (Th1) cells appear to indicate a good prognosis in CRC, while Th2, T regulatory (Treg), and Th17 cells seem to more variably impact outcomes [17–19].
Cell surface proteins, such as CD3 and CD8 antigens expressed by T-lymphocytes, can be utilized to immunohistochemically identify different subsets of T-lymphocytes. For instance, CD3 is expressed in all of the developmental stages of T-lymphocytes and can be found on CTLs, Treg, and Th cells, making it a highly specific pan-T-cell marker in tissue samples. Additionally, CD8 is predominantly expressed on CTLs and, thus serves as a specific marker for this subset of T-lymphocytes [17].
The densities of CD3- and CD8-positive immune cells can be calculated from the tumor area itself and from the adjacent stroma. These densities can then be combined into the Immunoscore, which served as a robust means of determining the prognosis for CRC in multiple previous studies [20–23]. However, some studies have questioned the advantage of combining the densities of CD3- and CD8-positive immune cells compared to the CD3-positive immune cell density alone [22, 24].
Various attempts have been made to combine the Immunoscore to the existing TNM classification and, thereby establish it in clinical use to predict prognosis and the response to adjuvant immunological therapies [25]. However, perhaps due to its complexity, clinical applications remain under development.
This study aimed to investigate the value of combining CD3- and CD8-positive immune cells for their prognostic evaluation in CRC patients compared to CD3-positive immune cells alone. To do so, we evaluated several combinations of CD3 and CD8 including an index that applies similar principles as those used in the original Immunoscore.
2Materials and methods
The items included in the Materials and Methods were chosen according to the STROBE statement [26].
2.1Patients
This study retrospectively examined patients surgically treated for CRC between November 1998 and December 2005 in the Department of Surgery at Helsinki University Hospital. To do so, we acquired representative tissue samples from the tissue microarray (TMA) blocks of 539 patients who underwent elective surgery for CRC with a curative intent. Patients who had been diagnosed with another malignancy or who had synchronic CRC were excluded from analysis. Cancer follow-up took place in the Department of Surgery and the Department of Oncology at Helsinki University Hospital. At the time of diagnosis, the median age of the cohort was 69 (interquartile range [IQR] 59–77). We used a cut-off age of 69 for the association analysis. Among patients, 48.2% were female. Tumors were classified by location as right-sided colon tumors (located in between the cecum and the splenic flexure), left-sided colon tumors (located from the splenic flexure to the sigmoid colon), and rectal tumors. Tumors located in the splenic flexure were excluded from the analysis of tumor side.
Clinical data (surgery date, patient age, gender, stage, grade, tumor location, and other relevant information) were acquired from patient records. The survival data were retrieved from the Finnish Digital and Population Data Services Agency and Statistics Finland.
Ethical approval for this study was obtained from the Surgical Ethics Committee of Helsinki University Hospital (Dnro HUS 226/E6/ 06, extension TMK02 §66 17.4.2013). The National Supervisory Authority of Health and Welfare (Valvira Dnro 10041/06.01.03.01/2012) granted us permission to study the archived tissue samples without requiring individual patient consent.
2.2Construction of TMA blocks and immunohistochemistry
We retrieved CRC samples from the archives of the Department of Pathology at Helsinki University Hospital. An experienced pathologist marked representative areas of the tumor core on hematoxylin–eosin stained slides. All samples were acquired from the primary tumor. An automatic TMA instrument (TMA Grand Master 3D, Histech Ltd, Budapest, Hungary) was used to punch out two 1-mm diameter cylinders from the selected areas of the 539 tumor blocks, which were formalin-fixed paraffin-embedded tumor samples. The punched cylinders were subsequently embedded into new TMA paraffin blocks, each containing a maximum of 56 cylinders. TMA blocks were cut into 4-μm-thick sections for immunohistochemical staining. Two tumor spots from each patient were used for the evaluation of stainings.
The sections were fixed on slides and dried for 12 to 24 h at +37°C, followed by immunohistochemical staining using an automatic Roche Ventana BenchMark ULTRA (F. Hoffman-La-Roche AG, Basel, Switzerland). The slides were pre-processed for 64 min using a Ventana Cell Conditioning Solution (CC1) and incubated for 40 min in either ready-to-use rabbit monoclonal CD3 (Ventana, clone 2GV6) or 1:50 diluted mouse monoclonal CD8 (Novocastra, clone 4B11) antibodies. The Ventana Ultraview DAB detection kit was used for the subsequent detection and visualization of the antibodies. Finally, the slides were counterstained with Meyer’s hematoxylin and washed in tap water.
2.3Evaluation of immunohistochemistry
The immunohistochemical tumor stainings were individually visually assessed by two researchers (JK and JH), one of whom is an experienced pathologist. Disagreements regarding sample scores were discussed until consensus was reached. All assessments were completed without knowledge of the clinical data or patient outcomes.
Each TMA spot was taken from an area where both the tumor epithelium and surrounding stroma were present. The CD3 and CD8 densities were assessed separately for the intratumoral (i.e., tumor epithelium) and stromal areas. For the evaluation of intratumoral CD3 (CD3T) and CD8 (CD8T) densities, we assessed the densities of both immune cell subgroups among the tumor epithelial cells. Similarly, for the evaluation of stromal CD3 (CD3S) and CD8 (CD8S) densities, the densities of both immune cell subgroups were assessed among the tumor surrounding the stromal cells. CD3T density was assessed for 516 patients and the CD8T density for 515 patients. CD3S and CD8S densities were assessed for 515 patients. Samples not containing the tumor epithelium were excluded from analysis.
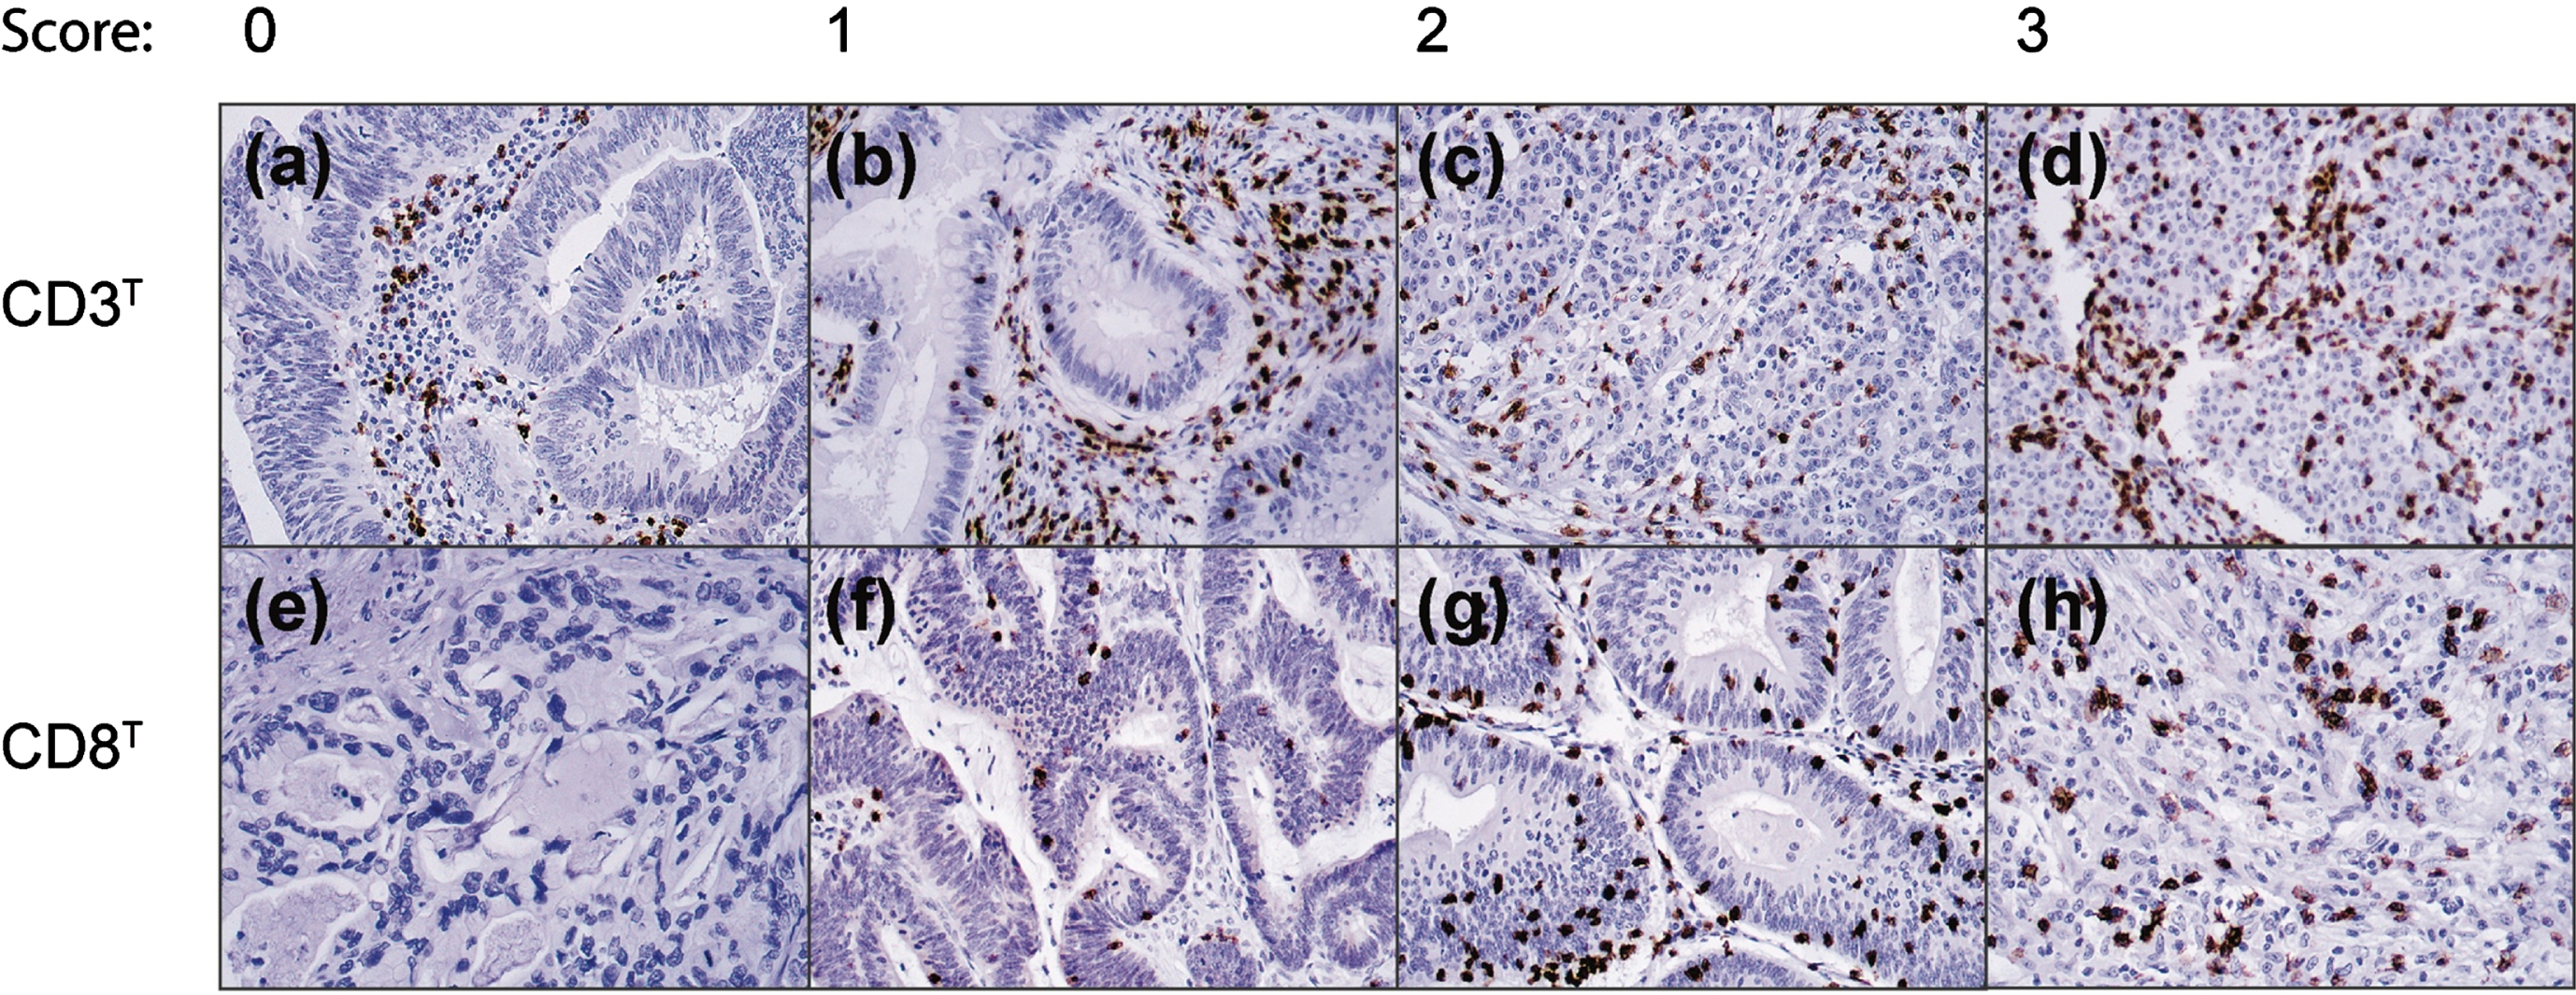
The CD3T and CD8T densities were assigned one of four scores: 0 (no positive cells), 1 (a few scattered individual positive cells), 2 (small positive cell clusters with approximately 5% of all cells staining positively), and 3 (more abundant and organized staining with more than approximately 10% of all cells staining positively).
CD3S and CD8S were assigned one of five scores: 0 (no positive cells), 1 (a few sparsely scattered individual positive cells), 2 (scattered individual positive cells and small cell clusters with approximately 5% of all cells staining positively), 3 (medium clusters of positive cells with approximately 10% of all cells staining positively), and 4 (abundant staining across the sample with more than 20% of all cells staining positively).
2.4Statistical analysis
All statistical analyses were performed using IBM SPSS Statistics for Mac version 27 (IBM SPSS Statistics, version 27, SPSS, Inc., Chicago, IL, USA, an IBM Company). The Pearson’s chi square and Kendall’s rank correlation tests were used to evaluate the associations and correlations. The survival curves were constructed using the Kaplan–Meier method and compared using the log-rank test. The disease-specific survival (DSS) was calculated from the date of the surgery until death from CRC or until the end of the follow-up period. Patients who perished within 30 days after surgery and patients who died of reasons other than CRC were censored in the survival analysis. For the subgroup and multivariate analyses, we applied the Cox proportional hazards model to calculate the hazard ratios (HRs). In the multivariate analysis, we included age, gender, stage, grade, tumor location, and the CD3, CD8, and CD3–CD8 tumor–stroma indices in our model. Stage and grade were processed as categorical covariates. The assumption of constant hazards was satisfied, and we identified no significant interaction terms between the variables. For all analyses, we considered a two-tailed p < 0.05 as statistically significant.
3Results
Representative immunohistochemical images of the four scoring categories for the CD3T and CD8T densities appear in Fig. 1. For the final statistical analysis, the CD3T and CD8T densities were grouped as ‘negative’ (score 0), ‘intermediate’ (score 1), and ‘high’ (scores 3–4). In addition, the CD3S and CD8S densities were grouped as ‘negative’ (scores 0–1), ‘intermediate’ (scores 2–3), and ‘high’ (score 4). Supplementary Table 1 summarizes the distribution of the CD3 and CD8 densities.
Fig. 1
Representative images of CD3 and CD8 immunostaining densities and the initial scores among CRC patients in the intratumoral area. Original magnification: 20x.
3.1Associations between the CD3 and CD8 densities and clinicopathological variables
Table 1 summarizes the associations between the clinicopathological variables with the CD3T and CD8T densities, while Table 2 presents the associations with CD3S and CD8S. CD3T and CD8T negativity associated with advanced stage III to IV disease (p < 0.001 for both CD3 and CD8; Table 1) and tumors located in the left colon and rectum (p = 0.019 for CD3 and p < 0.001 for CD8; Table 1). High CD3S and CD8S densities associated with stage I to II disease (p < 0.001 for CD3 and p = 0.030 for CD8; Table 2). However, CD3S negativity associated with a rectal tumor location (p < 0.001; Table 2). In addition, CD8S negativity associated with left colonic and rectal tumor locations (p < 0.001; Table 2) and a younger age (p = 0.025; Table 2).
Table 1
Associations between the CD3T and CD8T immune cell density and clinicopathological variables among 539 colorectal cancer patients
| CD3T density | CD8T density | |||||||
| Clinicopathological | Negative | Intermediate | High | p value1 | Negative | Intermediate | High | p value1 |
| variable | n (%) | n (%) | n (%) | n (%) | n (%) | n (%) | ||
| Age, in years | ||||||||
| < 69 | 85 (36.3) | 102 (43.6) | 47 (20.1) | 0.616 | 100 (43.7) | 59 (25.3) | 75 (32.1) | 0.332 |
| ≥69 | 85 (32.2) | 121 (45.8) | 58 (22.0) | 96 (36.4) | 77 (29.2) | 91 (34.5) | ||
| Gender | ||||||||
| Female | 76 (31.5) | 108 (44.8) | 57 (23.7) | 0.263 | 93 (38.6) | 62 (25.7) | 86 (35.7) | 0.492 |
| Male | 96 (37.1) | 115 (44.4) | 48 (18.5) | 104 (40.2) | 75 (29.0) | 80 (30.9) | ||
| Stage (I– IV) | ||||||||
| I | 18 (19.1) | 41 (43.6) | 35 (37.2) | < 0.001 | 17 (18.1) | 27 (28.7) | 50 (53.2) | < 0.001 |
| II | 39 (25.7) | 78 (51.3) | 35 (23.0) | 56 (36.8) | 43 (28.3) | 53 (34.9) | ||
| III | 73 (41.2) | 78 (44.1) | 26 (14.7) | 85 (48.0) | 43 (24.3) | 49 (27.7) | ||
| IV | 39 (53.4) | 25 (34.2) | 9 (12.3) | 38 (52.1) | 21 (28.8) | 14 (19.2) | ||
| Grade (WHO) | ||||||||
| 1 | 9 (23.1) | 20 (51.3) | 10 (25.6) | 0.073 | 17 (43.6) | 11 (28.2) | 11 (28.2) | 0.612 |
| 2 | 122 (34.1) | 167 (46.6) | 69 (19.3) | 146 (40.8) | 96 (26.8) | 116 (32.4) | ||
| 3 | 13 (44.8) | 7 (24.1) | 9 (31.0) | 7 (24.1) | 8 (27.6) | 14 (48.3) | ||
| 4 | 7 (25.0) | 11 (39.3) | 10 (35.7) | 11 (39.3) | 7 (25.0) | 10 (35.7) | ||
| Tumor location | ||||||||
| Right colon | 39 (27.1) | 64 (44.4) | 41 (28.5) | 0.019 | 41 (28.1) | 36 (24.7) | 69 (47.3) | < 0.001 |
| Left colon | 45 (36.6) | 51 (41.5) | 27 (22.0) | 53 (42.7) | 31 (25.0) | 40 (32.3) | ||
| Rectum | 96 (38.7) | 114 (46.0) | 38 (15.3) | 110 (45.1) | 73 (29.9) | 61 (25.0) | ||
Abbreviations: CD3T, intratumoral CD3; CD8T, intratumoral CD8. 1Pearson’s chi-square test.
Table 2
Associations between CD3S and CD8S immune cell density and clinicopathological variables among 539 colorectal cancer patients
| CD3S density | CD8S density | |||||||
| Clinicopathological | Negative | Intermediate | High | p value1 | Negative | Intermediate | High | p value1 |
| variable | n (%) | n (%) | n (%) | n (%) | n (%) | n (%) | ||
| Age, in years | ||||||||
| < 69 | 40 (16.3) | 147 (59.8) | 59 (24.0) | 0.502 | 74 (30.6) | 125 (51.7) | 43 (17.8) | 0.025 |
| ≥69 | 36 (13.3) | 174 (64.4) | 60 (22.2) | 57 (20.8) | 152 (55.5) | 65 (23.7) | ||
| Gender | ||||||||
| Female | 36 (14.5) | 150 (60.5) | 62 (25.0) | 0.638 | 59 (23.7) | 128 (51.4) | 62 (24.9) | 0.091 |
| Male | 41 (15.2) | 171 (63.3) | 58 (21.5) | 72 (26.8) | 151 (56.1) | 46 (17.1) | ||
| Stage (I– IV) | ||||||||
| I | 4 (4.0) | 58 (58.6) | 37 (37.4) | < 0.001 | 13 (13.3) | 58 (59.2) | 27 (27.6) | 0.030 |
| II | 21 (13.5) | 94 (60.6) | 40 (25.8) | 38 (24.7) | 84 (54.5) | 32 (20.8) | ||
| III | 32 (17.7) | 119 (65.7) | 30 (16.6) | 59 (32.2) | 90 (49.2) | 34 (18.6) | ||
| IV | 19 (24.1) | 49 (62.0) | 11 (13.9) | 20 (25.3) | 46 (58.2) | 13 (16.5) | ||
| Grade (WHO) | ||||||||
| 1 | 2 (4.9) | 25 (61.0) | 14 (34.1) | 0.370 | 11 (26.8) | 22 (53.7) | 8 (19.5) | 0.174 |
| 2 | 61 (16.5) | 223 (60.3) | 86 (23.2) | 97 (26.3) | 200 (54.2) | 72 (19.5) | ||
| 3 | 4 (13.8) | 20 (69.0) | 5 (17.2) | 6 (20.0) | 12 (40.0) | 12 (40.0) | ||
| 4 | 4 (13.3) | 20 (66.7) | 6 (20.0) | 8 (27.6) | 12 (41.4) | 9 (31.0) | ||
| Tumor location | ||||||||
| Right colon | 12 (8.3) | 87 (60.0) | 46 (31.7) | < 0.001 | 20 (13.6) | 69 (46.9) | 58 (39.5) | < 0.001 |
| Left colon | 13 (10.6) | 80 (65.0) | 30 (24.4) | 37 (29.8) | 68 (54.8) | 19 (15.3) | ||
| Rectum | 51 (20.5) | 154 (61.8) | 44 (17.7) | 74 (30.1) | 141 (57.3) | 31 (12.6) | ||
Abbreviations: CD3S, stromal CD3; CD8S, stromal CD8. 1Pearson’s chi-square test.
High densities of CD3T, CD8T, CD3S, and CD8S all positively correlated with each other (p < 0.001 for all; τb ranging from 0.34 to 0.50; Supplementary Table 2).
3.2CD3 and CD8 densities and survival
Patients with higher CD3T, CD8T, CD3S, and CD8S densities all exhibited a significantly better DSS (Fig. 2). Among patients with a high CD3T density, the 5-year DSS was 85.7% (95% confidence interval [CI] 78.4% –92.6%), falling to 75.6% (95% CI 59.5% –81.7%) for those with an intermediate CD3T density and 52.9% (95% CI 45.3% –60.5%; p < 0.001; Fig. 2A) for CD3T immunonegative patients. Patients who were CD3S immunonegative exhibited a significantly worse DSS (HR 3.57; 95% CI 2.09–6.10; p < 0.001; Fig. 2B).
Fig. 2
Disease-specific survival of CRC patients according to the immunopositivity of (A) CD3T immune cells, (B) CD3S immune cells, (C) CD8T immune cells, and (D) CD8S immune cells. Survival curves were drawn using the Kaplan–Meier method, with p values based on the log-rank test. Patients who perished within 30 days after surgery were excluded from the analysis.
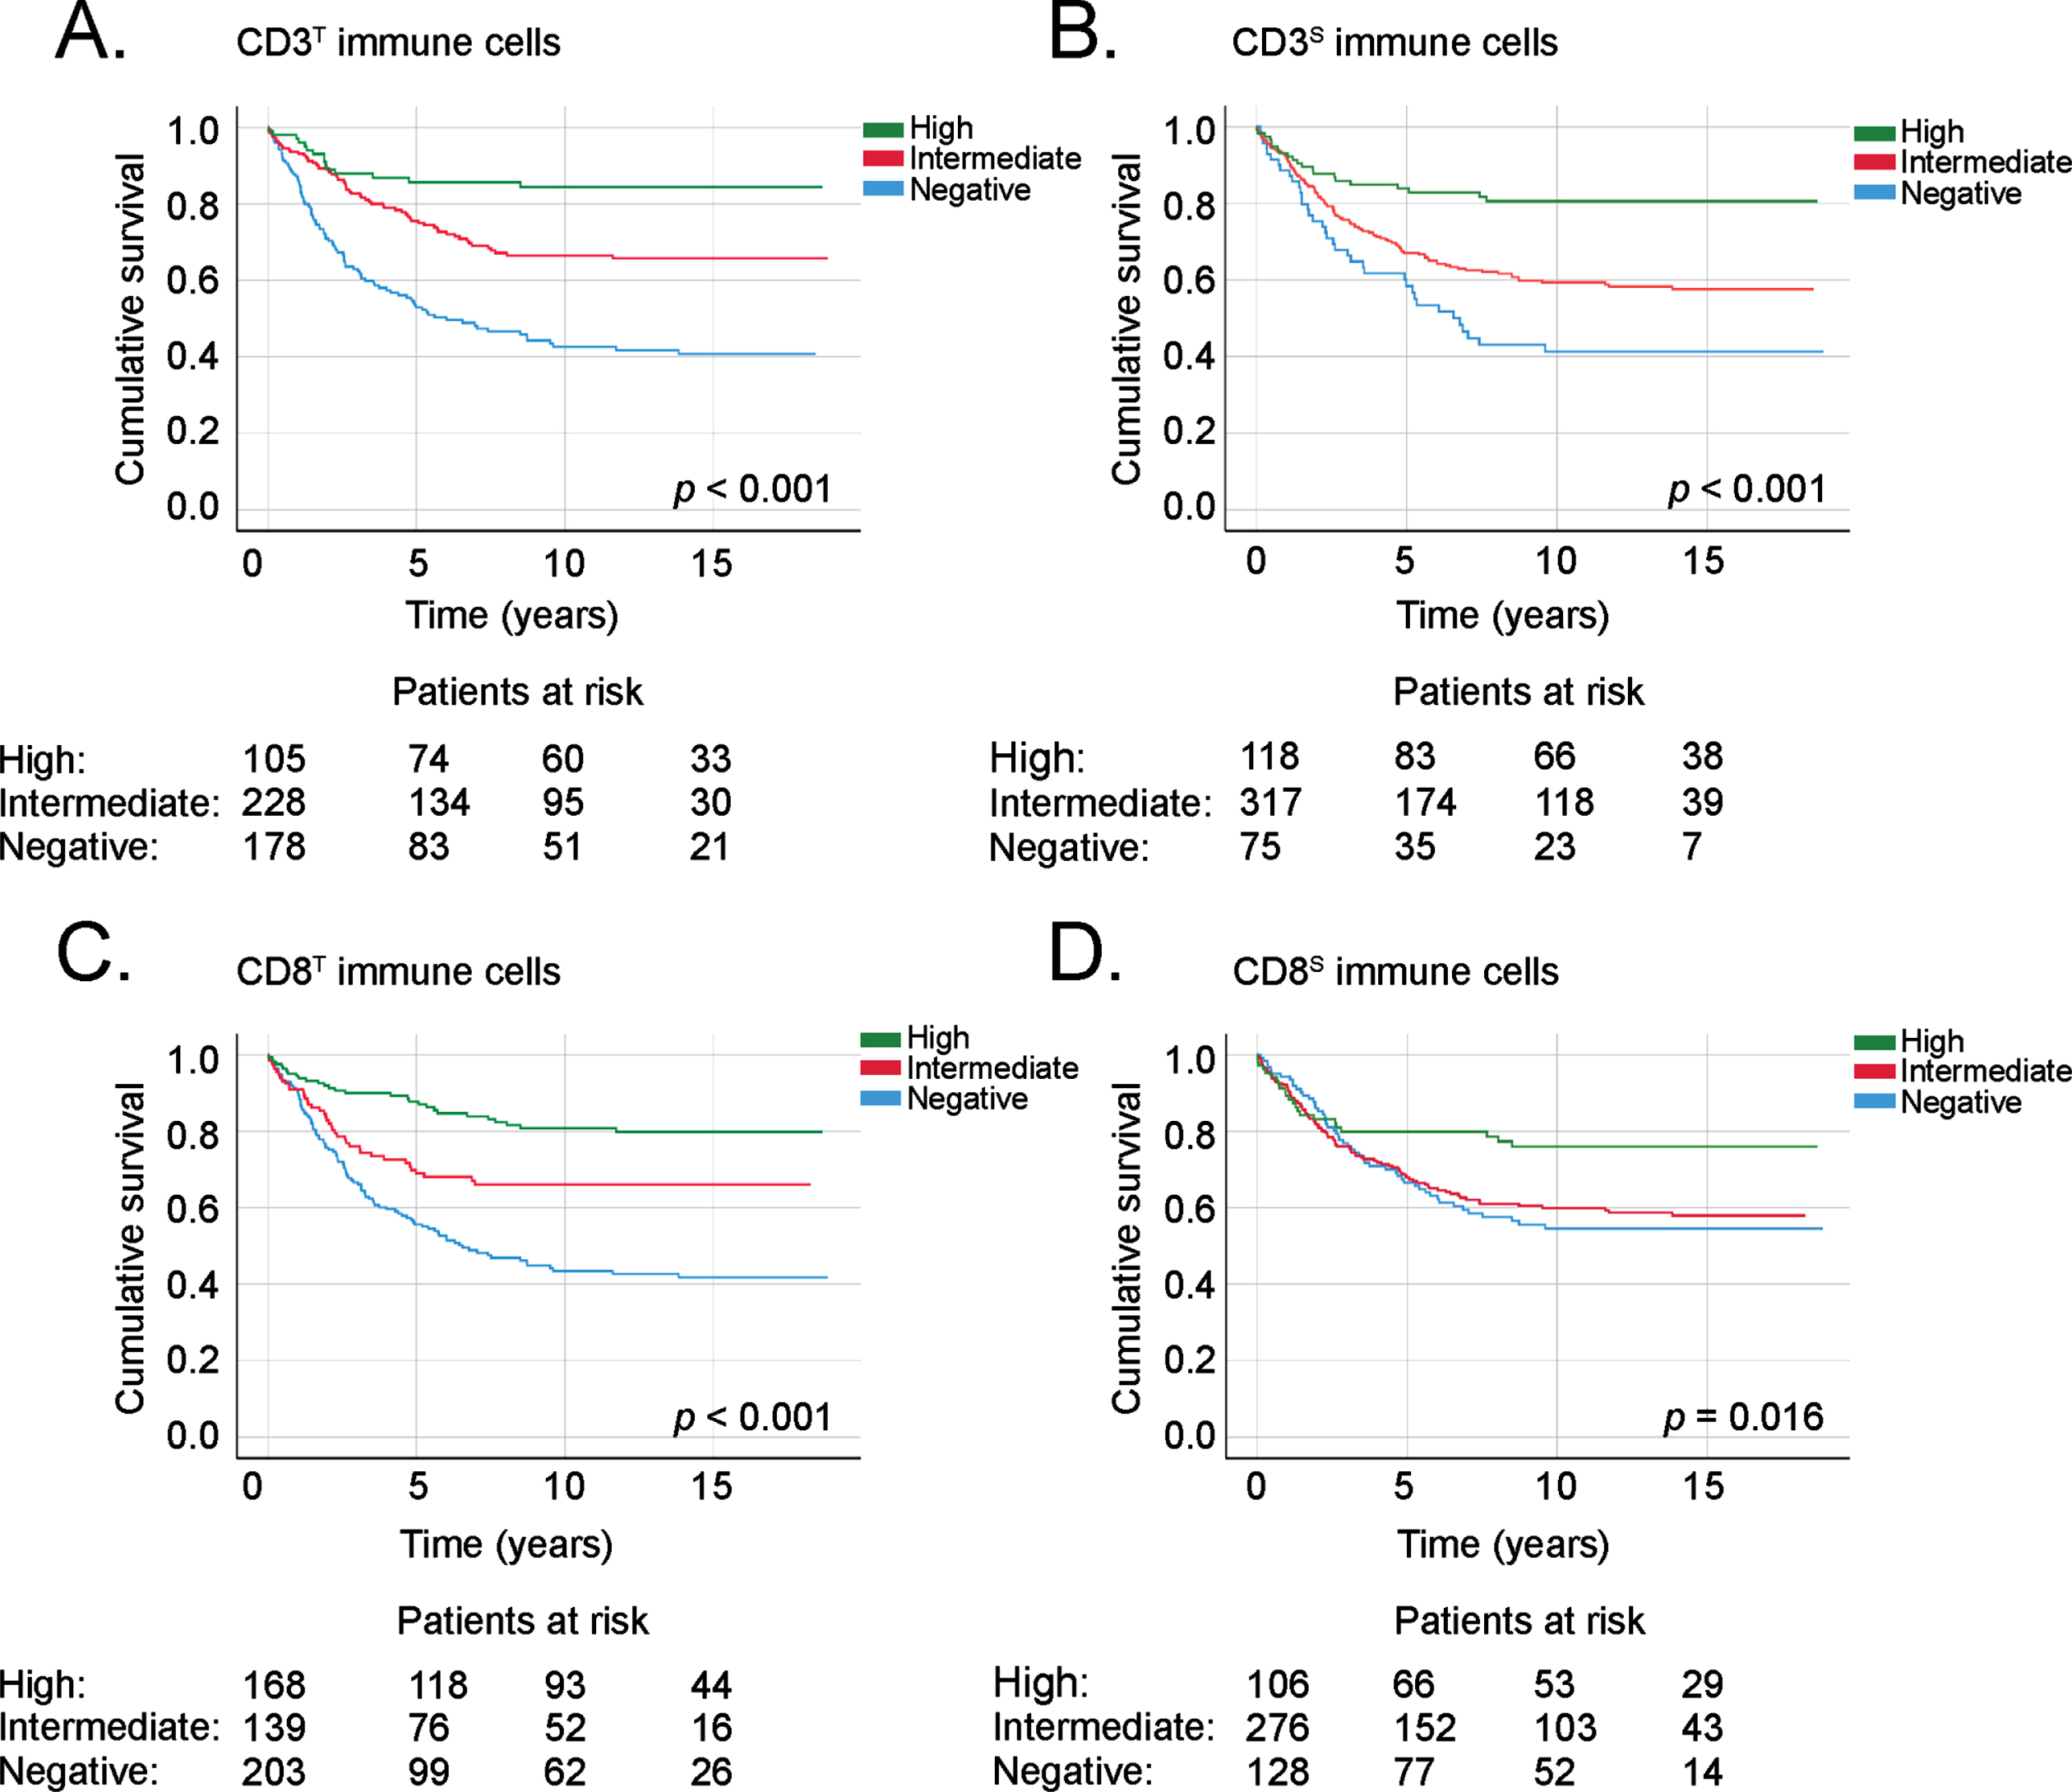
Among patients with a high CD8T density, the 5-year DSS reached 87.8% (95% CI 82.7% –92.9%), falling to 69.0% (95% CI 60.8% –77.2%) in patients with an intermediate CD8T density and 55.7% (95% CI 48.6% –62.8%; p < 0.001; Fig. 2C) among patients with a negative CD8T density. CD8S immunonegative patients showed a significantly worse DSS (HR 1.87; 95% CI 1.14–3.05; p = 0.030; Fig. 2B).
3.3CD3 and CD8 tumor–stroma indices
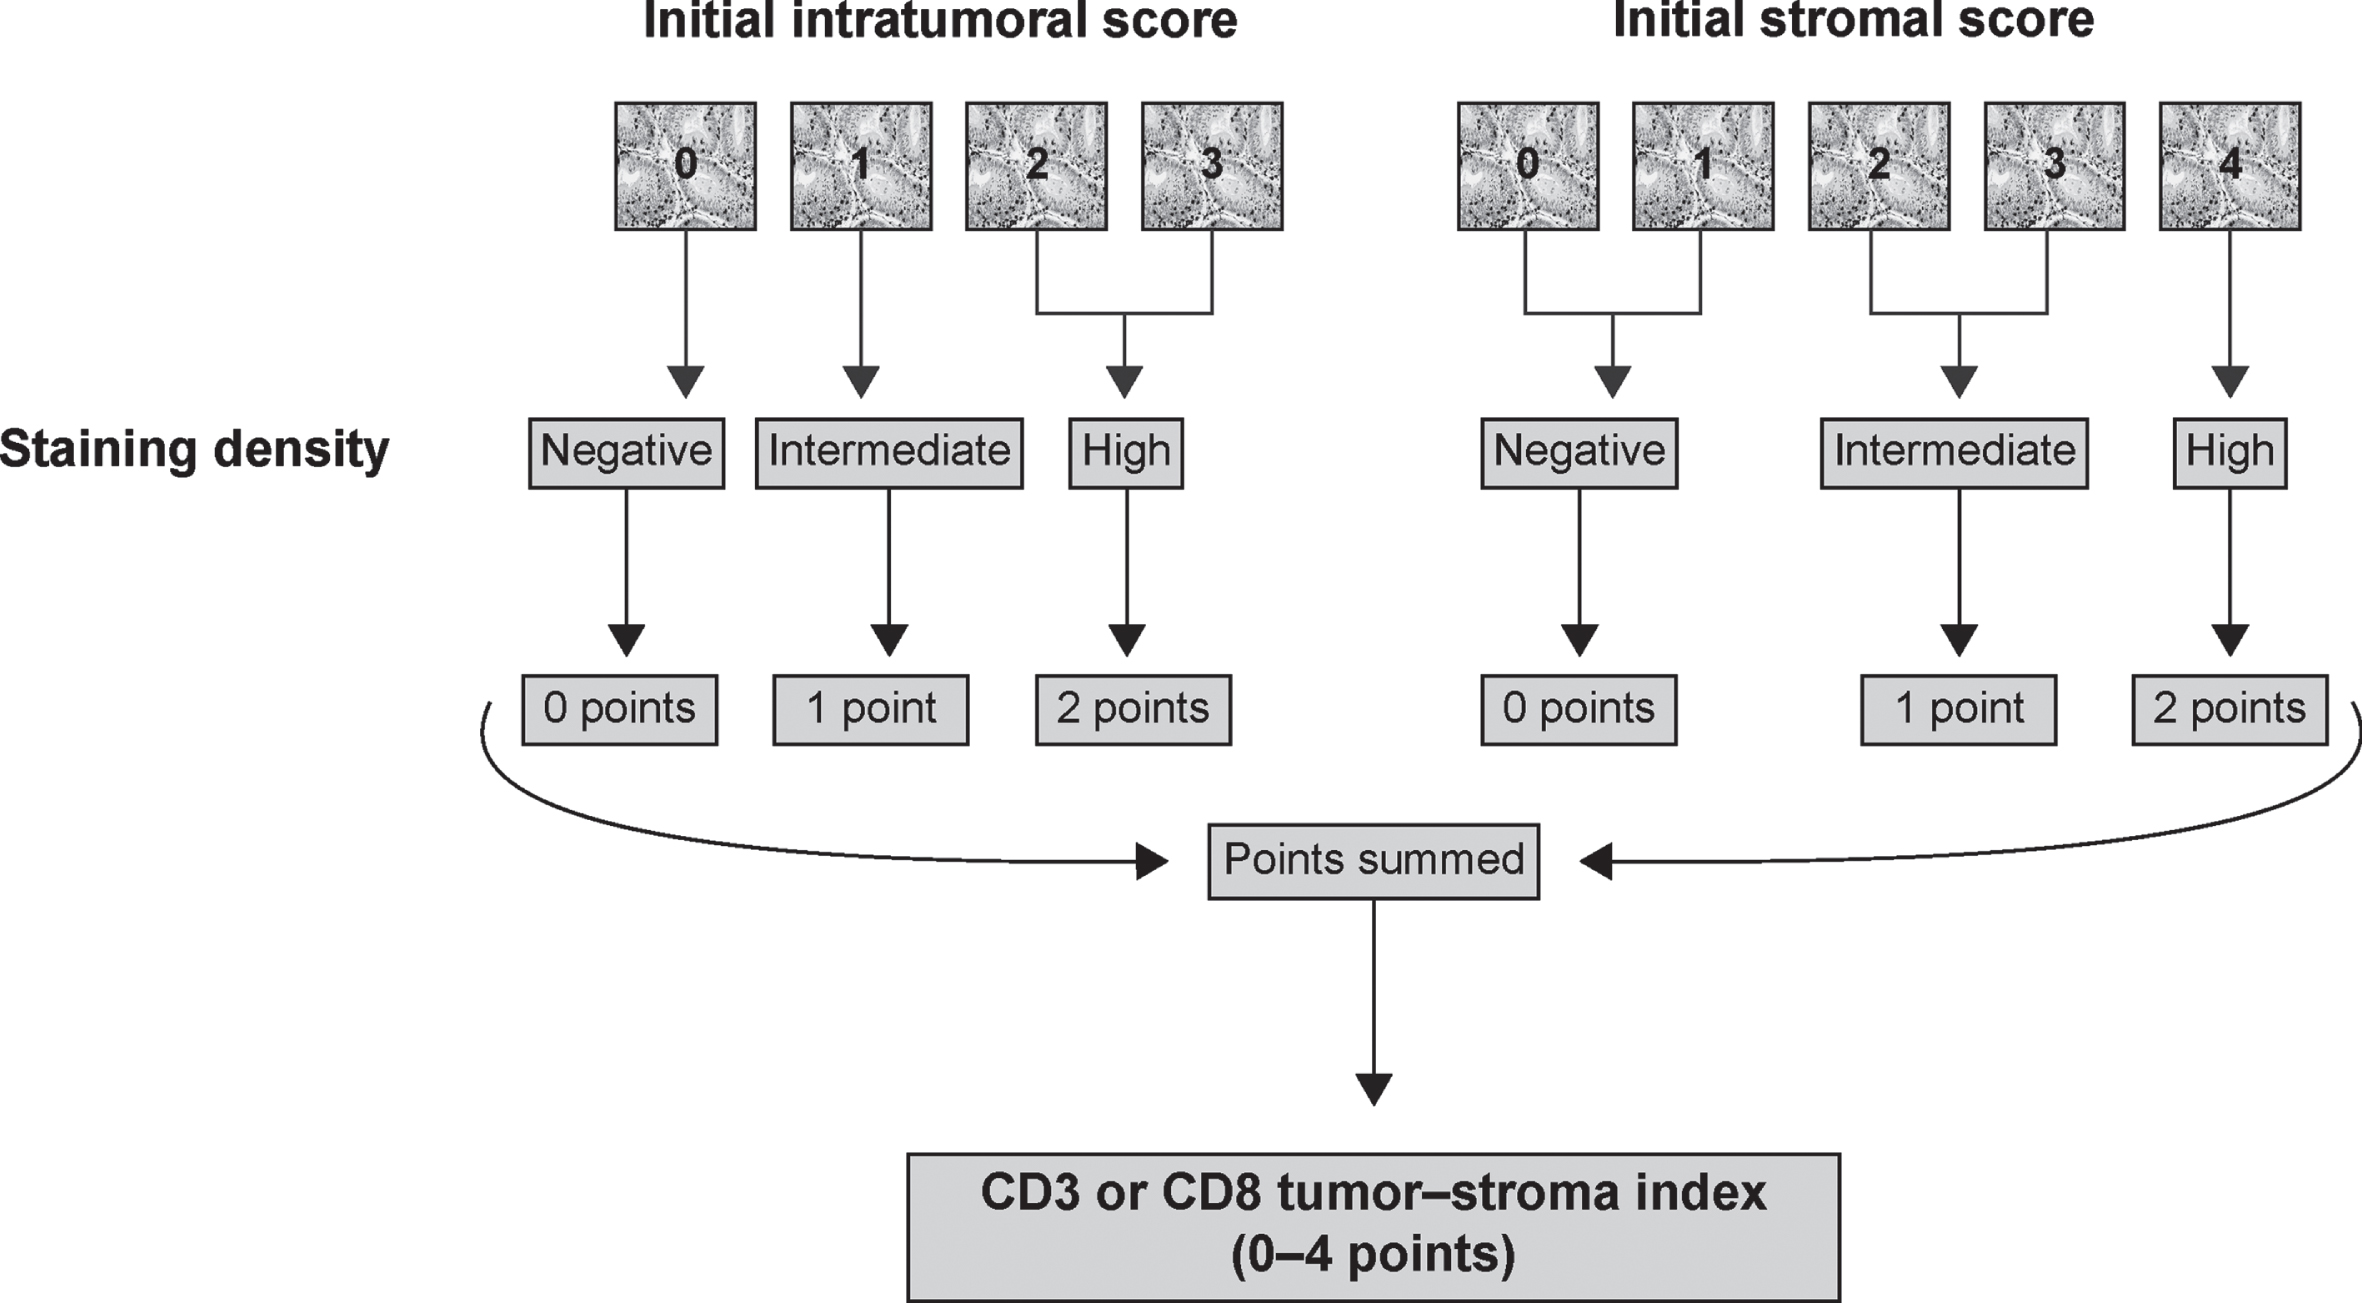
We used CD3T, CD8T, CD3S, and CD8S to determine an index for CD3 and CD8 that takes into account the immune cell densities in both the intratumoral and stromal areas. Points from 0 to 2 were applied to the densities of immune cells in both areas. A 0 was given for negative immunostaining, 1 for intermediate, and 2 for a high density. Subsequently, the points from each area of the tumor were summed, resulting in a 0–4-point tumor–stroma index for CD3 and CD8, respectively. Figure 3 summarizes the construction of the CD3 and CD8 tumor–stroma indices.
Fig. 3
Flowchart of the construction of the CD3 or CD8 tumor–stroma indexes from the initial CD3 or CD8 scores.
In addition to the CD3 and CD8 tumor–stroma indices, we constructed a combined CD3–CD8 tumor–stroma index resembling the previously published Immunoscore. Points from 0 to 1 were applied for immune cell densities in both areas. In CD3T and CD8T, a 0 was given for negative immunostaining. One point (1 p) was given for intermediate and high density. In CD3S and CD8S, zero points were given for negative and intermediate densities and one point (1 p) for a high density. The points for CD3T, CD8T, CD3S and CD8S were summed up, resulting in a 0–4-point CD3–CD8 tumor-stroma index. Supplementary Figure 1 summarizes the construction of the CD3–CD8 tumor–stroma index. We tested other cut-offs to dichotomize the CD3 and CD8 scorings and determined the CD3–CD8 tumor–stroma index based on these dichotomizations. The above-described dichotomizations resulted in the best results in the survival analysis.
Furthermore, we summed the CD3 and CD8 tumor–stroma indexes to establish an 8-point maximum CD3–CD8 tumor–stroma index.
In the subgroup analysis and multivariable models, we combined the 0- and 1-point groups and the 2- and 3-point groups for the 4-point maximum indices. The 4-point group with the best prognosis served as the reference group in all of the models.
3.4Associations between CD3 and CD8 tumor–stroma indices and clinicopathological variables
A high CD3 tumor–stroma index (3–4 points) associated with stage I to II disease (p < 0.001; Table 3) and a colonic tumor location (p = 0.006; Table 3). A high CD8 tumor–stroma index (3–4 points) associated with stage I to II disease (p < 0.001; Table 4), histological grade 3 (p = 0.032; Table 4), and a right-sided tumor location (p < 0.001; Table 4).
Table 3
Associations between the CD3 tumor– stroma index and clinicopathological variables among 539 colorectal cancer patients
| CD3 tumor– stroma index | ||||||
| Clinicopathological | 0 p. | 1 p. | 2 p. | 3 p. | 4 p. | p value1 |
| variable | n (%) | n (%) | n (%) | n (%) | n (%) | |
| Age, in years | ||||||
| < 69 | 33 (13.4) | 59 (24.0) | 78 (31.7) | 49 (19.9) | 27 (11.0) | 0.086 |
| ≥69 | 19 (7.0) | 80 (29.6) | 83 (30.7) | 64 (23.7) | 24 (8.9) | |
| Gender | ||||||
| Female | 25 (10.1) | 61 (24.6) | 75 (30.2) | 60 (24.2) | 27 (10.9) | 0.581 |
| Male | 28 (10.4) | 78 (28.9) | 87 (32.2) | 53 (19.6) | 24 (8.9) | |
| Stage (I– IV) | ||||||
| I | 3 (3.0) | 13 (13.1) | 34 (34.3) | 29 (29.3) | 20 (20.2) | < 0.001 |
| II | 12 (7.7) | 36 (23.2) | 51 (32.9) | 38 (24.5) | 18 (11.6) | |
| III | 23 (12.7) | 55 (30.4) | 59 (32.6) | 35 (19.3) | 9 (5.0) | |
| IV | 14 (17.7) | 34 (43.0) | 17 (21.5) | 10 (12.7) | 4 (5.1) | |
| Grade (WHO) | ||||||
| 1 | 0 (0.0) | 10 (24.4) | 14 (34.1) | 12 (29.3) | 5 (12.2) | 0.275 |
| 2 | 41 (11.1) | 97 (26.2) | 122 (33.0) | 73 (19.7) | 37 (10.0) | |
| 3 | 4 (13.8) | 9 (31.0) | 5 (17.2) | 8 (27.6) | 3 (10.3) | |
| 4 | 2 (6.7) | 8 (26.7) | 6 (20.0) | 11 (36.7) | 3 (10.0) | |
| Tumor location | ||||||
| Right colon | 7 (4.8) | 30 (20.7) | 45 (31.0) | 45 (31.0) | 18 (12.4) | 0.006 |
| Left colon | 11 (8.9) | 33 (26.8) | 39 (31.7) | 26 (21.1) | 14 (11.4) | |
| Rectum | 34 (13.7) | 76 (30.5) | 78 (31.3) | 42 (16.9) | 19 (7.6) | |
Abbreviations: p., index points. 1Pearson’s chi-square test.
Table 4
Associations between the CD8 tumor– stroma index and clinicopathological variables among 539 colorectal cancer patients
| CD8 tumor– stroma index | ||||||
| Clinicopathological | 0 p. | 1 p. | 2 p. | 3 p. | 4 p. | p value1 |
| variable | n (%) | n (%) | n (%) | n (%) | n (%) | |
| Age, in years | ||||||
| < 69 | 54 (22.3) | 57 (23.6) | 53 (21.9) | 49 (20.2) | 29 (12.0) | 0.206 |
| ≥69 | 41 (15.0) | 65 (23.7) | 59 (21.5) | 71 (25.9) | 38 (13.9) | |
| Gender | ||||||
| Female | 42 (16.9) | 58 (23.3) | 54 (21.7) | 56 (22.5) | 39 (15.7) | 0.504 |
| Male | 53 (19.7) | 65 (24.2) | 59 (21.9) | 64 (23.8) | 28 (10.4) | |
| Stage (I– IV) | ||||||
| I | 8 (8.2) | 16 (16.3) | 21 (21.4) | 29 (29.6) | 24 (24.5) | < 0.001 |
| II | 24 (15.6) | 38 (24.7) | 33 (21.4) | 41 (26.6) | 18 (11.7) | |
| III | 48 (26.2) | 43 (23.5) | 36 (19.7) | 34 (18.6) | 22 (12.0) | |
| IV | 15 (19.0) | 25 (31.6) | 21 (26.6) | 15 (19.0) | 3 (3.8) | |
| Grade (WHO) | ||||||
| 1 | 9 (22.0) | 11 (26.8) | 6 (14.6) | 12 (29.3) | 3 (7.3) | 0.032 |
| 2 | 72 (19.5) | 85 (23.0) | 84 (22.8) | 86 (23.3) | 42 (11.4) | |
| 3 | 3 (10.0) | 5 (16.7) | 7 (23.3) | 5 (16.7) | 10 (33.3) | |
| 4 | 6 (20.7) | 7 (24.1) | 5 (17.2) | 3 (10.3) | 8 (27.6) | |
| Tumor location | ||||||
| Right colon | 10 (6.8) | 29 (19.7) | 29 (19.7) | 42 (28.6) | 37 (25.2) | < 0.001 |
| Left colon | 27 (21.8) | 32 (25.8) | 23 (18.5) | 29 (23.4) | 13 (10.5) | |
| Rectum | 58 (23.6) | 61 (24.8) | 61 (24.8) | 49 (19.9) | 17 (6.9) | |
Abbreviations: p., index points. 1Pearson’s chi-square test.
3.5CD3 and CD8 tumor–stroma indices and survival
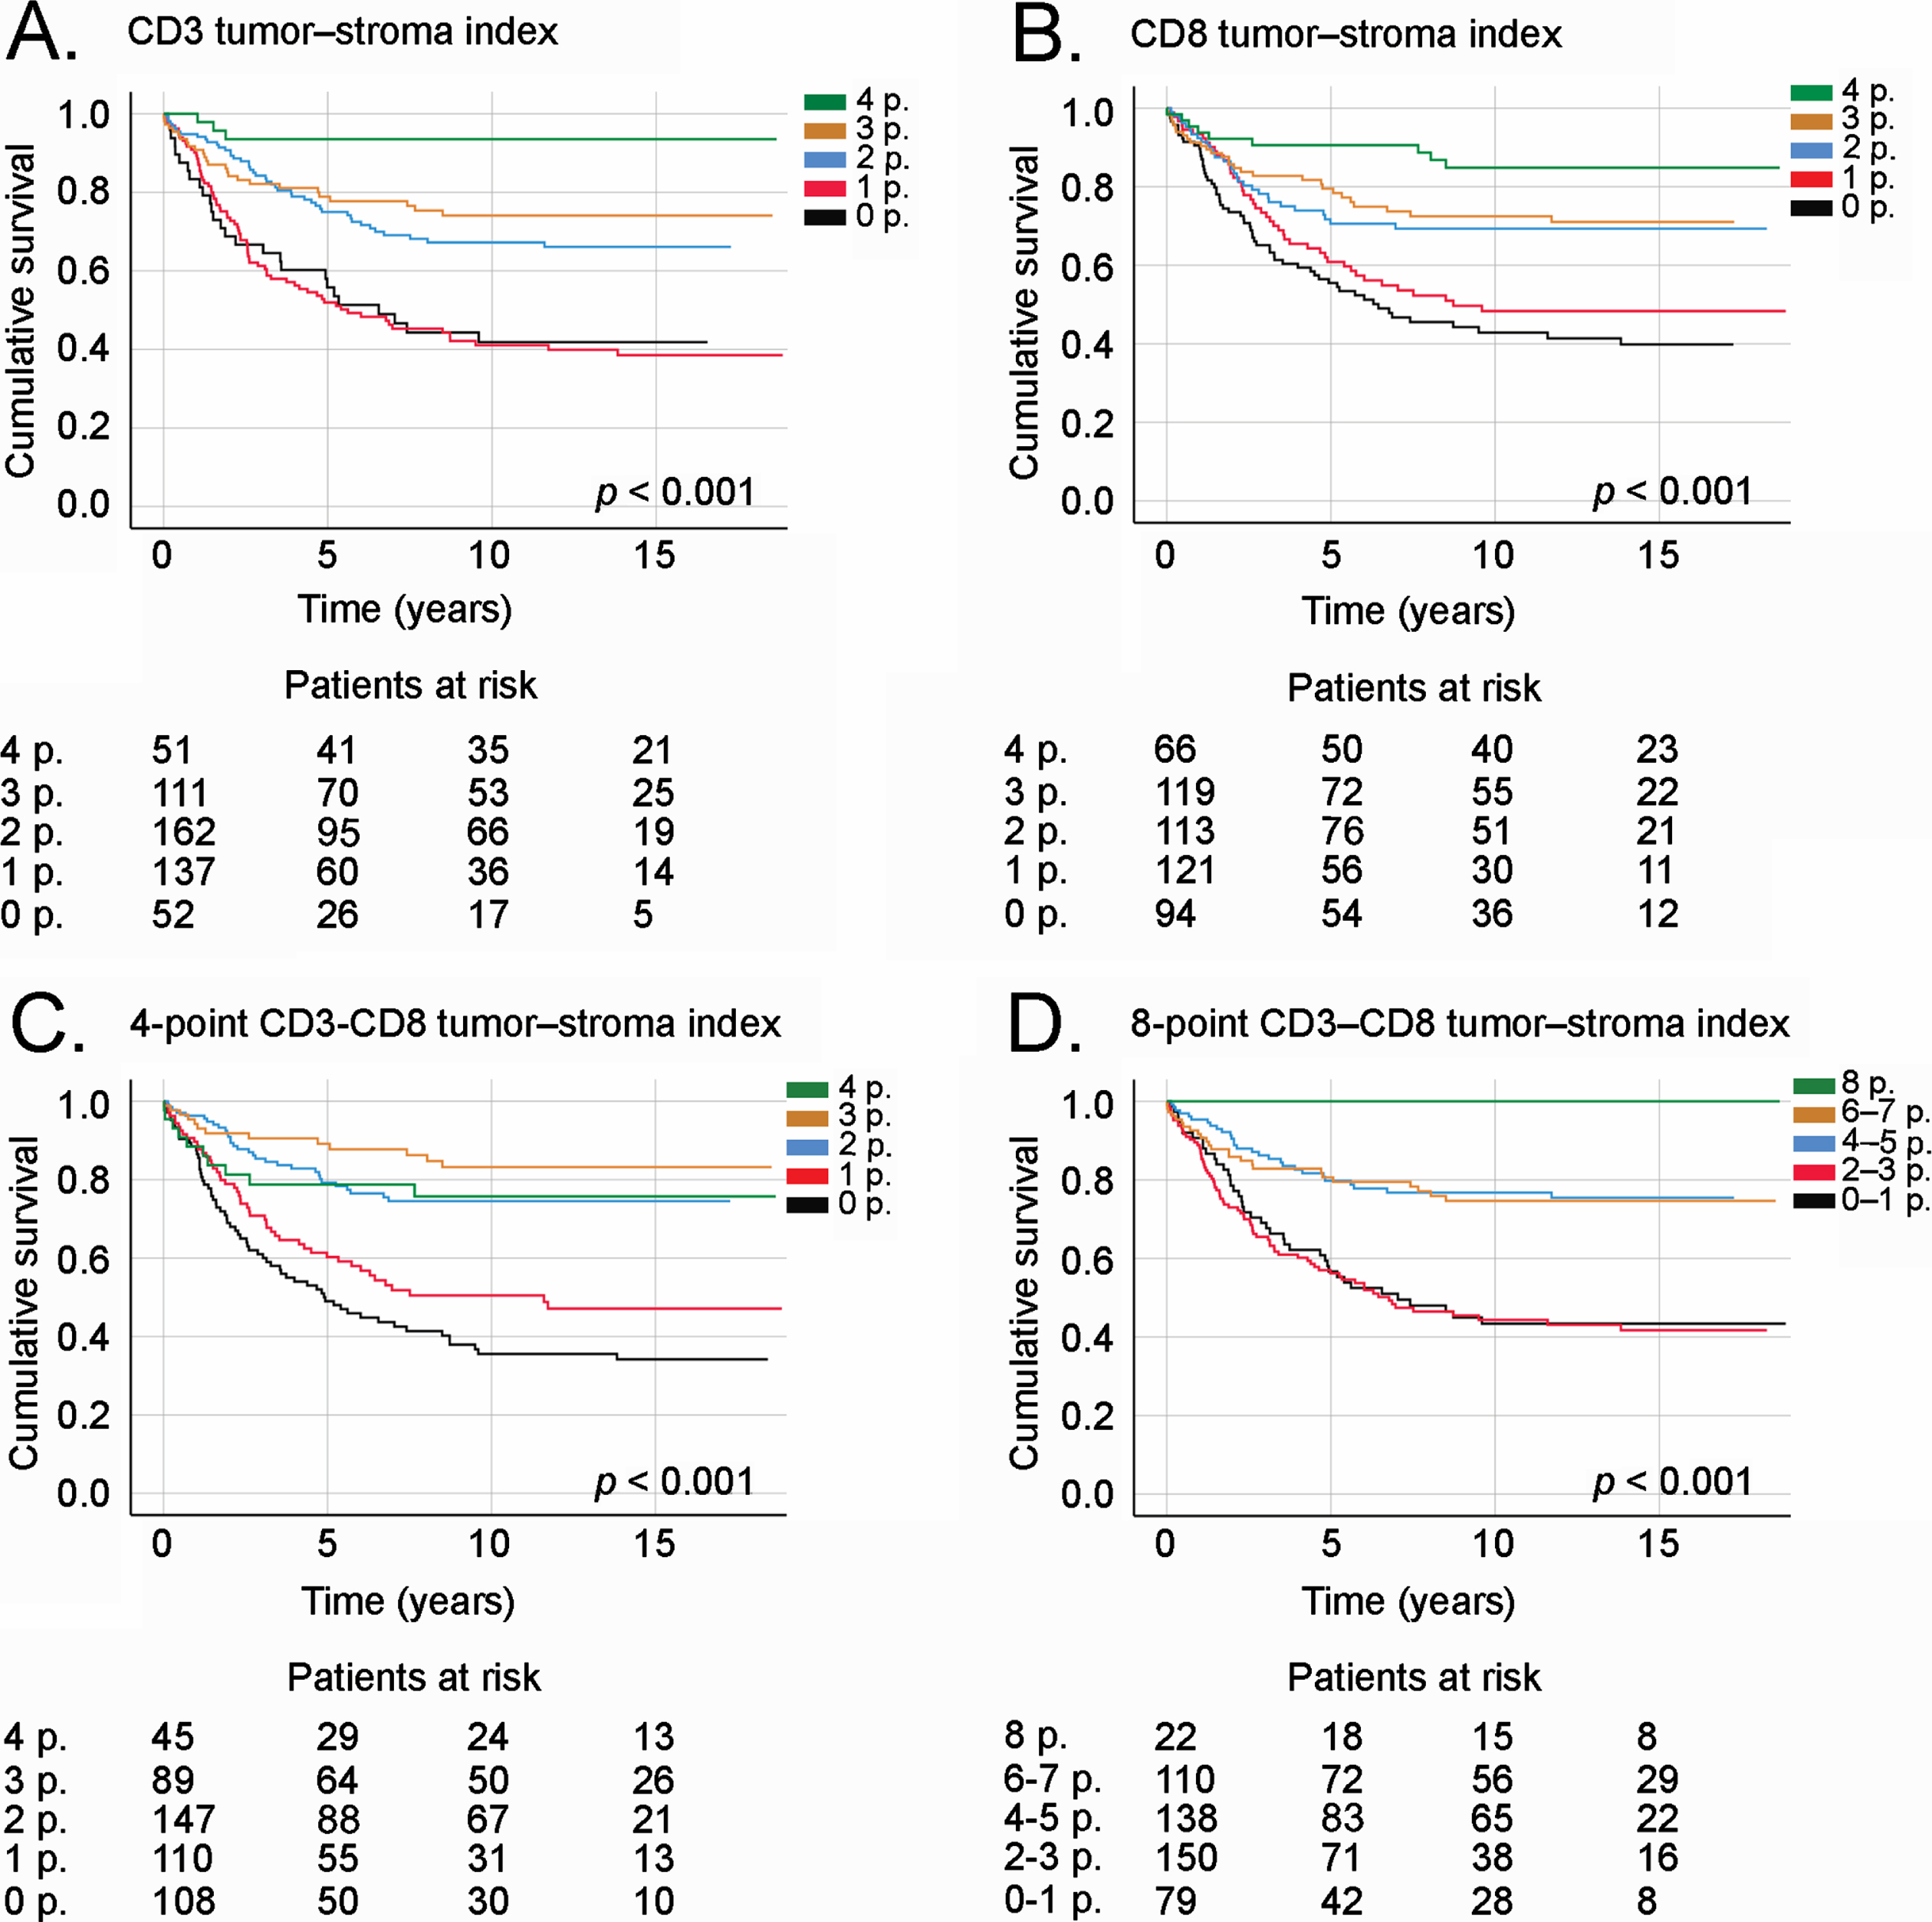
The CD3, CD8, and CD3–CD8 tumor–stroma indices all served as prognostic factors, with higher indices indicating a better DSS. Among patients with a 4-point CD3 tumor–stroma index, 5-year DSS was 93.7% (95% CI 86.8% –100%), falling to 56.7% (95% CI 42.8% –70.6%; p < 0.001; Fig. 4a) among patients with 0 points. In addition, 5-year DSS among patients with a 4-point CD8 tumor–stroma index was 90.7% (95% CI 83.6% –97.8%) compared to 61.3% (95% CI 51.3% –71.3%; p < 0.001; Fig. 4B) among patients with 0 points. Among patients with a 4-point CD3–CD8 tumor–stroma index, 5-year DSS reached 79.2% (95% CI 67.0% –91.4%), falling to 49.5% (95% CI 39.9% –59.1%; p < 0.001; Fig. 4C) among patients with a 0-point CD3–CD8 tumor–stroma index. Using the 8-point CD3–CD8 tumor–stroma index, none of the patients with 8 points died due to CRC, whereas 5-year DSS among patients with 1 point dropped to 57.2% (95% CI 46.0% –68.7%; p < 0.001; Fig. 4D).
Fig. 4
Disease-specific survival of CRC patients according to (A) the CD3 tumor–stroma index, (B) CD8 tumor–stroma index, (C) 4-point CD3–CD8 tumor–stroma index, and (D) 8-point CD3–CD8 tumor–stroma index. Survival curves drawn according to the Kaplan–Meier method, with p values based on the log-rank test. Patients who perished within 30 days after surgery were censored in the analysis.
3.6Subgroup and multivariate analyses
Among both stage I and II patients and stage III and IV patients, a high CD3 tumor–stroma index associated with a better prognosis (Supplementary Figure 2). Moreover, a high CD3 tumor–stroma index represented a favorable prognostic factor regardless of tumor location (Supplementary Figure 3). A high CD3 tumor–stroma index indicated a good prognosis regardless of age, gender, or tumor location in all individual stage subgroups (except stage I) and among patients with grade 2 and 4 tumors (Table 5). In the multivariable survival model, an older age, a higher stage, and a low CD3 tumor–stroma index served as independent prognostic factors indicating a significantly worse DSS (Table 6). A high CD8 tumor–stroma index served as a significant favorable prognostic factor regardless of age or gender among patients with grade 2 and 4 tumors and for patients with colonic tumors (Table 5). A high 4-point CD3–CD8 tumor–stroma index indicated a better prognosis regardless of age, gender, stage, and tumor location and among patients with grade 2 and 4 tumors (Table 5).
Table 5
Subgroup analysis of CD3, CD8, and 4-point CD3– CD8 tumor– stroma index. The 4-point group served as the reference in the Cox proportional hazards model
| CD3 tumor– stroma index | CD8 tumor– stroma index | 4-point CD3– CD8 tumor– stroma index | |||||||
| Clinicopathological | 2– 3 p. | 0– 1 p. | 2– 3 p. | 0– 1 p. | 2– 3 p. | 0– 1 p. | |||
| variable | HR (95% CI) | HR (95% CI) | p value | HR (95% CI) | HR (95% CI) | p value | HR (95% CI) | HR (95% CI) | p value |
| Age, in years | |||||||||
| < 69 | 3.19 (2.67– 3.70) | 6.69 (6.02– 7.36) | < 0.001 | 3.34 (1.40– 7.97) | 3.78 (1.55– 9.18) | < 0.001 | 1.05 (0.31– 3.61) | 4.96 (1.55– 15.8) | < 0.001 |
| ≥69 | 3.70 (0.89– 15.3) | 7.78 (1.89– 32.0) | < 0.001 | 2.45 (1.23– 4.90) | 1.92 (0.86– 4.27) | 0.023 | 1.71 (1.07– 2.34) | 3.99 (3.32– 4.67) | < 0.001 |
| Gender | |||||||||
| Female | 6.25 (0.85– 46.0) | 25.6 (3.53– 185) | < 0.001 | 3.12 (1.45– 6.71) | 2.83 (1.25– 6.43) | 0.004 | 0.78 (0.29– 2.09) | 3.73 (1.49– 9.32) | < 0.001 |
| Male | 4.47 (1.08– 18.4) | 7.13 (1.73– 29.4) | < 0.001 | 2.62 (1.22– 5.62) | 2.51 (1.11– 5.66) | 0.018 | 0.77 (0.30– 2.00) | 1.99 (0.80– 4.96) | < 0.001 |
| Stage (I– IV) | |||||||||
| I | N/A | N/A | 0.182 | N/A | N/A | 0.110 | N/A | N/A | 0.039 |
| II | N/A | N/A | 0.006 | 2.94 (0.86– 10.1) | 1.25 (0.28– 5.60) | 0.084 | 0.74 (0.16– 3.36) | 2.04 (0.47– 8.82) | 0.028 |
| III | 1.47 (0.35– 6.13) | 2.86 (0.69– 11.8) | 0.008 | 1.98 (0.93– 4.21) | 2.14 (0.99– 4.62) | 0.097 | 0.59 (0.22– 1.56) | 1.33 (0.53– 3.34) | 0.004 |
| IV | 5.47 (0.72– 41.5) | 8.25 (1.12– 60.8) | 0.009 | 1.94 (0.67– 5.60) | 1.58 (0.51– 4.86) | 0.407 | 2.68 (0.59– 12.1) | 4.57 (1.09– 19.1) | 0.016 |
| Grade (WHO) | |||||||||
| 1 | N/A | N/A | 0.123 | N/A | N/A | 0.156 | 0.14 (0.03– 0.69) | 0.29 (0.07– 1.17) | 0.074 |
| 2 | 3.34 (1.04– 10.7) | 8.95 (2.82– 28.4) | < 0.001 | 2.47 (1.34– 4.56) | 2.45 (1.29– 4.64) | 0.004 | 1.30 (0.46– 3.68) | 4.45 (1.63– 12.2) | < 0.001 |
| 3 | N/A | N/A | 0.063 | 3.59 (0.42– 31.1) | N/A | 0.202 | N/A | 2.00 (0.25– 16.3) | 0.012 |
| 4 | N/A | N/A | 0.002 | 8.00 (0.92– 69.2) | 9.46 (1.01– 88.4) | 0.034 | 2.08 (0.23– 18.7) | 8.15 (1.01– 65.8) | 0.013 |
| Tumor location | |||||||||
| Right colon | N/A | N/A | < 0.001 | 5.42 (1.26– 23.2) | 2.90 (0.49– 17.3) | 0.016 | 0.80 (0.29– 2.26) | 3.09 (1.17– 8.13) | < 0.001 |
| Left colon | 3.39 (0.80– 14.4) | 5.01 (1.18– 21.3) | 0.023 | 4.27 (1.27– 14.4) | 3.93 (1.10– 14.1) | 0.017 | 0.80 (0.23– 2.75) | 1.90 (0.58– 6.24) | 0.015 |
| Rectum | 3.96 (0.54– 29.3) | 13.4 (1.85– 96.6) | < 0.001 | 1.88 (0.95– 3.70) | 2.11 (1.05– 4.25) | 0.074 | 0.87 (0.20– 3.78) | 3.78 (0.93– 15.5) | < 0.001 |
Abbreviations: p., index points; HR, hazard ratio; CI, confidence interval; N/A, not applicable.
Table 6
Multivariate Cox regression analysis for disease-specific survival among colorectal cancer patients
| Clinicopathological variable | Multivariate analysis | ||
| Hazard ratio | 95% CI | p value | |
| Age, in years | |||
| < 69 | 1.00 | 0.018 | |
| ≥69 | 1.50 | 1.07– 2.09 | |
| Gender | |||
| Female | 1.00 | 0.537 | |
| Male | 1.11 | 0.80– 1.54 | |
| Stage (I– IV) | |||
| I | 1.00 | < 0.001 | |
| II | 2.18 | 0.84– 5.70 | |
| III | 6.45 | 2.58– 16.1 | |
| IV | 19.6 | 7.66– 50.4 | |
| Grade (WHO) | |||
| 1 | 1.00 | 0.427 | |
| 2 | 1.09 | 0.59– 2.03 | |
| 3 | 1.13 | 0.44– 2.93 | |
| 4 | 1.73 | 0.79– 3.78 | |
| Tumor location | |||
| Right colon | 1.00 | 0.212 | |
| Left colon | 1.23 | 0.76– 1.97 | |
| Rectum | 0.87 | 0.55– 1.37 | |
| CD3 tumor– stroma index | |||
| 4 p. | 1.00 | 0.025 | |
| 2– 3 p. | 5.66 | 0.27– 2.39 | |
| 0– 1 p. | 6.91 | 0.21– 1.19 | |
| CD8 tumor– stroma index | |||
| 4 p. | 1.00 | 0.435 | |
| 2– 3 p. | 1.45 | 1.71– 27.9 | |
| 0– 1 p. | 1.84 | 1.52– 21.0 | |
| 4-point CD3– CD8 tumor– stroma index | |||
| 4 p. | 1.00 | 0.132 | |
| 2– 3 p. | 0.81 | 0.72– 4.72 | |
| 0– 1 p. | 0.50 | 0.66– 3.22 | |
Abbreviations: CI, confidence interval; p., index point.
4Discussion
In this study, we found that high CD3T, CD8T, CD3S, and CD8S immune cell densities indicated a remarkably better survival among CRC patients. Specifically, CD3T and CD3S appear to have a more pronounced effect on patient survival compared to CD8S.
We developed tumor–stroma indexes for CD3 and CD8 and defined the CD3–CD8 tumor–stroma index applying principles that resemble the Immunoscore. The Immunoscore is determined using a computerized scoring system and its own algorithm. CD3T, CD8T, CD3S, and CD8S densities are converted to percentiles, while the mean percentile is calculated from the four percentiles, which is subsequently translated to the Immunoscore by implementing cut-off values [27]. We implemented cut-off values first for CD3T, CD8T, CD3S, and CD8S individually and then constructed the CD3–CD8 tumor–stroma index using the dichotomized values. However, our CD3–CD8 tumor–stroma index, similar to the original Immunoscore, takes into account CD3T, CD8T, CD3S, and CD8S with equal weights. In agreement with other studies, a high CD3 tumor–stroma index, a CD8 tumor–stroma index, and a CD3–CD8 tumor–stroma index indicated an improved DSS [21, 28, 29]. However, in our patient cohort, combining CD3 and CD8 did not markedly improve the prognostic value compared to using the CD3 tumor–stroma index to predict prognosis. Moreover, in the multivariate analysis, the CD3 tumor–stroma index served as an independent prognostic factor, whereas the CD8 or CD3–CD8 tumor–stroma indices did not.
Galon et al. [24, 30] investigated CD3 and CD8 densities in 415 CRC patients, concluding that high densities of CD3- or CD8-positive immune cells predicted better survival. They found that high densities of Granzyme B- and CD4RO-positive immune cells indicated a better survival. Unfortunately, these markers were beyond the scope of our study. Interestingly, in their study, CD3 seemed to carry the strongest prognostic value compared to the other biomarkers. In another study, low CD3 and CD8 immune cell densities indicated a poor prognosis, remaining equally strong prognostic markers [22]. Furthermore, in a study comprising 1804 CRC patients, a low CD8 density served as a stronger predictor of disease recurrence than a low CD3 density [31]. Similar to our findings, high CD3 and CD8 densities both predicted better survival. However, results comparing the predictive power of CD3 and CD8 differ between studies. For instance, in our study, CD3S and CD3T seemed to have a stronger prognostic value than CD8T and CD8S, agreeing rather closely with Galon et al. [24].
Combining CD3 and CD8 densities to form the Immunoscore has robustly predicted survival in CRC [21, 28]. However, studies investigating the Immunoscore seldom compare it to using CD3 alone. A Danish study [32] reported findings similar to ours, whereby combining CD3 and CD8 did not add any prognostic value to using either immune cell subgroup alone. Using only one immune cell subgroup as a prognostic factor would clearly be more easily applied in clinical settings, since it would be simpler and more economical to include only one immunohistochemical staining in the routine pathology report.
Previously, the Immunoscore was found to indicate a better DSS among stage II, III, and IV CRC patients [21, 28]. Similarly, high CD3 densities predicted better DSS in stage I through III colorectal tumors [24]. Some studies reported that CD3 and the Immunoscore both have prognostic significance in colon cancer and rectal cancer [21, 32, 33]. In our study, the CD3 tumor–stroma index and CD3–CD8 tumor–stroma index carried a prognostic value despite the tumor location. A high CD3 tumor–stroma index did not indicate a better DSS in stage I disease, but the CD3–CD8 tumor–stroma index did. However, this might be due to the exceptionally good prognosis and small number of stage I patients in our cohort. Interestingly, among stage I and II patients and patients with a right-sided colon tumor, no patients with a 4-point CD3 tumor–stroma index died due to CRC during follow-up. It seems that CD3 alone or combined with CD8 has a prognostic value extending across many patient subgroups. However, the additional prognostic value of CD8 remains debatable. Our results suggest, similar to other previous studies, that all T-cells take part in tumor inhibition, not only CTLs [34].
In addition to recognizing CTLs, CD3 immunostaining identifies a variety of different Th and Treg cells. While CTLs bind to their target cells and secrete cytotoxins to destroy them, Th and Treg cells secrete cytokines that modulate the immune response [35, 36]. Specifically, the interleukin-2 production of Th1 cells upregulates the CTL response [37]. Such direct links between CTLs and Th2, Th17, or Treg cells have yet to be established, and their effect on tumor inhibition varies further [17, 36]. In CRC, the increased infiltration of Th1 and Treg cells indicate an improved prognosis. Th17 cells seem to associate with a worse survival. However, a gene expression–based analysis revealed that the positive prognostic effect of Th1 cells is superior to the negative effect of Th17 cells. Interestingly, Th2 cells did not alter prognosis [18, 19]. These results, similar to our findings, favor the superiority of CD3 as a prognostic marker compared to assessing only CD8-positive CTLs in CRC.
High densities of CD3- and CD8-positive cells associate with favorable tumor characteristics such as a low TNM stage [31, 32]. Some studies identified higher immune cell densities in the right colon [22, 31], while other studies observed no association between the tumor location and immune cell densities [21, 32]. In our study, CD3T, CD8T, CD3S, and CD8S immunonegativity as well as low tumor–stroma indices all associated with a higher stage and tumors located in the left colon or rectum. Since CRC is a heterogeneous disease with molecular and clinicopathological characteristics differing between right-sided colon cancer, left-sided colon cancer, and rectal cancer [38], we would expect that the antitumoral immune response differs among patients with a different tumor location.
Since combining immune cell densities from the intratumoral and stromal areas appears indicative of survival better than looking at only one area of the tumor, we could hypothesize that using whole-tissue samples instead of TMA samples would prove beneficial. However, using TMA samples [21, 24, 31, 32] seems to provide similar results compared to whole-tissue samples [22, 28, 29]. Moreover, we acquired additional, separate samples from the stromal tissue distal to the tumor from 385 patients. Using the CD3 and CD8 densities of the samples did not markedly alter the survival results (data not shown).
TMA samples are often analyzed digitally [21, 22, 24, 29, 31, 32] and using a digital scoring system could have possibly improved the reproducibility of our findings. Yet, the visual evaluation by a pathologist remains the standard method for evaluating samples in clinical practice, and we showed that CD3T, CD8T, CD3S, and CD8S densities can be assessed from TMA samples using a semiquantitative method. Furthermore, the applicability of our TMA samples also suggests that the CD3 tumor–stroma index could be assessed from preoperative biopsies, and, thus used as a marker to guide neoadjuvant treatment in rectal cancer as well as possibly in colon cancer. However, further studies are still needed to confirm this idea.
The strength of our work lies in the long and thorough follow-up time, which allowed us to determine if patients were genuinely cured. Our cohort is large and well-characterized with accurate DSS rates and cause of death data obtained from Statistics Finland and the Finnish Digital and Population Data Services Agency. The limitations of our study include the incomplete data on comorbidities and adjuvant or neoadjuvant therapies. Even though semiquantitative scoring may also represent a limitation, visual evaluation is still the most frequently used method when evaluating clinical samples.
This study showed that the CD3 tumor–stroma index carries a strong prognostic value in CRC and none of the studied combinations of CD3 and CD8 markedly added to this value. Using only CD3 as a prognostic factor is simple and might be easily adapted for clinical use. We also showed that CD3 and CD8 densities can be reliably assessed using semiquantitatively scored TMA samples.
Acknowledgments
We thank Pia Saarinen for her indispensable technical assistance.
Author contributions
CONCEPTION: JK, CB and CH
DATA CURATION: TK, IB-L, JK and JH
ANALYSIS OF DATA: JK, CB and CH
PREPARATION OF THE MANUSCRIPT: JK, CB and CH
REVISION FOR IMPORTANT INTELLECTUAL CONTENT: All authors
SUPERVISION: CB and CH
Conflict of interest
The authors report no conflicts of interest.
Ethical considerations
Ethical approval for this study was obtained from the Surgical Ethics Committee of Helsinki University Hospital (Dnro HUS 226/E6/ 06, extension TMK02 §66 17.4.2013). The National Supervisory Authority of Health and Welfare (Valvira Dnro 10041/06.01.03.01/2012) granted us permission to study the archived tissue samples without requiring individual patient consent.
Funding
This study was financially supported by the Competitive State Research Financing of the Expert Responsibility of Helsinki University Hospital, Finland (CH), the Finnish Cancer Foundation (CH), Finska Läkaresällskapet (CH, CB, JK, IB-L), the Sigrid Jusélius Foundation (CH, JK), and the K Albin Johanssons Foundation (TK, IB-L).
SUPPLEMENTARY MATERIAL
[1] All data are available upon request from the corresponding author.
The supplementary material is available in the electronic version of this article: https://dx.doi.org/10.3233/TUB-211571.
References
[1] | Bray F , Ferlay J , Soerjomataram I , et al. Global Cancer Statistics GLOBOCAN Estimates of Incidence and Mortality Worldwide for 36 Cancers in 185 Countries. CA Cancer J Clin. (2018) ;68: :394–424. |
[2] | Cutsem Van E , Cervantes A , Adam R et al. ESMO consensus guidelines for the management of patients with metastatic colorectal cancer. Ann Oncol. (2016) ;27: :1386–422. |
[3] | Benson AB , Venook AP , Al-Hawary MM , et al. Colon Cancer. NCCN Guidel. 2019 |
[4] | Benson AB , Schrag D , Somerfield MR , et al. American Society of Clinical Oncology Recommendations on Adjuvant Chemotherapy for Stage II Colon Cancer. J Clin Oncol. (2004) ;22: :3408–19. |
[5] | Benson AB , Venook AP , Al-Hawary MM , et al. Rectal Cancer. NCCN Guidel. 2019 |
[6] | Hanahan D , Weinberg RA . Review Hallmarks of Cancer: The Next Generation. Cell. (2011) ;144: :646–74. |
[7] | Galon J , Angell HK , Bedognetti D , et al. The Continuum of Cancer Immunosurveillance: Prognostic, Predictive, and Mechanistic Signatures. Immunity. (2013) ;39: :11–26. |
[8] | Galon J , Tartour E , Saute C , et al. Immune infiltration in human tumors: a prognostic factor that should not be ignored. Oncogene. (2010) ;29: :1093–102. |
[9] | Gabrielson A , Wu Y , Wang H , et al. Intratumoral CD3 and CD8 T-Cell Densities Associated with Relapse Free Survival in HCC. Cancer Immunol. (2016) ;4: :419–30. |
[10] | Yu A , Mansure JJ , Solanki S , et al. Presence of lymphocytic infiltrate cytotoxic T lymphocyte CD3+, CD8+, and immunoscore as prognostic marker in patients after radical cystectomy. PLoS One. (2018) ;13: :1–13. |
[11] | Clemente CG , Mihm MC , Bufalino R , et al. Prognostic Valie of TILs in vertical growth phase of primary cutaneous melanoma. Cancer. (1996) ;77: :1303–10. |
[12] | Badoual C , Hans S , Rodriguez J , et al. Prognostic value of tumor-infiltrating CD4+T-cell subpopulations in head and neck cancers. Clin Cancer Res. (2006) ;12: :465–72. |
[13] | Mahmoud SMA , Paish EC , Powe DG , et al. Tumor-infiltrating CD8+lymphocytes predict clinical outcome in breast cancer. J Clin Oncol. (2011) ;29: :1949–55. |
[14] | Zhang L , Conejo-Garcia JR , Katsaros D , et al. Intratumoral T cells and survival in epithelial ovarian cancer. N Engl J Med. (2003) ;348: :203–13. |
[15] | Dieu-Nosjean MC , Antoine M , Danel C , et al. Long-term survival for patients with non-small-cell lung cancer with intratumoral lymphoid structures. J Clin Oncol. (2008) ;26: :4410–7. |
[16] | Kirilovsky A , Marliot F , Sissy C El , et al. Rational bases for the use of the Immunoscore in routine clinical settings as a prognostic and predictive biomarker in cancer patients. Int Immunol. (2016) ;28: :373–82. |
[17] | Fridman WH , Pagès F , Sautès-fridman C , et al. The immune contexture in human tumours: impact on clinical outcome. Nat Rev. (2012) ;12: :298–306. |
[18] | Tosolini M , Kirilovsky A , Mlecnik B , et al. Clinical impact of different classes of infiltrating T cytotoxic and helper cells (Th1, Th2, Treg, Th17) in patients with colorectal cancer. Cancer Res. (2011) ;71: :1263–71. |
[19] | Salama P , Phillips M , Grieu F , et al. Tumor-infiltrating FOXP3+T regulatory cells show strong prognostic significance in colorectal cancer. J Clin Oncol. (2009) ;27: :186–92. |
[20] | Angell HK , Bruni D , Carl Barrett J , et al. The immunoscore: Colon cancer and beyond. Clinical Cancer Research. (2020) ;26: :332–9. |
[21] | Wirta E , Seppälä T , Friman M , et al. Immunoscore in mismatch repair-proficient and -deficient colon cancer. J Pathol Clin Res. (2017) ;3: :203–13. |
[22] | Eriksen AC , Sørensen FB , Lindebjerg J , et al. The Prognostic Value of Tumor- Infiltrating lymphocytes in Stage II Colon Cancer. A Nationwide Population-Based Study. Transl Oncol. (2018) ;11: :979–87. |
[23] | Galon J , Pagès F , Marincola FM , et al. The immune score as a new possible approach for the classification of cancer. J Transl Med. (2012) ;10: :1–4. |
[24] | Galon J , Costes A , Sanchez-Cabo F , et al. Type, Density, and Location of Immune Cells Within Human Colorectal Tumors Predict Clinical Outcome. Science. (2006) ;313: :1960–4. |
[25] | Angell HK , Bruni D , Carl Barrett J , et al. The immunoscore: Colon cancer and beyond. Clin Cancer Res. (2020) ;26: :332–9. |
[26] | Cuschieri S . The STROBE guidelines. Saudi J Anaesth. (2019) ;13: :S31–4. |
[27] | Galon J , Lanzi A . Immunoscore and its introduction in clinical practice. Q J Nucl Med Mol Imaging. (2020) ;64: :152–61. |
[28] | Park JH , Mcmillan DC , Edwards J , et al. Comparison of the prognostic value of measures of the tumor inflammatory cell infiltrate and tumor-associated stroma in patients with primary operable colorectal cancer. Oncoimmunology. (2016) ;5: :1–9. |
[29] | Trabelsi M , Farah F , Zouari B , Jaafoura MH , Kharrat M . An immunoscore system based on cd3+and cd8+infiltrating lymphocytes densities to predict the outcome of patients with colorectal adenocarcinoma. Onco Targets Ther. (2019) ;12: :8663–73. |
[30] | Galon J , Costes A , Sanchez-Cabo F , et al. Type, density, and location of immune cells within human colorectal tumors predict clinical outcome (Supporting Online Material). Science. (2006) ;313: . |
[31] | Glaire MA , Domingo E , Sveen A , et al. Tumour-infiltrating CD8+lymphocytes and colorectal cancer recurrence by tumour and nodal stage. Br J Cancer. (2019) ;121: :475–82. |
[32] | Berntsson J , Svensson MC , Leandersson K , et al. The clinical impact of tumour-infiltrating lymphocytes in colorectal cancer differs by anatomical subsite: A cohort study. Int J Cancer. (2017) ;141: :1654–66. |
[33] | Anitei M , Zeitoun G , Mlecnik B , et al. Prognostic and Predictive Values of the Immunoscore in Patients with Rectal Cancer. Clin Cancer Res. (2014) ;20: :1891–989. |
[34] | Alexander PG , McMillan DC , Park JH . The local inflammatory response in colorectal cancer –Type, location or density? A systematic review and meta-analysis. Cancer Treat Rev. (2020) ;83: :1–28. |
[35] | Rudd-Schmidt JA , Hodel AW , Noori T , et al. Lipid order and charge protect killer T cells from accidental death. Nat Commun. (2019) ;10: :1–13. |
[36] | Zhu J , Paul WE . CD4 T cells: Fates, functions, and faults. Blood. (2008) ;112: :1557–69. |
[37] | Williams MA , Tyznik AJ , Bevan MJ . Interleukin-2 signals during priming are required for secondary expansion of CD8+memory T cells. Nature. (2006) ;441: :890–3. |
[38] | Minoo P , Zlobec I , Peterson M , et al. Characterization of rectal, proximal and distal colon cancers based on clinicopathological, molecular and protein profiles. Int J Oncol. (2010) ;37: :707–18. |