Patterns of Healthcare Use and Mortality After Alzheimer’s Disease or Related Dementia Diagnosis Among Alaska Native Patients: Results of a Cluster Analysis in a Tribal Healthcare Setting
Abstract
Background:
Alaska Native and American Indian (AN/AI) people represent a rapidly aging population with disproportionate burdens of Alzheimer’s disease and related dementias (ADRD) risk factors.
Objective:
To characterize healthcare service use patterns and mortality in the years following ADRD diagnosis for patients in an Alaska Native Tribal health system.
Methods:
The study sample included all AN/AI patients aged 55 or older with an ADRD diagnosis who were seen between 2012–2018 (n = 407). We used cluster analysis to identify distinct patterns of healthcare use for primary care, emergency and urgent care, inpatient hospital stays, and selected specialty care. We compared demographic and clinical factors between clusters and used regression to compare mortality.
Results:
We identified five clusters of healthcare service use patterns after ADRD diagnosis: 1) people who use a low amount of all services (n = 107), 2) people who use a high amount of all services (n = 60), 3) people who use a high amount of primary and specialty care (n = 105), 4) people who use a high amount of specialty care (n = 65), and 5) people who use a high amount of emergency and urgent care (n = 70). The cluster with the highest use had the greatest proportion of comorbidities and had a 2.3-fold increased risk of mortality compared to the cluster with the lowest healthcare service use.
Conclusion:
Results indicate that those receiving the most services had the greatest healthcare-related needs and increased mortality. Future research could isolate factors that predict service use following ADRD diagnosis and identify other differential health risks.
INTRODUCTION
Alzheimer’s disease and related dementias (ADRD) are a growing public health and economic issue, and a source of increasing health disparity in underrepresented and underserved populations. The prioritization of ADRD across state and federal agencies has sparked the passage of legislation for interagency planning of care, research, and support for local, state, and tribal ADRD strategies [1–3]. Despite this priority, aging-related health disparities continue to grow for Alaska Native and American Indian (AN/AI) people [4, 5]. Over the last 40 years, the proportion of AN/AI individuals over age 65 has nearly tripled from 5% to 14% [6]. During much of that same time, the prevalence of ADRD has more than doubled [7, 8], considerably increasing the burden on patients, families, communities, and health systems. In addition to general risk factors for ADRD including age, sex, genetics, and family history, AN/AI populations often have higher levels of ADRD-related risk factors including obesity, hypertension, hypercholesterolemia, diabetes mellitus, alcohol misuse, tobacco use, and head trauma compared with the general population [9–18]. ADRD leads to increased mortality risk and increased healthcare service use because of acute adverse events (e.g., injury, falls, fractures), manifestations of chronic neurodegenerative disease (e.g., inanition, weight loss, infection), and poor self-management of comorbid medical conditions (e.g., diabetes, heart disease, lung disease) [9, 19–22].
In an effort to create a more elder-friendly health system, leaders at Southcentral Foundation (SCF), a tribally owned and operated healthcare system serving over 65,000 AN/AI people in southcentral Alaska, are developing strategies to improve detection and management of ADRD and associated health events [23]. In 2017, SCF conducted a study to identify and characterize the service use of individuals with ADRD [24]. SCF identified a sharp increase in healthcare service use during the year of ADRD diagnosis and a plateau effect for most healthcare services in the years thereafter [24]. The exception was primary care visits, which continued at higher rates compared with people with no ADRD diagnosis [24]. These analyses did not attempt to prospectively identify demographic or clinical factors associated with healthcare service use levels after diagnosis, nor did they evaluate whether differences in post-diagnosis healthcare service use are associated with ADRD prognosis or mortality. This information would help policymakers and clinicians to project short- and long-term healthcare service needs and identify individual patients who might benefit from specific interventions regarding medical needs and service use.
Recently SCF has expanded the demographic and clinical variables available for analysis, as well as the timeframe of this dataset. With these data, SCF may better understand crucial distinctions, beyond diagnosis, in healthcare needs and prognosis, and spark innovation to improve healthcare for its patient population. ADRD diagnosis can be a challenging process with misclassification or conflicting diagnoses dramatically altering treatment plans and prognosis. By looking beyond individual diagnoses at a cohort of those with ADRD, distinctions in demographics, clinical characteristics, and service use may broadly inform population health management of ADRD in this tribal health setting. With the expanded data, we conducted a secondary analysis using information obtained from the electronic health records (EHR) system for 407 patients who were recently diagnosed with ADRD. Our objectives were to 1) determine whether distinct clusters of healthcare service use patterns in the year following an ADRD diagnosis could be identified; 2) evaluate patient demographic and clinical characteristics at the time of diagnosis that are associated with membership in a given cluster; and 3) evaluate whether clusters are associated with differential mortality.
MATERIALS AND METHODS
Study design
We conducted a retrospective cohort study of SCF patients who were diagnosed with ADRD between January 2012 and December 2017. Data were obtained from the EHR. Healthcare service use was followed through December 2018 and mortality through December 2019.
Approvals
All study procedures were approved by the Alaska Area Institutional Review Board and Tribal research review committees at SCF and the Alaska Native Tribal Health Consortium [25]. A waiver of consent was obtained from the Alaska Area Institutional Review Board. Tribal approval was also obtained for dissemination.
Study setting and sample
Setting
SCF is a tribally owned and operated healthcare system based at the Alaska Native Tribal Health Campus in Anchorage, Alaska. Healthcare services offered on the campus include primary care, specialty care, diagnostic laboratory and imaging services, urgent care, emergency department services, and inpatient hospitalization. SCF operates the primary care clinics with integrated care teams of physicians, nurses, pharmacists, and behavioral health consultants. The primary care clinics serve over 65,000 AN/AI people living in urban and rural communities in southcentral Alaska. With the Alaska Native Tribal Health Consortium, SCF also co-manages the Alaska Native Medical Center, where secondary and tertiary care is delivered for 160,000 AN/AI people across the state. SCF’s primary EHR platforms are Cerner® and Tier®. Cerner contains all medical service data; Tier contains behavioral health data. These EHRs have been in place since October 2011.
Sampling
The study sample included all AN/AI patients with an ADRD diagnosis who were aged 55 or older, living in the Anchorage or Matanuska-Susitna Valley (population 396,317 across 27,202 sq. miles), and had at least one encounter at either a SCF clinic or the Alaska Native Medical Center during the study period. AN/AI status of patients was determined based on individual eligibility for healthcare through the Indian Health Service, as established by documentation supplied when initially registering for care at SCF or the Alaska Native Medical Center. The minimum age threshold was set at 55 to be consistent with AN/AI conventions regarding elder status, which begins at a younger age than other populations. The geographic limit was imposed to minimize bias in service use factors, given differences in service access in rural communities.
Patients with at least one ADRD diagnosis identified by ICD-9 codes (290.xx, 294.xx (excluding 294.8), 331.xx) or ICD-10 (A52.17, F01.5x, F02.8x, F03.9x, G30.x, G31.0x) were defined as meeting study criteria for persons with dementia. The first ADRD diagnosis for each person between January 2012 and December 2017 was defined as the date of diagnosis for each person with dementia. A second diagnosis for some patients was available to distinguish them from patients with a single diagnosis of a non-specific condition like presenile dementia uncomplicated (290.1). Patients who died during the year of or year after ADRD diagnosis (n = 84) were excluded from analyses because their service use levels were truncated for the cluster analysis period.
Measures
Demographic factors
All relevant demographic, clinical, and service use measures were extracted from the EHR. Demographic factors included sex categorized as female or male. Age was recorded as of December 31, 2018. Data were deidentified such that anyone age 90 years or above was recorded as age 90 years. We used year of first dementia diagnosis to calculate approximate age at diagnosis. Due to the deidentification of ages 90 years or above, we could not determine age at diagnosis for patients older than age 83 years. Accordingly, we examined age as categories; 55–64, 65–74, 75–82, and ≥83 years. Health insurance type nearest to or at diagnosis included Medicare, Medicaid, private insurance, other insurance, and no insurance. Due to small cell sizes, we collapsed categories into Medicare versus all other types. Marital status was documented when patients first registered at SCF and updated whenever insurance information changed. Marital status categories include married or life partner; divorced, separated, or widowed; and single. Self-reported living situations documented in the EHR include living alone, with spouse or family, or in a skilled care facility such as assisted living or a nursing home.
ADRD clinical factors and comorbidities
Clinical factors related to ADRD diagnosis and care included the number of clinical encounters coded with ADRD diagnoses by year, the year of the first ADRD diagnosis, and ADRD etiology (e.g., Alzheimer’s disease, vascular dementia, unspecified dementia, or mild cognitive impairment). As the majority of cases were unspecified, all dementia categories were combined into a single ADRD group. One or more prescriptions for donepezil, galantamine, memantine, or rivastigmine indicated medications for ADRD. Indicators for whether a patient had brain imaging prior to or following ADRD diagnosis included computer tomography (CT) or magnetic resonance imaging (MRI) scan of the head with or without contrast. An indicator for completion of a dementia secondary causes blood panel, Quest Diagnostic Test 91410 (Comprehensive Metabolic Panel, CBC, TSH, Vitamin B12, Folate) was included. Comorbid health conditions and related symptoms recorded in the EHR in 2012–2018 included indicator variables for hypercholesterolemia, diabetes mellitus, hypertension, stroke, and memory problems by year. The most recent body mass index (BMI) prior to or at ADRD diagnosis was calculated as (weight in kilograms) / (height in meters)2. BMI was categorized as under or normal weight (< 25.0 kg/m2), overweight (25.0–29.9 kg/m2), and obese (≥30 kg/m2).
Service use
Service use was operationalized in terms of number of 1) visits to primary care clinics; 2) visits to emergency department or urgent care clinics; 3) inpatient hospital stays; and 4) visits to select specialty care clinics— surgery, cardiology, and neurology. Count of visits was by year from 2012 to 2018. During the year of diagnosis, we were unable to differentiate visits that occurred before versus after diagnosis. Year of death, if applicable, was recorded through 2019.
Statistical analysis
We used hierarchical cluster analysis to examine the patterns of healthcare use for primary care, emergency and urgent care, inpatient hospital stays, and specialty care (surgery, cardiology, neurology). Compared to other cluster analysis methods, hierarchical cluster analysis outputs a dendrogram which can visually inform decisions about clustering solutions when the number of clusters is not known a priori. Because cluster analysis requires complete data for all variables used in analyses, we focused on service use in (a) the year of and (b) the year after an ADRD diagnosis to avoid excluding a large portion of the sample due to death. The entire sample included in the cluster analysis had at least one year of service use after diagnosis. Number of visits and hospital stays were categorized and standardized prior to the cluster analysis to limit the impact of outliers and have all variables on the same scale within the skewed dataset. Primary care was grouped to include separate categories for each of 0–15 visits and pooled categories for 16–17, 18–21, 22–26, 27–37, and 38–121 visits. Emergency and urgent care and specialty care each included categories of 0, 1, 2, 3, 4–5, 6–9, and ≥10 visits (maximum visits was 52 and 53 for emergency/urgent and specialty care, respectively). Inpatient hospitalization was categorized as 0, 1, 2–3, and 4–12 stays.
We used agglomerative hierarchical cluster analysis based on Ward’s method [26]. This method uses squared Euclidean distances as the proximity measure to identify cluster solutions. We examined solutions for 2 through 10 clusters because the number of clusters was not known a priori. Median and interquartile range for healthcare use were calculated for each identified cluster. We then used chi-squared tests to compare patient demographics, clinical factors, and comorbidities across the clusters; due to the exploratory nature of this analysis, no pairwise comparisons of specific clusters were performed.
Finally, Poisson regression accounting for the length of time between ADRD diagnosis and death or the end of mortality follow-up in 2019, whichever was sooner, was used to compare mortality among the clusters of healthcare use. Each cluster was included in the model as a dummy variable with the lowest healthcare service use cluster as the referent. We fit a crude model with cluster as the only independent variable, and an expanded model with covariates that adjusted for potential confounding by age at ADRD diagnosis, sex, diagnosis type (dementia or mild cognitive impairment), and comorbidities (hypercholesterolemia, diabetes mellitus, hypertension, and stroke) present at first diagnosis. We did not include the full set of demographic, clinical, or comorbidity factors in the adjusted analysis because of missing data (marital status, living situation, BMI) or possible overlap with healthcare service cluster where adjustment may suppress the association of interest (number of encounters with dementia diagnosis, memory problems, ADRD medication prescription, receipt of brain imaging or dementia blood panel). Inferential results are presented as point estimates with 95% confidence intervals. Analyses were performed using Stata 15 for factor comparisons and R 4.0.4 for the cluster analysis.
RESULTS
Patient characteristics
The initial sample included 592 patients. One hundred patients were excluded because they were diagnosed in 2018 and therefore service use for the year after diagnosis was not present in the dataset. One patient was excluded because of missing service utilization data, and 84 patients were excluded due to death in the year of, or year after, ADRD diagnosis. This gave a final sample size of 407 people with dementia. Patient characteristics are described in Table 1. About half patients were age 75 or older (48%) and more than half were female (61%). About one-quarter of patients were married or had a life partner (25%) and half were living by themselves (53%).
Table 1
Demographic and health characteristics for patients at Southcentral Foundation with a ADRD diagnosis from 2012–2017
| Characteristic | (N = 407) % |
| DEMOGRAPHICS | |
| Age at first dementia diagnosis in years | |
| 55–64 | 21 |
| 65–74 | 31 |
| 75–82 | 30 |
| 83+ | 18 |
| Female sex | 61 |
| Medicare insurance | 72 |
| Marital statusa | |
| Married, Life partner | 25 |
| Divorced, Separated, Widowed | 38 |
| Single | 37 |
| Living situation, most currentb | |
| Self | 53 |
| Family | 23 |
| Skilled care facility | 24 |
| ADRD CLINICAL FACTORS | |
| Number of times dementia diagnosis in health record | |
| 1 dementia diagnosis | 28 |
| 2+ dementia diagnoses | 72 |
| Diagnosis type | |
| Mild cognitive impairment | 16 |
| Dementia | 84 |
| Medications prescribed for ADRDc | 21 |
| Brain imagingd performed before diagnosis | 46 |
| Brain imagingd performed after diagnosis | 63 |
| Dementia related blood panel performede | 14 |
| COMORBIDITIES | |
| Noted in health record during year of or year after dementia diagnosis | |
| Hypercholesterolemia | 45 |
| Diabetes Mellitus | 15 |
| Hypertension | 75 |
| Stroke | 16 |
| Memory loss or problems | 33 |
| Body mass index before or at dementia diagnosisf | |
| Under/Normal weight | 40 |
| Overweight | 26 |
| Obese | 33 |
an = 21 (5%) missing; bn = 19 (5%) missing; cdonepezil, galantamine, memantine, rivastigmine; dcomputer tomography (CT), computer tomography angiography (CTA), or magnetic resonance imaging (MRI) of head and/or brain, with or without contrast; edementia secondary causes blood panel Quest Diagnostics #91410, CPT CODES 80053, 82607, 82746, 84443, 85025; fn = 118 (29%) missing.
Only 33% of persons with dementia had memory loss documented in the EHR in the year of or after diagnosis. Over half of patients had dementia-related brain imaging performed after ADRD diagnosis (63%), and 14% had dementia-related blood panels performed. Only 21% were prescribed at least one medication for ADRD. Comorbidities recorded in the EHR during the year of or year after diagnosis included less than half with hypercholesterolemia (45%), diabetes mellitus (15%), stroke (16%); three-quarters of patients had hypertension. Over half of patients were overweight (26%) or obese (33%) at the most recent BMI measurement prior to ADRD diagnosis.
Healthcare service clusters
In the 2-cluster solution, patients were divided into one cluster with high median use for all service types (n = 130) and one cluster with lower use for all service types except specialty care (n = 277), which was similar to the high use cluster. In the 3-cluster solution, the high-use cluster remained the same (n = 130) while the other cluster was divided into those with high specialty care use (n = 170) and those with low use for all service types (n = 107). The 4-cluster solution divided the high-use cluster into patients with high use for all service types (n = 60) and patients with high use mainly for emergency or urgent care (n = 70). In the 5-cluster solution, the high specialty care group was divided into those with high primary and specialty care use (n = 105) and those with high specialty care use only (n = 65). At the 6-cluster solution and beyond, new clusters became difficult to distinguish from clusters identified earlier in the analysis. Therefore, we compared patient characteristics and mortality for 5 service use clusters: 1) people who use a low amount of all services (n = 107), 2) people who use a high amount of all services (n = 60), 3) people who use a high amount of primary and specialty care (n = 105), 4) people who use a high amount of specialty care (n = 65), and 5) people who use a high amount of emergency and urgent care (n = 70) (Fig. 1). Median use for each service type according to cluster is shown in Table 2.
Fig. 1
Results of cluster analysis when number of visits for 4 healthcare service types were used to define 5 clusters. Number of visits was converted to a z-score prior to cluster analysis for easier comparison across service types.
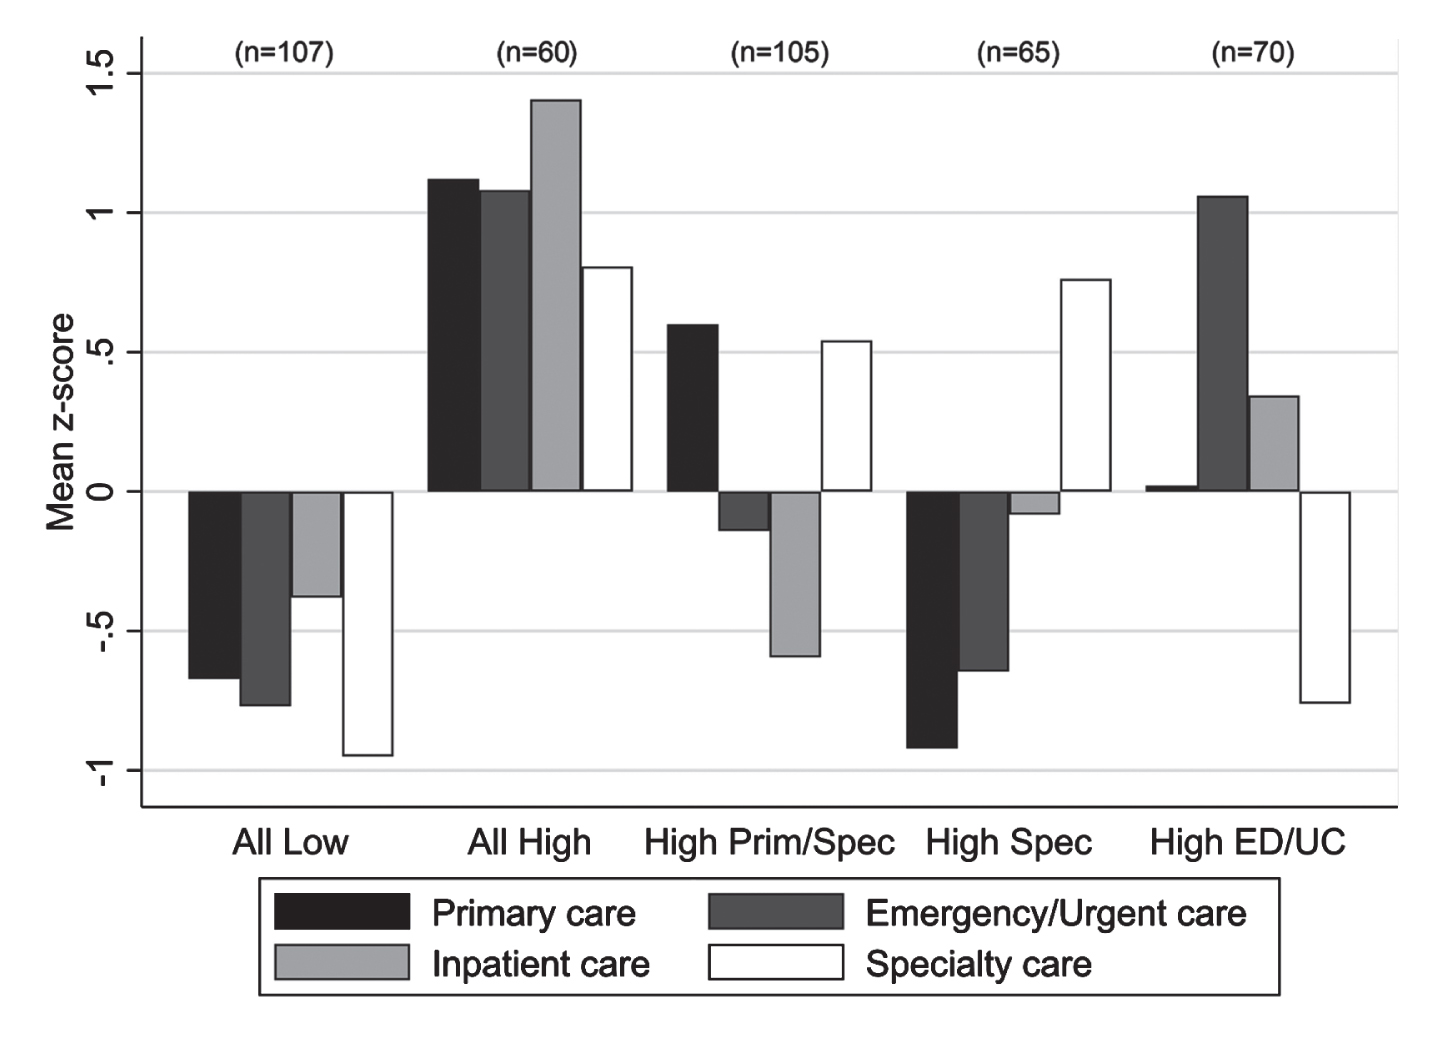
Table 2
Service use in the year of and year after ADRD diagnosis according to service use cluster
| Service Use Cluster | |||||
| Service type | All Low (n = 107) Median (IQR) | All High (n = 60) Median (IQR) | High Primary & Specialty (n = 105) Median (IQR) | High Specialty (n = 65) Median (IQR) | High ED/UC (n = 70) Median (IQR) |
| Primary care visits | 5 (2, 8) | 18 (14, 27) | 13 (10, 18) | 3 (1, 6) | 8 (5, 14) |
| Emergency department and urgent care visits | 0 (0, 1) | 6.5 (3, 12) | 1 (0, 3) | 1 (0, 1) | 5 (4, 7) |
| Inpatient stays | 0 (0, 1) | 3.5 (2, 5) | 0 (0, 1) | 0 (0, 2) | 1 (0, 3) |
| Specialty care visitsa | 0 (0, 1) | 5.5 (3, 10) | 4 (2, 6) | 5 (3, 9) | 0 (0, 1) |
aSurgery, cardiology, and neurology. IQR, interquartile range; ED/UC, Emergency department and urgent care.
Patient characteristics of clusters
Patient characteristics according to service use cluster are shown in Table 3. In the text, we identify clusters with the lowest or highest proportion for select characteristics, but additional details of the full distribution for all variables are included in Table 3.
Table 3
Demographic and health characteristics according to service use cluster
| Service Use Cluster | |||||
| All Low (n = 107) % | All High (n = 60) % | High Primary & Specialty (n = 105) % | High Specialty (n = 65) % | High ED/UC (n = 70) % | |
| Characteristic | |||||
| DEMOGRAPHICS | |||||
| Age at first dementia diagnosis in years | |||||
| 55–64 | 18 | 17 | 28 | 15 | 24 |
| 65–74 | 29 | 32 | 29 | 28 | 40 |
| 75–82 | 31 | 30 | 26 | 45 | 21 |
| 83+ | 22 | 22 | 18 | 12 | 14 |
| χ2 p = 0.14 | |||||
| Female sex | 55 | 65 | 67 | 49 | 71 |
| χ2 p = 0.04 | |||||
| Medicare insurance | 70 | 75 | 71 | 78 | 69 |
| χ2 p = 0.69 | |||||
| Marital statusa | |||||
| Married, Life partner | 20 | 25 | 34 | 28 | 17 |
| Divorced, Separated, Widowed | 36 | 42 | 38 | 37 | 39 |
| Single | 43 | 33 | 28 | 35 | 44 |
| χ2 p = 0.20 | |||||
| Living situationb | |||||
| Self | 41 | 58 | 60 | 55 | 56 |
| Family | 23 | 20 | 26 | 24 | 21 |
| Skilled care facility | 36 | 22 | 14 | 21 | 23 |
| χ2 p = 0.06 | |||||
| ADRD CLINICAL FACTORS | |||||
| Number of times dementia diagnosis in health record | |||||
| 1 dementia diagnosis | 29 | 35 | 27 | 20 | 27 |
| 2+ dementia diagnoses | 71 | 65 | 73 | 80 | 73 |
| χ2 p = 0.45 | |||||
| Diagnosis type | |||||
| Mild cognitive impairment | 10 | 22 | 20 | 14 | 17 |
| Dementia | 90 | 78 | 80 | 86 | 83 |
| χ2 p = 0.24 | |||||
| Medications for ADRDc | 19 | 8 | 30 | 23 | 20 |
| χ2 p = 0.02 | |||||
| Brain imagingd performed before diagnosis | 30 | 73 | 49 | 34 | 52 |
| χ2 p < 0.001 | |||||
| Brain imagingd performed after diagnosis | 53 | 73 | 64 | 68 | 66 |
| χ2 p = 0.09 | |||||
| Dementia related blood panel performede | 9 | 18 | 13 | 14 | 19 |
| χ2 p = 0.39 | |||||
| COMORBIDITIES | |||||
| Noted in health record during year of or year after dementia diagnosis | |||||
| Hypercholesterolemia | 31 | 70 | 50 | 37 | 46 |
| χ2 p < 0.001 | |||||
| Diabetes Mellitus | 14 | 23 | 21 | 8 | 10 |
| χ2 p = 0.04 | |||||
| Hypertension | 64 | 93 | 80 | 72 | 71 |
| χ2 p < 0.001 | |||||
| Stroke | 14 | 27 | 11 | 15 | 20 |
| χ2 p = 0.11 | |||||
| Memory loss or problems | 14 | 48 | 46 | 34 | 29 |
| χ2 p < 0.001 | |||||
| Body mass index before or at dementia diagnosisf | |||||
| Under/Normal weight | 46 | 39 | 36 | 38 | 46 |
| Overweight | 27 | 25 | 21 | 23 | 40 |
| Obese | 27 | 36 | 43 | 38 | 15 |
| χ2 p = 0.08 | |||||
an = 21 (5%) missing; bn = 19 (5%) missing; cdonepezil, galantamine, memantine, rivastigmine; dcomputer tomography (CT), computer tomography angiography (CTA), or magnetic resonance imaging (MRI) of head and/or brain, with or without contrast; edementia secondary causes blood panel Quest Diagnostics #91410, CPT CODES 80053, 82607, 82746, 84443, 85025; ED/UC = Emergency department and urgent care; fn = 118 (29%) missing.
All low
About half of patients who used a low amount of all services were aged ≥75 years (53%) or female (55%). Compared with other service use clusters, people who used a low amount of all services included the lowest proportion of patients living by themselves (41%), the lowest proportion with comorbidities (14–64%) or memory loss (14%) documented in their health record, the lowest proportion with brain imaging performed before (30%) or after (53%) ADRD diagnosis, and the lowest proportion with a dementia-related blood panel performed (9%).
All high
About half of patients who used a high amount of all services were aged ≥75 years (52%) while about two-thirds were female (65%). Compared with other service use clusters, people who used a high amount of all services included the lowest proportion of patients prescribed medication for ADRD (8%), the highest proportion of patients with comorbidities (23–93%) or memory loss (48%) documented in their health record, and the highest proportion with brain imaging performed (73% before ADRD diagnosis and 73% after).
High primary and specialty
Fewer than half of patients who used a high amount of primary and specialty care were aged ≥75 years (44%) while about two-thirds were female (67%). Compared with other service use clusters, people who used a high amount of primary and specialty care included the highest proportion of patients living by themselves (60%), the highest proportion who were obese (43%), and the highest proportion prescribed medication for ADRD (30%).
3.3.4High specialty
Compared with other service use clusters, people who used a high amount of specialty care had the highest proportion of patients aged ≥75 years (57%) and the lowest proportion of females (49%).
High emergency and urgent
Compared with other service use clusters, people who used a high amount of emergency and urgent care had the lowest proportion of patients aged ≥75 years (35%), the lowest proportion of obese patients (15%), the highest proportion of females (71%), and the highest proportion with a dementia-related blood panel performed (19%).
ADRD specific characteristics of clusters
Only 33% of persons with dementia had memory loss documented in the EHR in the year of or year after ADRD diagnosis, with those in the all low service use cluster having less documentation of memory loss (14%) and those in the all high and high primary and specialty care having more documentation (48% and 46%, respectively). Only 21% were prescribed a medication for the treatment of ADRD with those in the all high service use cluster having lower prevalence of ADRD prescriptions compared to those in high primary and specialty care (8% versus 30%). Brain imaging was commonplace prior to diagnosis and prevalence increased after diagnosis (from 46% to 63%) with the exception of the all high service use cluster where the prevalence of imaging was high both before and after diagnosis (73%).
Differential mortality by cluster
Mortality according to service use cluster is shown in Table 4. Mortality was lowest among people who used a high amount of primary and specialty care and highest among people who used a high amount of all services. Relative risk estimates show similar mortality across service use clusters except for the cluster of people who used a high amount of all services. The crude relative risk of mortality for people who used a high amount of all services compared to people who used a low amount of all services was 2.3 (95% CI: 1.3, 4.0). Adjustment for demographic characteristics and comorbidities had very minimal impact on the relative risk for mortality; however, 95% confidence intervals were wider for the adjusted compared to unadjusted model.
Table 4
Mortality through 2019 by service use cluster
| Service Use Cluster | |||||
| All Low | All High | High Primary &Specialty | High Specialty | High ED/UC | |
| Died on or before 12/31/2019, n (%) | 26 (24) | 24 (40) | 18 (17) | 16 (25) | 15 (21) |
| Crude association, RR (95% CI) | Referent | 2.3 (1.3, 4.0) | 0.8 (0.4, 1.4) | 1.0 (0.5, 1.8) | 1.0 (0.5, 1.9) |
| Adjusteda association, RR (95% CI) | Referent | 2.3 (1.2, 4.2) | 0.9 (0.5, 1.6) | 1.0 (0.5, 1.8) | 1.1 (0.6, 2.2) |
aAdjusted for age, sex, diagnosis type, and comorbidities; ED/UC, Emergency department and urgent care; RR, relative risk; CI, confidence interval.
DISCUSSION
The present study is one of the first to examine clusters of health service use among AN/AI persons with dementia in a closed tribal health system. In this study, healthcare services divided into five distinct clusters which helped identify trends that might inform enhancement to current and future services. Sex and comorbid health conditions differed across the five clusters. The two largest clusters were people who use a low amount of all services (26%) and people who use a high amount of primary and specialty care (26%).
The cluster of people who use a low amount of all services had a distinct living situation pattern, that is low ‘self’ and high ‘skilled care facility’ (e.g., assisted living or nursing home) which seems to indicate that a sizeable portion of this cluster receives care outside of the tribal health system as the system does not contain skilled care facilities in the Anchorage area. This may also indicate a relative gap in the provision of tribally operated skilled care facilities in Anchorage.
The cluster of people with high primary and specialty care tended to be younger, living independently, and being prescribed ADRD medications. This may indicate a need for better coordination with family or other care providers as patients experience increasing cognitive or functional impairments. Similarly improved coordination of care or case management with family or care providers would likely benefit the cluster of patients with high emergency or urgent care use. The cluster of people who use high amounts of all services were more likely to be diagnosed with comorbidities of hypercholesterolemia, diabetes mellitus, hypertension, or stroke; less likely to be prescribed a medication for ADRD; and had elevated rates of mortality.
These findings also draw attention to the critical work of prevention in addressing dementia risk and outcomes as multimorbidity was associated with greater service use and increased risk of mortality. Although this service use is concentrated primarily in the all high and high primary and specialty care clusters within the sample, it is less concentrated than in other urban non-AN/AI service settings [27]. Identifying this pattern in patient characteristics earlier can help primary care providers improve care to those patients with ADRD. Further identification of patient characteristic patterns within other clusters may help improve equity in the healthcare system. Compared to other larger urban settings, Anchorage does not have access to a large number of facilities, specialists, or support services. In combination with demographic and comorbidity information, analyses like the present can help policymakers and clinicians to project short- and long-term healthcare service needs, identify deficiencies, and develop plans to maximize available resources. In forecasting demand for services, utilization may rise nonlinearly as rates of comorbidities climb within a population. Additionally, we identified specific interventions that may be underutilized within existing system and of benefit to individual patients. The overall ADRD medication rate of 21% was lower than the national average of 49.3% for incident dementia [28]. The decreased rate was particularly marked amongst the patients with a high use of all services. Medications represent an important and underutilized method to address management of ADRD in this service setting. Additional research may be warranted to investigate this underutilization. However, findings from this study provide a basic roadmap for maximizing the limited services available and provided best standards of care to enhance patient outcomes.
This study had four primary limitations. First, the analysis presented is limited to in-system service use and likely underrepresents all service use by patients. Second, the structure of the deidentified dataset presented challenges. Healthcare service use was structured by calendar year rather than 365-day intervals from the diagnosis, making it impossible to distinguish service use before versus after ADRD diagnosis during the year of diagnosis. The available information for time of death did not permit sufficient precision to conduct a time to event analysis for mortality which may have uncovered additional patterns beyond the included relative risk analysis. It is possible that number of days from diagnosis to death could be calculated in future studies to better understand mortality. We limited our cluster analysis to the services in the year of and following ADRD diagnoses and excluded those who died during that time to mitigate bias due to differing lengths of follow-up. Service use may change the further out one goes from the year of diagnosis, but our study could not assess this. Third, there was a risk of misclassification. Although case definition diagnoses included ICD9 and ICD10 codes, ADRD diagnosis codes often do not capture both the medical and behavioral health codes used at visits to diagnose all ADRD of interest. There was also likely some level of misclassification for variables not routinely updated since initial registration (e.g., marital status). Fourth, too few data points were collected in crucial domains (comorbidities, rehospitalization, and medications). The study did not include comorbidity factors that would line up with a standardized comorbidity index; re-hospitalization, or number days of medications dispensed. Low prescriptions for individuals who used a high amount of all services indicate the need to expand medications included in EHR abstraction for those with severe dementia. This study also had several strengths. The study included data from the largest health care organization serving AN/AI people in Alaska. The study used real world health data in a closed, integrated tribal health system to highlight how individuals using the tribal health system accessed services available to them, or conversely did not. Although some factors were missing for important domains, the dataset included a wide range of demographic and clinical factors from the EHR, reflecting real-world healthcare utilization.
Future research could isolate factors that predict service use following ADRD diagnosis as well as identify other differential health risks between clusters. For example, analysis as to whether cluster membership modifies the relationship between dementia and 30-day readmission. Future studies should also work to address the above limitations and may also include other specialty clinics (e.g., orthopedics or dental), sex-based clusters, and changes in service utilization in the years preceding the diagnosis within each cluster.
CONCLUSION
Cluster analysis was a feasible way to understand the subgroupings of service use for persons with dementia. Clusters helped identify trends that might not be readily apparent to clinical staff. Knowing what percentage of persons with dementia are both people who use the system more often and have higher risk of mortality may be helpful for forecasting clinical healthcare needs and for helping to identify promising targets for intervention.
ACKNOWLEDGMENTS
Authors would like to acknowledge the scholars and faculty of the Native Alzheimer’s Disease Resource Center for Minority Aging Research who reviewed this publication.
FUNDING
Research reported in this publication was supported by the National Institute on Aging and National Institute of General Medical Sciences of the National Institutes of Health under Award Numbers P30AG059295, S06GM123545, and 3S06GM123545-02S1. The content is solely the responsibility of the authors and does not necessarily represent the official views of the National Institutes of Health.
CONFLICT OF INTEREST
The authors have no conflicts of interest to report.
REFERENCES
[1] | U.S. Department of Health and Human Services. National Alzheimer’s Project Act, https://aspe.hhs.gov/national-alzheimers-project-act, Accessed February 24, 2021. |
[2] | Alzheimer’s Association and Centers for Disease Control and Prevention (2019) Healthy Brain Initiative,Road Map for Indian Country. https://www.cdc.gov/aging/healthybrain/pdf/HBI-Road-Map-for-Indian-Country-508.pdf, Accessed February 24, 2021. |
[3] | Alaska Mental Health Trust Authority (2021) A Call for Action: Alaska’s 10-Year Map to Address Alzheimer’s Disease and Related Dementia. https://alaskamentalhealthtrust.org/wp-content/uploads/2021/01/A-Call-To-Action-Alzheimers-Disease-Related-Dementia-10-Year-Map.pdf Accessed February 24, 2021. |
[4] | Goins RT , Pilkerton CS ((2010) ) Comorbidity among older American Indians: The native elder care study. J Cross Cult Gerontol 25: , 343–354. |
[5] | U.S. Department of Health and Human Services IHS, Office of Public Support, Division of Program Statistics (2014) Trends in Indian Health 2014 Edition. https://www.ihs.gov/sites/dps/themes/responsive2017/displayobjects/documents/Trends2014Book508.pdf, Accessed February 24, 2021. |
[6] | Norris T , Vines PL , Hoeffel EM (2012) The American Indian and Alaska Native Population: 2010. U.S. Census Bureau. https://www.census.gov/history/pdf/c2010br-10.pdf. |
[7] | Murray CJ , Atkinson C , Bhalla K , Birbeck G , Burstein R , Chou D , Dellavalle R , Danaei G , Ezzati M , Fahimi A , et al., ((2013) ) The state of US health, 1990-2010: Burden of diseases, injuries, and risk factors. JAMA 310: , 591–608. |
[8] | GBD Dementia Collaborators ((2019) ) Global, regional, and national burden of Alzheimer’s disease and other dementias, 1990-2016: A systematic analysis for the Global Burden of Disease Study 2016. Lancet Neurol 18: , 88–106. |
[9] | James BD , Leurgans SE , Hebert LE , Scherr PA , Yaffe K , Bennett DA ((2014) ) Contribution of Alzheimer disease to mortality in the United States. Neurology 82: , 1045–1050. |
[10] | Qiu C , Kivipelto M , von Strauss E ((2009) ) Epidemiology of Alzheimer’s disease: Occurrence, determinants, and strategies toward intervention. Dialogues Clin Neurosci 11: , 111–128. |
[11] | Gandy S , Duff K ((2000) ) Post-menopausal estrogen deprivation and Alzheimer’s disease. Exp Gerontol 35: , 503–511. |
[12] | Kawas C , Resnick S , Morrison A , Brookmeyer R , Corrada M , Zonderman A , Bacal C , Lingle DD , Metter E ((1997) ) A prospective study of estrogen replacement therapy and the risk of developing Alzheimer’s disease: The Baltimore Longitudinal Study of Aging. Neurology 48: , 1517–1521. |
[13] | Rosenberg RN , Richter RW , Risser RC , Taubman K , Prado-Farmer I , Ebalo E , Posey J , Kingfisher D , Dean D , Weiner MF , Svetlik D , Adams P , Honig LS , Cullum CM , Schaefer FV , Schellenberg GD ((1996) ) Genetic factors for the development of Alzheimer disease in the Cherokee Indian. Arch Neurol 53: , 997–1000. |
[14] | Bennett DA , Yu L , Yang J , Srivastava GP , Aubin C , De Jager PL ((2015) ) Epigenomics of Alzheimer’s disease. Transl Res165: , 200–220. |
[15] | Whitmer RA , Gunderson EP , Quesenberry CP Jr. , Zhou J , Yaffe K ((2007) ) Body mass index in midlife and risk of Alzheimer disease and vascular dementia. Curr Alzheimer Res 4: , 103–109. |
[16] | Chen HY , Panegyres PK ((2016) ) The role of ethnicity in Alzheimer’s disease: Findings from the C-PATH Online Data Repository. J Alzheimers Dis 51: , 515–523. |
[17] | Santoni G , Angleman S , Welmer AK , Mangialasche F , Marengoni A , Fratiglioni L ((2015) ) Age-related variation in health status after age 60.PLoS One 10: , e0120077. |
[18] | Peterson AB , Sarmiento K , Xu L , Haileyesus T ((2019) ) Traumatic brain injury-related hospitalizations and deaths among American Indians and Alaska natives - United States, 2008-2014. J Safety Res 71: , 315–318. |
[19] | Frytak JR , Henk HJ , Zhao Y , Bowman L , Flynn JA , Nelson M ((2008) ) Health service utilization among Alzheimer’s disease patients: Evidence from managed care. Alzheimers Dement 4: , 361–367. |
[20] | Andreakou MI , Papadopoulos AA , Panagiotakos DB , Niakas D ((2016) ) Assessment of health-related quality of life for caregivers of Alzheimer’s disease patients. Int J Alzheimers Dis 2016: , 9213968. |
[21] | Aupperle PM , MacPhee ER , Coyne AC , Blume J , Sanchez B ((2003) ) Health service utilization by Alzheimer’s disease patients: A 2-year follow-up of primary versus subspecialty care. J Geriatr Psychiatry Neurol 16: , 15–17. |
[22] | Alzheimer’s Association (2021) Special Report: Race, Ethnicity, and Alzheimer’s in America. https://www.alz.org/media/Documents/alzheimers-facts-and-figures-special-report.pdf, Accessed February 24, 2021. |
[23] | Institute for Healthcare Improvement (2020) Age-Friendly Health Systems: Guide to Using the 4Ms in the Care of Older Adults. https://www.ihi.org/Engage/Initiatives/Age-Friendly-Health-Systems/Documents/IHIAgeFriendlyHealthSystemsuidetoUsing4MsCare.pdf. |
[24] | Schaefer KR , Noonan C , Mosley M , Smith J , Galbreath D , Fenn D , Robinson RF , Manson SM ((2019) ) Differences in service utilization at an urban tribal health organization before and after Alzheimer’s disease or related dementia diagnosis: A cohort study. Alzheimers Dement 15: , 1412–1419. |
[25] | Hiratsuka VY , Beans JA , Robinson RF , Shaw JL , Sylvester I , Dillard DA ((2017) ) Self-determination in health research: An Alaska Native example of tribal ownership and research regulation. Int J Environ Res Public Health 14: , 13244 |
[26] | Everitt BS , Landau S , Leese M , Stahl D ((2011) ) Cluster Anlaysis, Wiley. |
[27] | Gupta R , Roh L , Lee C , Reuben D , Naeim A , Wilson J , Skootsky SA ((2019) ) The population health value framework: Creating value by reducing costs of care for patient subpopulations with chronic conditions. Acad Med 94: , 1337–1342. |
[28] | Koller D , Hua T , Bynum JPW ((2016) ) Treatment patterns with antidementia drugs in the United States: Medicare Cohort Study. J Am Geriatr Soc 64: , 1540–1548. |