
Health, work, social trust, and financial situation in persons with Usher syndrome type 1
Abstract
BACKGROUND:
Research has demonstrated that persons with Usher syndrome type 1 (USH1) have significantly poorer physical and psychological health compared to a reference group.
PURPOSE:
To explore the relation between work, health, social trust, and financial situation in USH1 compared to a reference group.
MATERIAL:
Sixty-six persons (18–65 y) from the Swedish Usher database received a questionnaire and 47 were included, 23 working and 24 non-working. The reference group comprised 3,049 working and 198 non-working persons.
METHODS:
The Swedish Health on Equal Terms questionnaire was used and statistical analysis with multiple logistic regression was conducted.
RESULTS:
The USH1 non-work group had a higher Odds ratio (95% CI) in poor psychological and physical health, social trust, and financial situation compared to the USH1 work group and reference groups. Age, gender, hearing, and vision impairment did not explain the differences. The relation between the USH1 work and non-work groups showed the same pattern as the reference groups, but the magnitude of problems was significantly higher.
CONCLUSIONS:
Both disability and unemployment increased the risk of poor health, social trust and financial situation in persons with USH1, but having an employment seemed to counteract the risks related to disability.
1Introduction
Health can be defined as a complex interaction between individual factors, activity, participation, and environmental factors [1]. Social inequalities have been shown to be one of the most important determinants of health in high income countries [2].
Health in relation to work has been studied extensively and meta-analyses reveal a strong correlation between unemployment and poor psychological health [3]. Furthermore, research has demonstrated that unemployment is correlated to a higher risk of morbidity and mortality [4, 5]. A significant rise in suicidal behavior has been found in countries where unemployment is increasing [6, 7]. From a public health perspective, health is determined by a complex interaction of social, psychological, and biological factors. In order to understand health inequalities it is necessary to study the effect of legislation, differences in social networks, opportunities for education and employment, as well as access to health care, and differences in lifestyle over a life span. The synergistic interaction of illness and social inequalities increases vulnerability to other illnesses and the risk of poor health [8]. Social inequalities manifested as social exclusion and poor financial situation are therefore both an effect and cause of poor health.
For persons of working age the labor market is not only of importance for economic reasons, but also one of the most important arenas for meeting psychological and social needs [9]. However, the labor market is often a challenge for persons with disabilities. The UN convention on the Rights of Persons with Disabilities (Article 27) recognizes the right to work on an equal basis with others, which implies inclusion and accessibility [10]. It also states that governments should promote realization of the right to work. The inclusion of persons with disabilities in working life has been emphasized by the Organization for Economic Co-operation and Development (OECD) and figures show that persons with disabilities often rely on disability benefits [11, 12]. Research has shown that people with disabilities and employment have higher quality of life, a more positive attitude toward their disability and had higher self-efficacy compared to disabled persons who were unemployed or retired [13]. Western governments, including that of Sweden, have emphasized work as a key route to social inclusion, participation, and contribution to society for people with disabilities [14]. In 2014, persons with self-estimated reduced work capacity in Sweden were employed at a substantially lower rate (55%) compared to the general population (77%) [15].
Persons with single sensory loss, visual impairment or deafness has been studied from a working life perspective. Rydberg has shown that persons with deafness face great challenges on the labor market with great differences between deaf persons and the general population regarding level of education, position on the labor market and disposable income [16]. A similar pattern is shown among persons with visual impairment, where figures has shown a low labor force rate and unemployment at a significantly higher rate compared both to the general population, but also compared to persons with other disabilities [17–19].
1.1Deafblindness
The psychosocial situation of persons with deaf-blindness has been studied showing psychological distress [20] and stigmatization [21]. A review has shown that persons with deafblindness are often described in terms of vulnerability rather than resilience [22]. Recent studies in persons with USH has also demonstrated poor physical and psychological health [23–25] as well as high levels of stress [26]. Dean has shown that depression and loneliness is strongly related to poor health related quality of life and the importance of receiving social support [27]. There is however still a lack of knowledge about health and well-being in this group.
The Nordic definition of deafblindness states: “Deafblindness is a combined vision and hearing impairment of such severity that it is hard for the impaired senses to compensate for each other. Thus, deafblindness is a distinct disability. To varying degrees, deafblindness limits activities and restricts full participation in society. It affects social life, communication, access to information, orientation and the ability to move around freely and safely. To help compensate for the combined vision and hearing impairment, especially the tactile sense becomes important…” [28].
Deafblindness consists of over 200 syndromes with large differences in time of onset, hearing and vision impairment, many organ dysfunctions, and associated health related problems [29].
Usher syndrome (USH), an autosomal recessive disorder that affects hearing, vision and in some cases vestibular function, is the most common cause of deafblindness in working-age adults [30, 31]. The prevalence of USH was estimated to be 3.3 per 100,000 people [32]. However, this figure was based on the knowledge at that time and recent figures from USA estimate the prevalence of 6 per 100,000 [29]. Currently, 13 genes have been identified as causing USH [33], and there are three clinical types (USH 1–3) [34].
Usher syndrome type 1 (USH1) is characterized by congenital profound deafness, bilateral vestibular areflexia, and Retinitis Pigmentosa (RP). RP initially affects the rods and later the cones of the eye, with a progressive degenerative course over the life span. The symptoms are night blindness, limited visual field, light sensitivity, impaired adaptability to light, and poor visual acuity [31, 35–37].
The first language of adults with USH1 is sign language. Cochlear implants were introduced over 20 years ago for children with USH1, which to some extent has changed the first language to spoken language. However, the vast majority of persons with USH1 older than 20 years use sign language.
The progression of RP with impaired vision in semi-dark and dark conditions as well as impairment of the visual field gradually limits the ability to visually read and communicate with sign language. A tactile touch based method is used to understand signs in the absence of visual reading. In tactile signing, the movement of the signing hand is understood by placing the receiver’s hand on that of the person who is signing in order to follow the movements [24].
Wahlqvist [24] found that persons with USH1 had significantly poorer physical and psychological health, as well as problems with social trust and financial situation compared to the general population. However, there were also differences within the USH1 group as some individuals reported better health than others, which could not be explained by differences in hearing and vision [24]. Being in paid employment in relation to health in persons with Usher syndrome type 2 (USH2) has been described in Ehn et al. [38]. Participants with USH2 had a severe hearing loss and mainly communicated with spoken language. The study showed a strong correlation between employment and psychological health [38]. In the present study we will focus on health in relation to work, social trust, and financial situation in a group of persons with USH1 who all use sign language.
2Purpose
The aim was to explore the relation between health, work, and social determinants such as social trust and financial situation in persons with USH1 in comparison with a reference group.
3Materials
The data on persons with deafblindness used in this study are from the Swedish Usher-database, which contains information on persons with Usher syndrome living in Sweden and has been compiled since 1987. At the time of the study the database contained about 400 persons of all ages with USH types 1–3, including information on their hearing, vision, balance, genetics, and medical records.
All persons with USH1 (18–84 years) were invited to answer an extensive questionnaire (Health on Equal Terms, HET) [39]. Of the persons invited, all 66 persons in working age (18–65 years) were included in the study. The participants had a clinical diagnosis of USH and 45% had genetic confirmation of USH1.
The response rate was 47 out of 66 (71%) and the participants, 53% of whom were women, had a mean age of 44 years (20–64 y). 23 were working (USH1 work group), while 24 were on long-term sick leave, had a full (i.e., 100%) disability pension or were unemployed (USH1 non-work group).
3.1Hearing and vision
All visual assessments where conducted at different low vision clinics at the time of the study. Medical reports, including the assessments, were retrieved after authorization by the participants and the medical departments. The records were all assessed by one of the authors CM. The assessment included pedigree and in many cases genetic information to conclude USH1 with autosomal recessive inheritance, audiological assessment in order to establish profound deafness, visual assessment to establish Retinitis Pigmentosa and in some cases vestibular assessment with bilateral vestibular areflexia.
Hearing was assessed by pure-tone audiometry with calculation of the pure tone average for the frequencies 0.5, 1, 2, and 4 kHz (PTA4). Thresholds were classified from mild to profound hearing loss. All persons with USH1 had profound congenital deafness (mean PTA4 99 dB).
The best corrected visual acuity was measured by Snellen chart-based standard tests (0.0–1.0). Visual field tests (Goldmann perimetry) was performed in order to assess peripheral vision. The visual field test was categorized into five visual field phenotypes (1–5) where: category 1 was a normal visual field; category 2 the presence of a partial or complete ring scotoma (the latter either extending or not extending into the periphery); category 3 concentric central field loss with a remaining peripheral island less than one-half of the field circumference; category 4 marked concentric loss <10 degrees; and category 5, no visual field at all (blind) [40].
3.2Reference population
Reference group data were retrieved from an external database administered by the Public Health Agency of Sweden.
Every second year since 2004 the Public Health Agency of Sweden has administered the HET questionnaire (see Methods below) to a simple random sample of the population aged 16–84 years. The reference group comprised 5,738 individuals with or without impairment living in Sweden and was collected in 2007 [41].
To enable comparison with the USH1 group the reference material was reduced to match the age of the USH1 respondents, hence persons older than 65 years were excluded. Respondents reporting one or several disabilities were also excluded, resulting in a final reference population of 3,247 persons aged 18–65 y. The sample was divided into two groups; 3,049 persons who were working (Ref work group) and 198 who were unemployed, on long-term sick leave or had a disability pension, (Ref non-work group) (see Table1).
Table 1
Background data of the USH1 and Reference groups (work and non-work)
| USH1 Work | USH1 Non-Work | Ref Work | Ref Non-Work | |
| N | 23 | 24 | 3049 | 198 |
| Women | 10 (43%) | 15 (63%) | 1677 (55%) | 137 (69%) |
| Mean age (Sd) | 37 (11) | 50 (10) | 41 (14) | 44 (14) |
| Best corrected visual acuity mean (Sd) | 0.6 (0.3) | 0.5 (0.3) | ||
| Visual field category median | 3 | 3 | ||
| RP diagnosed at age (years) mean (Sd) | 15 (9) | 10 (4) |
3.3Non-responders
Of the 66 persons with USH1 who received the HET questionnaire, 19 did not respond. Background data revealed that the mean age of the non-responders was 48 years and 57% were women. They did not differ from the responders in terms of hearing impairment and all met the criteria for profound hearing impairment. However, their visual impairment was more pronounced (category 4) and the best corrected visual acuity was lower (0.3). 68% of the non-responders had a genetic diagnosis.
4Methods
4.1The Health on Equal Terms questionnaire
The 75 questions in the Swedish Public Health survey – Health on equal terms (HET) questionnaire are subdivided into domains; health, living habits, tobacco, gambling, alcohol, financial situation, work, security, social relations, and demographic data. The items in the questionnaire have been validated for construct validity [39].
Twelve questions concerning physical and psychological health, social trust and financial situation were used. The health questions focused on number of days with bad physical or psychological health and number of days with reduced activities of daily living (ADL) in a 30 day period. Two questions pertaining to suicidal behavior (suicide thoughts and suicide attempts) were included, as well as five questions about social trust indicators (refraining from going out alone, not receiving help when needed, no general trust in most people, having no one to share innermost thoughts with, being offended) and two questions about the financial situation (economic difficulties and not having a cash margin of 15,000 SEK for an unforeseen situation). For some of the variables the answers were graded on a three or four point scale, and the number of days from 0–30.
Prior to the analysis, the responses to the items pertaining to physical and psychological health, social trust, and financial situation were all dichotomized as “Problem” and “No problem” in accordance with Boström et al. [39]. All “Yes” responses on the three and four graded scales were coded as “Problem” and all “No” responses as “No problem”. The question concerning “number of bad health days” was also dichotomized in accordance with Boström et al., where 15 or more days was considered poor physical or psychological health [39].
The HET survey was not previously adjusted for persons with visual impairment or who require information in sign language. Hence in practice, this group of potential respondents has to a large extent been excluded from surveys. In the present study several steps were taken to make the material accessible for persons with USH1. Translation of the questionnaires from written Swedish into Swedish Sign Language (SSL) was performed with the help of a professional SSL Interpreter and one of the researchers (MW) and there after filmed in a studio. The written material was also adjusted to make the questionnaire accessible for those who used computer screen readers for magnification or Braille [24].
4.2Analysis
Nonparametric Pearson chi-square testing with a significance level of p < 0.05 was employed in the analysis of the USH1 work and USH1 non-work groups (Figs. 1–3). A series of multiple logistic regression models were examined to explore the association between (1) health, (2) social trust, (3) financial situation, and group (1) USH non-work, (2) USH1 work, (3) Ref. non-work, (4) Ref. work, while controlling for age and gender. The models were evaluated by Odds Ratios (OR) with corresponding 95% Confidence Intervals (95% CI) to examine the odds related to the groups: USH1 non-work, USH1 work, Ref. non-work and Ref. work, where the Ref. work group served as reference category in the analyses. Sensitivity at 90% specificity (i.e., how capable the model is of identifying individuals with experience of the dependent variable, while at the same time only incorrectly classifying one out of ten individuals without experience of the dependent variable as having such experience) and Area Under the Curve (AUC) were used to examine the overall strength of the models. AUC value of 0.60 or higher may be considered relevant, while a value of 0.80 in general indicates a well-discriminating model [42]. The SPSS 22 statistical program was used for analyses.
Fig.1
Psychological and physical health variables in the USH1 non-work, USH1 work, Ref. non-work, and Ref. work groups (%), * = significant (p < 0.05) difference between USH1 work and USH1 non-work groups.
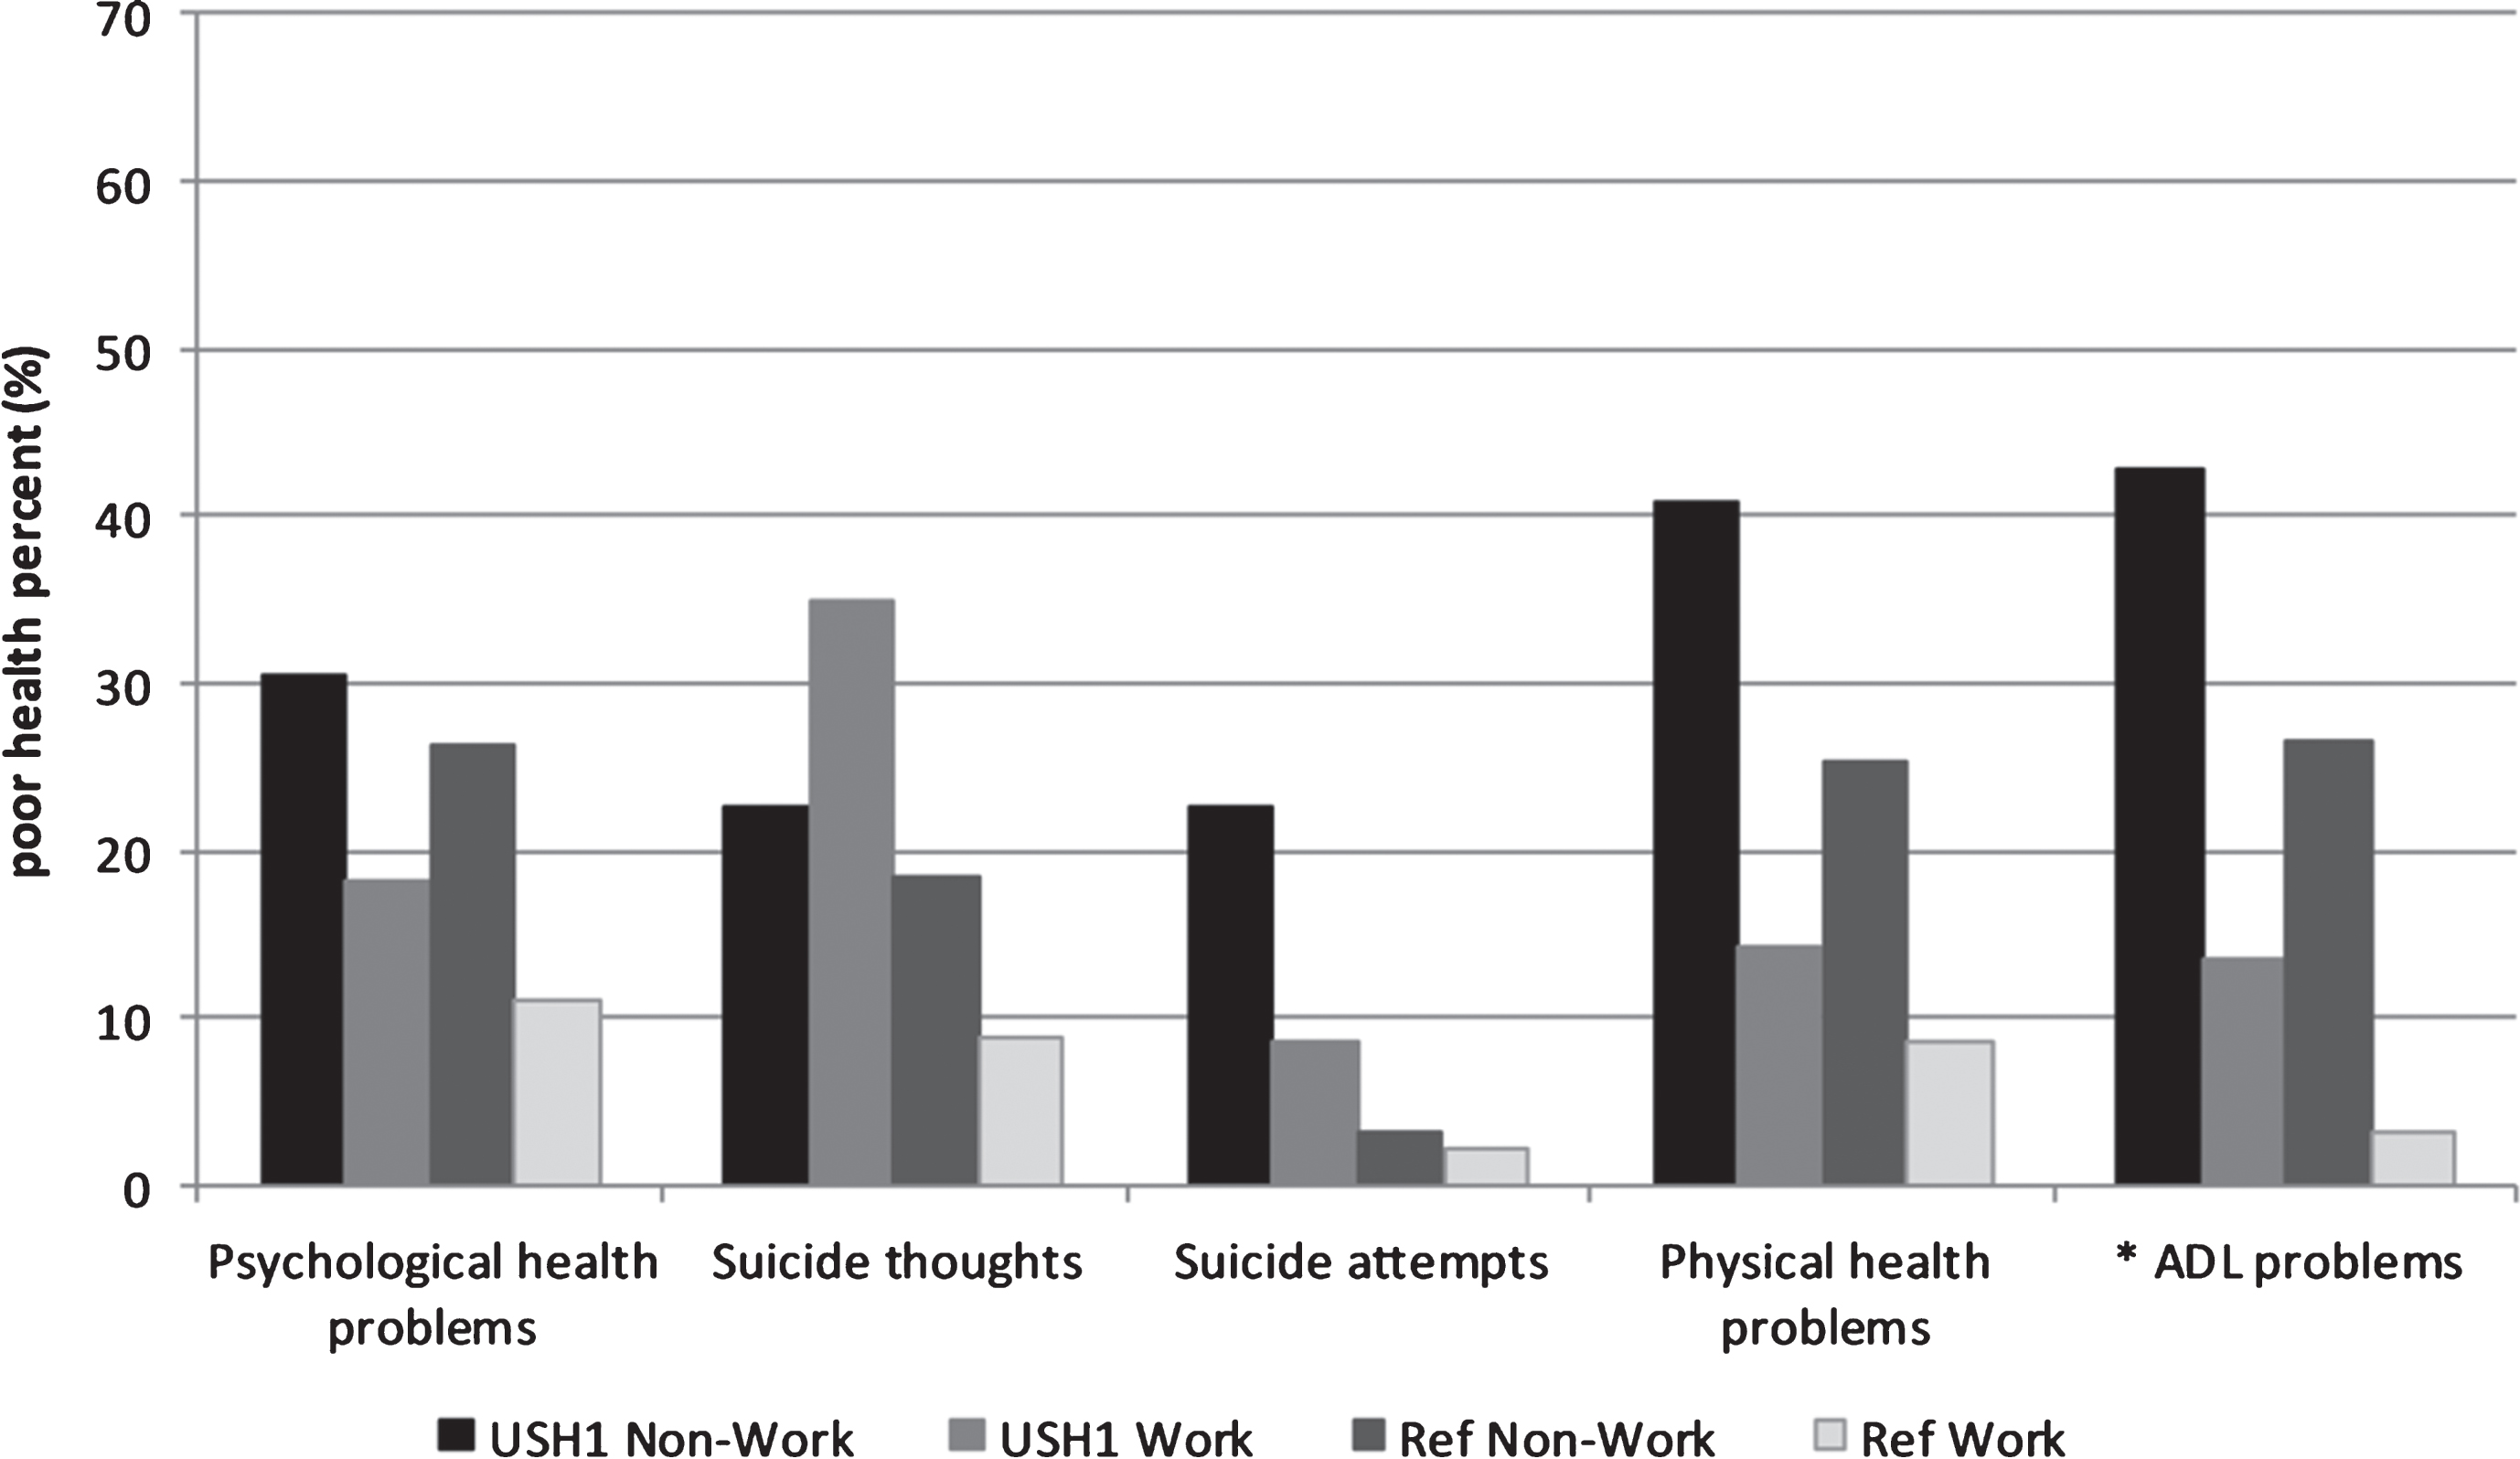
Fig.2
Social trust variables in the USH1 non-work, USH1 work, Ref. non-work and Ref. work groups (%), * = significant (p < 0.05) difference between USH1 work and USH1 non-work groups.
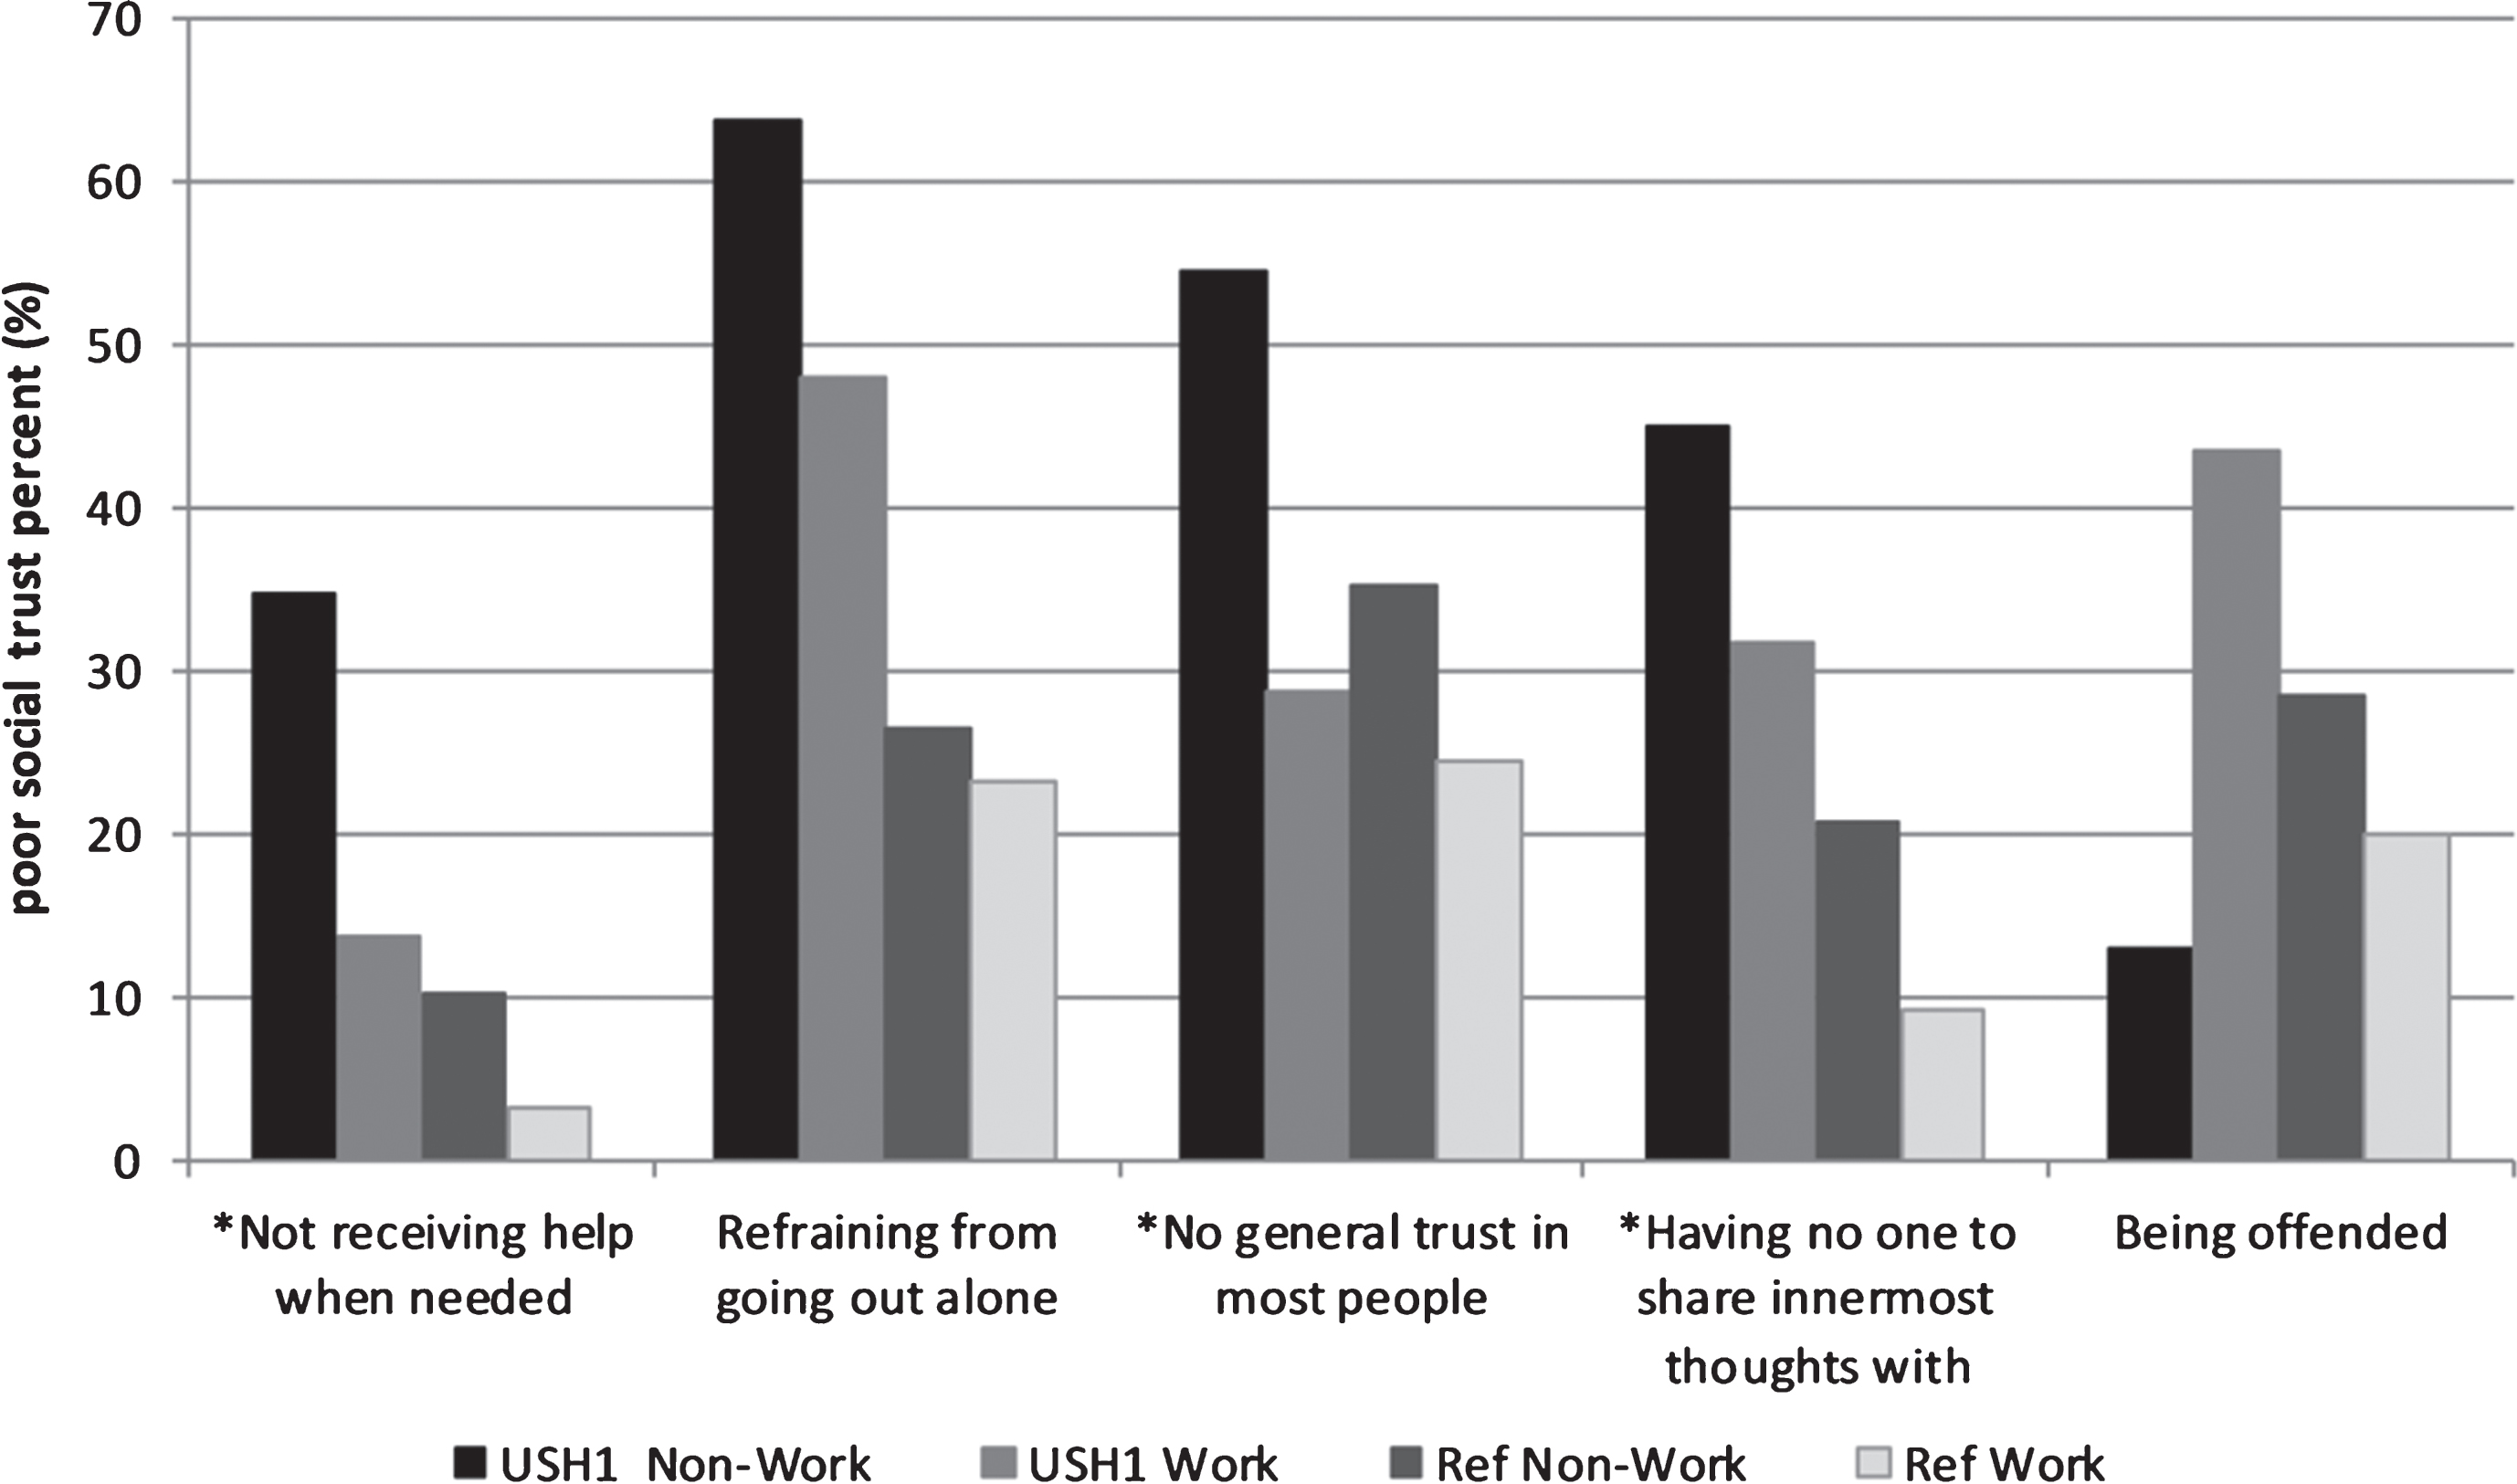
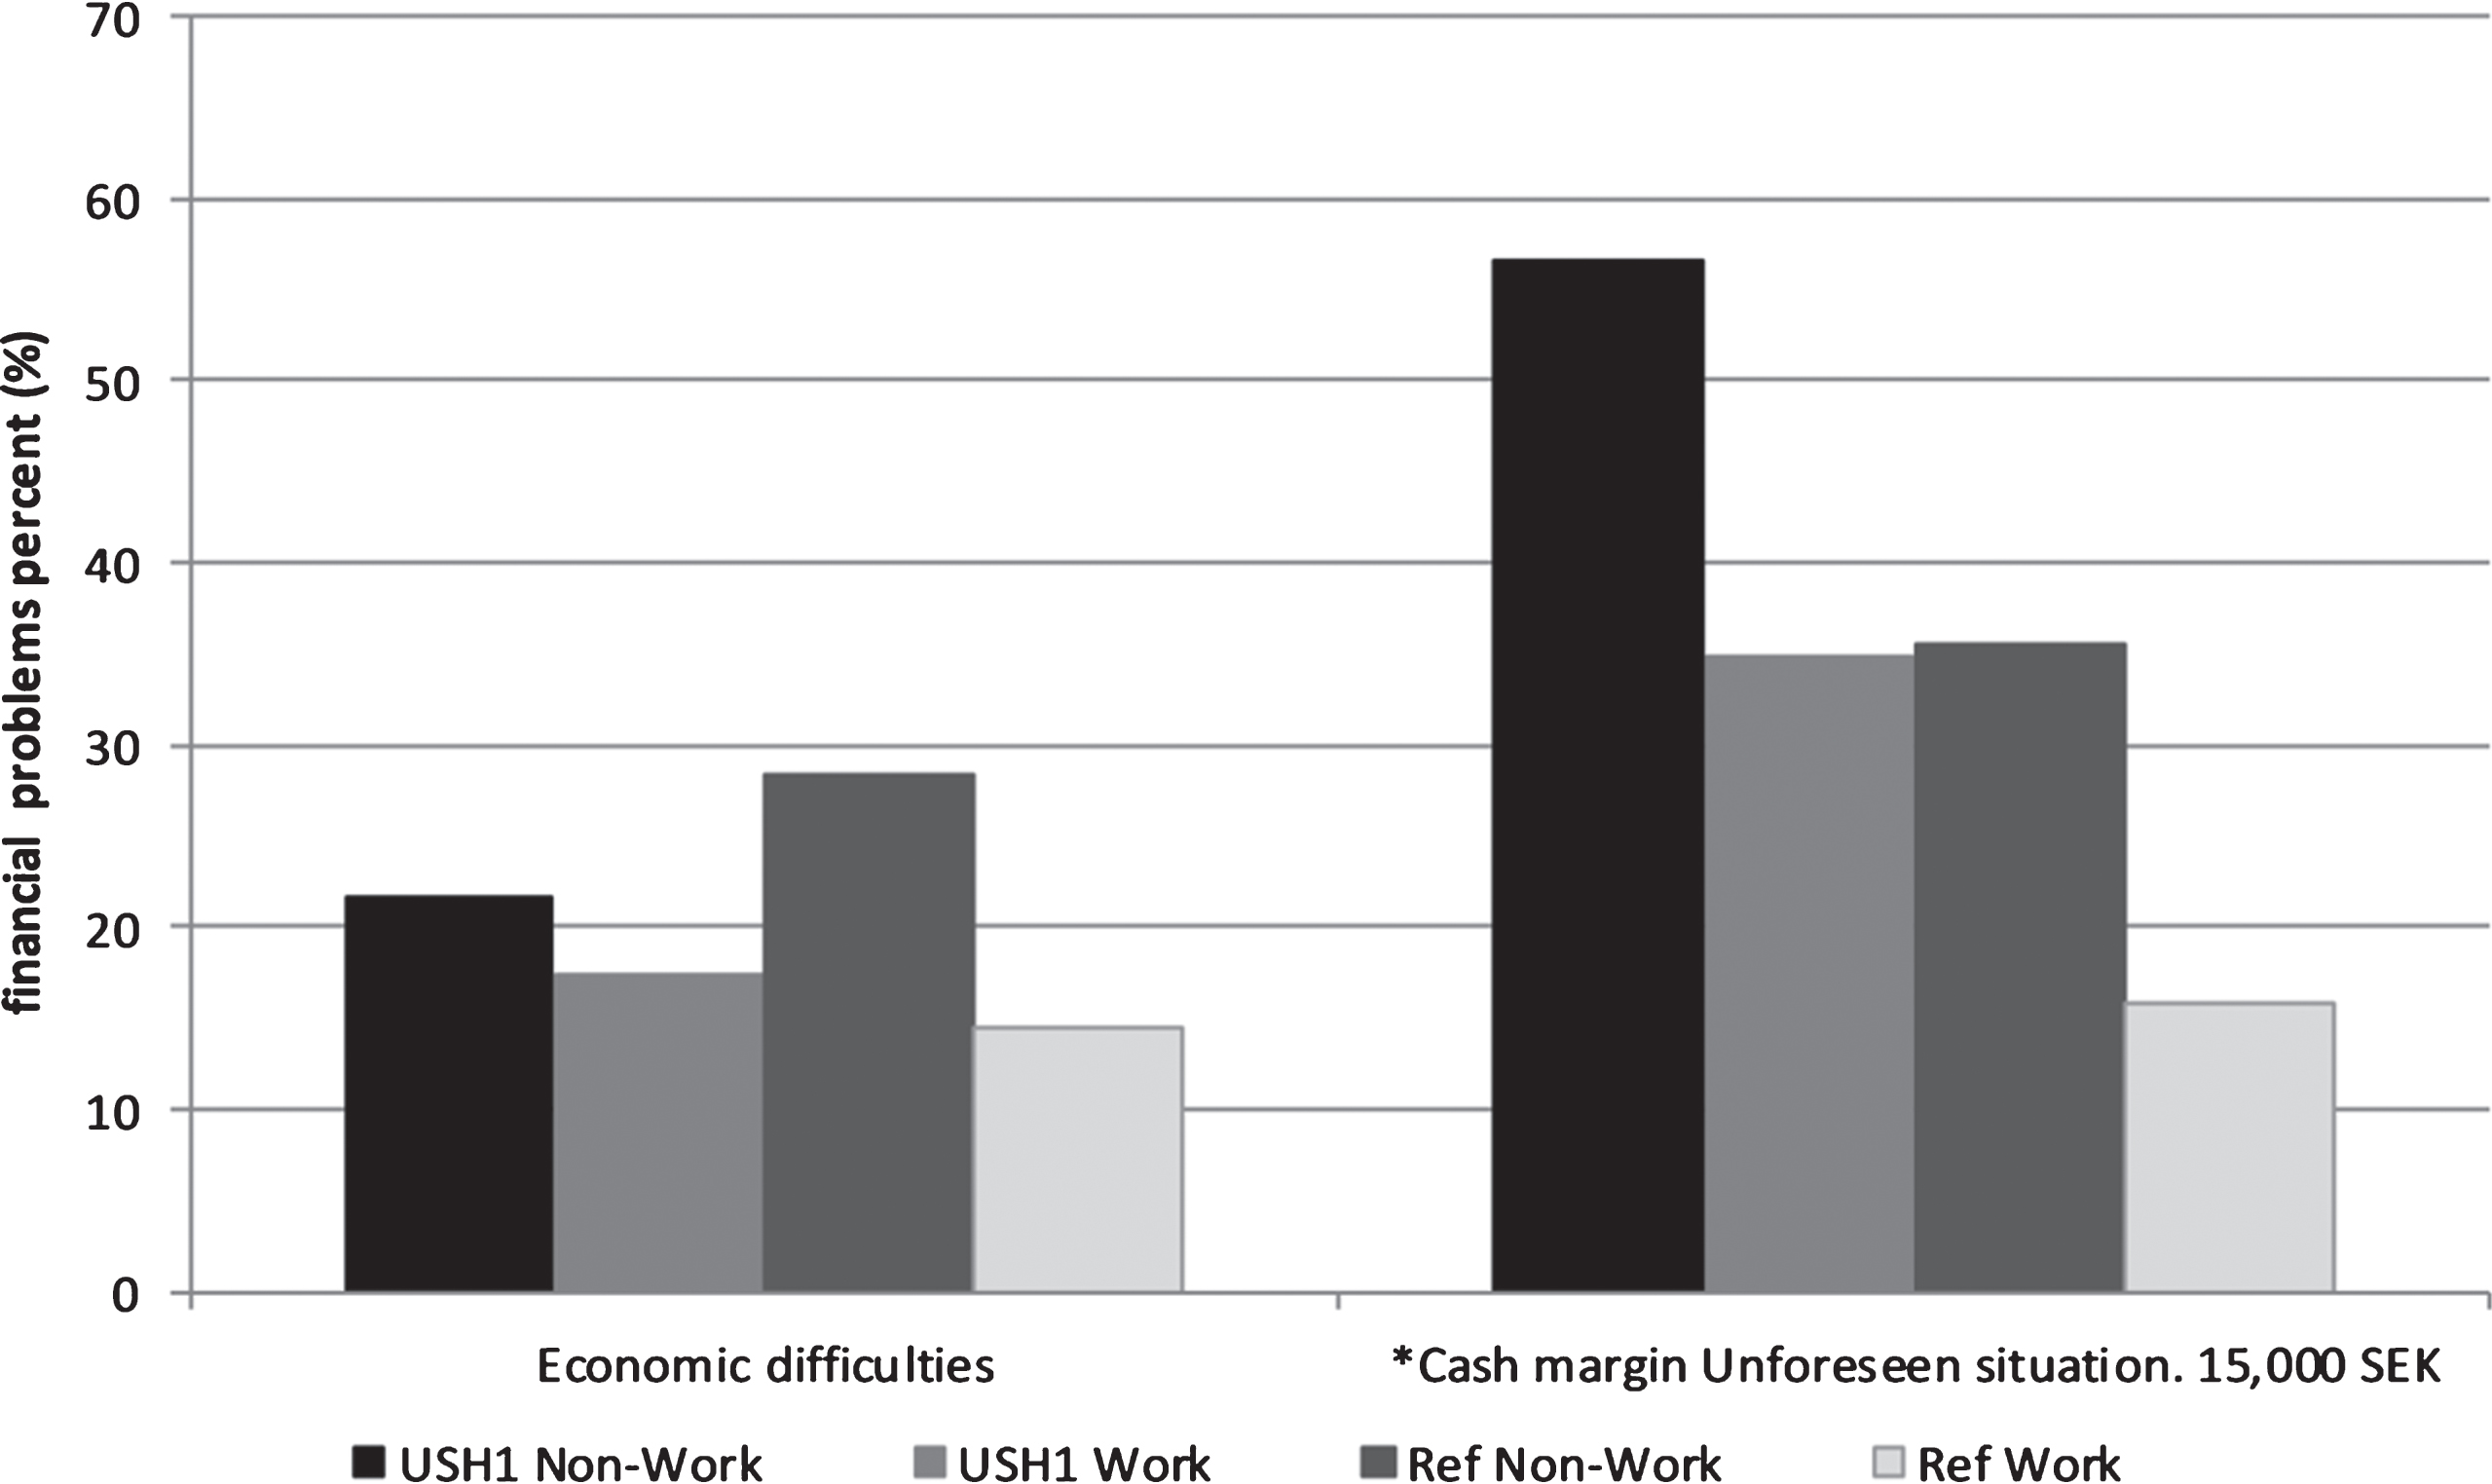
Fig.3
Financial situation variables in the USH1 non-work, USH1 work, Ref. non-work and Ref. work groups (%), * = significant (p < 0.05) difference between USH1 work and USH1 non-work groups.
4.3Ethical approval
The study was approved by the Government based regional ethics Committee of Örebro and Uppsala, Sweden. (Nr. 2012/515). All persons with USH1 signed informed consent forms to participate in clinical and genetic research on Usher syndrome.
5Results
The results showed the same median value of visual field (category 3) in both USH1 work group and the USH1 non-work group (Table 1). The USH1 work group was younger than the non-work group. There was no significant difference in best corrected visual acuity and a non-significant difference in age at diagnosis between the work and the non-work group (Table 1).
5.1Psychological and physical health
The results pertaining to health showed that both the USH1 non-work group and Ref. non-work group had more frequent problems with psychological health, physical health, and ADL compared to the work groups (Fig. 1). A significant difference in ADL problems was found between the USH1 work group and USH1 non-work group (Fig. 1). Suicide thoughts were much more common in both USH1 groups compared to the reference groups. The USH1 work group reported a higher percentage of suicide thoughts than the USH1 non-work group. However, reported suicide attempts were more common in the USH1 non-work group but the occurrence in the USH1 work group was also high compared to the reference groups (Fig. 1). Cross-tabs of variables in the USH1 non-work group showed that of the five persons who reported “Suicide attempts”, four had “Physical health problems”. Of the eight who reported “Physical health problems” seven also had “ADL problems”. In the analysis of USH1 work group variables, nine persons reported having suicide thoughts, seven of whom also reported “Fatigue”.
5.2Social trust
Social trust differed between all four groups (Fig. 2). In general, the USH1work and USH1 non-work groups had higher scores, indicating more problems regarding social trust. Concerning the item “No general trust in most people” the Ref. non-work group and the USH1 non-work group both had higher scores compared to the Ref. work and USH1 work groups (Fig. 2). Significant differences between the USH1 work and USH1 non-work groups were found for the variables “Not receiving help when needed”, “No general trust in most people”, and “No one to share innermost feelings with”. There was a different pattern for the item “Being offended”, with the USH1 work group reporting more problems than the USH1 non-work group and the reference groups (Fig. 2). Cross tabulations of variables in the USH1non-work group demonstrated that out of eight persons reporting “No one to share innermost feelings with”, five also reported having “No general trust in most people”. The six persons who reported “Not receiving help when needed” all reported “No one to share innermost feelings with”. Of the 13 persons who reported “Refraining from going out alone” nine also indicated that they had “No general trust in most people”. In the USH1 work group, none of the nine persons who reported “Being offended” had problems with “Receiving help when needed” but two reported having “No general trust in most people”.
5.3Financial situation
The financial situation of the four groups differed with regard to how they rated economic difficulties (Fig. 3). The USH1 non-work and Ref. non-work groups reported more difficulties managing daily finances compared to the USH1 work and Ref. work groups. A significant difference was also found between the USH1 work and USH1 non-work groups in terms of cash margin and ability to manage an unforeseen situation (Fig. 3). Of the 11 persons in the USH1 non-work group who reported a poor “Cash margin”, nine also reported “Refraining from going out alone”. Of the 12 persons who reported “No general trust in most people”, nine also indicated that they had a poor “Cash margin”.
5.4Relations between USH1 and work associated with health, social trust, and financial situation
The association of groups (USH1 non-work, USH1 work, Ref. non-work, Ref. work) with health variables, social trust indicators, and financial situation measures, controlled for gender and age, are presented in Table 2.
Table 2
Multiple logistic regression models of the association of group (Usher No Work, Usher Work, Reference No Work, Reference Work) with health variables, social trust indicators and financial situation measures (with control for gender and age, odds ratios not shown)
| Dependent variables | Odds Ratios (95% CI) | Sensitivity | AUC | |||
| USH1 Non-Work | USH1 Work | Ref. Non-Work | Ref Work | (at 90% specificity) | ||
| Psychological and physical health variables | ||||||
| Psychological health problems | 3.86 (1.56–9.55) | 1.82 (0.61–5.47) | 2.81 (2.00–3.97) | 1 | 0.19 (0.15–0.35) | 0.63 (0.60–0.66) |
| Suicide thoughts | 3.60 (1.30–9.95) | 5.54 (2.30–13.35) | 2.29 (1.56–3.38) | 1 | 0.22 (0.18–0.40) | 0.63 (0.60–0.67) |
| Suicide attempts | 15.23 (5.31–43.69) | 4.59 (1.04–20.24) | 1.36 (0.58–3.19) | 1 | 0.24 (0.16–0.42) | 0.66 (0.60–0.72) |
| Physical health problems | 6.93 (2.92–16.45) | 1.82 (0.53–6.24) | 3.47 (2.44–4.92) | 1 | 0.22 (0.18–0.40) | 0.59 (0.55–0.62) |
| ADL problems | 22.99 (9.37–56.45) | 4.69 (1.36–16.19) | 10.38 (7.09–15.20) | 1 | 0.43 (0.36–0.79) | 0.72 (0.68–0.77) |
| Social trust variables | ||||||
| Refraining from going out alone | 7.79 (2.89–20.97) | 5.19 (2.02–13.36) | 0.98 (0.69–1.39) | 1 | 0.24 (0.21–0.44) | 0.73 (0.71–0.75) |
| Not receiving help when needed | 16.48 (6.72–40.42) | 4.64 (1.34–16.07) | 3.67 (2.20–6.12) | 1 | 0.28 (0.21–0.50) | 0.65 (0.60–0.70) |
| No general trust in most people | 4.98 (2.12–11.71) | 1.11 (0.43–2.90) | 1.82 (1.33–2.48) | 1 | 0.21 (0.18–0.39) | 0.62 (0.60–0.64) |
| Having no one to share innermost thoughts with | 8.55 (3.44–21.24) | 4.31 (1.72–10.82) | 2.96 (2.04–4.29) | 1 | 0.20 (0.16–0.37) | 0.63 (0.60–0.66) |
| Being Offended | 0.77 (0.22–2.61) | 3.04 (1.31–7.06) | 1.62 (1.17–2.26) | 1 | 0.21 (0.18–0.39) | 0.63 (0.61–0.65) |
| Financial situation variables | ||||||
| Economic difficulties | 2.30 (0.84–6.31) | 1.14 (0.38–3.41) | 2.50 (1.79–3.50) | 1 | 0.19 (0.16–0.36) | 0.66 (0.63–0.68) |
| Cash margin, Unforeseen situation 15.000 SEK | 10.80 (4.59–25.40) | 2.83 (1.16–6.89) | 3.22 (2.33–4.44) | 1 | 0.28 (0.24–0.52) | 0.70 (0.67–0.72) |
95% CI = 95% confidence interval, AUC = Area Under the Curve.
For physical and psychological health problems, the non-work groups had the strongest association (largest ORs). For suicide attempts, the USH1 groups showed higher associations compared with the reference groups. Overall, the presence of ADL problems was most strongly related to the non-work groups. The ADL problems variable also showed the highest Area Under the Curve (AUC).
In the social trust variables, refraining from going out alone was most strongly associated with USH1, irrespective of work. The OR for Not receiving help when needed was largest in the USH1 non-work group but also increased in the USH1 work group and Ref. non-work group. The same pattern appears for having no one to share innermost feelings with. For the variable No general trust in most people, both of the non-work groups had larger ORs.
For economic difficulties the reference non-work group was associated with an increased OR, while there was no such significant association for any of the USH1 groups. However, compared to the Ref. work group the OR for poor Cash margin of 15,000 SEK for unforeseen situation was larger in all the other groups, with the USH1 non-work group having the highest OR.
6Discussion
In this study the purpose was to explore the relation between health, work, and social determinants such as social trust and financial situation in persons with USH1 in comparison with a reference group. The main results are that the pattern found among persons in the two USH1 groups is more or less the same as among the two groups in the reference population. However, the differences between the USH1 groups and the reference population groups concern the magnitude of the problems, which are significantly greater in the USH1 groups and in many cases substantial. This indicates that the importance of being employed and what it means in terms of social inclusion does not only depend on having a severe impairment such as USH1, demonstrating that health is related to both the disability and work. The same mechanisms related to employment are present in persons with USH1, but the impairment itself further accentuates and reinforces them.
Studies of the psychological and social situation of persons with deafblindness have revealed psychological distress [20], and persons with Usher syndrome have been shown to exhibit both physical and psychological problems compared to a reference population [23, 24, 26]. Persons with USH1 are profoundly deaf and rely on sign language with extreme challenges regarding communication [43]. Rydberg et al. [16, 44] have shown that persons with deafness face great challenges on the labor market. A comparison between deaf persons and a general population regarding position on the labor market, sources of revenue, and disposable income showed that the deaf population had a much poorer position in all aspects compared to the general population.
Health and work have been studied among persons with USH2 (severe hearing loss but mainly using spoken language and severe visual problems). The results showed significant differences in both physical and psychological health between those working and not working with a similar pattern to the present USH1 results [38]. The USH1 participants have congenital deafness and use sign language, while persons with USH2 mostly rely on spoken language. The visual loss creates serious problems in sign language communication. Hence, one might expect that a plausible explanation of the outcome of this study would be differences in the combination of deafness and vision loss. However, all participants in both USH1 groups had a profound hearing loss, an average vision field loss of 10–15 degrees, and nearly the same low visual acuity, hence disability cannot explain the differences in health.
A meta-analysis of psychological health and employment indicated that unemployment is a significant cause of poor psychological health [3]. In the USH1 non-work group, 30% reported poor psychological health compared to 18% in the USH1 work group. These figures are consistent with the finding that persons with USH2 report significantly poorer psychological health [38]. The present results show an OR in the USH1 non-work group and Ref. non-work group of 3.86 and 2.81 respectively, compared to the Ref. work group. However, the OR for the USH1 work group was 1.82, i.e., a substantially lower OR than among the Ref. non-work group (3.47), which does not reveal any causal effects but indicates the importance of work per se.
An important aspect of psychological health is suicidal ideation and studies have shown that unemployment leads to an increased risk of suicidal behavior [6, 7].
spaceskip =.22em plus.1em minus.1emOur results reveal that suicidal thoughts were more common among the USH1 work group than the USH1 non-work group. The opposite was the case with the reference groups. The result also differed from what was found in USH2 [38], where suicidal thoughts were more common among those without work. In the USH1 work group most of those who reported having suicide thoughts also reported fatigue. Schneider [45] and Möller [43] have described a non-functioning communication situation for persons with deafblindness. The possibility of using visual sign language is limited in the USH1 work group and the only way to compensate is to use tactile sign language. Communication demands in working life lead to situations where the USH1 work group is exposed to non-functioning communication, which might explain the high rate of fatigue and suicidal thoughts. However, at present we lack knowledge of the causal relation between non-functioning communication, fatigue, and thoughts of suicide. This calls for further research.
spaceskip =.20em plus.1em minus.1emIn the USH1 population we found a higher rate of suicide attempts compared to both reference groups. Among the USH1 non-work group almost 23% had made at least one suicide attempt compared to 9% in the USH1 work group. When comparing the results between the Ref. work group and the USH1 non-work group, the latter exhibited an increased OR of 15.23 for suicide attempts. It is important to focus on this aspect of psychological health as studies have shown a strong correlation between suicide attempts and suicide [46]. Moreover, recent studies have revealed that persons with severe visual impairment have an increased risk of suicide than the average population [47].
Unemployed persons have an increased risk of morbidity and mortality [4, 5]. In the USH1 non-work group 40% reported poor physical health compared to a mere 14% in the USH1 work group. Surprisingly, when analyzing specific variables that usually cause poor physical health and might lead to persons leaving the labor market, we did not find any that could explain the differences between the USH1 non-work and the USH1 work groups. However, the response pattern pertaining to ADL in the USH1 non-work group is very similar to that of physical health problems. Of eight persons in the USH1 non-work group who reported poor physical health, seven also reported problems with ADL.
spaceskip =.18em plus.1em minus.1emADL problems affect the ability to perform at work or take part in other daily activities. The USH1 non-work group reported a much higher frequency of ADL problems (43%) than the work group (13%). In a study by Damen [48], persons with USH often had problems with daily living skills. Damen found that these problems were not correlated with vision loss, but increased with age [48]. Our study shows that the difference in ADL-related problems remains after controlling for age, hence it seems that age is not a significant variable for explaining the difference. The ADL showed the largest OR 22.99 (Table 2), indicating a general vulnerability in the USH1 non-work group.
An increased risk of social exclusion and isolation has been shown in persons with deafblindness related to difficulties accessing information and in face to face interaction [43]. Moreover, the experiences of persons with deafblindness have been described in terms of perceived “hostility, due to inaccessibility, isolation and exclusion from the physical and social environment” [45] and stigmatization [21]. The consequence of this state is ontological insecurity [24, 49]. One aspect of social inclusion is social trust. In the variable Not receiving help when needed, 34% of the USH1 non-work group reported obstacles and 54% had No general trust in most people. The pattern is the same for a third indicator, No one to share innermost thoughts with. As these factors are closely related, i.e., there is a strong correlation between them, we can conclude that a rather large proportion of the USH1 non-work group is extremely vulnerable and subject to social exclusion. The variable Refraining from going out alone was reported by 64% of the USH1 non-work group and 51% of the USH1 work group, indicating that this aspect of exclusion is related to the impairment and that the visual difficulties in combination with deafness lead to insecurity, irrespective of work.
Being disadvantaged in seeking or maintaining employment correlates with dissatisfaction in social interactions, while a stronger sense of well-being in working life is related to satisfying social interaction [50]. The correlation between work and social inclusion is strong and the magnitude of this correlation in our study indicates that it is extremely important in the USH1 group. However, there is one indicator, being offended, where the USH1 work group reported problems to a higher degree than the USH1 non-work group. Analysis revealed that this indicator was not related to the other social trust indicators for the USH1 work group, implying that persons who report being offended do not necessarily experience problems in the other social trust indicators. The labor market exposes persons with USH1 to colleagues and supervisors with different attitudes towards persons with deafblindness. There are many situations in which persons with USH1 cannot interact, thus communication failure might lead to misunderstandings and even cruel behavior, which the person with USH1 describes as offensive. Persons in the USH1 non-work group might not encounter these kinds of situation to the same extent.
Banbra et al. [4] have shown that the welfare state to some extent reduces the impact of health risks due to the economic consequences of no longer being able to work. In our study, the USH1 groups and the reference groups experienced the same economic difficulties. The difference between the USH1 work and non-work groups is less compared to the difference between the Ref. non-work and Ref. work groups. The magnitude is also fairly low, about one in five reported economic difficulties. However, the second financial situation indicator, not having a cash margin (15,000 SEK), revealed a different picture, where 56% of the USH1 non-work group had problems compared to 34% in the USH1 work group. The cash margin problem indicates that many persons with USH1 have economic difficulties when an unforeseen situation arises, especially those without work. It seems that the welfare state only covers the basic economic needs of the USH1 non-work group, making this group extremely vulnerable. The OR of the USH1 non-work group was 10.80 compared to the USH1 work group with an OR of 2.83. The poor cash margin reported by persons in the USH1 non-work group correlates with problems in social trust, indicating that persons in the USH1 non-work group may not have a social network that can support them in a situation of unforeseen expenditure.
The result reveals a heterogeneous group of persons with USH1, where many exhibit problems pertaining to health, social trust or financial situation. A few persons who did not work exhibited extreme vulnerability, as they reported major psychological, physical, and social trust problems as well as financial problems. The fact that one problem led to another calls for further studies
Work in relation to health is underscored in this study, where working seems to be of great importance in understanding and possibly preventing health problems. It is plausible to interpret the results as demonstrating that being in the labor force is important for persons with USH1. However, further in-depth studies are vital in order to cast light on the causal relation between work and the well-being of persons with USH1.
6.1Limitation
In our study the number of participants with USH1 may be considered low, but the total group of people with USH1 in Sweden is small. From calculations based on the most relevant prevalence estimations, the estimated prevalence of USH1 among people of working age (18–65 years) is approximately 240 [29, 32]. To the best of our knowledge, the number of participants in this study is by far the largest in a work- and health-related study of deaf persons with Usher syndrome.
Statistical analysis of small groups is a challenge as small groups are often associated with low statistical power and limited ability to obtain less than strong effects. The wider confidence intervals for the two USH1 groups (Table 2) reflect that these groups are smaller than the reference groups. Our sample is based on a register and there is a risk of selection bias. Furthermore, as non-responders had somewhat worse vision than responders the results may reflect a group of persons with slightly better vision than average for persons of working age with USH1.
7Conclusions
Persons with USH1 who do not work are at higher risk of poor psychological and physical health, social trust, and financial situation. The relation between the USH1 work and non-work groups shows the same pattern as that of the reference groups, but the magnitude of the problems was significantly higher in the USH1 groups. Both disability and unemployment increase the risk of poor health, social trust and financial situation in persons with USH1, but having a work seems to counteract the risks related to disability. The importance of work for persons with USH1 cannot be underestimated but the underlying mechanisms require further research.
Conflict of interest
We declare no conflict of interest.
Acknowledgments
The authors thank the personnel at the Swedish Audiological Research Centre, Örebro and a special thanks to Agneta Anderzén-Carlsson, Annika Behm, Hanna Hagsten, Ann-Marie Helgstedt, Margareta Landin, Jonas Birkelöf and Tobias Åslund. This study was funded by Örebro University and The Swedish Research council (Linneus-HEAD-grant).
References
[1] | Bircher J . Towards a dynamic definition of health and dis-ease. Med Health Care Philos. (2005) ;8: (3):335–41. |
[2] | Marmot M . Social determinants of health inequalities. Lancet (London, England). (2005) ;365: (9464):1099–104. |
[3] | Paul KI , Moser K . Unemployment impairs mental health: Meta-analyses. J Vocat Behav. (2009) ;74: (3):264–82. |
[4] | Bambra C , Eikemo TA . Welfare state regimes, unemploy-ment and health: A comparative study of the relationship between unemployment and self-reported health in 23 European countries. J Epidemiol Community Health. (2009) ; 63: (2):92–8. |
[5] | Dorling D . Unemployment and health. BMJ. (2009) ; 338: :b829. |
[6] | Stuckler D , Basu S , Suhrcke M , Coutts A , McKee M . The public health effect of economic crises and alternative pol-icy responses in Europe: An empirical analysis. Lancet. (2009) ;374: (9686):315–23. |
[7] | Nordt C , Warnke I , Seifritz E , Kawohl W . Modelling suicide and unemployment: A longitudinal analysis covering 63 countries, 2000-11. Lancet Psychiatry. (2015) ;2: (3):239–45. |
[8] | Diderichsen F , Andersen I , Manuel C , Andersen AM , Bach E , Baadsgaard M , Bronnum-Hansen H , Hansen FK , Jeune B , Jorgensen T , Sogaard J . Health inequality-determinants and policies. Scand J Public Health. (2012) ;40: (8 Suppl): 12–105. |
[9] | Blustein DL . The role of work in psychological health well-being: A conceptual, historical, and public policy per-spective. Am Psychol. (2008) ;63: (4):228–40. |
[10] | United Nations. Convention on the rights of persons with disabilities. [cited 2017 10 Feb]. Available from: http://www.un.org/disabilities/documents/convention/convopt prot-e.pdf |
[11] | OECD. Sickness, disability and work: Breaking the barriers. Sweden : Will the recent reforms make it? 2009 [cited 2017 10 Feb]. Available from: http://www.oecd.org/social/soc/42265699.pdf |
[12] | OECD. Sickness, disability and work: Keeping track on the economic downturn: Background paper: High-level forum, Stockholm, 14-15 may 2009. 2009 [cited 2017 10 Feb]. Available from: http://www.oecd.org/employment/emp/42699911.pdf |
[13] | Martins AC . Using the International Classification of Func-tioning, Disability and Health (ICF) to address facilitators and barriers to participation at work. Work. (2015) ;50: (4): 585–93. |
[14] | The Swedish agency for participation (MFD). Swedish disability policy: Strategy 2011-2016. [cited 2017 28 Aug]. Available from: http://www.mfd.se/other-languages/ english/follow-up-and-statistics/policy-monitoring/ evaluation-and-analysis-of-disability-policy-from-2011- to-2016/ |
[15] | Situationen på arbetsmarknaden förpersoner med funktionsnedsättning 2015: The labour marketsituation for people with disabilities 2015. 2016 [cited 2017 10 Feb]. Available from: http://www.scb.se/Statistik/ _Publikationer/AM0503_2015A01_BR_AM78BR1601.pdf |
[16] | Rydberg E , Gellerstedt LC , Danermark B . The position of the deaf in the Swedish labor market. Am Ann Deaf. (2010) ;155: (1):68–77. |
[17] | Benoit C , Jansson M , Jansenberger M , Phillips R . Disability stigmatization as a barrier to employment equity for legally- blind Canadians. Disabil Soc. (2013) ;28: (7):970–83. |
[18] | Kelly SM . Labor force participation rates among working- age individuals with visual impairments. J Vis Impair Blind. (2013) ;107: (6):509–13. |
[19] | Sherrod CE , Vitale S , Frick KD , Ramulu PY . Association of vision loss and work status in the United States. JAMA Ophthalmol. (2014) ;132: (10):1239–42; quiz 43-6. |
[20] | Bodsworth SM , Clare ICH , Simblett SK , UK D . Deafblind- ness and mental health: Psychological distress and unmet need among adults with dual sensory impairment. Br J Vis Impair. (2011) ;29: (1):6–26. |
[21] | Hersch MA . Deafblind people, communication, inde-pendence, and isolation. J Deaf Stud Deaf Educ. (2013) ;18: (4):446–63. |
[22] | Simcock P . One of society's most vulnerable groups? A systematically conducted literature review exploring the vulnerability of deafblind people. Health Soc Care Com-munity. (2017) ;25: (3):813–39. |
[23] | Wahlqvist M , Möller C , Möller K , Danermark B . Physical and psychological health in persons with deafblindness that is due to Usher syndrome type II. J Vis Impair Blind.;107: (3):207–20. |
[24] | Wahlqvist M , Möller K , Möller C , Danermark B . Physical and psychological health, social trust, and financial situation for persons with Usher syndrome type 1. Br J Vis Impair. (2016) ;34: (1):15–25. |
[25] | Wahlqvist M , Möller C , Möller K , Danermark B . Implications of deafblindness: The physical and mental health and social trust of persons with Usher Syndrome Type 3. J Vis 818 Impair Blind. (2016) ;110: (4):245–56. |
[26] | Högner N . Psychological stress in people with dual sensory impairment through Usher Syndrome Type II. J Vis Impair Blind. (2015) ;36: (3):185–97. |
[27] | Dean G , Orford A , Staines R , McGee A , Smith KJ . Psychosocial well-being and health-related quality of life in a UK population with Usher syndrome. BMJ open. (2017) ;7: (1):e013261. |
[28] | Nordic Centre for Welfare and Social Issues. The Nordic definition of deafblindness. 2016 [cited 2017 10 Feb]. Available from: http://www.nordicwelfare.org/PageFiles/ 992/nordic-definition-of-deafblindness.pdf |
[29] | Kimberling W , Möller C Genetic hearing loss associated with eye disorders. In: Toriello HV, Smith SD, Gorlin RJ, editors. Hereditary hearing loss and its syndromes. 3rd ed. Oxford: Oxford University Press; (2013) . pp. 267–321. |
[30] | Möller C . Deafblindness: Living with sensory deprivation. Lancet. (2003) ;362: (Suppl):s46–7. |
[31] | Pennings R Hereditary deaf-blindness, clinical and genetic aspects [dissertation]. Nijmegen, Netherlands: Radboud University; (2004) . |
[32] | Sadeghi M , Kimberling WJ , Tranebjoerg L , Möller C . The prevalence of Usher syndrome in Sweden: A nationwide epidemiological and clinical survey. Audiol Med. (2004) ;2: (4):220–8. |
[33] | Mathur P , Yang J . Usher syndrome: Hearing loss, retinal degeneration and associated abnormalities. Biochim Bio- phys Acta. (2015) ;1852: (3):406–20. |
[34] | Millan JM , Aller E , Jaijo T , Blanco-Kelly F , Gimenez-Pardo A , Ayuso C . An update on the genetics of usher syndrome. J Ophthalmol. (2011) ;2011: :417217. |
[35] | Kimberling WJ , Möller C . Clinical and molecular genetics of Usher syndrome. J Am Acad Audiol. (1995) ;6: (1):63–72. |
[36] | Hartong DT , Berson EL , Dryja TP . Retinitis pigmentosa. Lancet. (2006) ;368: (9549):1795–809. |
[37] | El-Amraoui A , Petit C . The retinal phenotype of Usher syn-drome: Pathophysiological insights from animal models. Comptes Rendus Biologies. (2014) ;337: (3):167–77. |
[38] | Ehn M , Möller K , Danermark B , Möller C . The relationship between work and health in persons with Usher Syndrome Type 2. J Vis Impair Blind. (2016) ;110: (4):233–44. |
[39] | Boström G , Nyqvist K Objective and background of the questions in the national public health survey: Health on equal terms. (2010) [cited 2014 8 Apr]. Available from: https://pdfs.semanticscholar.org/9c5b/384d31cd984579a63 221ec1d2c36157dd840.pdf |
[40] | Grover S , Fishman GA , Anderson RJ , Alexander KR , Derlacki DJ . Rate of visual field loss in retinitis pigmentosa. Ophthalmology. (1997) ;104: (3):460–5. |
[41] | Boström G Hälsa på lika villkor? Hälsa och livsvillkor bland personer medfunktionsnedsättning. Rapport/Statens Folkhälsoinstitut; (2008) :17: . Östersund: Statensfolkhälsoinstitut; (2008) . |
[42] | Steyerberg EW , Vickers AJ , Cook NR , Gerds T , Gonen M , Obuchowski N , Pencina MJ , Kattan MW . Assessing the performance of prediction models: A framework for tra-ditional and novel measures. Epidemiology (Cambridge, Mass.). (2010) ;21: (1):128–38. |
[43] | Möller K Impact on participation and service for persons with deafblindness [dissertation]. Orebro: Örebro universitet; (2008) http://www.diva-portal.org/smash/get/ diva2:135788/FULLTEXT02.pdf |
[44] | Rydberg E , Gellerstedt LC , Danermark B . Deaf people's employment and workplaces – similarities and differences in comparison with a reference population. Scand J Disabil Res. (2011) ;13: (4):327–45. |
[45] | Schneider J . Becoming deafblind. Negotiating a place in a hostile world [Ph Thesis, University of Sydney]. (2006) [cited 2017 10 Feb]. Available from: http://ses.library. usyd.edu.au/bitstream/2123/4011/1/01jm-schneider-2006- thesis.pdffront.pdf |
[46] | Skogman K , Alsen M , Ojehagen A . Sex differences in risk factors for suicide after attempted suicide-a follow-up study of 1052 suicide attempters. Soc Psychiatry Psychiatr Epidemiol. (2004) ;39: (2):113–20. |
[47] | Meyer-Rochow VB , Hakko H , Ojamo M , Uusitalo H , Timonen M . Suicides in visually impaired persons: A nation-wide register-linked study from finland based on thirty years of data. PLoS One. (2015) ;10: (10):e0141583. |
[48] | Damen GWJA , Krabbe PFM , Kilsby M , Mylanus EAM . The Usher lifestyle survey: Maintaining independence: A multi-centre study. Int J Rehabil Res. (2005) ;28: (4):309–20. |
[49] | Danermark BD , Möller K . Deafblindness, ontological secu-rity, and social recognition. Int J Audiol. (2008) ;47: (Suppl 2):S119–S23. |
[50] | Crisp R . Gender differences in the perceptions ofpsychoso- cial experiences reported by persons with disabilities. Aust Occup Ther J. (2002) ;49: (4):188–99. |


