
Using a fuzzy comprehensive evaluation method to determine product usability: A test case
Abstract
BACKGROUND: In order to take into account the inherent uncertainties during product usability evaluation, Zhou and Chan [1] proposed a comprehensive method of usability evaluation for products by combining the analytic hierarchy process (AHP) and fuzzy evaluation methods for synthesizing performance data and subjective response data. This method was designed to provide an integrated framework combining the inevitable vague judgments from the multiple stages of the product evaluation process.
OBJECTIVE AND METHODS: In order to illustrate the effectiveness of the model, this study used a summative usability test case to assess the application and strength of the general fuzzy usability framework. To test the proposed fuzzy usability evaluation framework [1], a standard summative usability test was conducted to benchmark the overall usability of a specific network management software. Based on the test data, the fuzzy method was applied to incorporate both the usability scores and uncertainties involved in the multiple components of the evaluation. Then, with Monte Carlo simulation procedures, confidence intervals were used to compare the reliabilities among the fuzzy approach and two typical conventional methods combining metrics based on percentages.
RESULTS AND CONCLUSIONS: This case study showed that the fuzzy evaluation technique can be applied successfully for combining summative usability testing data to achieve an overall usability quality for the network software evaluated. Greater differences of confidence interval widths between the method of averaging equally percentage and weighted evaluation method, including the method of weighted percentage averages, verified the strength of the fuzzy method.
1Introduction
Zhou and Chan [1] proposed a universal method of usability evaluation for products by combining the analytic hierarchy process (AHP) and fuzzy evaluation methods for synthesizing performance data and subjective response data. This universal method aims at deriving a two-layer comprehensive evaluation index that is structured hierarchically within the framework of ISO 9241 part 11 [2], which defines usability in terms of three major components, viz. effectiveness, efficiency, and user satisfaction; scored by Post-Study System Usability Questionnaire (PSSUQ) with respect to System Usefulness, Information Quality, and Interface Quality [3, 4]. As shown in Fig. 1, the weights of usability components at corresponding layers were elicited using the method of AHP in the proposed method [1]. After collecting data for corresponding metrics in the framework, the evaluation appraisals were computed by using the fuzzy comprehensive evaluation technique model to characterize fuzzy human judgments. Another goal of the Zhou and Chan paper [1] was to demonstrate theoretically the generality of the fuzzy usability evaluation method by showing that any set of standard usability attributes can be adopted and the same process can be applied to obtain a comprehensive evaluation. However, it is not enough to have a theory, it is necessary to test how successfully it can be applied in practical cases and to test the strength of the general methodological framework.
According to the Zhou and Chan study [1], the fuzzy comprehensive evaluation technique was found to be able to combine usability metrics for objective performance data and subjective data from scale questionnaire methods. In order to illustrate the effectiveness of the model, a case study based on summative usability testing is presented in this study. In this case, specific network management software was used for the test, and this software was designed and developed using an integrated user-centered design approach [5]. Before the software was launched, a standard summative usability test was carried out in a standard usability testing lab to benchmark the overall usability of the product [6–8]. In line with the comprehensive usability evaluation framework proposed by Zhou and Chan [1], the first part of the study here was to collect data on effectiveness, efficiency, and user satisfaction. Then based on the data of summative usability test, the fuzzy method was used to incorporate both the usability scores and uncertainties involved in the multiple components of the evaluation.
In the next section of the current study, a comparison was made between the proposed fuzzy evaluation framework and conventional methods traditionally used widely in usability practice. Conventionally, one simple and useful technique for combining metrics scores on different scales is based on percentage, which is called Combining Metrics Based on Percentages in Tullis and Albert’s book [9]. With use of the method, in many cases the evaluated factors or measures are weighted equally (namely averaging percentage with equal weights) but sometime an adjustment can be employed by using different weights to calculate the averages for the purpose of business goals of product or usability activities (namely weighted percentage averages). According to the previous study of Zhou and Chan [1], the universal framework integrated two main points: weighting evaluation factors or metrics with the method of analytic hierarchy process (AHP), and combining a comprehensive or single score with the fuzzy approach. Therefore, the two methods of combining metrics based on percentage i.e. averaging percentage and weighted percentage averages were selected to compare with the fuzzy usability evaluation framework in this paper.
2Application of the fuzzy evaluation technique: A case study
This section will show us how to use the fuzzy evaluation technique proposed by Zhou and Chan [1] to benchmark the overall usability of one network management software. Using the method of lab-based usability test, this case test was conducted for a usability team in a telecom company. This case study will focus on the application of the fuzzy usability evaluation model. Like the fuzzy evaluation technique proposed in [1] aimed to solve practical usability evaluation issue, the current study will constitute to link this attempt through to the job of usability professionals in the real world application. Details about the fuzzy evaluation model and process in usability or user experience practice can be found in the theoretical study of Zhou and Chan [1].
2.1Methods
2.1.1Participants
All participants were informed about the study by the experimenter reading a pre-prepared introduction, and they were all required to sign an informed consent form if they agreed to participate in the study. Sixteen users, who were all familiar with and used the test software, and had more than two years of professional experiences, participated in the tests. They were all males, aged 22 to 32 (M ean = 27.19, S tandard D eviation = 3.66) and considered to be target users of the software. The participants all took part voluntarily and all were ensured that their response would be anonymous. The tests took approximately one hour to complete, and each participant was paid one hundred Chinese Yuan for participating.
2.1.2Experimenters
There were three experimenters for the tests; one was a facilitator for conducting the tests, and the other two were observers. The facilitator had more than three years of experience in conducting usability testing, and the observers had at least six months of usability professional experience. They were all trained on use of the product by the software development team.
2.1.3Equipped usability laboratory
The tests were conducted in a typical usability laboratory with two soundproof rooms (one for testing, the other for observation). The rooms were separated by one-way mirrors. All performance activities of the participants were captured by video cameras.
2.1.4Test tasks
Based on results from a task analysis, which was conducted as an important usability activity in an earlier phase of design, fifteen tasks, e.g. selection of the interface to be used, were chosen for testing by the user-centered design team. The team consisted of the system developers, marketing specialists, and usability engineers for the product. Each task was allocated the shortest or ideal completion time as well as the longest allowable time for performance by the team. The tasks were selected to cover the typical functions of the software, and were organized as five test scenarios such as “log in and user management”, “parameter set and modify”, and so on [7, 8].
2.1.5Procedure
In each test, the participant was asked to complete the tasks as shown in the scenarios. At the end of the tasks, each participant was instructed to fill out the Post-Study System Usability Questionnaire (PSSUQ). He or she was then debriefed, and any usability problems that the participant reported were recorded. The complete test procedure lasted approximately one hour.
2.1.6Data collection
Data on task success, task completion time and user satisfaction were collected. According to Zhou and Chan [1], a task was considered a success as a combination of accuracy, errors and completeness. Using the proposed operational definitions shown in Table 1, task success was rated by the two observers independently with a numerical score ranging from 0 to 1. The task time was separately recorded by the two observers. In addition, possible usability problems were recorded.
2.2Results
2.2.1Preparatory statistic
In this case, average success was computed by dividing the sum of all the task successes by the numbers of tasks, and then averaging it over the two observers. Task completion time was obtained by summing all tasks times, and then averaging over the two observers. The absolute values of the total task time exhibited more variability and therefore were converted using a transformation. In line with the theoretical framework proposed by Zhou and Chan [1], the converted task time can be calculated using the formula: 2- (original task time / expected shortest task time). The result will be a value in the intervals (–∞, 0), [0, 1], or (1, 2).
Based on the study by Lewis [4], the PSSUQ rules for calculating the score for user satisfaction were as follows: System Usefulness was scored by averaging the responses to eight items (for example, “It was simple to use this system”, Information Quality was scored with averaging the responses to seven items (for example, “The system gave error messages that clearly told me how to fix problems”), and Interface Quality was scored with averaging the responses to three items (for example, “I liked using the interface of this system”. Each item was rated on a 7-point scale of “strongly disagree” to “strongly agree”.
After processing as above, the original data could be converted to preparatory data as presented in Table 2.
2.2.2Fuzzy comprehensive evaluation
According to the theoretical evaluation framework proposed by Zhou and Chan [1], the mappings from U (i.e., evaluation vector) to V (i.e., appraisal vector) should be calculated first. In the proposed fuzzy usability evaluation framework [1], the semi-trapezoid and trapezoidal distribution was used to construct mapping functions to characterize fuzzy measure values. Using Equations (9)-(13) in the Zhou and Chan paper [1], with threshold parameters i.e. the values of vi and ci, in the framework, the membership function of task success and converted task time could be plotted as shown in Fig. 2. Thus, the value of average task success was ranked as very poor, poor, medium, good, and excellent with corresponding degrees ranged in the interval [0, 1].
For example, the process illustrated in Table 3 shows the membership degree for each of the corresponding grades for task success. After the processes of rank summing and normalization, rj was calculated as the appraisal vector in the appraisal matrix for the corresponding cluster in the evaluated hierarchy. As shown in Table 3, the effectiveness of the system was calculated as Beffectiveness=(0, 0, 0, 0.371, 0.629). Similarly, efficiency was calculated as Befficiency=(0.227, 0.163, 0.253, 0.073, 0.284).
With respect to user subjective satisfaction, the proposed evaluation model identified the threshold value vi as being (1, 2, 3.5, 5.5, 6.5, 7) [1]. In a similar way, the relationship mapping for the three factors i.e. system usefulness, information quality, and interface quality, was plotted (Fig. 3). Thus, with these three mappings the appraisal matrix for user satisfaction was calculated as:
(1)
According to Zhou and Chan [1], the weight vector of user satisfaction was determined as W = (0.312, 0.198, 0.490). Therefore, in line with Equation (2) and (3) in [1], the fuzzy evaluation of user satisfaction can therefore be calculated as follows:
(2)
By combining the evaluation vectors of effectiveness, efficiency, and user satisfaction, the appraisal matrix for the overall usability could be obtained. Therefore, with the weight vector of elements in the usability evaluated matrix as W=(0.443, 0.170, 0.387), the top-cluster evaluation for overall usability was also calculated using Equation (2) and (3) in Zhou and Chan [1] as follows:
(3)
This is the final appraisal vector. According to the maximum membership principle, the conclusion was that the usability quality of the product was “good”. However, stakeholders of the user experience project want to know an evaluation ‘score’ for benchmarking or comparing among products in practice. In addition, the membership degree to “excellent” was also high, so the “maximum membership principle” may lead to a loss of information about membership degrees to the other four grades. Therefore, the appraisal vector could be defuzzified to a comprehensive score [10]. In this study, we defined ‘very poor’, ‘poor’, ‘medium’, ‘good’, ‘excellent’ in appraisal grading score as 31, 50, 67, 82, and 95, respectively, so the appraisal vector B can be defuzzified according to the following formula [10]:
(4)
Where a is the defuzzified score, and, a1 = 31, a2 = 50, a3 = 67, a4 = 82, a5 = 95, bi is the appraisal vector [10]. So the overall usability of the software evaluated in this study can be presented as:
(5)
This shows that the usability of the software was between good and excellent.
3Comparison between the fuzzy evaluation and conventional methods
In order to test the reliability of the fuzzy usability evaluation framework, a comparison was made between the fuzzy method Zhou and Chan [1] and two typical conventional methods Combining Metrics Based on Percentages [9]. Confidence intervals are extremely important to usability professionals [6, 9, 11] and have been used to illustrate the reliability of small sample size usability tests e.g. usability problem discovery, user performance measures such as task completion rate [12]. According to Sauro and Lewis’s statement [12], confidence interval provides both a measure of location and precision, that is, an estimation with a narrower confidence would be more precise than a wider one. Generally, the confidence level and the sample characteristics (i.e., variability of the sample, and the sample size) can affect the width of a confidence interval [12]. With remaining a constant confidence level and sample size, the method of data analysis can be a factor in affecting the width of a confidence interval. The data from the usability test case will be used again in this section. Since only sixteen participants were tested, the reliability of these three methods will be compared using confidence interval width for different sample sizes. In the usability community, Lewis used the Monte Carlo method to simulate usability problem discovery rates to examine how to use a suitable method for adjusting usability problem-discovery rates from small sample sizes [11]. Similar, this method was used here to produce usability testing data for different sample sizes, and then comparisons made.
3.1Method
With this Monte Carlo simulation procedure, Matlab was used to sample data from the case study to produce each metric i.e. task success, task time, system usefulness, information quality, and interface quality, independently for data from each simulated participant with a sample size of 16. Within the data simulation procedure, the ranges of the true values measured in the usability test case were designed as boundaries for each metric, i.e. task success ranged from 0.93 to 0.99, task time ranged from 310.5 seconds to 814.5 seconds, information quality ranged from 4.00 to 6.43, interface quality ranged from 4.33 to 6.67, and system usefulness ranged from 5.38 to 7.0. The simulation procedure generated a total of 100 cases with the sample size of 16.
3.2Results
In the first step for preparing analysis, the methods of ‘averaging percentage with equal weights’ and ‘weighted percentage averages’ were used to convert metrics to a percentage for each participant in each simulation case. For example in Table 4, the two methods were used to combine usability data for the actual case. In each simulation case, three evaluation methods, including the fuzzy approach, can then be used, to calculate each participant’s overall score on the product. Following this preparatory work, CONFIDENCE function in Excel was used to sample confidence interval width at the 95% confidence level for each method. Therefore, as illustrated in Table 5, all confidence interval width data was simulated for any sample size from a 1 to 16 range with the different evaluation methods.
Figure 4 shows plots of the average of confidence interval width by evaluation methods and sample size. Overall, the figure shows that (1) confidence interval width at 95% confidence level tends to be the smallest for all sample sizes when conducting fuzzy evaluation, and the confidence interval width is greatest for the averaging percentage method, (2) as the sample size increases, the differences amongst the confidence interval widths tend to reduce especially for the methods of weighted averaging percentage and fuzzy evaluation.
The significance of the above observations was examined by t-test. The result showed that statement (1) above was supported, and the t-test indicated that the width difference between any two methods was significant for any sample size, t (198)≥14.74, p < 0.001. Statement (2) above was partially supported. For the methods of fuzzy evaluation and weighted percentage averages, the confidence interval width differences between sample sizes of N12 and N13, N13 and N14, N14 and N15, and N15 and N16 were not significant, t (198)≤1.87, p > 0.05. For the method of averaging percentage, no significant differences were found between sample sizes of N14 and N15, and N15 and N16, t (198)≤1.92, p > 0.05. For any other two sample sizes, the differences of confidence interval width were significant for any evaluation method, t (198)≥2.03, p < 0.05.
4Discussion
By following the procedures described in the fuzzy evaluation technique by Zhou and Chan [1], this study succeeded in combining summative usability test data to achieve an overall usability quality for the specific network management software used for the tests here. The two-layer evaluation structure used in this evaluation technique tends to be a common usability index, which may improve the technique’s applicability and universality. As discussed in Zhou and Chan [1], the calculations in the proposed technique are apt to be rather complex for practical use. To overcome this, a usability team in industry may use automatic procedures to run the computations, including the processes to identify parameters in the technique. The current case study indicated that the fuzzy evaluation technique would be particularly useful for comparing the usability or usability quality among different products.
Another goal of this study was to illustrate the advantages of the fuzzy evaluation technique in measuring usability uncertainty. Overall, the fuzzy approach can capture the uncertainties inherent in the usability evaluation, and the advantage of the method over the percentage methods was verified here with significantly smaller confidence interval widths for combining different usability.
Firstly, unlike existing usability evaluation methods such as Combining Metrics based on Percentage in terms of rigidly combining usability metrics [9], the fuzzy method used a trapezoidal member function for structuring the fuzzy evaluation matrix, as well as weighting the relative importance of evaluated elements at corresponding evaluated layer. Determining the weights of different evaluation factors should be a pre-requisite for almost all usability methods but the advantages of weighting evaluation factors haven’t been explained well for the usability community. In the current method, the weights of elements were quantified systematically by the analytic hierarchy process (AHP), which has been shown to be successful in other areas of evaluation [13–15]. Greater differences of confidence interval widths between the method of averaging equally percentage and weighted evaluation method, even including the method of weighted percentage averages, indicated that it is very important to weight evaluated factors when combining different metrics into a comprehensive usability evaluation score.
The proposed approach was used for combining the AHP, fuzzy evaluation, and the trapezoidal mapping function to compute the overall usability. The comparisons of confidence interval widths indicated that the proposed fuzzy evaluation technique can evidently decrease the margin for possible evaluation errors. Furthermore, the fuzzy evaluation method has no specific requests for data samples and system types. This is very desirable for usability evaluation in real world, because usability is often evaluated based on different measurements. Small samples are used frequently even when summative usability testing is conducted in usability practice. These findings indicate that use of the fuzzy approach provides benefits by estimating the true population value by combining metrics for the overall usability of a single product. This study illustrated the fuzzy approach can benefit usability practice in the various fields of usability evaluation [16, 17].
Conflict of interest
The authors have no conflict of interest to report.
Acknowledgments
This research was supported by the National Natural Science Foundation of China (NSFC, 31271100 and 71420107025). The funders had no role in study design, data collection and analysis, decision to publish, or preparation of the manuscript.
Thanks to the anonymous reviewers for their very helpful comments and suggestions regarding an earlier version of this paper.
References
[1] | Zhou RG , Chan AHS . Using a fuzzy comprehensive evaluation method to determine product usability: A proposed theoretical framework. Work: A Journal of Prevention, Assessment & Rehabilitation (2017) ;56: (1):9–19. |
[2] | ISO W. 9241-11. Ergonomic requirements for office work with visual display terminals (VDTs). The International Organization for Standardization (1998) )45. |
[3] | Lewis JR . IBM computer usability satisfaction questionnaires: Psychometric evaluation and instructions for use. International Journal of Human-Computer Interaction (1995) ;7: (1):57–78. |
[4] | Lewis JR . Psychometric evaluation of the PSSUQ using data from five years of usability studies. International Journal of Human-Computer Interaction (2002) ;14: (3-4):463–88. |
[5] | Vredenburg K , Isensee S , Righi C . User-Centered Design: An Integrated Approach. Prentice Hall: New Jersey. (2001) . |
[6] | Nielsen J . Usability engineering. 1st ed. Morgan Kaufmann: San Francisco; (1993) . |
[7] | Barnum CM . Usability Testing and Research. Longman Publications: New York; (2002) . |
[8] | Rubin J , Chisnell D . Handbook of usability testing: How to plan, design and conduct effective tests. John Wiley & Sons; (2008) . |
[9] | Tullis T , Albert B . Measuring the User Experience: Collecting, Analyzing, and Presenting Usability Metrics 2nd ed. Morgan Kaufmann Publisher Inc: San Fransisco; (2013) . |
[10] | Ying-Feng K , Ling-Show C . Using the fuzzy synthetic decision approach to assess the performance of university teachers in Taiwan. International Journal of Management (2002) ;19: (4):593. |
[11] | Lewis JR . Evaluation of procedures for adjusting problem-discovery rates estimated from small samples. International Journal of Human-Computer Interaction (2001) ;13: (4):445–79. |
[12] | Sauro J , Lewis JR . Quantifying the user experience Practical statistics for user research. Elsevier; (2012) . |
[13] | Sauro J , Kindlund E . A method to standardize usability metrics into a single score. In: Proceedings of the SIGCHI conference on Human factors in computing systems. ACM Press: New York; (2005) . pp. 401–409. |
[14] | Hsiao SW , Chou JR . A Gestalt-like perceptual measure for home page design using a fuzzy entropy approach. International Journal of Human-Computer Studies (2006) ;64: (2):137–56. |
[15] | Mitta DA . An application of the analytic hierarchy process: A rank-ordering of computer interfaces. Human Factors: The Journal of the Human Factors and Ergonomics Society (1993) ;35: (1):141–57. |
[16] | Freire LL , Arezes PM , Campos JC . A literature review about usability evaluation methods for e-learning platforms. Work: A Journal of Prevention, Assessment & Rehabilitation (2012) ;41: (Suppl 1):1038–44. |
[17] | Friesen EL , Theodoros D , Russell TG . Usability-for-one. Work: A Journal of Prevention, Assessment & Rehabilitation (2015) ;52: (1):211–3. |
Figures and Tables
Fig.1
A hierarchy structure of the evaluated indexes for usability measure (SysUse = System Usefulness, InfoQual = Information Quality, IntQual = Interface Quality).
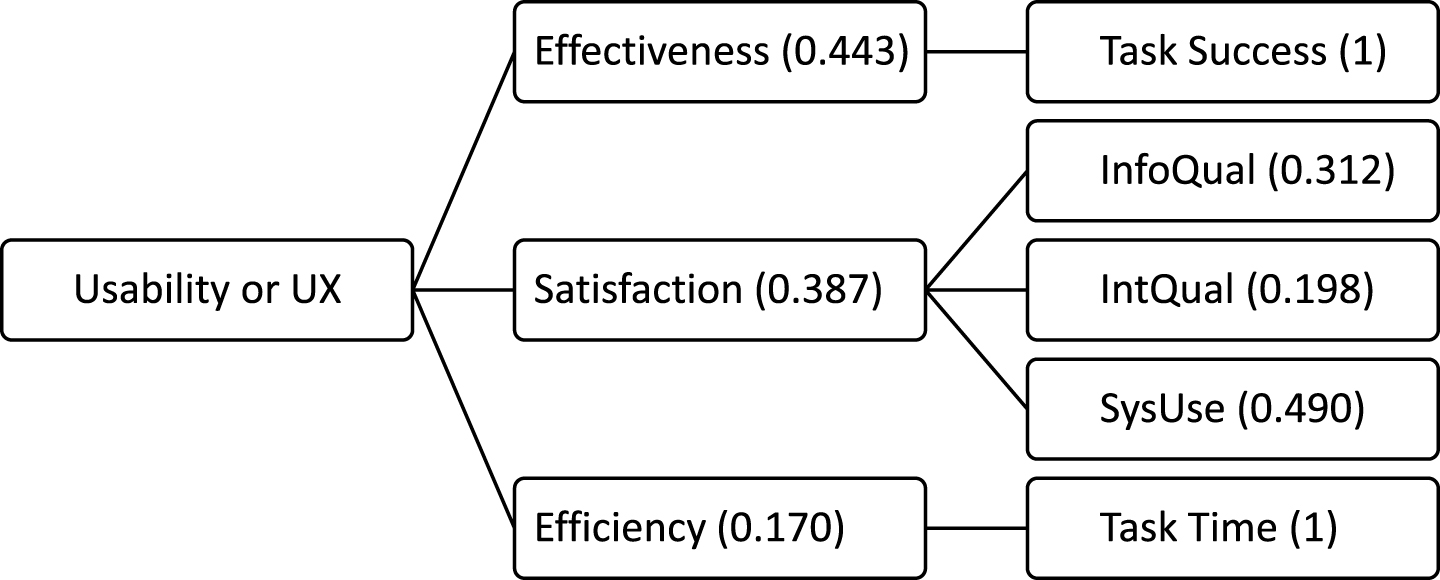
Fig.2
The fuzzy membership functions of task success and task time (converted value). v is a measure value for task success or converted value for task time, μδ(v), ranges from 0 to 1, means the value’s corresponding membership degree to very poor, poor, medium, good, and excellent, respectively. The ranges for v in the interval [0, 1], for the corresponding threshold parameters were: 0, 0.3, 0.6, 0.8, 0.95, and 1 which are the value of v1, v2, v3, v4, and v5 respectively. 0.15, 0.45, 0.7, 0.875, and 0.975 are the value of c1, c2, c3, c4, and c5, which represent the middle values of the intervals (v1, v2), (v2, v3), (v3, v4), (v4, v5), and (v5, v6) respectively. In terms of task time, v values correspond to very poor singly and completely for v <0, and correspond to excellent singly and completely for 1 < v<2.
![The fuzzy membership functions of task success and task time (converted value). v is a measure value for task success or converted value for task time, μδ(v), ranges from 0 to 1, means the value’s corresponding membership degree to very poor, poor, medium, good, and excellent, respectively. The ranges for v in the interval [0, 1], for the corresponding threshold parameters were: 0, 0.3, 0.6, 0.8, 0.95, and 1 which are the value of v1, v2, v3, v4, and v5 respectively. 0.15, 0.45, 0.7, 0.875, and 0.975 are the value of c1, c2, c3, c4, and c5, which represent the middle values of the intervals (v1, v2), (v2, v3), (v3, v4), (v4, v5), and (v5, v6) respectively. In terms of task time, v values correspond to very poor singly and completely for v <0, and correspond to excellent singly and completely for 1 < v<2.](https://ip.ios.semcs.net:443/media/wor/2017/56-1/wor-56-1-wor2473/wor-56-wor2473-g002.jpg)
Fig.3
The fuzzy membership function of satisfaction. v is measure value, μδ(v), which ranges from 0 to 1, and means the value’s corresponding membership degree to very poor, poor, medium, good, and excellent, respectively. 1, 2, 3.5, 5.5, 6.5, and 7 are the value of v1, v2, v3, v4, and v5 respectively. 1.5, 2.75, 4.5, 6, and 6.75 are the value of c1, c2, c3, c4, and c5.
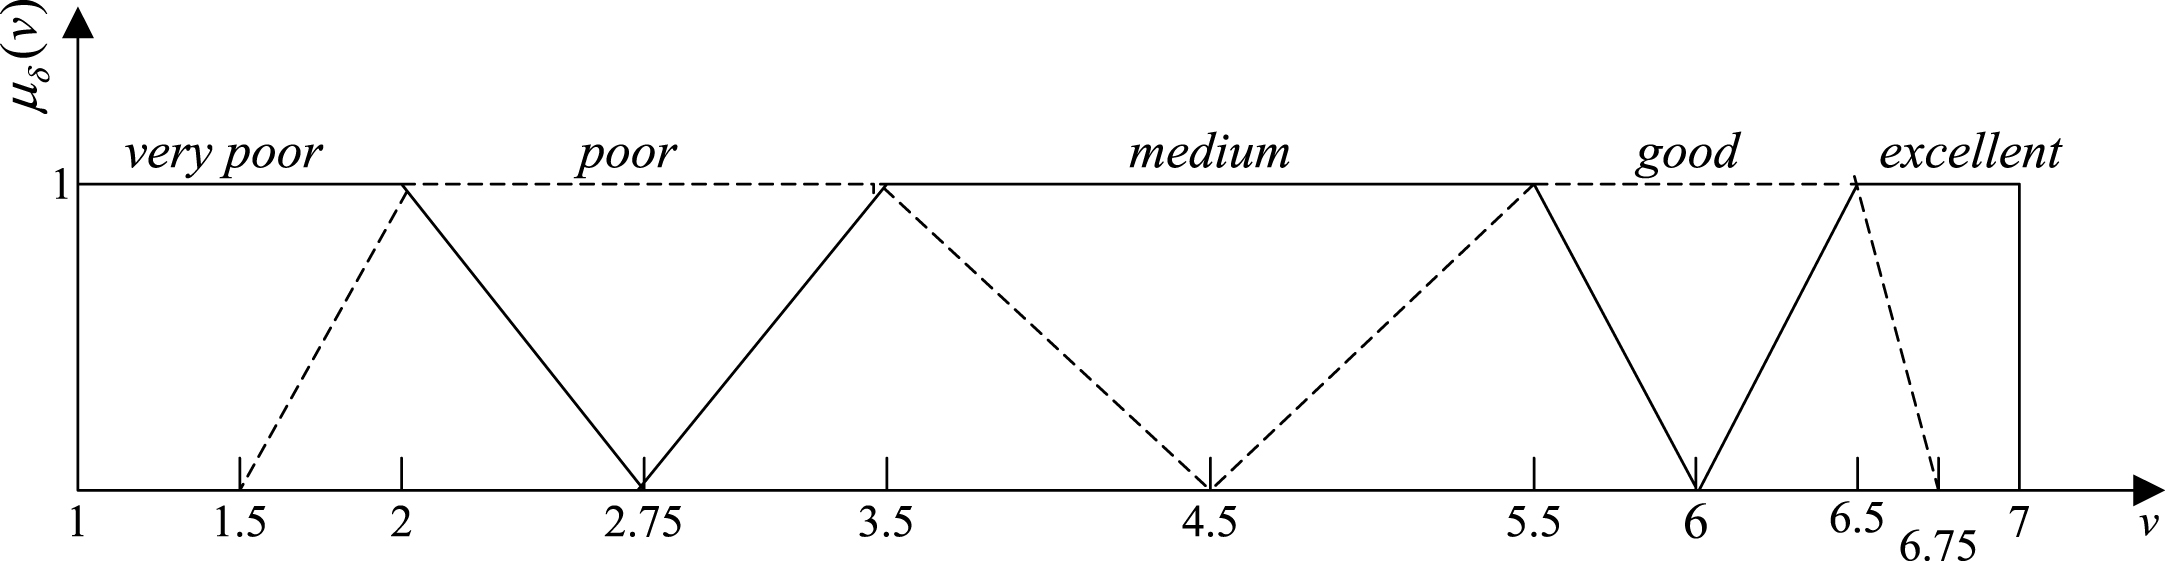
Fig.4
Confidence interval width as a function of sample size and evaluation method.
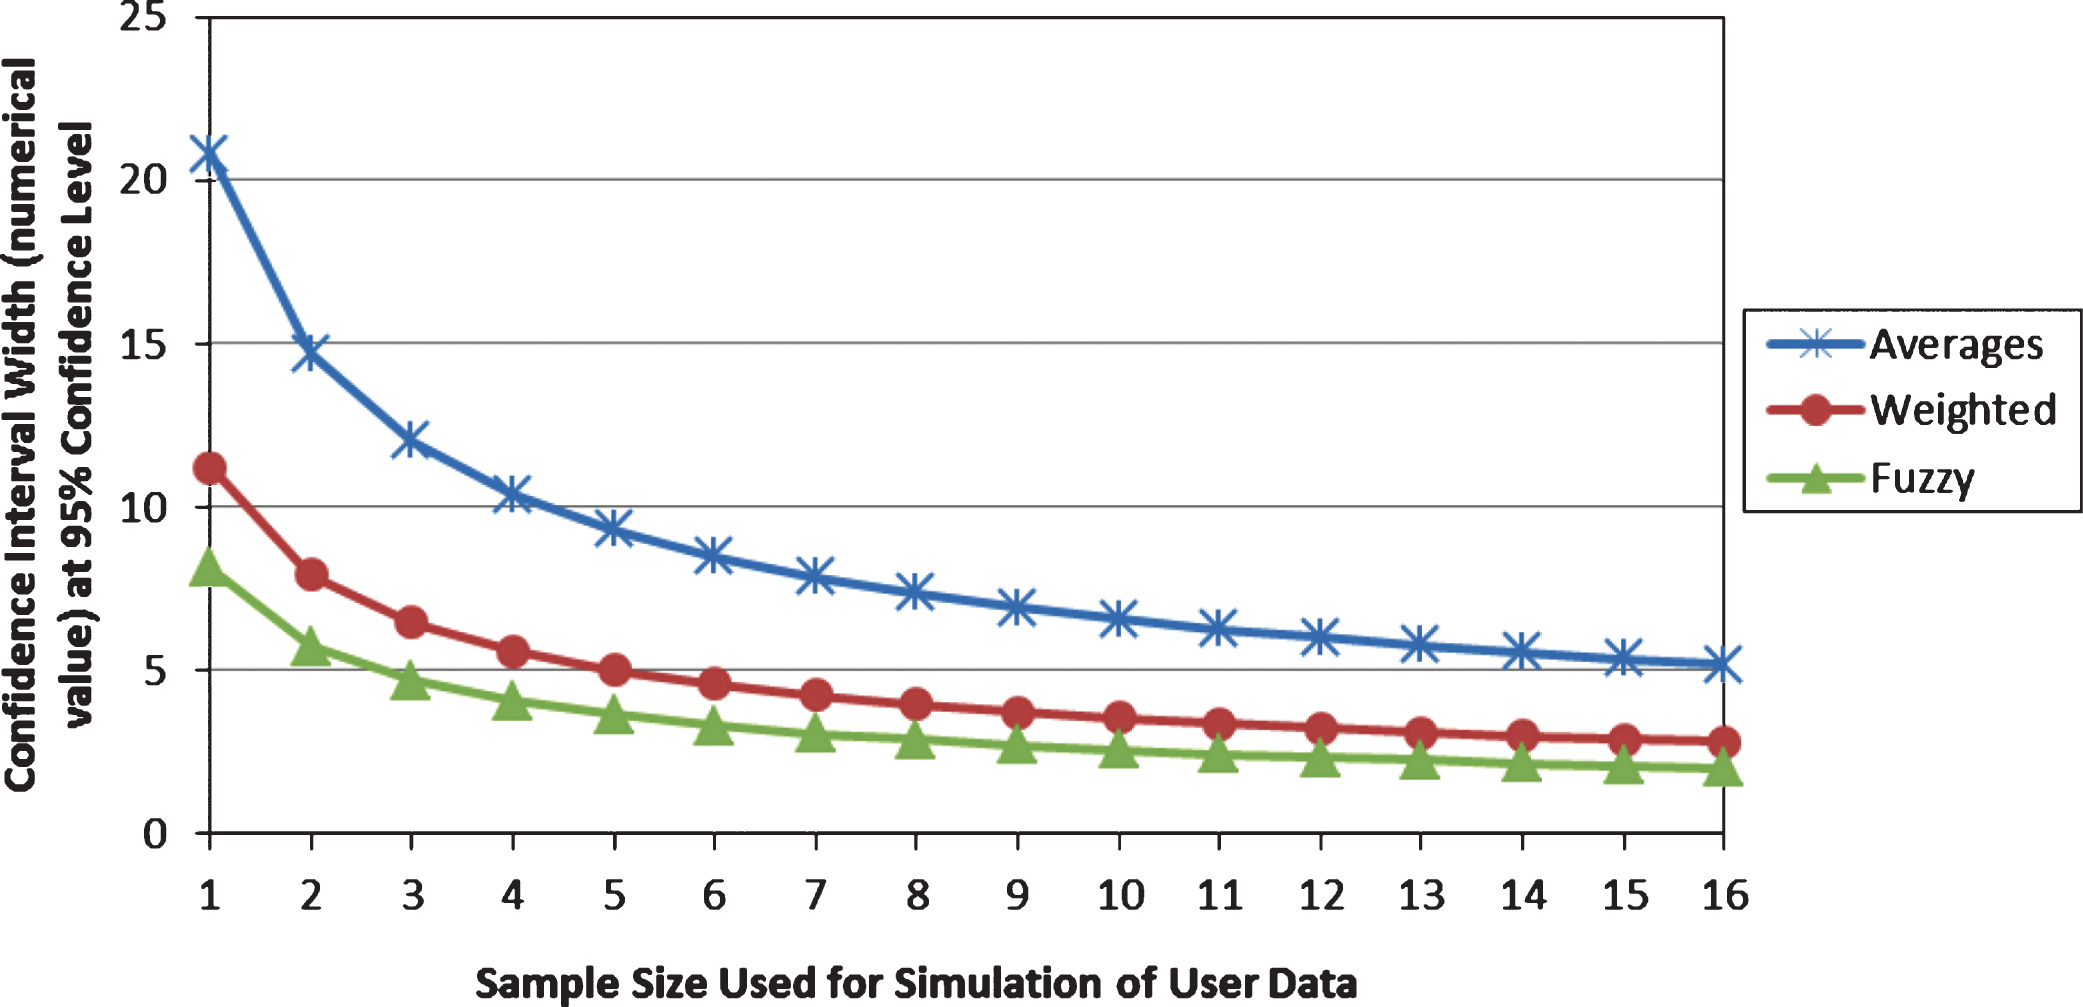
Table 1
Numerical success ratings with corresponding definitions
| Success | Operational definition |
| 1.0 or 0.9 | Complete the task independently without errors or invalid actions |
| 0.8 or 0.7 | Complete the task independently with a few errors or invalid actions |
| 0.6 or 0.5 | There are some difficulties for performing task, and with more errors or invalid actions |
| 0.4, 0.3 or 0.2 | There are more errors or invalid actions. The task can be completed only with help of documents or hints from facilitator |
| 0.1 or 0 | The user cannot complete the task or gives up on the task. |
Table 2
The preparatory statistical result with respect to each original measure
| Participants | Effective | Efficiency | User Satisfaction | |||
| Success | Time | Time* | InfoQual | IntQual | SysUse | |
| P1 | 0.955 | 569.333 | 0.644 | 5.143 | 5.667 | 5.875 |
| P2 | 0.969 | 554.000 | 0.681 | 5.800 | 4.333 | 5.875 |
| P3 | 0.988 | 650.667 | 0.451 | 6.286 | 6.333 | 6.750 |
| P4 | 0.983 | 369.667 | 1.120 | 4.000 | 5.667 | 5.625 |
| P5 | 0.962 | 633.667 | 0.491 | 5.286 | 4.667 | 6.125 |
| P6 | 0.962 | 543.000 | 0.707 | 5.600 | 4.667 | 5.625 |
| P7 | 0.943 | 478.000 | 0.862 | 6.143 | 6.333 | 6.250 |
| P8 | 0.954 | 362.333 | 1.137 | 5.714 | 6.667 | 6.375 |
| P9 | 0.937 | 774.000 | 0.157 | 5.000 | 5.333 | 5.375 |
| P10 | 0.933 | 781.000 | 0.140 | 6.429 | 5.667 | 7.000 |
| P11 | 0.969 | 537.000 | 0.721 | 5.000 | 4.667 | 6.125 |
| P12 | 0.940 | 814.500 | 0.061 | 5.167 | 5.333 | 5.875 |
| P13 | 0.960 | 377.500 | 1.101 | 5.143 | 6.000 | 5.625 |
| P14 | 0.970 | 353.000 | 1.160 | 5.714 | 6.333 | 6.000 |
| P15 | 0.935 | 772.000 | 0.162 | 5.714 | 5.333 | 6.000 |
| P16 | 0.988 | 310.500 | 1.261 | 5.571 | 5.333 | 5.500 |
Times* were converted from times according to formula of [2 –(original task time / expectable shortest time] proposed in [1], and the expectable shortest time were designed as 420 seconds in this case. SysUse = System Usefulness, InfoQual = Information Quality, IntQual = Interface Quality.
Table 3
The membership mapping for task success ranking
| Participants | Success | very poor | poor | medium | good | excellent |
| P1 | 0.955 | 0 | 0 | 0 | 0.797 | 1 |
| P2 | 0.969 | 0 | 0 | 0 | 0.244 | 1 |
| P3 | 0.988 | 0 | 0 | 0 | 0 | 1 |
| P4 | 0.983 | 0 | 0 | 0 | 0 | 1 |
| P5 | 0.962 | 0 | 0 | 0 | 0.511 | 1 |
| P6 | 0.962 | 0 | 0 | 0 | 0.533 | 1 |
| P7 | 0.943 | 0 | 0 | 0 | 1 | 0.911 |
| P8 | 0.954 | 0 | 0 | 0 | 0.822 | 1 |
| P9 | 0.937 | 0 | 0 | 0 | 1 | 0.822 |
| P10 | 0.933 | 0 | 0 | 0 | 1 | 0.778 |
| P11 | 0.969 | 0 | 0 | 0 | 0.244 | 1 |
| P12 | 0.940 | 0 | 0 | 0 | 1 | 0.867 |
| P13 | 0.960 | 0 | 0 | 0 | 0.600 | 1 |
| P14 | 0.970 | 0 | 0 | 0 | 0.200 | 1 |
| P15 | 0.935 | 0 | 0 | 0 | 1 | 0.800 |
| P16 | 0.988 | 0 | 0 | 0 | 0 | 1 |
| cj (sum of ranking) | 0 | 0 | 0 | 8.952 | 15.178 | |
| rj (normalized cj) | 0 | 0 | 0 | 0.371 | 0.629 | |
Table 4
Data from Table 3 transformed to percentages for the true case
| Participants | Effective | Efficiency | User Satisfaction | Averages | Weighted Averages | ||
| (Success) | (Time) | InfoQual | IntQual | SysUse | |||
| P1 | 95.5 | 64.4 | 69.0 | 77.8 | 81.3 | 78.7 | 83.0 |
| P2 | 96.9 | 68.1 | 80.0 | 55.6 | 81.3 | 79.1 | 83.8 |
| P3 | 98.8 | 45.1 | 88.1 | 88.9 | 95.8 | 78.3 | 87.0 |
| P4 | 98.3 | 100.0 | 50.0 | 77.8 | 77.1 | 88.9 | 87.2 |
| P5 | 96.2 | 49.1 | 71.4 | 61.1 | 85.4 | 72.7 | 80.5 |
| P6 | 96.2 | 70.7 | 76.7 | 61.1 | 77.1 | 79.5 | 83.2 |
| P7 | 94.3 | 86.2 | 85.7 | 88.9 | 87.5 | 89.3 | 90.2 |
| P8 | 95.4 | 100 | 78.6 | 94.4 | 89.6 | 94.3 | 93.0 |
| P9 | 93.7 | 15.7 | 66.7 | 72.2 | 72.9 | 60.0 | 71.6 |
| P10 | 93.3 | 14.0 | 90.5 | 77.8 | 100 | 65.6 | 79.6 |
| P11 | 96.9 | 72.1 | 66.7 | 61.1 | 85.4 | 80.0 | 84.1 |
| P12 | 94.0 | 6.1 | 69.4 | 72.2 | 81.3 | 58.1 | 72.0 |
| P13 | 96.0 | 100 | 69.0 | 69.0 | 83.3 | 90.8 | 88.9 |
| P14 | 97.0 | 100 | 78.6 | 88.9 | 83.3 | 93.5 | 92.1 |
| P15 | 93.5 | 16.2 | 78.6 | 72.2 | 83.3 | 62.6 | 75.0 |
| P16 | 98.8 | 100.0 | 76.2 | 72.2 | 75.0 | 91.1 | 89.7 |
| Mean (SD) | 78.9 (12.18) | 83.8 (6.70) | |||||
In order to match the possible percentage zero data, the original user satisfaction data with scaling from 1 to 7 were converted to the scaling from 0 to 6, so it was possible to divide the converted score for each participant by the maximum possible score of 6 to get the user subjective percentage. SysUse = System Usefulness, InfoQual = Information Quality, IntQual = Interface Quality.
Table 5
Sample data of confidence interval width with simulation for the three evaluation methods
| Case | Methods | Mean | S.D. | N = 1 | N = 2 | N = 3 | ... ... | N = 16 |
| True case | Fuzzy | 85.0 | 5.26 | 10.32 | 7.30 | 5.96 | 2.58 | |
| Weighted | 83.8 | 6.70 | 13.13 | 9.28 | 7.58 | 3.28 | ||
| Averages | 78.9 | 12.18 | 23.87 | 16.88 | 13.78 | 5.97 | ||
| Simulation 1 | Fuzzy | 87.70 | 3.98 | 7.80 | 5.52 | 4.50 | 1.95 | |
| Weighted | 84.27 | 6.18 | 12.11 | 8.56 | 6.99 | 3.03 | ||
| Averages | 79.00 | 12.29 | 24.09 | 17.03 | 13.91 | 6.02 | ||
| ... ... | ... ... | |||||||
| Simulation 100 | Fuzzy | 84.68 | 4.72 | 9.25 | 6.54 | 5.34 | 2.31 | |
| Weighted | 83.52 | 7.52 | 14.74 | 10.42 | 8.51 | 3.68 | ||
| Averages | 78.31 | 12.43 | 24.36 | 17.23 | 14.07 | 6.09 |


