
Pain and disability do not influence psychological and social factors at work among sick-listed patients with neck and back pain
Abstract
BACKGROUND:
It is unknown whether living with neck and back pain, disability, and mental disorders influences the perception of psychological and social factors at work among sick-listed patients.
OBJECTIVES:
The primary aim of the present study was to examine the associations between pain, disability, anxiety, depression, and perceived psychological and social factors at work among sick-listed patients with neck and back pain.
METHODS:
We performed a cross-sectional study of 380 sick-listed patients with neck and low-back pain who were referred to spine clinics at two Norwegian university hospitals. Ordinal regression was applied, with psychological and social factors at work as the dependent variable.
RESULTS:
Pain was not associated with psychological and social factors at work. Disability was associated with a minor increase in the perception of demands among women, but not men. Women with high anxiety or depression scores experienced less control over work situations and less positive challenges at work. Men with high depression scores perceived low support.
CONCLUSIONS:
Sick-listed patients with neck and back pain who had concurrent anxiety or depression reported increased psychological and social challenges at work. To provide suitable treatment in the clinical setting, further attention should be paid to the interaction between anxiety or depression and perceived job strain.
1Introduction
Sickness absence, especially due to neck and back pain, carries substantial societal costs [1–3]. Most patients experience benign and self-limiting neck and back disorders, and there are seldom medical restrictions that prevent them from participating in most work situations [4]. However, a considerable number of patients with these painful conditions become long-term sick listed [3].
Studies report that various physical factors, including radiological findings, obesity, muscular strength, and flexibility, are predictors of persistent pain, disability, and sickness-absence among patients with neck and back pain [5–8]. Also gender, age and education predict poor return to work rate [9]. However, non-physical factors seems to be strongly linked to work related musculoskeletal disorders [10], and psychological and social factors are important predictors for both development of back pain and sick leave [11–13]. A recent meta-analysis concludes that high demands, low control, and low support from superiors at work are important risk factors for the development of neck and back pain [14], and a recent study underscores the importance of low demand and high control for work attendance [15]. Patients sick listed due to neck and back pain generally experience more quantitative demands, lower control of decisions, and less support from coworkers compared to a reference population, but the magnitude of this difference is small [16].
Most research on work-related musculoskeletal disorders has focused on how health is impacted by age, occupation, education level, and psychological and social factors at work [17–19]. However, living with pain and distress may also influence the perception of psychological and social factors at work [17, 20–21], and increased job strain may be the perceptual correlate. A study of male metal industry workers found that musculoskeletal symptoms predicted physiological stress symptoms 5 years later [22], while a study of female kitchen staff reported that multiple-site musculoskeletal pain predicted low job control and low support from supervisors [23].
To date, no studies have investigated whether living with neck and back pain, disability, and mental disorders influences the perception of psychological and social factors at work among sick-listed patients admitted to secondary care. Therefore, the present study aimed to examine the associations between health variables, such as pain, disability, and mental disorders, and the perceived psychosocial work environment among sick-listed subjects.
2Material and methods
2.1Study design and participants
We performed a cross-sectional multi-center study of patients who were on sick leave due to neck and back pain. All patients referred to the neck and back outpatient clinic at Oslo and Trondheim University Hospital between August 2009 and August 2011 were screened for eligibility. The inclusion criteria were neck or back pain, age of 18–60 years old, employed or self-employed, and having been sick-listed for between four weeks and 12 months. Exclusion criteria were potential candidacy for surgical treatment, cauda equina syndrome, symptomatic deformities in the spine, osteoporosis with fractures, inflammatory rheumatic diseases, other serious somatic or mental diseases, pregnancy, legal labor dispute, and Norwegian language knowledge insufficient for group treatment participation. We identified 723 eligible patients, among whom 413 gave informed consent to participate, and 33 were excluded or did not fulfill all questionnaires (Fig. 1). The study was evaluated by REK (ref S-09024b 2009/1000) and approved by the data protection supervisor at Oslo University Hospital.
2.2Demographic factors
Age was recorded as a scale variable (number of full years of age at inclusion). Years of education was classified into four categories:<10 years, 10–12 years, 13–15 years (<4 years college/university), and >15 years (≥4 years of college/university). The last two categories were collapsed for regression analyses. Occupation was manually classified using the International Standard Classification of Occupations (ISCO-88). For analyses, occupations were divided into two predictor variables: low-skilled or high-skilled occupation, and blue-collar or white-collar work [24].
2.3Pain
Pain was measured on an 11-point numeric rating scale, from 0 (no pain) to 10 (worst possible pain) [25]. The patients were asked to rate the average pain that they experienced over the previous week in the back/leg, both at rest and during activity, as well as in the neck/shoulder/arm at rest and during activity. The highest score of the four scales was used for the analyses. Pain distribution was assessed using a pain drawing from the Norwegian version of the McGill Pain Questionnaire [26]. Patients shaded the area with pain. For analysis, the body was divided into 10 areas, and the number of areas with complete or partly shading was counted [27].
2.4Oswestry and Neck Disability Indices
Pain-related functioning was measured with the Oswestry Disability Index (ODI) for back pain, and with the Neck Disability Index (NDI) for neck pain [28–29]. Each index includes 10 items categorizing daily activities, which are rated on a 6-point scale (0–5). The responses are summarized into a percent score (0–100), with 100 indicating the highest disability. A review from 2008 [30] suggests that 12.8 is the minimal important clinical difference. When we found a statistically significant association, we calculated the odds ratio for a 10-point change inODI.
2.5Self-administered Comorbidity Questionnaire (SCQ)
Comorbidities were measured with a self-administered comorbidity questionnaire (SCQ) [31]. that comprised 12 predefined conditions and three open optional fields. Each condition could receive a score ranging from 0–3. Many patients added optional items that reflected health complaints rather than comorbidities, and thus we chose to use only the first 12 items to create a sum score with a maximum possible score of 36.
2.6Hospital Anxiety and Depression Scale (HADS)
Psychological distress level was assessed using the validated Norwegian version of the Hospital Anxiety and Depression Scale (HADS) [32]. HADS includes one subscale for depression (HADS-D) and another for anxiety (HADS-A). Each subscale consists of 7 items that are scored from 0–3, adding up to a sum score that ranges from 0–21. Cases that were missing more than one value in a subscale were excluded. If a subscale was missing a single value, the missing value was replaced with the individual mean. Anxiety or depression, respectively, was defined as a HADS-A or HADS-D score of >8, which is the normal cut-off point that indicates possible anxiety or depression [33–34].
2.7General Questionnaire for Psychological and Social factors at work (QPS Nordic)
The General Questionnaire for Psychological and Social Factors at Work (QPS Nordic) comprises 129 questions that measure psychological, social, and organizational factors at work [35]. In the present study, we used 30 items from the following subscales: quantitative demands (4 items), decision demands (3 items), learning demands (3 items), positive challenges at work (3 items), control of decisions (5 items), control of work pacing (4 items), support from superior (3 items), support from co-workers (2 items), and support from friends and relatives (3 items). Each item measures the frequency of occurrences on a five-point scale from 1 (very seldom) to 5 (very often).
2.8Statistical analyses
Spearman’s rank order correlation was used to assess the associations between different variables to explore whether any variables were too highly correlated (rho >0.7) for the regression model. Ordinal regression (the cumulative logit model) was used to assess the relationships between health variables and psychological and social factors at work. Pre-examination of the data revealed significant interactions between gender and age, occupation, comorbidity, HADS, and ODI/NDI. The ordinal regression analyses were stratified by gender, and the Mann-Whitney U test was used to compare psychological and social factors between men and women.
The subscales of the QPS Nordic were used as response (dependent) variables. For all models, we tested the assumption of proportional odds across all categories. To meet this assumption, we had to collapse the response variables into the following three categories: category 1, a mean value between 1.00 and 2.99 (corresponding to “very seldom” or “rather seldom”); category 2, a mean value between 3.00 and 3.99 (corresponding to “sometimes”), and category 3, a mean value of ≥4.00 (corresponding to “rather often” or “very often”). Age, first language, occupation (blue collar, 1; white collar, 2), skill level (low, 1; high, 2), comorbidity (SCQ), pain, functioning (ODI/NDI), and anxiety (HADS-A) or depression (HADS-D) were entered as independent variables. HADS-A and HADS-D were correlated with a rho of >0.7, and were thus entered in separate models. The results correspond to the model with the highest explained variance. The odds ratios for a one-unit change in the independent variables are reported. A significance level of p < 0.05 was adopted, and Bonferroni correction was applied for multiple comparisons. As we tested nine subscales of the QPS-Nordic, we applied a corrected significance level of p < 0.006. Data were analyzed using IBM SPSS statistics version 19 (SPSS Inc., Chicago, IL, USA).
3Results
Among the included patients, the mean age was 40 years (SD, 9.8 years) for men and 42 years (SD, 10 years) for women. Table 1 presents other demographic characteristics of the included patients. There were significant gender differences (p < 0.05) in education and proportion of high-skilled and white-collar workers. Table 2 presents the mean pain levels, disability, and HADS scores. Depression was identified in 29% of the population (HADS-D score of >8), and anxiety was found in 41% of the population (HADS-A score of ≥8). The median number of shaded pain areas was 3 (range, 1–10) among men and 4 (range, 1–9) among women. The variables listed in Table 2 did not significantly differ (p < 0.05) between genders. Table 3 presents the mean scores of psychological and social factors at work, measured using QPS Nordic, stratified by gender. Compared to women, men had significantly higher scores on quantitative demands at work (p < 0.05). Compared to men, women experienced significantly more support from co-workers, friends, and relatives, and also reported more positive challenges at work (p < 0.05). Tables 4 and 5 present the associations between pain, disability, emotional distress, and psychological and social factors at work.
3.1Demands
Among female patients, the perception of high quantitative demands was significantly influenced by neck- and back-pain-related disability (ODI/NDI) (p < 0.006). Women with a 10-point increase in ODI/NDI score had an odds ratio of 1.49 for perceiving high quantitative demands at work. Educational level influenced the perception of both quantitative demands and learning demands among women, but not men. Women with higher education had an odds ratio of 8.76 for experiencing high quantitative demands and an odds ratio of 5.81 for experiencing high decision demands. The variables blue/white collar and low/high skilled did not influence the perception of demands among either gender. Men showed a non-significant tendency for anxiety or depression to influence all of the subscales of demands in the QPS Nordic.
3.2Control
None of the studied medical factors significantly influenced the perception of control at work among men. Among women, anxiety and depression were significantly associated with the perception of diminished control (p < 0.006). Women with high depression scores reported significantly less positive challenges at work, and women with high anxiety scores reported less control of decisions. A 2-point increase in HADS score was associated with an odds ratio of 1.36 for low positive challenges at work, and an odds ratio of 1.48 for reporting low control of decisions. Among women, the variable white/blue-collar influenced the perception of positive challenges at work. Highly skilled men reported a higher degree of control at work on all QPS Nordic subscales. The effect was highest on control of work pacing, where white-collar workers had an odds ratio of 4.76 for reporting a high degree of control.
3.3Support
Among men, depression was associated with perception of low support from coworkers (p < 0.006), with a 2-point increase in depression score associated with an odds ratio of 1.30 for reporting low support. For both genders, support was less influenced by type of work and education, with skilled work, white collar vs. blue collar, and education having no impact on the perception of support. Mother tongue was a significant explanatory variable in men. Men whose mother tongue was Norwegian experienced significantly less support from their superior compared to men with a foreign mother tongue. Among women, no factors significantly influenced the perception of support.
44.Discussion
Our present results in sick-listed patients with neck and back pain showed no association between level of pain and psychological and social factors at work, and only a minor influence of disability. A high disability score (ODI/NDI) was associated with reporting higher quantitative demands among women but not men. Anxiety and depression were found to influence perception of psychological and social factors at work in both genders. Other studies have also reported anxiety and depression to be associated with psychological and social factors at work [36–38]. The causal relationship of psychological and social factors at work with employee well-being has been discussed [39]; however, most studies have investigated the relationship between job exposure and the development of musculoskeletal pain [10]. Few have investigated the reciprocal relationship [20]. To our knowledge, the present results are the first illustration of this relationship in patients with neck and back pain.
In Norway, patients with neck and back pain are generally referred to a health specialist to receive an examination and advice for further treatment and sick listing. In this process, it is important for health care professionals to know which individual factors might contribute to symptom persistence and obstacles that can impede one’s return to work. Therefore, knowledge about factors that contribute to an experience of an adverse work environment is important. Our present results revealed that anxiety and depression were the most important factors associated with adverse psychological and social factors at work. These factors are also known to be strong predictors of prognosis among sick-listed patients with neck and back pain [40]. These findings suggest the particular importance of exploring a patient’s perception of their work environment if anxiety or depression is present.
Our patients reported levels of demands, control, and support at work similar to those in a Nordic reference population [35, 41]. Gender distribution, educational level, pain, and disability were also comparable to reports of other Norwegian studies, including among patients with chronic back pain [42–47]. However, the present study population showed a higher than expected prevalence of anxiety and depression— this rate was more than twice that reported in Norwegian population-based studies [48–49], and was also high compared to another study of patients with back pain and a similar duration of sick leave [50].
We found gender differences in the perception of psychological and social factors at work, as has also been reported in other studies [36]. These differences should be taken into account when analyzing psychological and social factors at work, and justify the stratification of analyses by gender to avoid difficulties in interpretation of interactions [51]. The blue/white collar factor was associated with demand and control among women, while the high/low skill level factor was more important among men. Similarly, education was associated with perception of demands for women, and with positive challenges at work for men. Other studies have also found that the white collar/blue collar factor and skill level are associated with job strain [17], and that age and education influence the perception of control and demands [52].
4.1Strengths and limitations
The present study was part of a multicenter study on occupational rehabilitation of a representative sample of sick-listed patients with neck and back pain who were referred to secondary care in Norway. We aimed to include all patients on sick leave, as this group is suggested to have a higher prevalence of work-related problems. As this was a cross-sectional study, we could only find associations between factors.
We used a subjective measure of job strain that assessed the individual’s perceptions of exposure; however, it is also possible to measure job strain using more objective methods based on occupation, working hours, and payment. The correlation between the two methods is low [53], but the “QPS Nordic” questionnaire is designed to include response categories that are not easily affected by emotion, and that are less distorted by social desirability bias [54]. We also tried to reduce the problems associated with the utilized method by controlling for occupation in the analyses.
We used appropriate ordinal regression analyses, as the outcome measures were ordinal in nature. The numbers of categories in the response variables were reduced in order to meet the assumptions of proportional odds. This may have reduced the power of the results. We also chose to correct for multiple testing to avoid spurious relationships. There was a tendency of association between more variables. The Bonferroni correction may have been too conservative of an approach and some of these associations might be clinically important.
5Conclusions
Depression and anxiety appeared to be the two most important factors influencing the experience of low support and low control among sick-listed patients with neck and back pain. On the other hand, pain and disability were of only minor importance. Hence, attention should be paid to the interaction between anxiety or depression and perceived job strain in the clinical setting. We found gender differences in the perception of psychological and social factors at work, where men reported higher demands and women reported more support. The significance of these differences regarding health and sickness absence need to be established.
Authors’ contributions
GHM participated in the study design and coordination, data acquisition, statistical analysis, data interpretation, and drafting of the manuscript. BL participated in the study conception and design, data analysis and interpretation, and critical revision of the manuscript. KM participated in the study design and coordination, data acquisition, and critical revision of the manuscript. CR participated in the study conception, design, and coordination; data interpretation; and critical revision of the manuscript. EBH participated in the study design and conception, data interpretation, and critical revision of the manuscript. GL participated in the study design, data analysis and interpretation, and critical revision of the manuscript. All authors read and approved the manuscript.
Acknowledgments
The study was funded by the Research Council of Norway.
References
[1] | Maniadakis N , Gray A . The economic burden of back pain in the UK. Pain (2000) ;84: (1):95. |
[2] | Punnett L , Pruss-Utun A , Nelson DI , Fingerhut MA , Leigh J , Tak S , Phillips S . Estimating the global burden of low back pain attributable to combined occupational exposures. Am J Ind Med (2005) ;48: (6):459. |
[3] | Ihlebaek C , Hansson TH , Laerum E , Brage S , Eriksen HR , Holm SH , Svendsrod R , Indahl A . Prevalence of low back pain and sickness absence: A “borderline” study in Norway and Sweden. Scand J Public Health (2006) ;34: (5):555. |
[4] | Airaksinen O , Brox JI , Cedraschi C , Hildebrandt J , Klaber-Moffett J , Kovacs F , Mannion AF , Reis S , Staal JB , Ursin H , Zanoli G . Chapter 4. European guidelines for the management of chronic nonspecific low back pain. Eur Spine J (2006) ;15 Suppl 2: :192. |
[5] | Lindell O , Johansson SE , Strender LE . Predictors of stable return-to-work in non-acute, non-specific spinal pain: Low total prior sick-listing, high self prediction and young age. A two-year prospective cohort study. BMC Fam Pract (2010) ;11: :53. |
[6] | Cedraschi C , Allaz AF . How to identify patients with a poor prognosis in daily clinical practice. Best Pract Res Clin Rheumatol (2005) ;19: (4):577. |
[7] | Selander J , Marnetoft SU , Bergroth A , Ekholm J . Return to work following vocational rehabilitation for neck, back and shoulder problems: Risk factors reviewed. Disabil Rehabil (2002) ;24: (14):704. |
[8] | Crook J , Milner R , Schultz IZ , Stringer B . Determinants of occupational disability following a low back injury: A critical review of the literature. J Occup Rehabil (2002) ;12: (4):277. |
[9] | Street TD , Lacey SJ . A systematic review of studies identifying predictors of poor return to work outcomes following workplace injury. Work (2014) . |
[10] | Stewart SK , Rothmore PR , Doda DV , Hiller JE , Mahmood MA , Pisaniello DL . Musculoskeletal pain and discomfort and associated worker and organizational factors: A cross-sectional study. Work (2014) ;48: (2):261. |
[11] | Hoogendoorn WE , van Poppel MN , Bongers PM , Koes BW , Bouter LM . Systematic review of psychosocial factors at work and private life as risk factors for back pain. Spine (Phila Pa 1976) (2000) ;25: (16):2114. |
[12] | Vahtera J , Kivimaki M , Pentti J , Theorell T . Effect of change in the psychosocial work environment on sickness absence: A seven year follow up of initially healthy employees. J Epidemiol Community Health (2000) ;54: (7):484. |
[13] | Negrini A , Perron J , Corbiere M . The predictors of absenteeism due to psychological disability: A longitudinal study in the education sector. Work (2014) ;48: (2):175. |
[14] | Lang J , Ochsmann E , Kraus T , Lang JW . Psychosocial work stressors as antecedents of musculoskeletal problems: A systematic review and meta-analysis of stability-adjusted longitudinal studies. Social science & medicine (2012) ;75: (7):1163. |
[15] | Holmgren K , Love J , Mardby AC , Hensing G . Remain in work–what work-related factors are associated with sustainable work attendance: A general population-based study of women and men. J Occup Environ Med (2014) ;56: (3):235. |
[16] | Myhre K , Roe C , Marchand GH , Keller A , Bautz-Holter E , Leivseth G , Sandvik L , Lau B . Fear-avoidance beliefs associated with perceived psychological and social factors at work among patients with neck and back pain: A cross-sectional multicentre study. BMC Musculoskelet Disord (2013) ;14: :329. |
[17] | Kristensen TS . Job stress and cardiovascular disease: A theoretic critical review. J Occup Health Psychol (1996) ;1: (3):246. |
[18] | de Lange AH , Taris TW , Kompier MA , Houtman IL , Bongers PM . “The very best of the millennium”: Longitudinal research and the demand-control-(support) model. J Occup Health Psychol (2003) ;8: (4):282. |
[19] | Hooftman WE , van der Beek AJ , Bongers PM , van Mechelen W . Is there a gender difference in the effect of work-related physical and psychosocial risk factors on musculoskeletal symptoms and related sickness absence? Scand J Work Environ Health (2009) ;35: (2):85. |
[20] | De Jonge J , Dormann C , Janssen PPM , Dollard MF , Landeweerd JA , Nijhuis FJN . Testing the reciprocal relation-ships between job characteristics and psychological well-being: A cross-lagged structural equation model Journal of Occupational and Organizational Psychology (2001) ;74: :29. |
[21] | Taris T , Bok IA , Calje DG . On the relation between job characteristics and depression: A longitudinal study. Int J Stress Manage (1998) ;5: :157. |
[22] | Leino P , Magni G . Depressive and distress symptoms as predictors of low back pain, neck-shoulder pain, and other musculoskeletal morbidity: A 10-year follow-up of metal industry employees. Pain (1993) ;53: (1):89. |
[23] | Haukka E , Leino-Arjas P , Ojajarvi A , Takala EP , Viikari-Juntura E , Riihimaki H . Mental stress and psychosocial factors at work in relation to multiple-site musculoskeletal pain: A longitudinal study of kitchen workers. Eur J Pain (2011) ;15: (4):432–. |
[24] | Lau B . Effort-reward imbalance and overcommitment in employees in a Norwegian municipality: A cross sectional study. J Occup Med Toxicol (2008) ;3: :9. |
[25] | Von Korff M , Jensen MP , Karoly P . Assessing global pain severity by self-report in clinical and health services research. Spine (2000) ;25: (24):3140. |
[26] | Strand LI , Wisnes AR . [Development of a Norwegian pain questionnaire for pain measurement]. Tidsskr Nor Laegeforen (1990) ;110: (1):45. |
[27] | Natvig B , Rutle O , Bruusgaard D , Eriksen WB . The association between functional status and the number of areas in the body with musculoskeletal symptoms. Int J Rehabil Res (2000) ;23: (1):49. |
[28] | Fairbank JC , Couper J , Davies JB , O’Brien JP . The Oswestry low back pain disability questionnaire. Physiotherapy (1980) ;66: (8):271. |
[29] | MacDermid JC , Walton DM , Avery S , Blanchard A , Etruw E , McAlpine C , Goldsmith CH . Measurement properties of the neck disability index: A systematic review. J Orthop Sports Phys Ther (2009) ;39: (5):400. |
[30] | Copay AG , Glassman SD , Subach BR , Berven S , Schuler TC , Carreon LY . Minimum clinically important difference in lumbar spine surgery patients: A choice of methods using the Oswestry Disability Index, Medical Outcomes Study questionnaire Short Form 36, and pain scales. Spine J (2008) ;8: (6):968. |
[31] | Sangha O , Stucki G , Liang MH , Fossel AH , Katz JN . The Self-Administered Comorbidity Questionnaire: A new method to assess comorbidity for clinical and health services research. Arthritis Rheum (2003) ;49: (2):156. |
[32] | Zigmond AS , Snaith RP . The hospital anxiety and depression scale. Acta Psychiatr Scand (1983) ;67: (6):361. |
[33] | Bjelland I , Dahl AA , Haug TT , Neckelmann D . The validity of the Hospital Anxiety and Depression Scale. An updated literature review. J Psychosom Res (2002) ;52: (2):69. |
[34] | Snaith RP . The Hospital. Anxiety And Depression Scale. Health Qual Life Outcomes (2003) ;1: :29. |
[35] | Lindsröm K , Elo A , Skogstad A , Dallner M , Gamberale F , Hottinen V , Knardahl S , Ørhede E . User’s guide for the QPSNordic: General Nordic questionnaire for psychological and socialfactors at work. TemaNord (2000) ; 603. |
[36] | Sanne B , Mykletun A , Dahl AA , Moen BE , Tell GS . Testing the Job Demand-Control-Support model with anxiety and depression as outcomes: The Hordaland Health Study. Occup Med (Lond) (2005) ;55: (6):463. |
[37] | Bonde JP . Psychosocial factors at work and risk of depression: A systematic review of the epidemiological evidence. Occup Environ Med (2008) ;65: (7):438. |
[38] | Stansfeld S , Candy B . Psychosocial work environment and mental health–a meta-analytic review. Scand J Work Environ Health (2006) ;32: (6):443. |
[39] | Zapf D , Dormann C , Frese M . Longitudinal studies in organizational stress research: A review of the literature with reference to methodological issues. J Occup Health Psychol (1996) ;1: (2):145. |
[40] | Pincus T , Burton AK , Vogel S , Field AP . A systematic review of psychological factors as predictors of chronicity/disability in prospective cohorts of low back pain. Spine (Phila PaE 1976) (2002) ;27: (5):109. |
[41] | Wannstrom I , Peterson U , Asberg M , Nygren A , Gustavsson JP . Psychometric properties of scales in the General Nordic Questionnaire for Psychological and Social Factors at Work (QPS): Confirmatory factor analysis and prediction of certified long-term sickness absence. Scand J Psychol (2009) ;50: (3):231. |
[42] | Grotle M , Vøllestad NK , Veierød MB , Brox JI . Fear-avoidance beliefs and distress in relation to disability in acute and chronic low back pain. Pain (2004) ;112: (3):343. |
[43] | Haldorsen EM , Kronholm K , Skouen JS , Ursin H . Predictors for outcome of a multi-modal cognitive behavioural treatment program for low back pain patients-a 12-month follow-up study. Eur J Pain (1998) ;2: (4):293. |
[44] | Brox JI , Nygaard OP , Holm I , Keller A , Ingebrigtsen T , Reikeras O . Four-year follow-up of surgical versus non-surgical therapy for chronic low back pain. Ann Rheum Dis (2009) ;69: (9):1643. |
[45] | Reme SE , Hagen EM , Eriksen HR . Expectations, perceptions, and physiotherapy predict prolonged sick leave in subacute low back pain. BMC Musculoskelet Disord (2009) ;10: :139. |
[46] | Iversen T , Solberg TK , Romner B , Wilsgaard T , Twisk J , Anke A , Nygaard O , Hasvold T , Ingebrigtsen T . Effect of caudal epidural steroid or saline injection in chronic lumbar radiculopathy: Multicentre, blinded, randomised controlled trial. BMJd (2011) ;343: :5278. |
[47] | Unsgaard-Tondel M , Fladmark AM , Salvesen O , Vasseljen O . Motor control exercises, sling exercises, and general exercises for patients with chronic low back pain: A randomized controlled trial with 1-year follow-up. Phys Ther (2010) ;90: (10):1426. |
[48] | Mykletun A , Glozier N , Wenzel HG , Overland S , Harvey SB , Wessely S , Hotopf M . Reverse Causality in the Association Between Whiplash and Symptoms of Anxiety and Depression The HUNT Study. Spine (2011) ;36: (17):1380. |
[49] | Wenzel HG , Haug TT , Mykletun A , Dahl AA . A population study of anxiety and depression among persons who report whiplash traumas. J Psychosom Res (2002) ;53: (3):831. |
[50] | Reme SE , Tangen T , Moe T , Eriksen HR . Prevalence of psychiatric disorders in sick listed chronic low back pain patients. Eur J Pain (2011) ;15: (10):1075. |
[51] | Messing K , Stock SR , Tissot F . Should studies of risk factors for musculoskeletal disorders be stratified by gender? Lessons from the Quebec Health and Social Survey. Scand J Work Environ Health (2009) ;35: (2):96. |
[52] | de Smet P , Sans S , Dramaix M , Boulenguez C , de Backer G , Ferrario M , Cesana G , Houtman I , Isacsson SO , Kittel F , Ostergren PO , Peres I , Pelfrene E , Romon M , Rosengren A , Wilhelmsen L , Kornitzer M . Gender and regional differences in perceived job stress across Europe. European journal of public health (2005) ;15: (5):536. |
[53] | Netterstrom B , Kristensen TS , Damsgaard MT , Olsen O , Sjol A . Job strain and cardiovascular risk factors: A cross sectional study of employed Danish men and women. Br J Ind Med (1991) ;48: (10):684. |
[54] | Christensen JO , Knardahl S . Work and headache: A prospective study of psychological, social, and mechanical predictors of headache severity. Pain (2012) ;153: (10):2119. |
Figures and Tables
Fig.1
Flow chart.
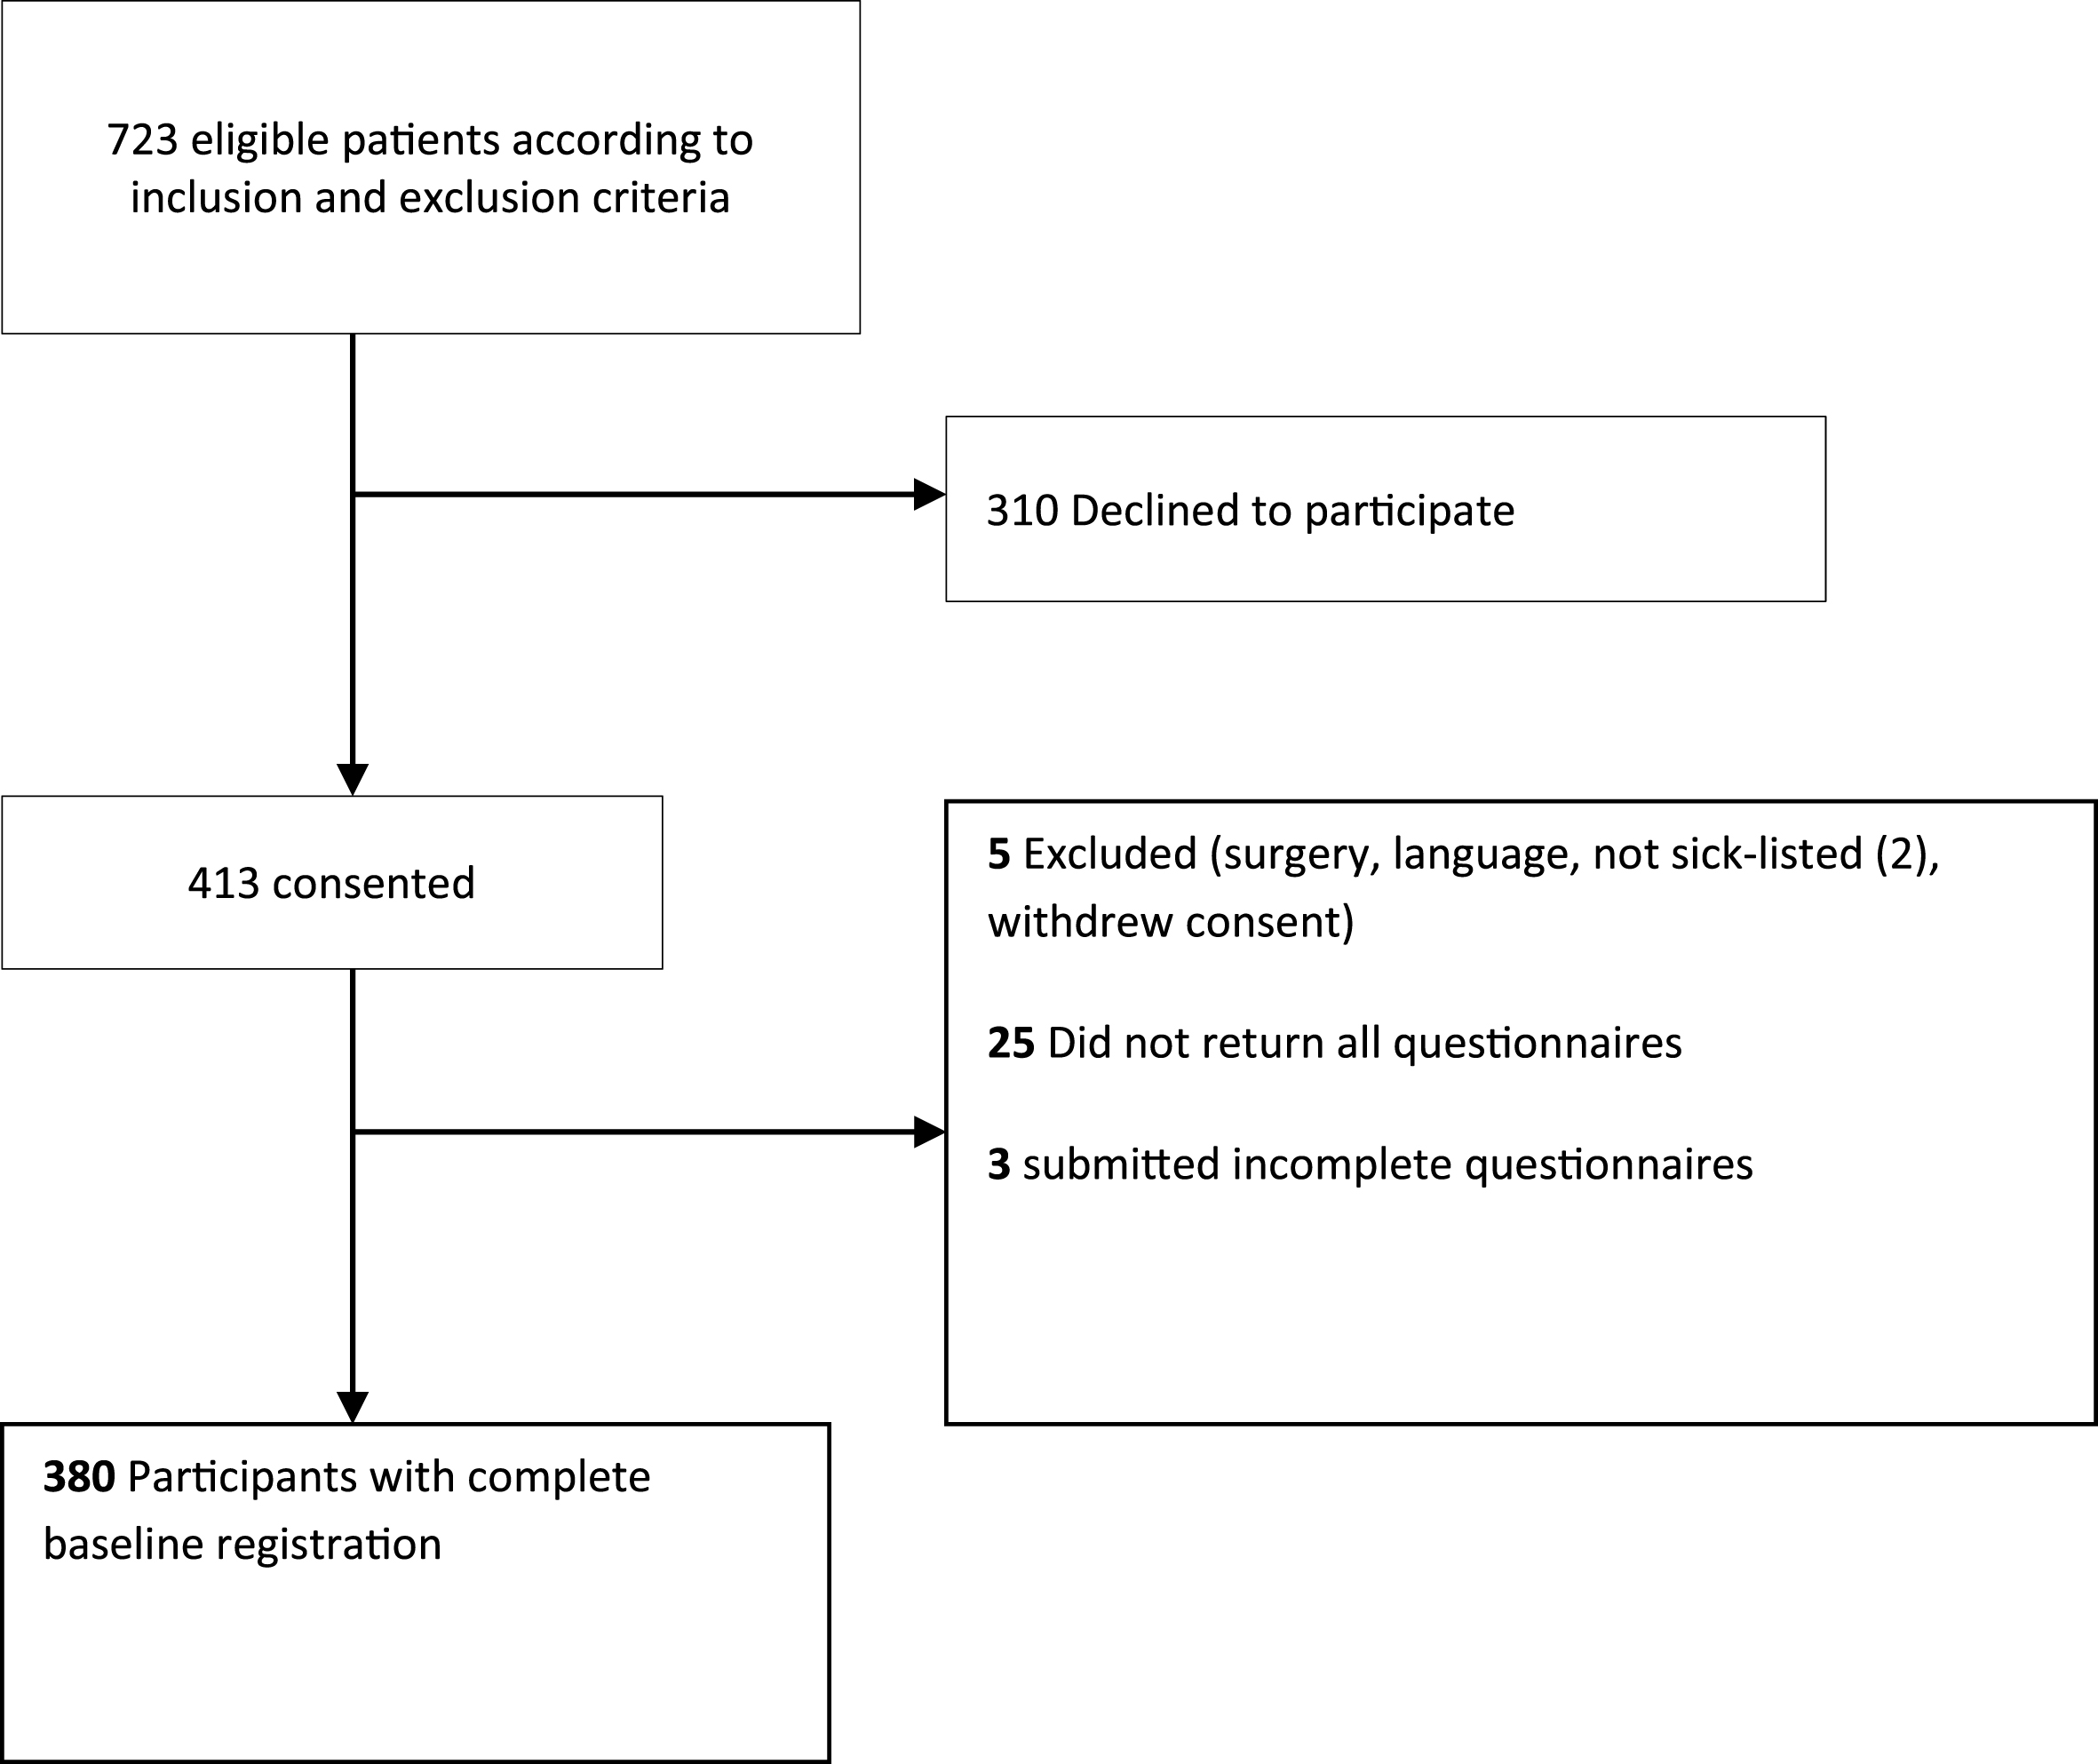
Table 1
Demographic characteristics of sick-listed patients with neck or back pain admitted to secondary care
| Men | Women | |||
| n | % | n | % | |
| Mother tongue: Norwegian | 151 | 75.1 | 146 | 81.6 |
| Foreign mother tongue | 50 | 24.9 | 33 | 18.4 |
| Education | ||||
| Equivalent of <10 years | 40 | 19.9 | 19 | 10.6 |
| Equivalent of 10–12 years | 126 | 62.7 | 91 | 50.8 |
| Equivalent of 13–15 years | 26 | 12.9 | 36 | 20.1 |
| Equivalent of >15 years | 8 | 4.0 | 33 | 18.4 |
| High-skilled workers | 110 | 54.7 | 78 | 43.6 |
| Low-skilled workers | 91 | 45.3 | 101 | 56.4 |
| Blue-collar | 125 | 62.2 | 23 | 12.8 |
| White-collar | 76 | 37.8 | 156 | 87.2 |
Table 2
Mean level of pain, disability, comorbidity, anxiety and depression in sick-listed patients with neck or back pain admitted to secondary care
| Men (n = 201) | Women (n = 179) | |||||
| Mean | (SD) | Range | Mean | (SD) | Range | |
| HADSa depression scale | 5.3 | (4.0) | 0–17 | 5.4 | (3.7) | 0–20 |
| HADSa anxiety scale | 7.2 | (4.2) | 0–21 | 7.2 | (3.8) | 0–16 |
| Comorbidity (SCQ) | 1.1 | (1.8) | 0–8 | 1.1 | (1.5) | 0–8 |
| Maximum pain score | 6.6 | (2.1) | 0–10 | 6.4 | (2.1) | 1–10 |
| Disability (ODI/NDI) | 35.5 | (12.7) | 8–70 | 37.6 | (14.4) | 8–80 |
aHospital anxiety and depression scale.
Table 3
Psychological and social factors at work, mean score and standard deviation measured with demand, control and support scale from QPS Nordic, in men and women
| Women | Men | |||
| N | Median | N | Median | |
| Quantitative demandsa | 179 | 3.00 | 200 | 3.25 |
| Decision demands | 179 | 3.67 | 200 | 3.67 |
| Learning demands | 179 | 2.33 | 200 | 2.33 |
| Positive challengesa | 178 | 4.00 | 200 | 4.00 |
| Control decisions | 179 | 2.60 | 201 | 2.60 |
| Control work pacing | 179 | 2.25 | 201 | 2.50 |
| Support from superior | 176 | 3.67 | 201 | 3.33 |
| Support from co-workersa | 177 | 4.00 | 201 | 3.50 |
| Support from friends and relativesa | 177 | 4.30 | 201 | 4.00 |
aSignificant difference between gender (p < 0.05).
Table 4
Estimated Odds ratio for 1 unit change (95% confidence interval) for demographic and health variables on the demand, control and support subscales from General Questionnaire for Psychological and Social factors at work (QPS Nordic) in females
| Demographic factors | Medical factors | ||||||||||
| Age | Mother tongue | Education | Low-skilled | Blue-collar | Comorbidity | Anxiety | Depression | Pain | Pain areas | Disability | |
| Quantitative demands | 1 | 0.85 | 0.11b | 0.48 | 0.88 | 0.97 | 1.05 | – | 0.88 | 1.01 | 1.04b |
| 95% CI | (0.97, 1.03) | (0.36, 2.04) | (0.03, 0.47) | (0.22, 1.05) | (0.35, 2.25) | (0.78, 1.13) | (0.96, 1.15) | (0.75, 1.04) | (0.87, 1.18) | (1.01, 1.06) | |
| Decision demands | 0.99 | 1.65 | 0.17b | 0.89 | 0.31a | 0.93 | 1.05 | – | 1.03 | 0.94 | 1.01 |
| 95% CI | (0.96, 1.02) | (0.71, 3.86) | (0.06, 0.54) | (0.42, 1.85) | (0.13, 0.76) | (0.76, 1.13) | (0.97, 1.15) | (0.88, 1.21) | (0.81, 1.08) | (0.99, 1.03) | |
| Learning demands | 1 | 0.97 | 1.22 | 0.75 | 0.17a | 0.91 | 1.10a | – | 0.99 | 0.98 | 1 |
| 95% CI | (0.97, 1.04) | (0.36, 2.57) | (0.34, 4.36) | (0.31, 1.78) | (0.04, 0.79) | (0.72, 1.16) | (0.99, 1.21) | (0.82, 1.19) | (0.82, 1.16) | (0.97, 1.03) | |
| Positive challenges | 1.01 | 0.48 | 1.43 | 0.39a | 0.25b | 1.18 | – | 0.88b | 1.02 | 0.98 | 1.02 |
| 95% CI | (0.98, 1.05) | (0.25, 1.80) | (0.30, 3.52) | (0.18, 1.01) | (0.09, 0.57) | (0.94, 1.58) | (0.77, 0.96) | (0.79, 1.16) | (0.87, 1.20) | (1.00, 1.06) | |
| Control of decisions | 1.01 | 1.02 | 0.8 | 0.88 | 2.61 | 1.07 | 0.82b | – | 1.05 | 0.99 | 1.04a |
| 95% CI | (0.98, 1.05) | (0.36, 2.86) | (0.21, 2.97) | (0.36, 2.14) | (1.00, 6.82) | (0.84, 1.35) | (0.74, 0.92) | (0.87, 1.27) | (0.16, 1.17) | (1.01, 1.07) | |
| Control of work pacing | 1.03 | 1.99 | 2.83 | 0.33a | 1.47 | 0.93 | 0.92 | – | 1.01 | 1.09 | 1.01 |
| 95% CI | (1.00, 1.07) | (0.69, 5.70) | (0.86, 9.30) | (0.14, 0.76) | (0.56, 3.86) | (0.74, 1.17) | (0.84, 1.02) | (0.85, 1.20) | (0.93, 1.27) | (0.98, 1.04) | |
| Support from superior | 1.01 | 2.74a | 0.61 | 1.17 | 1.37 | 0.95 | – | 0.96 | 0.92 | 1 | 1.02 |
| 95% CI | (0.98, 1.05) | (1.18, 6.36) | (0.20, 1.83) | (0.56, 2.45) | (0.55, 3.46) | (0.78, 1.16) | (0.87, 1.05) | (0.78, 1.08) | (0.87, 1.16) | (1.00, 1.05) | |
| Support from coworkers | 0.98 | 2.57a | 0.8 | 0.51 | 0.57 | 1.15 | 0.88a | – | 1.02 | 0.94 | 1.02 |
| 95% CI | (0.95, 1.02) | (1.05, 6.27) | (0.25, 2.57) | (0.23, 1.17) | (0.23, 1.43) | (0.91, 1.46) | (0.80, 0.96) | (0.85, 1.22) | (0.81, 1.10) | (0.99, 1.05) | |
| Support from friends and relatives | 0.96a | 1.18 | 1.71 | 0.61 | 1.25 | 0.94 | – | 0.91 | 1.07 | 0.97 | 0.99 |
| 95% CI | (0.92, 0.99) | (0.47, 2.97) | (0.48, 6.11) | (0.27, 1.39) | (0.46, 3.42) | (0.76, 1.16) | (0.83, 1.01) | (0.89, 1.28) | (0.83, 1.13) | (0.96, 1.02) | |
aSignificant at level p < 0.05, bsignificant at level p < 0.0055 (Bonferroni corrected for multiple testing).
Table 5
Estimated Odds ratio for 1 unit change (95% confidence interval) for demographic and health variables on the demand, control and support subscales from General Questionnaire for Psychological and Social factors at work (QPS Nordic) in males
| Demographic factors | Medical factors | ||||||||||
| Age | Mother tongue | Education | Low-skilled | Blue-collar | Comorbidity | Anxiety | Depression | Pain | Pain areas | Disability | |
| Quantitative demands | 0.99 | 0.81 | 0.87 | 0.52a | 1.36 | 1.17 | – | 1.12a | 1 | 1.22a | 1.01 |
| 95% CI | (0.96, 1.02) | (0.39, 1.70) | (0.33, 2.29) | (0.29, 0.95) | (0.73, 2.53) | (0.98, 1.38) | (1.03, 1.21) | (0.86, 1.16) | (1.04, 1.43) | (0.99, 1.04) | |
| Decision demands | 0.99 | 1.23 | 0.71 | 0.81 | 0.89 | 1.07 | 1.09a | – | 1.05 | 1.07 | 1.02 |
| 95% CI | (0.96, 1.02) | (0.60, 2.53) | (0.27, 1.84) | (0.45, 1.48) | (0.48, 1.67) | (0.90, 1.27) | (1.01, 1.18) | (0.91, 1.21) | (0.91, 1.25) | (1.00, 1.05) | |
| Learning demands | 0.97 | 1.48 | 1.35 | 0.73 | 1.18 | 1.09 | – | 1.13a | 1.04 | 0.83 | 0.98 |
| 95% CI | (0.94, 1.01) | (0.63, 3.46) | (0.43, 4.29) | (0.36, 1.45) | (0.57, 2.45) | (1.89, 1.33) | (1.03, 1,01) | (0.87, 1.23) | (0.69, 1.01) | (0.96, 1.01) | |
| Positive challenges | 1.02 | 0.34a | 2.81b | 0.28b | 0.52 | 1.11 | – | 0.93 | 1.02 | 1.08 | 1.02 |
| 95% CI | (0.99, 1.05) | (0.15, 0.78) | (1.02, 7.73) | (0.15, 0.54) | (0.26, 1.02) | (0.92, 1.34) | (0.86, 1.02) | (0.88, 1.19) | (0.92, 1.27) | (1.00, 1.05) | |
| Control of decisions | 1.03 | 1.22 | 1.48 | 0.29b | 0.57 | 1.03 | 0.96 | – | 1.07 | 1.06 | 0.97 |
| 95% CI | (1.00, 1.06) | (0.53, 2.80) | (0.53, 4.14) | (0.15, 0.57) | (0.29, 1.13) | (0.85, 1.23) | (0.89, 1.04) | (0.91, 1.26) | (0.90, 1.26) | (0.95, 1.00) | |
| Control of work pacing | 1.03 | 1.53 | 0.8 | 0.21b | 0.39a | 0.97 | 1.03 | – | 0.99 | 0.96 | 0.97 |
| 95% CI | (0.99, 1.06) | (0.61, 3.78) | (0.28, 2.27) | (0.10, 0.44) | (0.19, 0.81) | (0.79, 1.17) | (0.94, 1.13) | (0.84, 1.16) | (0.80, 1.14) | (0.94, 1.00) | |
| Support from superior | 0.97 | 0.30b | 1.28 | 0.7 | 0.74 | 0.9 | – | 0.89a | 1 | 0.89 | 0.98 |
| 95% CI | (0.94, 1.00) | (0.14, 0.66) | (0.50, 3.29) | (0.39, 1.26) | (0.40, 1.38) | (0.76, 1.06) | (0.83, 0.97) | (0.87, 1.16) | (0.76, 1.04) | (0.95, 1.00) | |
| Support from coworkers | 0.98 | 0.82 | 1.45 | 0.7 | 0.57 | 0.96 | – | 0.88b | 1.01 | 0.81a | 0.98 |
| 95% CI | (0.95, 1.01) | (0.39, 1.73) | (0.55, 3.78) | (0.38, 1.27) | (0.30, 1.08) | (0.81, 1.14) | (0.81, 0.95) | (0.87, 1.17) | (0.69, 0.95) | (0.96, 1.01) | |
| Support from friends and relatives | 0.97 | 1.68 | 1.36 | 1.08 | 1.01 | 0.99 | – | 0.91a | 0.96 | 0.91 | 0.97a |
| 95% CI | (0.94, 1.00) | (0.80, 3.53) | (0.50, 3.67) | (0.58, 2.01) | (0.53, 1.92) | (0.84, 1.17) | (0.84, 0.98) | (0.82, 1.13) | (0.77, 1.06) | (0.95, 1.00) | |
aSignificant at level p < 0.05, bsignificant at level p < 0.0055 (Bonferroni corrected for multiple testing).


