
Anthropometric accommodation percentage comparison for univariate and multivariate representative Mexican hand models
Abstract
BACKGROUND:
Adopting awkward postures at work has a great impact on productivity and work-related musculoskeletal disorders. Considering anthropometric data in the design of products and workplaces can diminish this impact. The traditional univariate-percentile-approach is one of the most implemented in the anthropometric analysis, even though it has proved limitations in comparison with multivariate-approaches.
OBJECTIVE:
To develop univariate and multivariate hand models considering four anthropometric dimensions, and to theoretically compare the univariate and multivariate accommodation percentages.
METHODS:
Univariate percentile models corresponding to the database of real subject nearest-neighbors to the 5th and 95th percentiles were obtained for the male and female population. Two multivariate approaches were implemented on the central 90% of both populations: 2D principal component analysis and archetypal analysis. The accommodation percentage for each family of models was obtained based on the population that simultaneously fit all the anthropometric dimensions. The goodness-of-fit and McNemar’s tests were performed to statistically analyze the accommodation percentages.
RESULTS:
Eight human hand models were obtained via Principal Component Analysis while two, three, four, and eight Archetypal Analysis models (male-population) and two, three, six, and eight Archetypal Analysis models (female-population) were selected after a root-sum-of-squares analysis for k = 1, ... ,10 archetypes.
CONCLUSION:
The results showed that the Principal Component Analysis models obtained a higher accommodation level, followed by the Archetypal Analysis and percentile models (male population). In the case of the female population, models obtained by multivariate-Archetypal Analysis (k = 8) obtained a higher accommodation percentage.
1Introduction
Ergonomics studies the relationship between humans, tasks, equipment, and physical, mental, and social environments [1]. Anthropometry is the part of ergonomics related to the measurement of the human body and the use of such measures in the design of workspaces, equipment, vehicles, and clothing to ensure that these physically fit the target population [2]. Awkward postures that are assumed when individual users of poor design workspaces, equipment, products, or clothing can reduce the work capacity and increase the risk of work-related musculoskeletal disorders (WMSD) [3, 4].
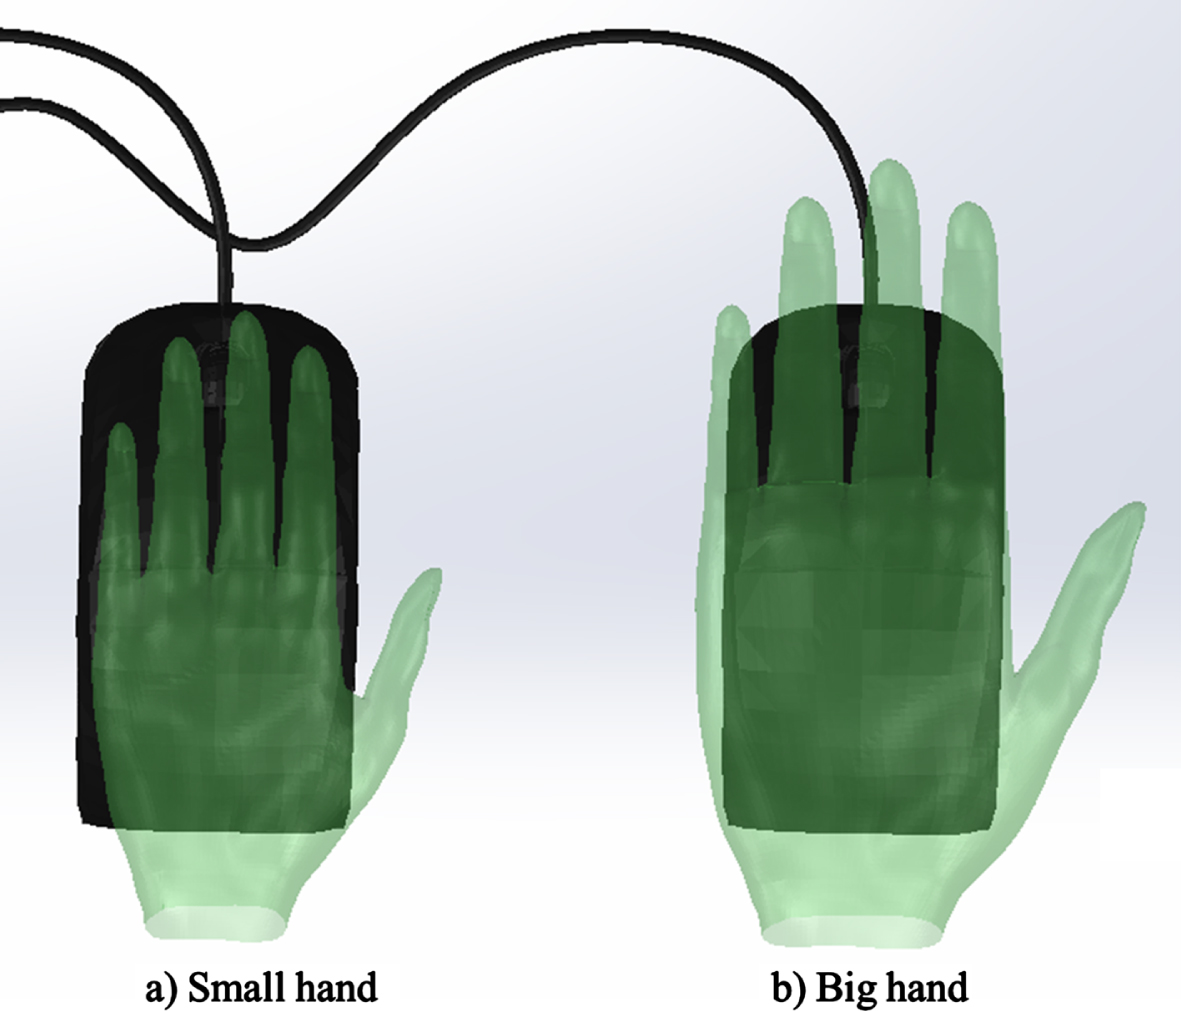
In hand tools design, several factors such as size, shape, texture, purpose, ease of operation, shock absorption, and weight should be considered to increment user performance and prevent the occurrence of WMSD [5]. Figure 1 shows the accommodation problem when using a computer mouse.
Fig. 1
Accommodation problem when using a computer mouse. Using an incorrect hand tool size can cause awkward postures, e.g. (a) opening/stretching fingers or (b) shrinking fingers to use the scroll button and to displace the mouse.
To diminish the risk of WMSD, there have been several studies related to hand anthropometry data and their comparison to those of other populations, such as agricultural workers [6, 7], industrial workers [8, 9], and mix office–manufacturer workers [10]. Describing the hand differences among the study subjects has also been reported in the literature [11].
It is well known that most anthropometric workstation and hand tool designs are based on univariate anthropometric data [12]. It has also been demonstrated that the use of percentiles can be inappropriate because percentile values are not additive unless they are equal to 50% [13–15]. Manikins, 2D or 3D human models, have been used to develop a set of human models that can be used to evaluate the fitting of the designs [16]. In the boundary manikin approach, a set of individual manikins representing the extremes of the most critical measures is identified to accommodate a target level of accommodation or percentage of the target user population [17]. Principal Component Analysis (PCA) and Archetypal Analysis (AA) are some of the most commonly multivariate boundary approaches used in anthropometrics [18, 19]. Several studies have investigated representative human models for different populations and anatomical regions across the world by using multivariate approaches such as principal component analysis (PCA) and archetypal analysis (AA), mainly in crew cab design [14, 18–28]. Despite the importance of hand anthropometric data, there have been few studies related to handshape and size. Chang et al. [28] developed a bicycle handle family of models using clustering techniques (k-means), obtaining three model sizes: small, medium and large. Eksioglu [29] analyzed different grip spans to determine the optimum range for hand-held devices (such as portable power tools), and Lee et al. [30] studied the relationship between hand size, grip span and force exerted, and found that grip span preferences were different in small and medium-large hand size subjects. Jee and Yun [10] analyzed the factors influencing handshape (i.e., handbreadth, palm length, and finger length) and distinguished four handshape types using factor and cluster analyses. Rodriguez et al. [31] found 14 cases for four-hand dimensions of the northwest Mexican population, using a 3D-PCA analysis and archetypal analysis for the 98% adjusted sphere.
This study aimed to model the northwest Mexican population’s dominant hand shape through the univariate and multivariate approaches and to compare their accommodation percentages to provide additional information on what approach results could be used. The authors found no previous study that statistically analyzed the anthropometric accommodation percentage of univariate and multivariate hand shape models in the northwestern Mexican population.
1.1Boundary approaches
In multivariate analysis, there are two principal techniques used in defining families of manikins, or cases, to improve physical accommodation: design based on boundary approaches and design based on distributed approaches [32, 33]. Boundary approaches identify individuals located at the edges of the population distribution, using a similar criterion as in designing for the extreme users. Two of the most implemented boundary approaches are PCA and AA. On the other hand, distributed approaches determine individuals that are dispersed through the population distribution [33], such as partitional, hierarchical, and probabilistic approaches used in clustering.
1.1.1Principal Component Analysis
PCA is one of the oldest and most widely-used techniques to reduce the dimensionality of large datasets while preserving as much variability as possible. PCA translates the original variable into new ones that are linear functions of the original dataset and are uncorrelated with each other. An advantage of this transformation is that PCA as a descriptive tool needs no distributional assumptions [34]. After transforming data, the PCA boundary-approach adjusts data to a specific population percentage, usually 90 and 95%, through the first two principal components (PCs) for a 2D analysis, and three PCs in a 3D analysis. Eight cases can be identified in a 2D-analysis (four at the intersection of the axes, and four at the midpoints of the quadrants) and 14 in a 3D analysis (six at the intersection of the axes and 8 at the midpoints of the quadrants) [35].
1.1.2Archetypal analysis
AA assumes that individuals are a mixture of several pure subjects, called archetypes. This approach identifies the pure subjects assuming they are at the edge of the population distribution [18]. The objective of AA is to find a kxn matrix (Z) that defines k archetypal characteristics; this can be expressed as finding two nxk coefficient matrices (α and β) that minimize the residual sum of squares (RSS):
2Materials and methods
2.1Anthropometric data
A total of 3,394 subjects (2,613 males and 781 females) were randomly selected from healthy professors, graduate and postgraduate students, and industrial workers residing in northwestern Mexico when the survey was conducted. The subject’s age ranged from 18 to 61 years old. Four hand measurements (three lineal dimensions and one circumference) were taken from the dominant hand (Table 1). To identify the dominant hand, the subjects were asked which hand they frequently used to accomplish their fundamental daily life tasks [36].
Table 1
Anthropometric dimensions [36]
| Abbreviation | Anthropometric dimension | Description | Measurement unit |
| HL | Hand length | Length of the dominant hand between thestylion landmark of the wrist and the tip of themiddle finger | cm |
| PL | Palm length | The length of the dominant hand between the landmarks of metacarpal 2 and metacarpal 5 | cm |
| PW | Palm width | Width of the palm measure below the knuckles, excluding the thumb | cm |
| HGD | Hand grip diameter | The maximum circumference of the circledrawn by the index finger and thumb of thedominant hand | mm |
Trained and experienced technicians carried out the measurements. The hand dimensions were taken with a calibrated Martin type 0–300 mm sliding caliper with 1 mm accuracy, part of the Clarita I kit and the lineal dimension values were registered in cm. The grip diameter was measured using a calibrated 27.8 cm height and 35–95 mm diameter range grip cone and was registered in mm.
2.2Statistical analysis
The 5th and 95th percentiles were calculated for each anthropometric dimension (AD). The mean, standard deviation (SD), max, and min values were also obtained. The nearest neighbors to 5%–95% were chosen based on the Euclidean distance to compare the univariate and multivariate accommodation percentages.
To accomplish the multivariate analysis, the AD values were standardized using the normal distribution. Then two boundary methods were considered in this study: PCA and AA. In PCA, the four AD were transformed into a new dimensional space, where all the components were orthogonal to one another so that the requirement for normality of the data did not need to be met.
Next, the PCA scores were standardized using the normal distribution, and the central 90% circle (mean = 0; SD = 1) was adjusted to the data instead of the usual ellipse [37]. A total of eight theoretical boundary cases were identified on the circle contour. The real boundary subjects were determined by selecting the subject closest to the boundary case point within the ellipse, usually named the nearest neighbor (NN). The Euclidean distance was used as the similitude metric to find the NN. Multivariate-PCA was performed using Matlab 2020a.
On the other hand, in AA all the individuals are considered as a mixture of several “pure” individuals who are on the “edges” of the data [19]. AA was performed using the anthropometry package developed by Vinue, G. in RStudio [38]. Due to the dataset size, the AA was performed based on that anthropometric data could be approximated using a normal distribution [39]. The analysis was performed for k = 1, ... ,10 archetypes, due to the unknown number of archetypes in AA. The best k-value was determined through a graphical analysis of the root-sum-squared (RSS) values, and the NN based on the Euclidean distance was used to define the real boundary cases to the archetypes.
The percentile corresponding to each AD value was obtained based on the complete database for both the univariate and multivariate approaches. To compare the univariate and multivariate accommodation percentages, each approach’s limits were defined based on the procedure used by Da Silva et al. [40]. The approach limits that were chosen were the real NN of the 5th–95th theoretical percentiles in the percentile approach and the minimum and maximum values for each anthropometric dimension for the multivariate approach. The number of captured subjects and the accommodation percentage were determined based on the subjects in which the four variables were simultaneously limited. If a subject failed to fit one variable limit, he or she was considered not accommodated.
Two statistical tests were then performed to analyze the accommodation percentage: the chi-squared goodness-of-fit test, to determine the model’s ability to estimate the number of captured subjects, and McNemar’s test, to evaluate whether the accommodation proportions in the univariate and multivariate approaches are equal.
3Results
The univariate-percentile values and the mean, SD, and min and max values are presented in Table 2 for both populations. The 5th–95th percentiles NN are also presented in Table 2. Correlation matrices for female and male populations are presented in Table 3. HL is highly correlated to PL and moderately correlated to HGD, while the rest of the variables are less correlated. Table 4 shows the non-rotated PCA coefficients for the four-hand AD. In the case of the male population, the first two principal components (PCs) were used to define the body models as the first two components accounted for 80.19% of the total variance, while the first two PCs accounted for 78.15% of the total variance for the female population. The total variance explained exceeded the common practice of using a 70% variability threshold [34]. PCA for the male population indicates that PC1, which was positive, predicted the overall hand size, while PC2 contrasts the HL and HGD measurements with the PL and PW measurements. Finally, PC3 contrasts the HL and PL measurements with the rest of the dimensions, and PC4 contrasted HL with PL, PW, and HGD [31]. In the case of the female population, PC1 can be used to predict the overall hand size, while PC2 contrasts the HL, PL, and HGD with PW. On the other hand, PC3 contrasts the HL and PL with PW, and HGD, and PC4 contrasts HL with the rest of the measurements.
Table 2
Male percentiles, means, and standard deviations
| Male | AD | Theoretical percentiles | Percentile nearest neighbor | Mean | SD | Min | Max | ||
| 5th | 95th | 5th | 95th | ||||||
| HL | 17.4 | 20.2 | 17.3 | 20.2 | 18.8 | 0.9 | 15.5 | 22.0 | |
| PL | 9.8 | 11.7 | 9.8 | 11.6 | 10.8 | 0.6 | 8.2 | 13.3 | |
| PW | 8.0 | 9.6 | 8.2 | 9.5 | 8.8 | 0.5 | 7.0 | 10.7 | |
| HGD | 42.0 | 54.0 | 42.0 | 54.0 | 47.9 | 3.8 | 36.0 | 60.0 | |
| Female | AD | Theoretical percentiles | Percentile nearest neighbor | Mean | SD | Min | Max | ||
| 5th | 95th | 5th | 95th | ||||||
| HL | 16.10 | 18.80 | 15.90 | 19.20 | 17.41 | 0.80 | 14.60 | 20.70 | |
| PL | 9.10 | 10.90 | 8.90 | 11.10 | 9.95 | 0.55 | 8.40 | 12.00 | |
| PW | 7.10 | 8.60 | 7.60 | 8.40 | 7.75 | 0.50 | 6.60 | 10.40 | |
| HGD | 40.00 | 51.00 | 39.00 | 55.00 | 45.07 | 3.55 | 34.00 | 57.00 | |
*AD – anthropometric dimension; SD – standard deviation; Min – minimum; Max – maximum; HL – hand length; PL – palm length; PW – palm width; HGD – handgrip diameter.
Table 3
Correlation matrix for the hand dimensions
| Male | HL | PL | PW | HGD | |
| HL | 1.0000 | 0.7817 | 0.4359 | 0.5511 | |
| PL | 0.7817 | 1.0000 | 0.3888 | 0.3919 | |
| PW | 0.4359 | 0.3888 | 1.0000 | 0.2388 | |
| HGD | 0.5511 | 0.3919 | 0.2388 | 1.0000 | |
| Female | HL | PL | PW | HGD | |
| HL | 1.0000 | 0.7500 | 0.4030 | 0.5250 | |
| PL | 0.7500 | 1.0000 | 0.3786 | 0.3786 | |
| PW | 0.4030 | 0.3786 | 1.0000 | 0.2844 | |
| HGD | 0.5250 | 0.3786 | 0.2844 | 1.0000 |
Table 4
PCA coefficients, eigenvalues, and percentage of explained variance for the hand dimensions
| Male | AD | PC1 | PC2 | PC3 | PC4 |
| HL | 0.5880 | –0.0996 | –0.2508 | 0.7626 | |
| PL | 0.5479 | 0.0043 | –0.5724 | –0.6101 | |
| PW | 0.3996 | 0.7975 | 0.4485 | –0.0564 | |
| HGD | 0.4410 | –0.5951 | 0.6390 | –0.2077 | |
| Eigenvalues | 2.43 | 0.76 | 0.60 | 0.19 | |
| % explained variance | 60.95 | 19.24 | 15.01 | 4.81 | |
| Cumulative % | 60.95 | 80.19 | 95.19 | 100.00 | |
| Female | AD | PC1 | PC2 | PC3 | PC4 |
| HL | 0.5797 | –0.1764 | –0.2588 | 0.7522 | |
| PL | 0.5444 | –0.0803 | –0.5504 | –0.6279 | |
| PW | 0.4071 | 0.8664 | 0.2889 | –0.0111 | |
| HGD | 0.4492 | –0.4601 | 0.7393 | –0.1997 | |
| Eigenvalues | 2.39 | 0.73 | 0.65 | 0.23 | |
| % explained variance | 59.85 | 18.30 | 16.14 | 5.71 | |
| Cumulative % | 59.85 | 78.15 | 94.29 | 100.00 |
*PCA – principal component analysis; AD – anthropometric dimension; PC – principal component; HL – hand length; PL – palm length; PW – palm width; HGD – handgrip diameter.
A central 90% accommodation circle was adjusted to the data, and the theoretical and real NN to each theoretical boundary case was determined (Figs. 2 and 3). The AD and percentile values for each real boundary case are presented in Tables 5 and 6 for both populations. The min and max values for each AD are also presented in Table 5.
Fig. 2
Theoretical boundary cases obtained via principal component analysis.
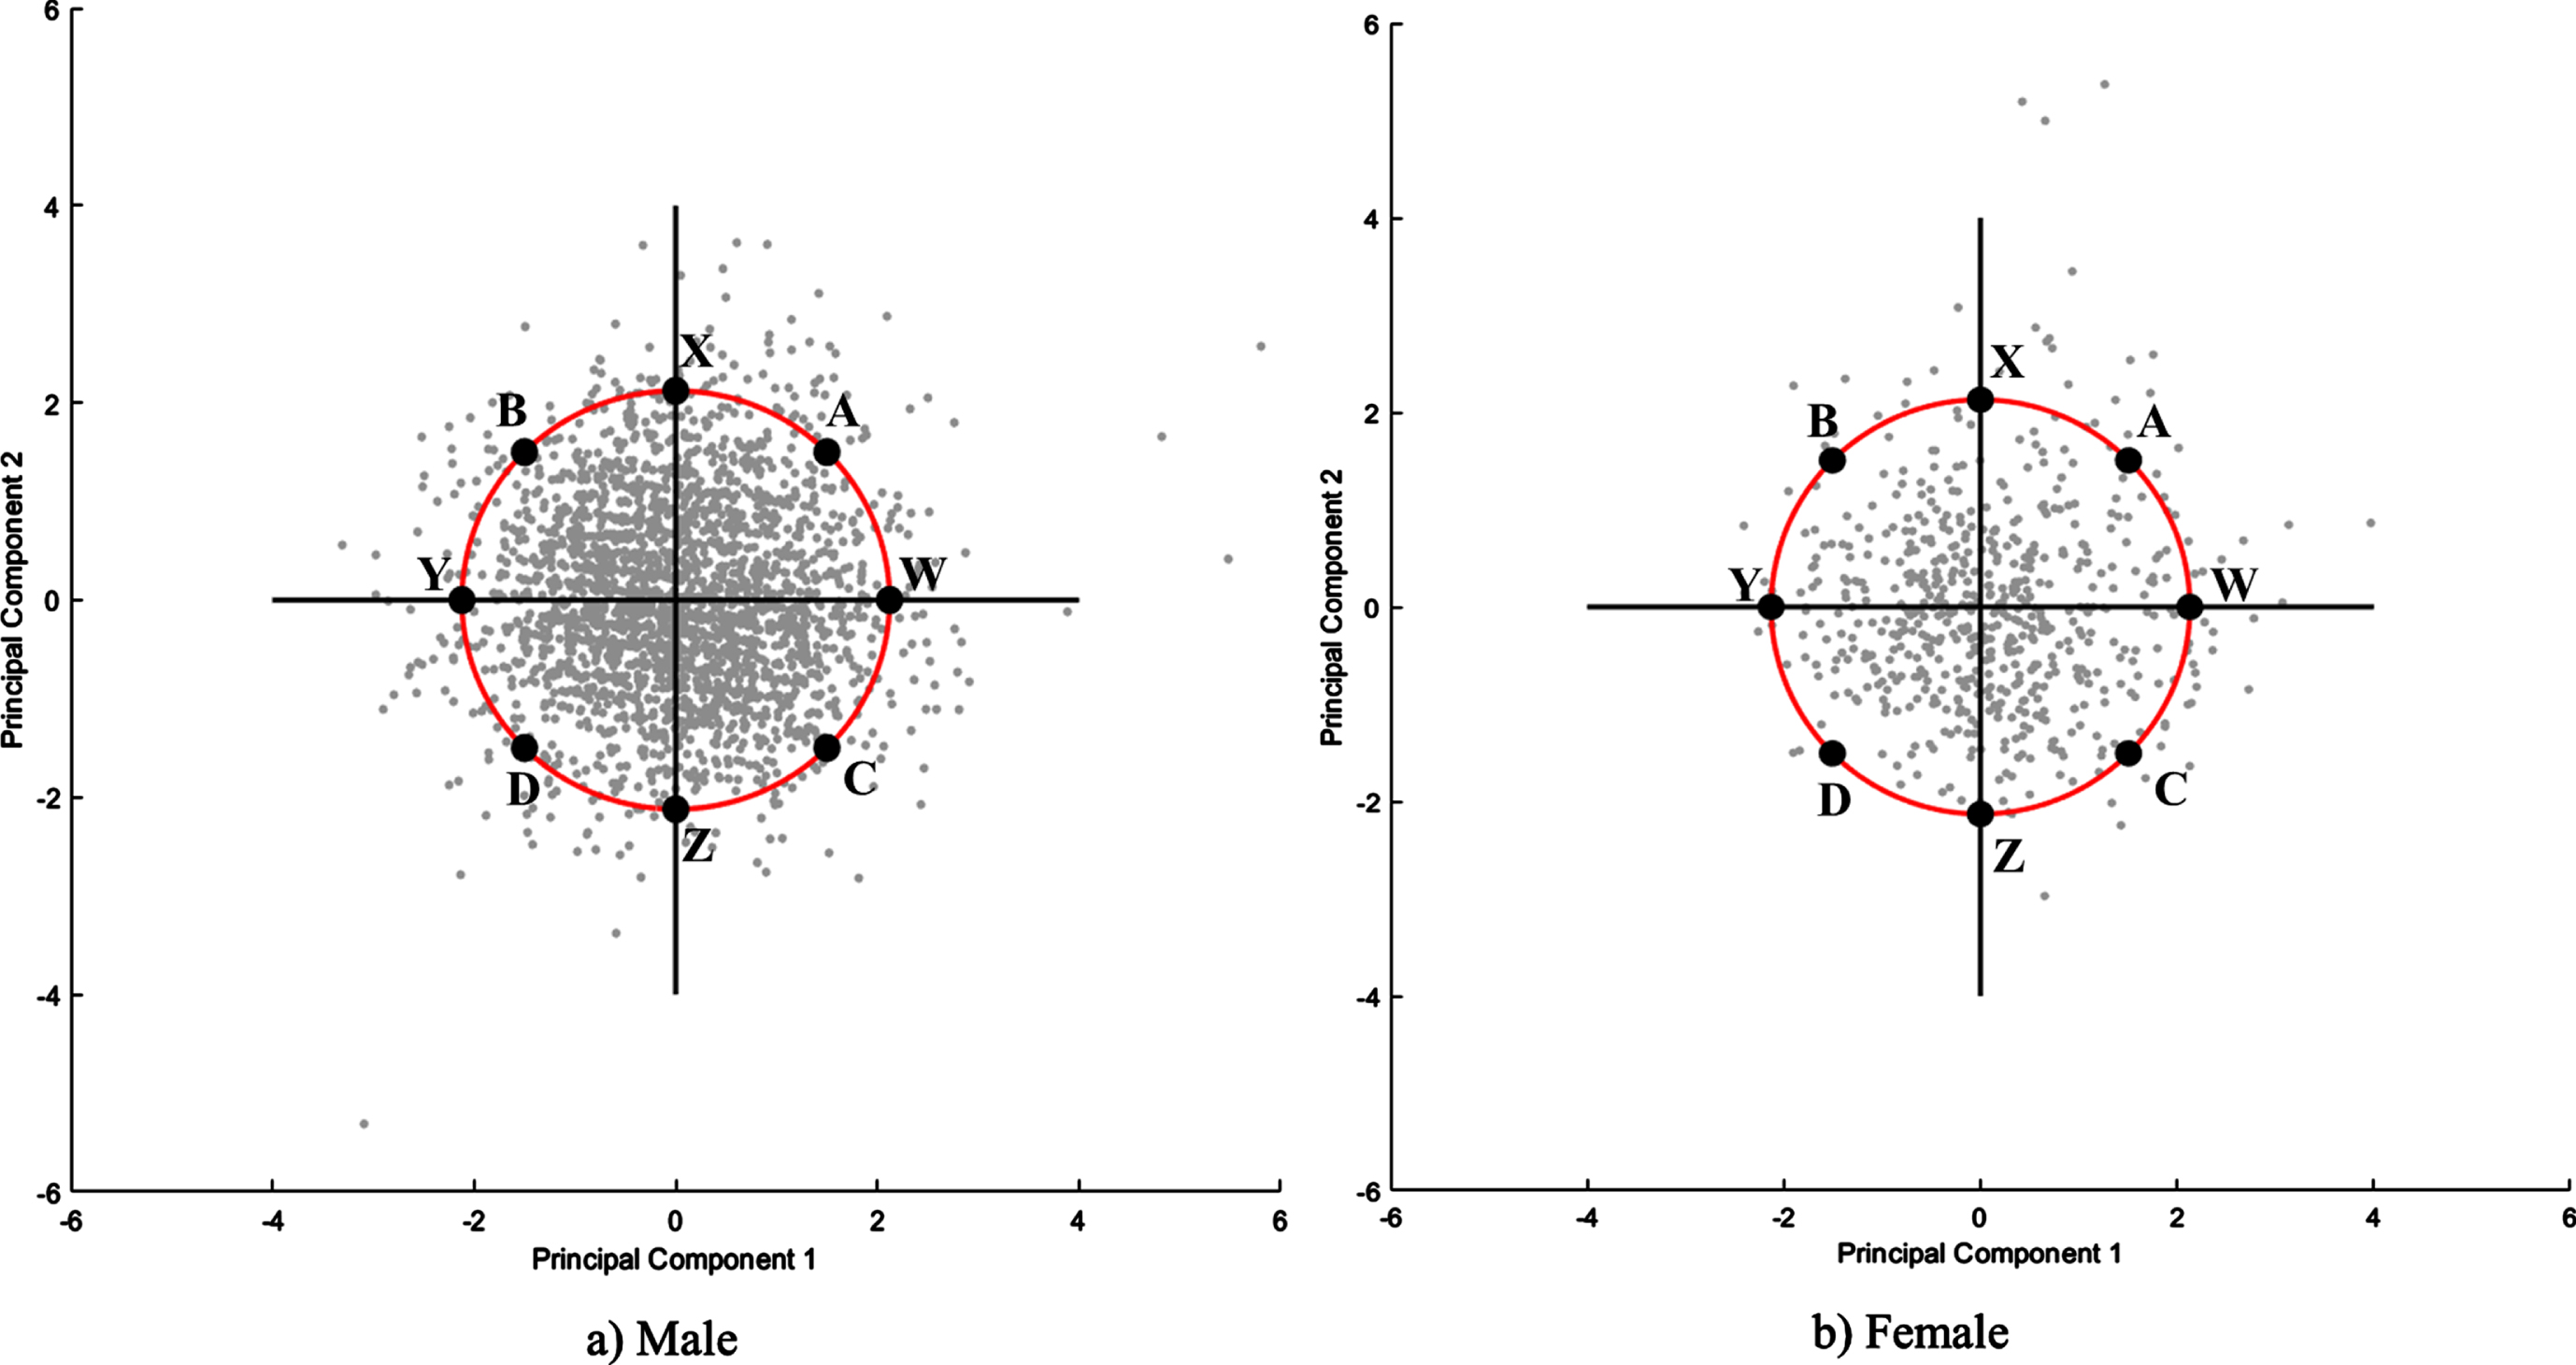
Fig. 3
Real boundary cases obtained via principal component analysis.
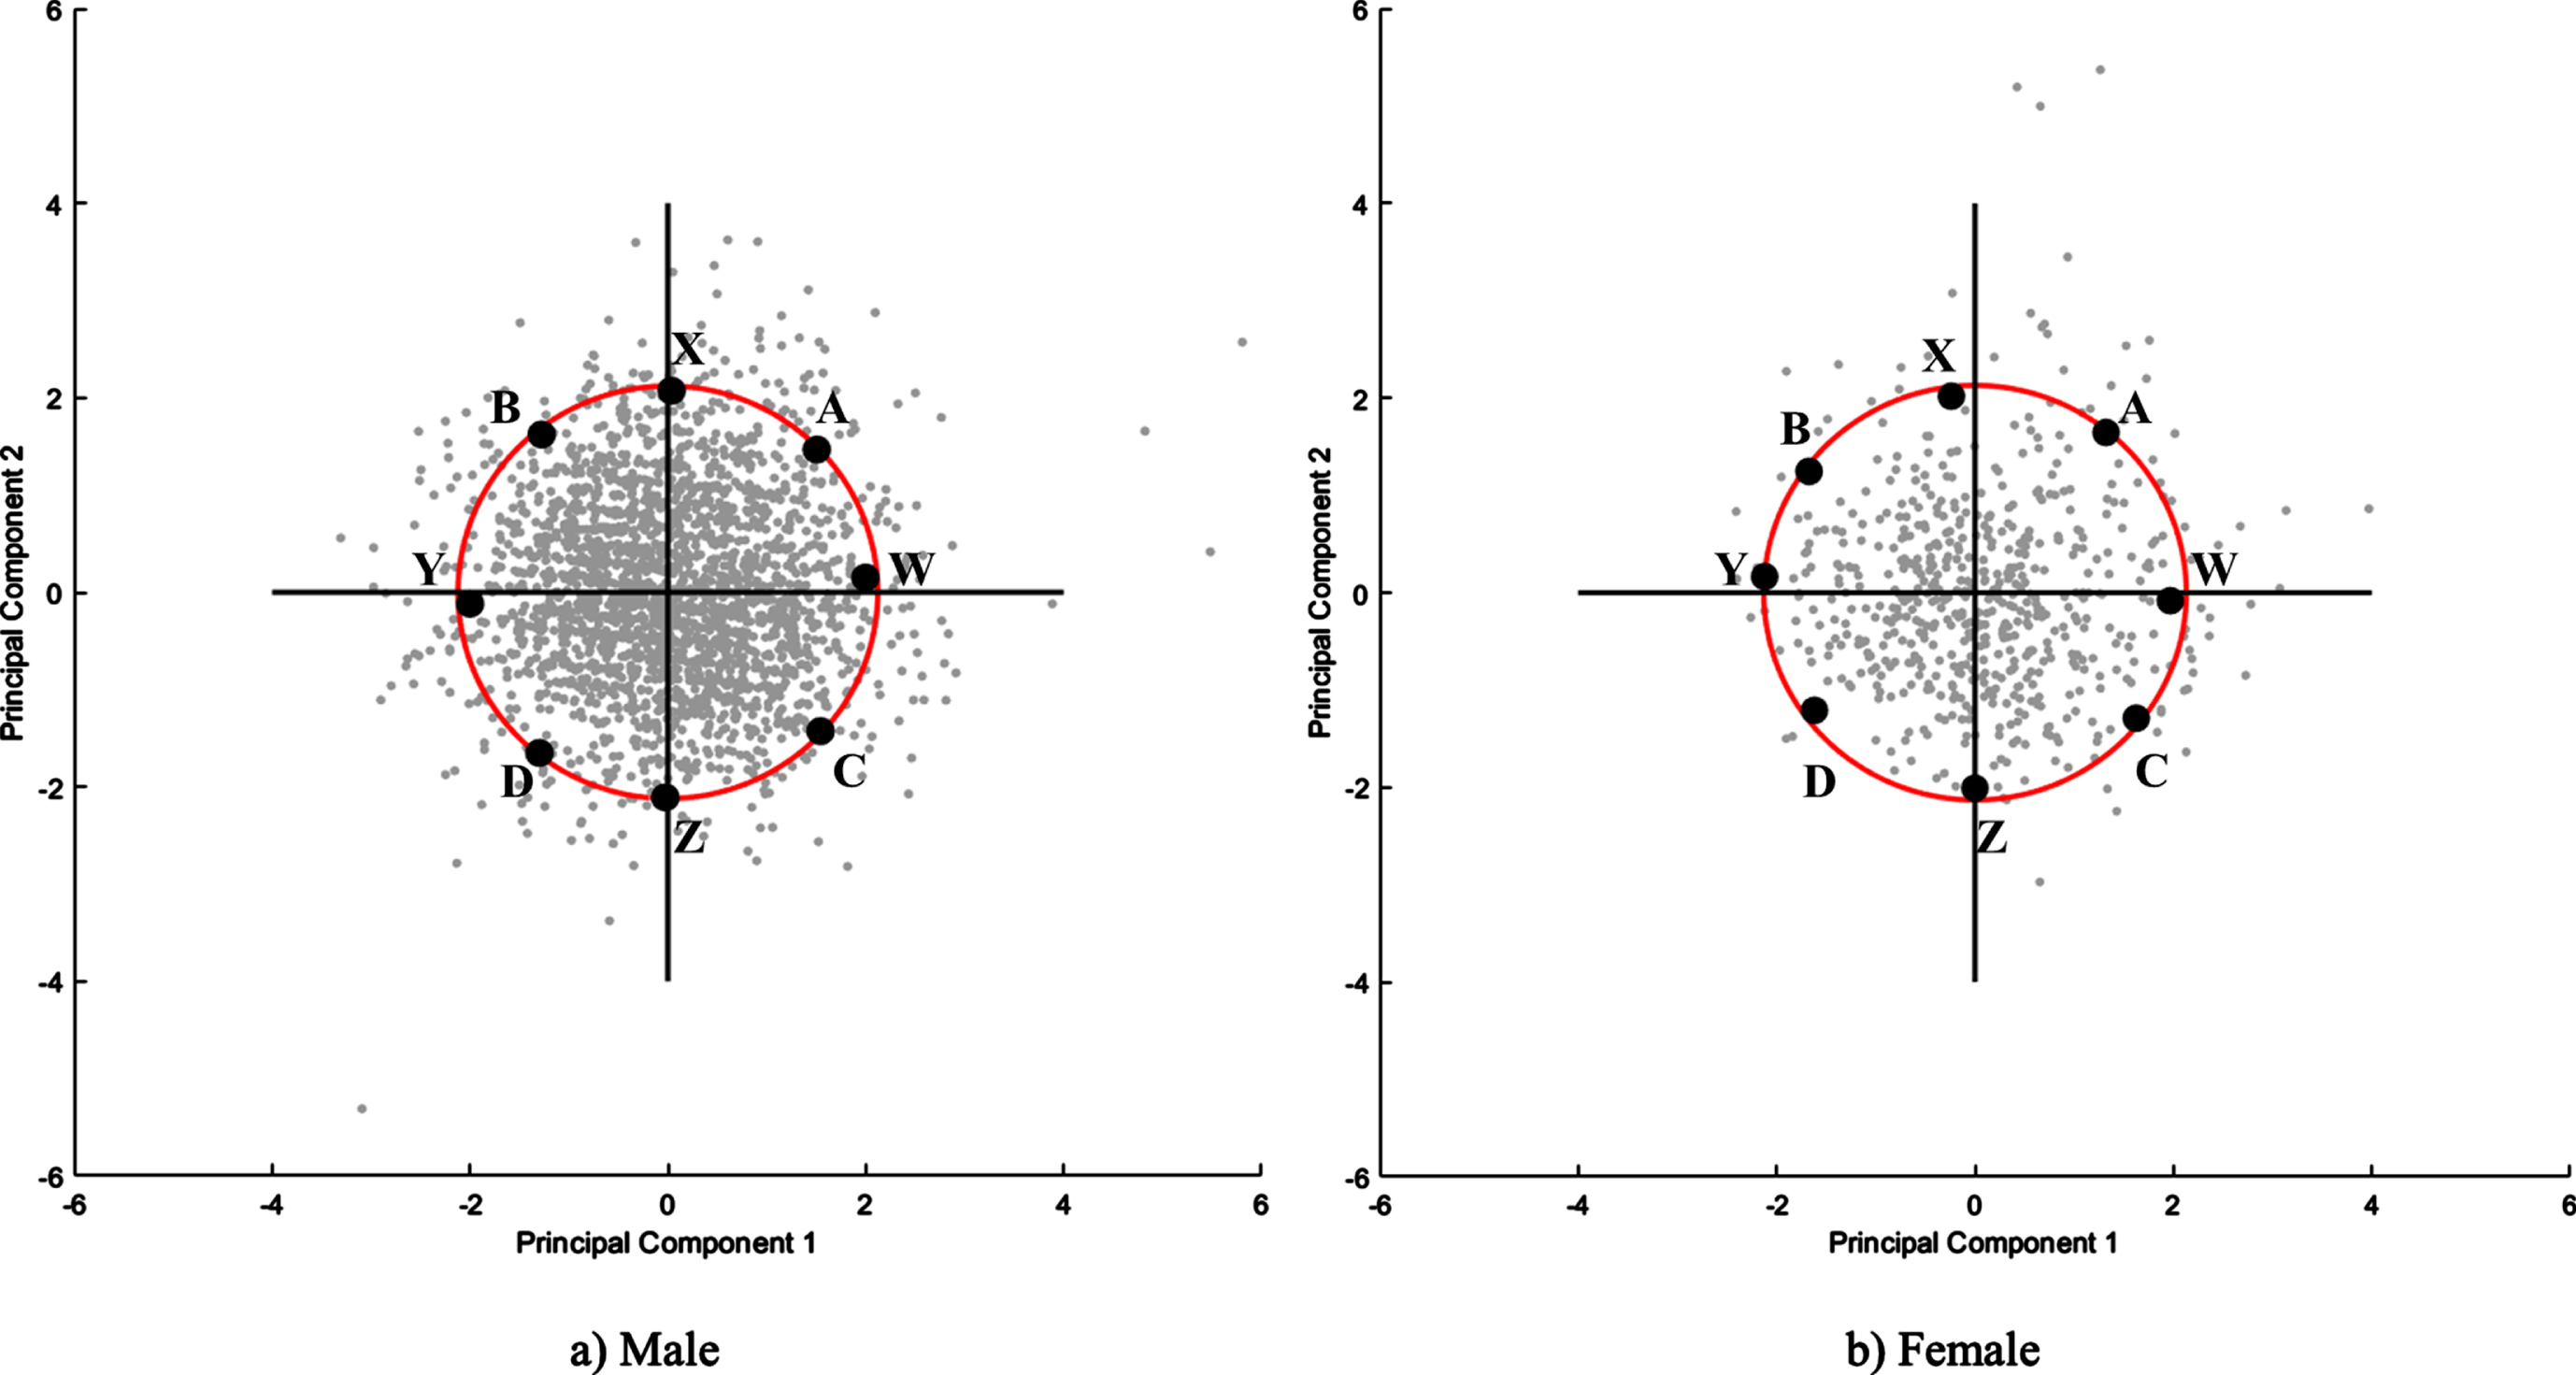
Table 5
Dimension values for the boundary cases obtained via PCA
| Male | AD | Cases | |||||||
| W | X | Y | Z | A | B | C | D | ||
| HL | **21.1 | 18.6 | *17.3 | 18.7 | 20.0 | 17.5 | 20.5 | 17.8 | |
| PL | **12.2 | 11.1 | *9.6 | 10.5 | 11.2 | 9.8 | 11.5 | 9.6 | |
| PW | 9.1 | 9.4 | 8.1 | 8.2 | **9.9 | 9.1 | 8.7 | *8.0 | |
| HGD | 49.0 | *43.0 | 43.0 | **54.0 | 50.0 | 43.0 | 54.0 | 50.0 | |
| Female | AD | Cases | |||||||
| W | X | Y | Z | A | B | C | D | ||
| HL | **19.5 | 16.9 | *15.5 | 17.2 | 18.2 | 16.2 | 16.4 | 18.9 | |
| PL | 10.0 | 9.6 | 9.0 | 10.0 | **11.0 | *8.7 | 9.2 | 10.6 | |
| PW | 8.5 | 8.5 | 7.2 | *7.1 | **8.6 | 7.8 | 6.8 | 7.8 | |
| HGD | **52.0 | 43.0 | *41.0 | 50.0 | 43.0 | *41.0 | 43.0 | 51.0 | |
*Minimum values; **Maximum values; PCA – principal component analysis; AD – anthropometric dimension; HL – hand length; PL – palm length; PW – palm width; HGD – handgrip diameter.
Table 6
Percentile values for the boundary cases obtained via PCA
| Male | AD | Cases | |||||||
| W | X | Y | Z | A | B | C | D | ||
| HL | 100 | 40 | 4 | 45 | 28 | 45 | 63 | 58 | |
| PL | 98 | 69 | 4 | 35 | 79 | 79 | 52 | 40 | |
| PW | 74 | 89 | 9 | 13 | 98 | 18 | 37 | 37 | |
| HGD | 61 | 10 | 10 | 94 | 91 | 51 | 51 | 98 | |
| Female | AD | Cases | |||||||
| W | X | Y | Z | A | B | C | D | ||
| HL | 59 | 64 | 22 | 64 | 100 | 26 | 1 | 39 | |
| PL | 54 | 74 | 21 | 80 | 54 | 26 | 4 | 54 | |
| PW | 19 | 38 | 54 | 31 | 93 | 93 | 14 | 10 | |
| HGD | 4 | 80 | 28 | 60 | 97 | 28 | 13 | 92 | |
PCA – principal component analysis; AD – anthropometric dimension; HL – hand length; PL – palm length; PW – palm width; HGD – handgrip diameter.
In the AA results, Fig. 4 shows the RSS for the archetypal models obtained for k = 1, ... ,10. In the case of the male population (Fig. 4a) three inflection points can be identified at k = 3,4, and 5, and three inflection points at k = 2,3 and 6 can be identified for the female population (Fig. 4b). The dimension and percentile values are presented in Tables 7–10, respectively. Figures 5 and 6 show the real boundary case for the male and female populations, respectively. The min and max limit values used in multivariate accommodation percentage calculation are also presented in Tables 7 and 9. In the case of the male population, the k = 2 results for the multivariate approaches revealed that cases 1 and 2 were similar to cases Y and C, respectively. The comparison of the k = 3 results showed that case 3 could be interpreted as case Y from PCA. For k = 4, cases 2, 3, and 4 are similar to cases Y, A, and Z, respectively. Considering k = 8 for AA, cases 1, 3, 5, and 8 are similar to D, Z, B, and W, respectively. The min and max limit values are presented in Table 7. In the case of the female population, cases 1 and 2, for k = 2, are similar to cases C and Y respectively. For k = 3, case 1 is similar to case Y obtained from PCA while case 2 is a kind of mixture of cases A and B. Cases 1 and 5 are similar to cases Z and X, for k = 6. In the case of k = 8, cases 4, 6, and 8 are similar to cases B, W, and C, respectively.
Fig. 4
Root-sum-squared values for the k = 1, ... ,10 archetypes.
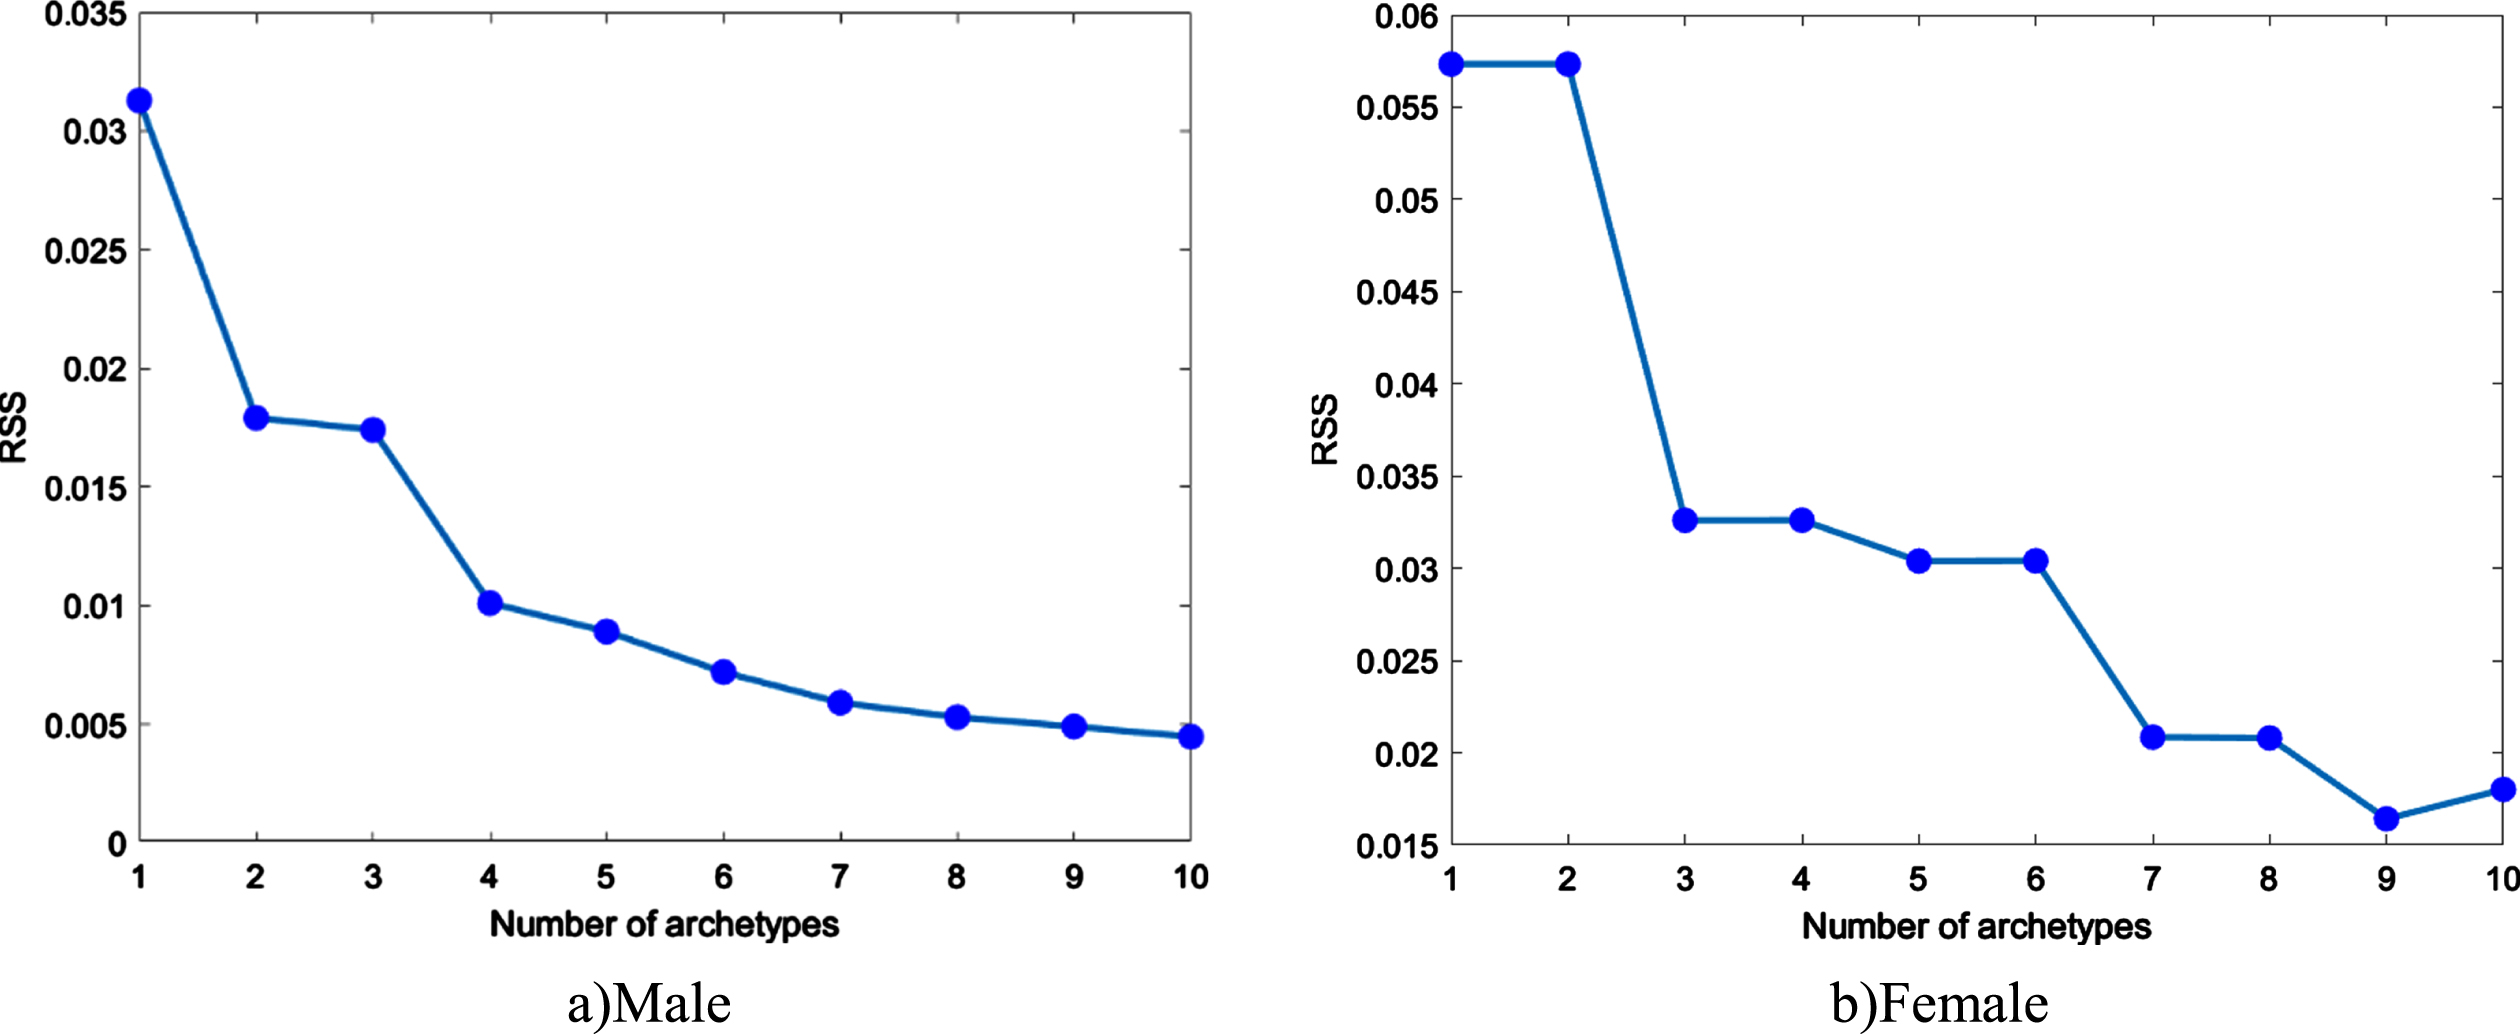
Fig. 5
Real boundary cases obtained via AA, male population.
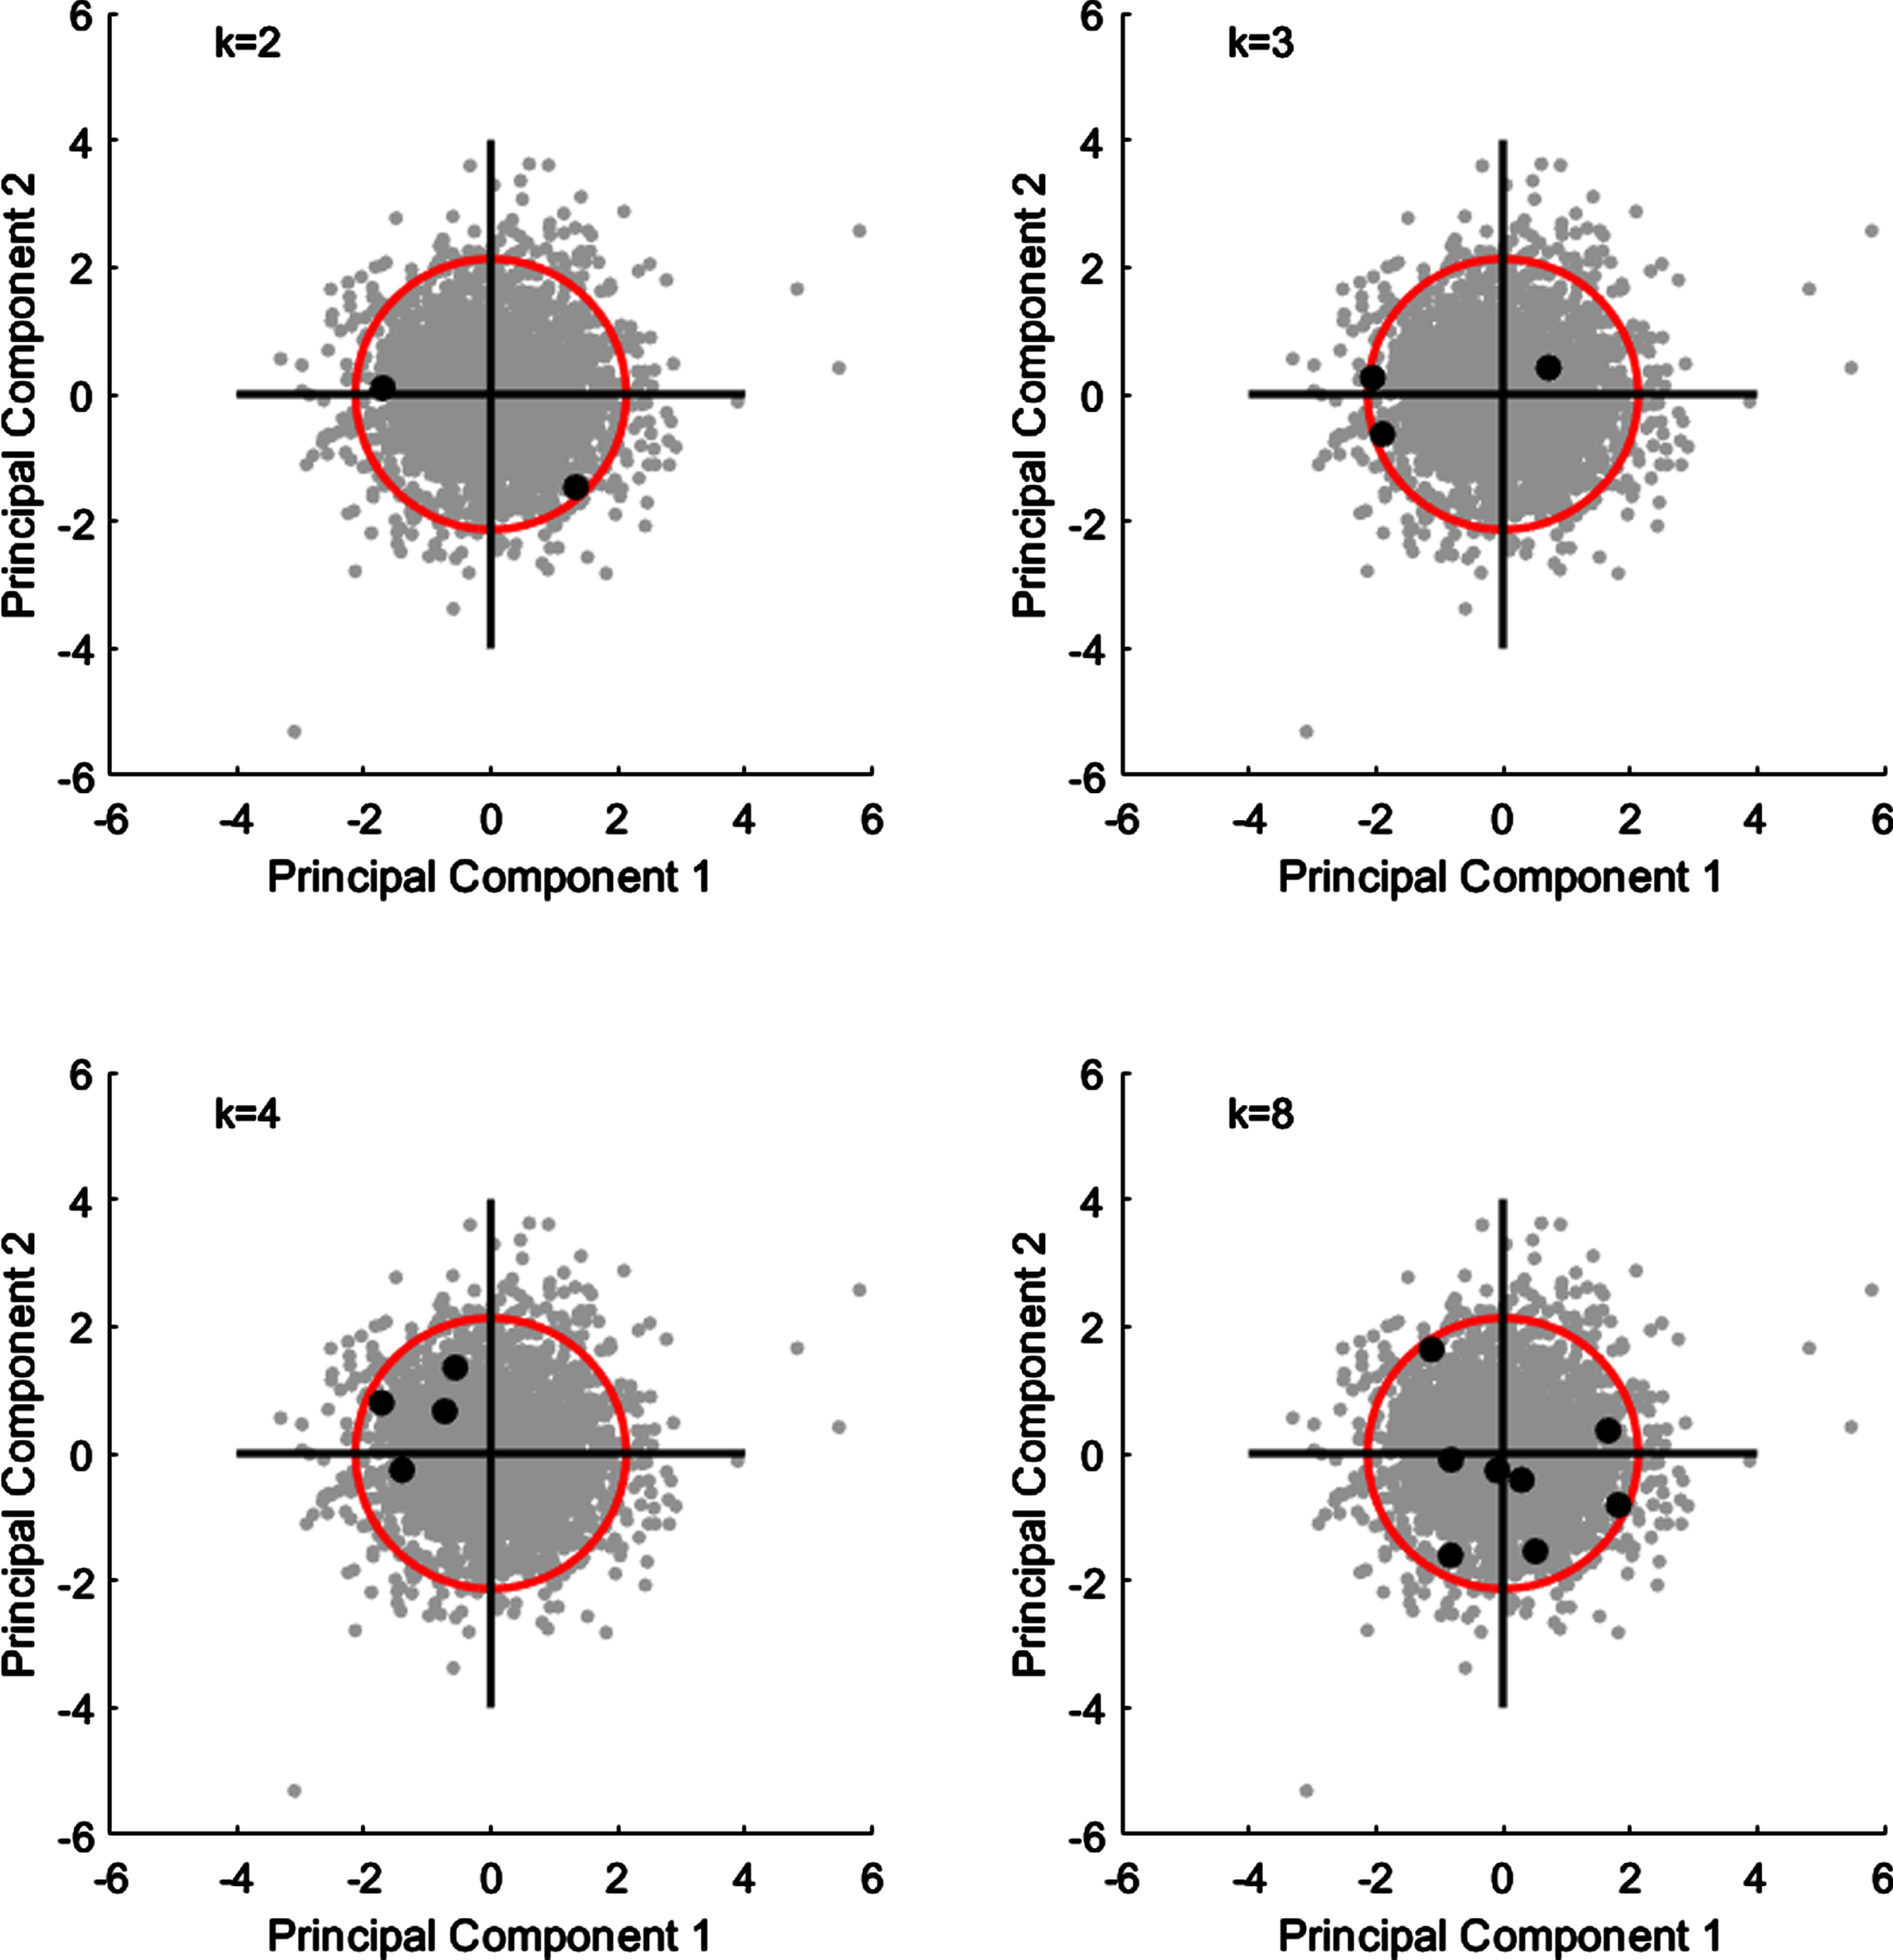
Fig. 6
Real boundary cases obtained via AA, female population.
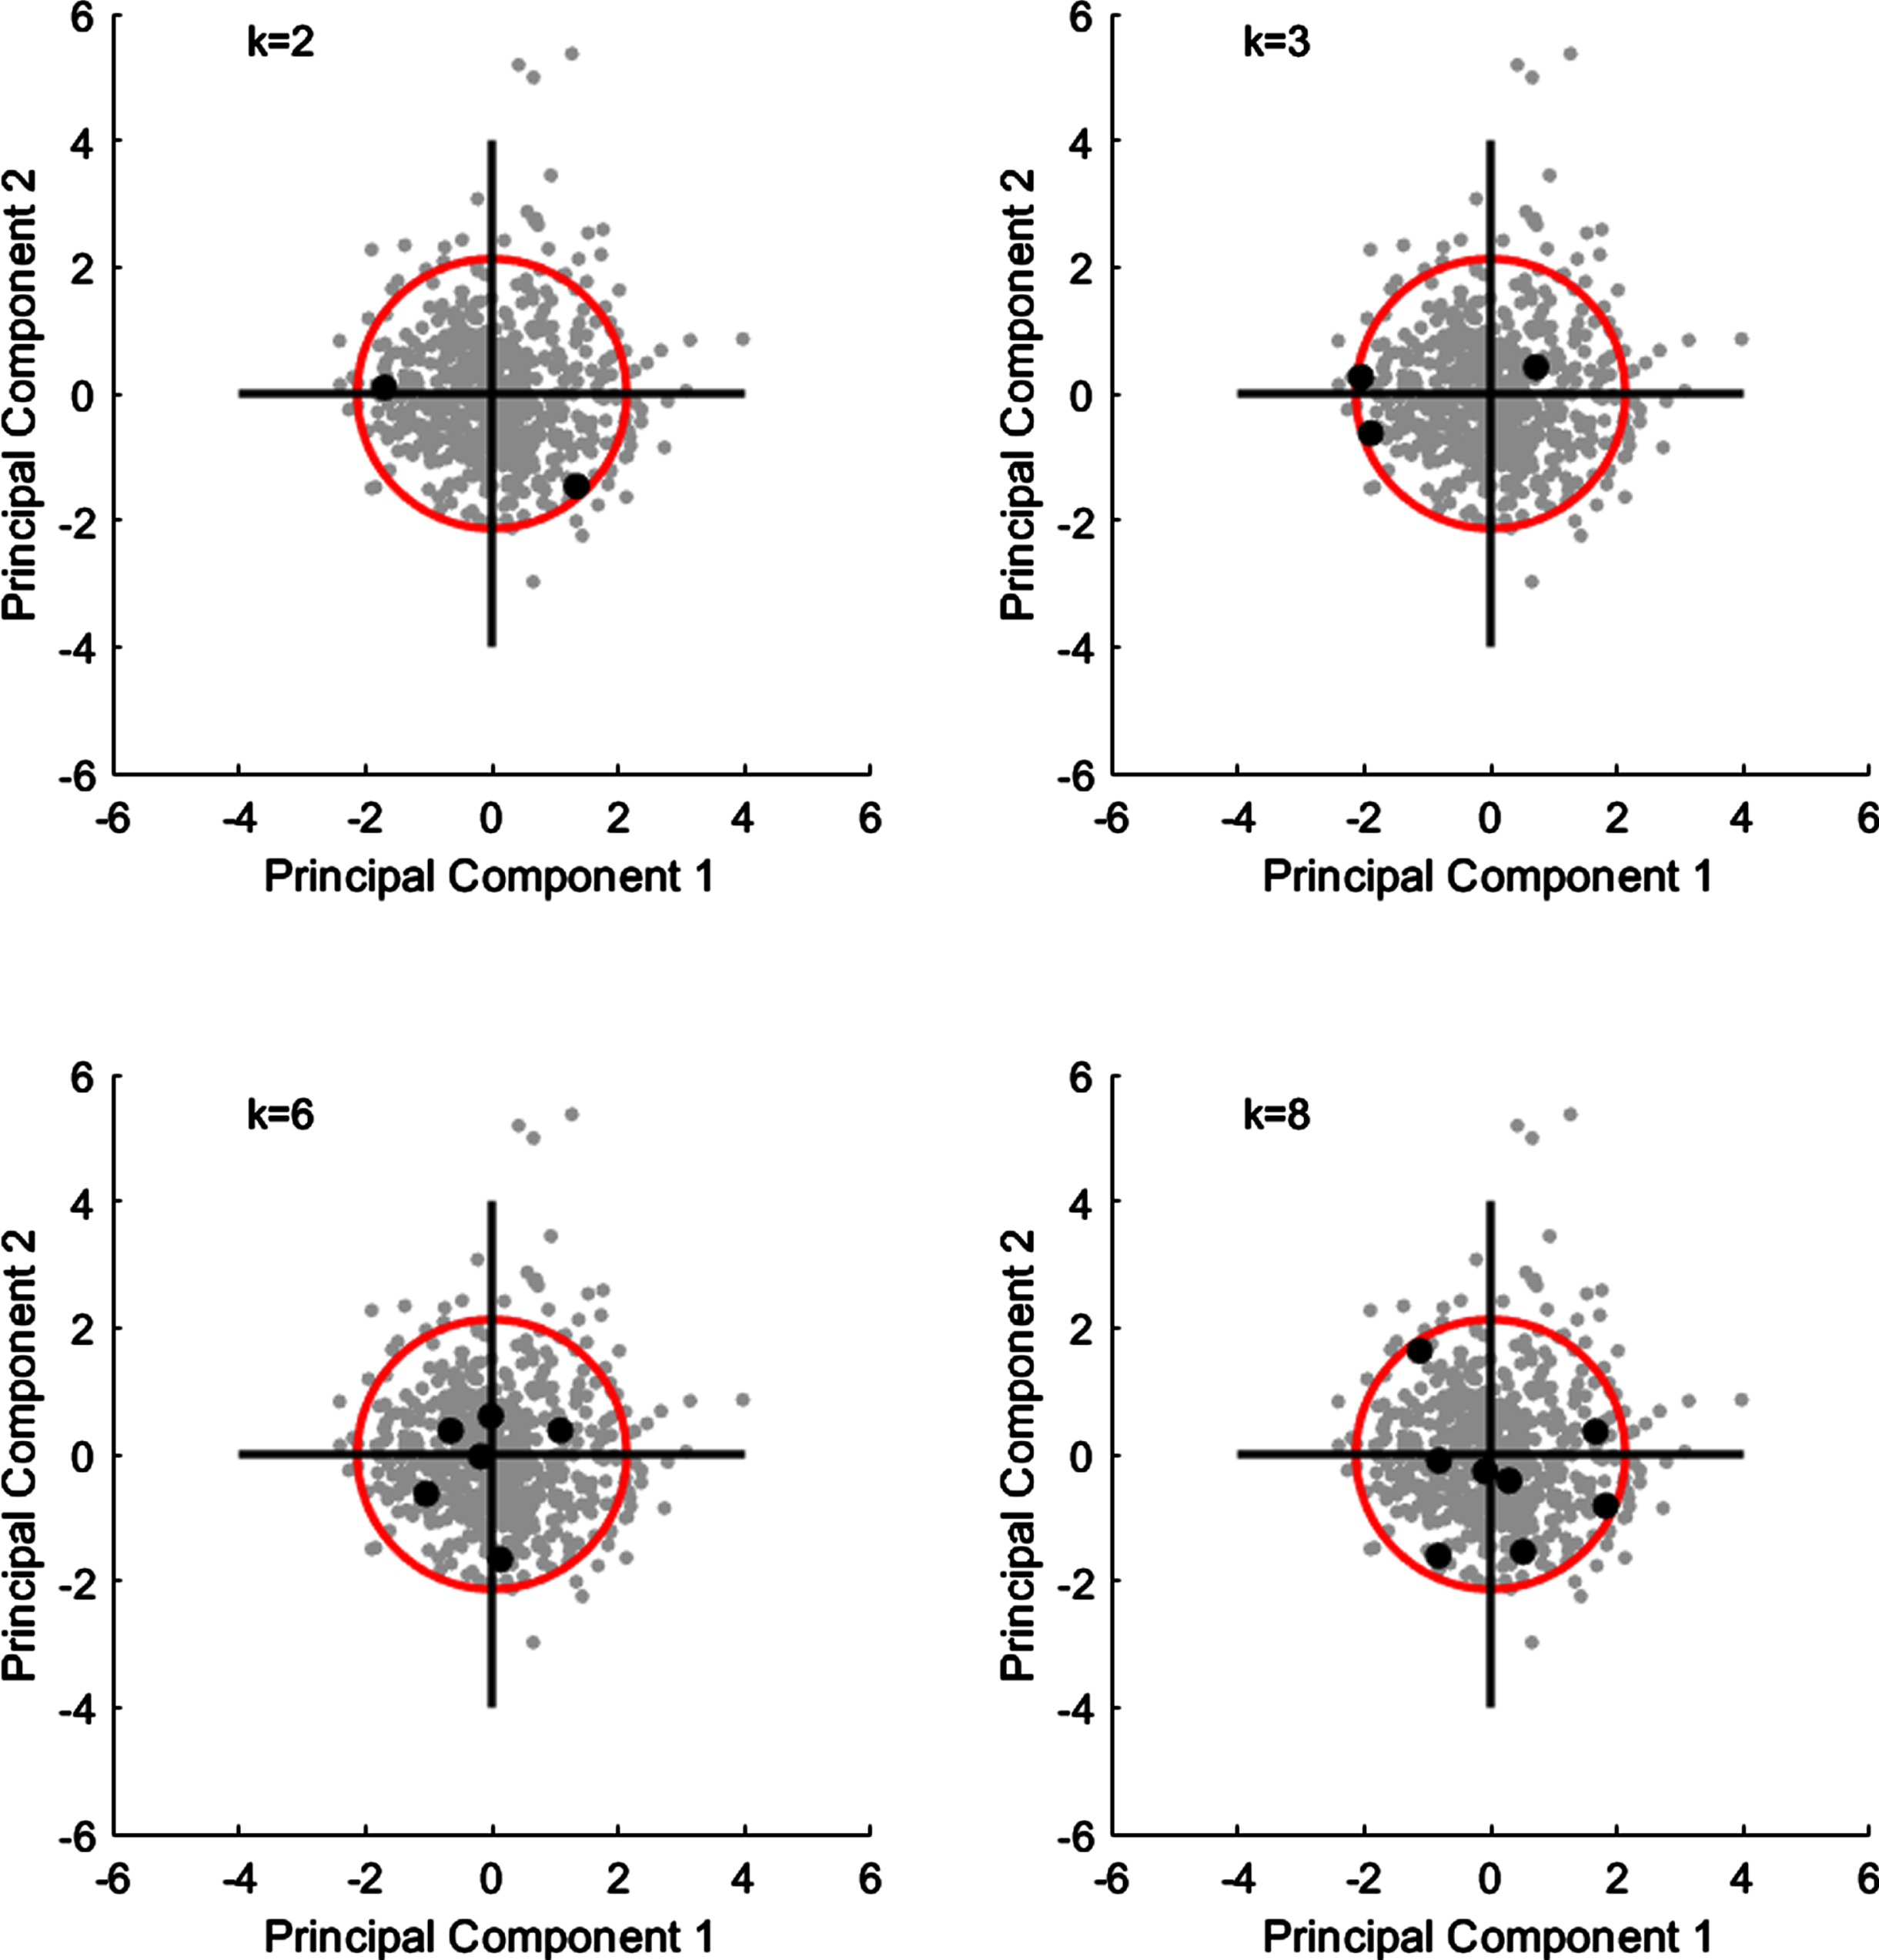
Table 7
Dimension values for the boundary cases obtained via AA (male)
| K | Case | AD | |||
| HL | PL | PW | HGD | ||
| k = 2 | 1 | *17.4 | *9.9 | *8.2 | *43.0 |
| 2 | **20.4 | **11.6 | **9.2 | **53.0 | |
| k = 3 | 1 | 19.2 | **10.7 | 9.7 | **52.0 |
| 2 | **20.2 | 11.5 | **8.6 | 51.0 | |
| 3 | *17.3 | *9.8 | *8.2 | *42.0 | |
| k = 4 | 1 | *17.8 | *9.7 | 9.1 | **49.0 |
| 2 | 17.8 | 10.0 | *8.2 | *41.0 | |
| 3 | **20.3 | **12.1 | **9.4 | 49.0 | |
| 4 | 19.1 | 10.7 | 8.6 | 56.0 | |
| k = 8 | 1 | 19.0 | 11.2 | 8.1 | 51.0 |
| 2 | 19.4 | 10.7 | **9.5 | 46.0 | |
| 3 | *17.0 | *10.0 | 8.7 | 48.0 | |
| 4 | **20.3 | **11.9 | 9.1 | 49.0 | |
| 5 | 18.3 | 10.3 | *7.8 | *41.0 | |
| 6 | 19.4 | 11.2 | 9.1 | **57.0 | |
| 7 | 18.7 | 11.2 | 9.0 | 42.0 | |
| 8 | 19.5 | 10.1 | 8.9 | 54.0 | |
*Minimum values; **Maximum values; AA – archetypal analysis; AD – anthropometric dimension; HL – hand length; PL – palm length; PW – palm width; HGD – handgrip diameter.
Table 8
Percentile values for the boundary cases obtained via AA (male)
| k | Case | AD | |||
| HL | PL | PW | HGD | ||
| k = 2 | 1 | 3 | 5 | 10 | 8 |
| 2 | 98 | 94 | 85 | 93 | |
| k = 3 | 1 | 69 | 45 | 99 | 88 |
| 2 | 96 | 92 | 37 | 82 | |
| 3 | 3 | 3 | 10 | 4 | |
| k = 4 | 1 | 10 | 2 | 79 | 63 |
| 2 | 10 | 8 | 10 | 2 | |
| 3 | 97 | 99 | 93 | 63 | |
| 4 | 64 | 45 | 37 | 99 | |
| k = 8 | 1 | 59 | 80 | 7 | 82 |
| 2 | 77 | 45 | 96 | 30 | |
| 3 | 1 | 8 | 45 | 52 | |
| 4 | 97 | 98 | 79 | 63 | |
| 5 | 25 | 19 | 1 | 2 | |
| 6 | 77 | 80 | 79 | 100 | |
| 7 | 44 | 80 | 72 | 4 | |
| 8 | 81 | 11 | 64 | 96 | |
AA – archetypal analysis; AD – anthropometric dimension; HL – hand length; PL – palm length; PW – palm width; HGD – handgrip diameter.
Table 9
Dimension values for the boundary cases obtained via AA (female)
| K | Case | AD | |||
| HL | PL | PW | HGD | ||
| k = 2 | 1 | **18.8 | **10.6 | **8.0 | **50.0 |
| 2 | *16.1 | *9.1 | *7.2 | *41.0 | |
| k = 3 | 1 | *16.5 | 9.7 | *7.2 | *39.0 |
| 2 | **18.5 | **10.7 | **8.5 | 45.0 | |
| 3 | 17.6 | *9.4 | 8.0 | **53.0 | |
| k = 6 | 1 | 17.6 | 10.8 | 7.4 | 51.0 |
| 2 | 18.4 | 10.4 | **8.7 | **52.0 | |
| 3 | **18.9 | **11.2 | 8.2 | 41.0 | |
| 4 | *15.9 | 9.0 | *7.0 | *40.0 | |
| 5 | 16.4 | 9.2 | 8.3 | 47.0 | |
| 6 | 18.2 | *8.9 | 7.4 | 50.0 | |
| k = 8 | 1 | *15.7 | 9.6 | 7.1 | 40.0 |
| 2 | 17.7 | 9.8 | 8.0 | **52.0 | |
| 3 | 16.6 | 9.2 | 7.7 | 42.0 | |
| 4 | 16.4 | *8.7 | 7.1 | 43.0 | |
| 5 | 18.2 | **11.0 | **8.6 | 43.0 | |
| 6 | **19.2 | 10.4 | **8.6 | 49.0 | |
| 7 | 16.8 | 10.2 | *7.0 | 49.0 | |
| 8 | 17.7 | 9.7 | 7.7 | *38.0 | |
*Minimum values; **Maximum values; AA – archetypal analysis; AD – anthropometric dimension; HL – hand length; PL – palm length; PW – palm width; HGD – handgrip diameter.
Table 10
Percentile values for the boundary cases obtained via AA (female)
| k | Case | AD | |||
| HL | PL | PW | HGD | ||
| k = 2 | 1 | 98 | 92 | 79 | 94 |
| 2 | 4 | 4 | 11 | 12 | |
| k = 3 | 1 | 11 | 32 | 11 | 4 |
| 2 | 94 | 95 | 98 | 51 | |
| 3 | 62 | 14 | 79 | 99 | |
| k = 6 | 1 | 62 | 97 | 24 | 97 |
| 2 | 92 | 84 | 100 | 98 | |
| 3 | 98 | 100 | 91 | 12 | |
| 4 | 2 | 3 | 4 | 7 | |
| 5 | 8 | 7 | 94 | 74 | |
| 6 | 88 | 2 | 24 | 94 | |
| k = 8 | 1 | 1 | 25 | 7 | 7 |
| 2 | 67 | 40 | 79 | 98 | |
| 3 | 14 | 7 | 52 | 19 | |
| 4 | 8 | 1 | 7 | 28 | |
| 5 | 88 | 99 | 99 | 28 | |
| 6 | 99 | 84 | 99 | 89 | |
| 7 | 21 | 72 | 4 | 89 | |
| 8 | 67 | 32 | 52 | 2 | |
AA – archetypal analysis; AD – anthropometric dimension; HL – hand length; PL – palm length; PW – palm width; HGD – handgrip diameter.
To compare the univariate and multivariate approaches’ accommodation percentages, the accommodation level was obtained for each approach (Tables 11 and 12). For the male population, the univariate percentile approach captured 68% of the total population, 22% less than the expected accommodation percentage. On the contrary, PCA captured 89.9% of the total population, a very similar approximation to the expected 90%. This is due to the acceptance of PCA’s 80.19% explained variance when the two PCs were considered for the analysis. In the case of the female population, the univariate-percentile approach and PCA captured 50% and 80% of the total population, instead of the expected 90%, due to the 78.15% of the explained variance considered for the analysis. In the case of AA, the achieved accommodation percentage increased as the k-value increased, for both populations.
Table 11
Theoretical accommodation percentage: Univariate -percentile and multivariate PCA approaches
| Male | ||||||
| Expected number (E) | Percentiles | PCA | ||||
| Achieved number (A) | Multivariate error (A–E) | Accom % | Achieved number (A) | Multivariate error (A–E) | Accom % | |
| 2352 | 2410 | 58 | 93 | 2516 | 164 | 97 |
| 2352 | 2236 | –116 | 86 | 2470 | 118 | 95 |
| 2352 | 1896 | –456 | 73 | 2356 | 4 | 91 |
| 2352 | 1769 | –583 | 68 | 2350 | –250 | 90 |
| Female | ||||||
| Expected number (E) | Percentiles | PCA | ||||
| Achieved number (A) | Multivariate error (A–E) | Accom % | Achieved number (A) | Multivariate error (A–E) | Accom % | |
| 703 | 753 | 50 | 96 | 774 | 71 | 99 |
| 703 | 731 | 28 | 94 | 756 | 53 | 97 |
| 703 | 394 | –309 | 50 | 720 | 17 | 92 |
| 703 | 392 | –311 | 50 | 629 | –74 | 80 |
*PCA – principal component analysis.
Table 12
Theoretical accommodation percentage for the multivariate-AA approaches
| Male | ||||||||||||
| Expected number | k = 2 | k = 3 | k = 4 | k = 8 | ||||||||
| Achieved number | Multivariate error (A–E) | Accom % | Achieved number | Multivariate error (A–E) | Accom % | Achieved number | Multivariate error (A–E) | Accom % | Achieved number | Multivariate error (A–E) | Accom % | |
| 2352 | 2,431 | 79 | 93 | 2,410 | 58 | 93 | 2,249 | –103 | 86 | 2,488 | 136 | 96 |
| 2352 | 2,221 | –131 | 85 | 2,169 | –183 | 83 | 2,207 | –145 | 85 | 2,280 | –72 | 88 |
| 2352 | 1,717 | –635 | 66 | 1,928 | –424 | 74 | 1,840 | –512 | 71 | 2,094 | –258 | 80 |
| 2352 | 1,498 | –854 | 58 | 1,668 | –684 | 64 | 1,811 | –541 | 70 | 2,060 | –292 | 79 |
| Female | ||||||||||||
| Expected number | k = 2 | k = 3 | k = 4 | k = 8 | ||||||||
| Achieved number | Multivariate error (A–E) | Accom % | Achieved number | Multivariate error (A–E) | Accom % | Achieved number | Multivariate error (A–E) | Accom % | Achieved number | Multivariate error (A–E) | Accom % | |
| 703 | 719 | 16 | 92 | 640 | –63 | 82 | 735 | 32 | 94 | 764 | 61 | 98 |
| 703 | 652 | –51 | 83 | 570 | –133 | 73 | 719 | 16 | 92 | 748 | 45 | 96 |
| 703 | 475 | –228 | 61 | 502 | –201 | 64 | 691 | –12 | 88 | 708 | 5 | 91 |
| 703 | 409 | –294 | 52 | 497 | –206 | 64 | 657 | –46 | 84 | 691 | –12 | 88 |
*AA – archetypal analysis.
The results obtained from the statistical test are presented in Table 13. The goodness-of-fit p-values suggest that all the approaches (univariate-percentile and multivariate-PCA and multivariate-AA) failed in accommodating the expected 90% of the population (p < 0.05), except the multivariate boundary cases obtained by AA (k = 8) for the female population and the multivariate-PCA approach for the male population. Small chi-squared values can help identify the more precise approach; in this case, it can be inferred that the multivariate-PCA approach is more precise in determining the accommodation percentage than the univariate-percentile and multivariate-AA approaches, for the male population. In the case of the female population, multivariate-AA approach for k = 8, and k = 6, followed by multivariate-PCA approach are more precise in determining the accommodation percentage than the univariate-percentile approach.
Table 13
Goodness-of-fit and McNemar’s statistical tests results
| Male | |||||||||
| Approach | Intended accommodation | Captured subjects | Goodness-of-fit test | McNemar’s test | |||||
| Frequency | % | Frequency | % | Chi-squared | p-value | Odds ratio | p-value | ||
| Univariate | Percentile | 2,352 | 90 | 1,769 | 68 | 1,498.65 | 0.0000 | ||
| Multivariate | PCA | 2,352 | 90 | 2,350 | 90 | 0.02 | 0.8943 | 5.90 | 0.0000 |
| boundary | AA, k = 2 | 2,352 | 90 | 1,498 | 57 | 3,215.72 | 0.0000 | 0.05 | 0.0000 |
| AA, k = 3 | 2,352 | 90 | 1,668 | 64 | 2,062.89 | 0.0000 | 0.43 | 0.0000 | |
| AA, k = 4 | 2,352 | 90 | 1,811 | 69 | 1,290.50 | 0.0000 | 1.30 | 0.0232 | |
| AA, k = 8 | 2,352 | 90 | 2,060 | 79 | 375.95 | 0.0000 | 7.93 | 0.0000 | |
| Female | |||||||||
| Approach | Intended accommodation | Captured subjects | Goodness-of-fit test | McNemar’s test | |||||
| Frequency | % | Frequency | % | Chi-squared | p-value | Odds ratio | p-value | ||
| Univariate | Percentile | 703 | 90 | 392 | 50.2 | 1377.60 | 0.0000 | ||
| Multivariate | PCA | 703 | 90 | 629 | 80.5 | 77.99 | 0.0000 | 7.08 | 0.0000 |
| boundary | AA, k = 2 | 703 | 90 | 409 | 52.4 | 1231.11 | 0.0000 | 1.11 | 0.3718 |
| AA, k = 3 | 703 | 90 | 497 | 63.6 | 604.42 | 0.0000 | 2.38 | 0.0000 | |
| AA, k = 6 | 703 | 90 | 657 | 84.1 | 30.14 | 0.0000 | 10.81 | 0.0000 | |
| AA, k = 8 | 703 | 90 | 691 | 88.5 | 2.05 | 0.1521 | 22.36 | 0.0000 | |
*Odds ratio for percentile; PCA – principal component analysis; AA – archetypal analysis.
McNemar’s test results suggest that only the multivariate-AA approach for k = 4, and k = 2 estimated an accommodation percentage similar to that estimated by the univariate-percentile approach, for the male and female populations, respectively. The odds ratio indicates that the odds of not being accommodated using the univariate-percentile approach are 5.90, 0.05, 0.43, 1.3, and 7.93, greater than the odds of not being accommodated using the multivariate approaches for the male population, and 7.08, 1.11, 2.38, 10.82, and 22.36 for the female population.
4Discussion
The models obtained from each multivariate accommodation model and the univariate-percentile approach were similar mainly to the models obtained for the intersection axis in the PCA approach. Despite these similarities, some differences in the estimated accommodation percentage of the approaches were found.
Even though all the approaches showed a statistically significant difference between the expected 90% accommodation and the estimated accommodation percentage, multivariate analysis showed a significantly better performance than the univariate-percentile approach in that it accommodated 11% (AA) and 13% (PCA) more than the percentile approach did, in the case of the male population, and 30% (PCA) and 38% (AA) more than the percentile approach did, in the case of the female population. These results corroborate da Silva et al.’s [40] conclusions, where the PCA approach obtained a higher accommodation level than univariate-percentile approach. In this study using multivariate-PCA, a 90% adjusted circle was required to fit 90% of the population on the four ADs when considering 80.19% explained variance while the AA fitted the 79% of the male population.
In the case of the female population, a 90% adjusted circle using multivariate-PCA explaining the 78.15% of the total variance, fitted the 80% of the population, considering the four-hand dimensions simultaneously, while AA performed better fitting the 88% of the population.
While Jee and Yun [10] concluded that clustering hand anthropometric variables in four groups produce well-separated models, this study, based on its results, recommends a higher number of boundary cases (eight) over a small number of boundary cases (two, three, and four/six) when the performance metric of interest is the accommodation percentage.
This study had the following limitation: it relied on the theoretical estimation of the accommodation percentage. Performing comparisons based on the independent variable limits while considering such values when calculating the number of subjects captured by the approach is still univariate analysis. A solution to this is using a virtual or simulated environment to test the population’s accommodation percentage.
Designers can use the models proposed in this study to develop adjustable hand tools/products according to each family model (to develop a tool /product that can be configured to be used by the eight PCA or the eight AA models for the male population or to be used by the eight PCA or the eight AA female models). The models proposed can also be used to develop a standard family of products of different sizes as demonstrated by Bittner [20], and to develop some adjuncts that can be aggregated to a standard handle (e.g., small model) in order to adapt it to another model size.
In future studies, PCA’s total explained variance should be considered. In other words, using the four PCs will increase the accommodation percentage, but it will also increase the number of boundary cases considered and the complexity of the design.
5Conclusion
The models presented in this study can be used to design products and workstations with a theoretical 90% accommodation for the northwestern Mexican male population. The models can also be used to create personal protective equipment of different sizes. Although the hand models for the northwestern Mexican male population obtained using the multivariate accommodation methods -AA and PCA- can be used in workstation design due to their similar univariate percentiles, PCA models and AA (k = 8) models should be preferred due to their higher estimated accommodation levels, for the male and female population respectively. Despite these models’ utility, they can be improved by considering additional hand descriptors, such as the individual finger lengths and the diameters and lengths of the phalanges.
Ethical approval
Not applicable.
Informed consent
Not applicable.
Conflict of interest
The authors declare that they have no conflict of interest.
Acknowledgments
The authors have no acknowledgments.
Funding
The authors report no funding.
References
[1] | WilsonJR. Fundamentals of ergonomics in theory and practice. Appl Ergon. (2000) ;31: (6):557–67. |
[2] | HelanderM. Introduction to Human Factors and Ergonomics. A Guide to Human Factors and Ergonomics, Second Edition. Boca Raton: CRC Press; (2005) . |
[3] | Hanson L , Sperling L , Gard G , Ipsen S , Olivares Vergara C . Swedish anthropometrics for product and workplace design. Appl Ergon. (2009) ;40: (4):797–806. |
[4] | WichanskyAM. Usability testing in and beyond. Ergonomics. (2000) ;43: (7):998–1006. |
[5] | MeagherSW. Tool design for prevention of hand and wrist injuries. J Hand Surg Am. (1987) ;12: (5):855–7. |
[6] | ObiOF. Hand anthropometry survey of rural farm workers in south-eastern Nigeria. Ergonomics. (2016) ;59: (4):603–11. |
[7] | Shahriar MM , Parvez MS , Lutfi M . A survey of hand anthropometry of Bangladeshi agricultural farm workers. Int J Ind Ergon. (2020) ;78: (April):102978. |
[8] | Mirmohammadi SJ , Mehrparvar AH , Mostaghaci M , Davari MH , Bahaloo M , Mashtizadeh S . Anthropometric hand dimensions in a population of Iranian male workers in 2012. Int J Occup Saf Ergon. (2016) ;22: (1):125–30. |
[9] | Oviedo-Trespalacios O , Martínez Buelvas L , Hernández J , Escobar J . Hand anthropometric study in northern Colombia. Int J Occup Saf Ergon. (2017) ;23: (4):472–80. |
[10] | Jee SC , Yun MH . An anthropometric survey of Korean hand and hand shape types. Int J Ind Ergon. (2016) ;53: :10–8. |
[11] | Swami S , Kumar T , Sharma D . Correlation of handedness with hand anthropometric measurements in Haryanvi Brahmins. J Anat Soc India. (2015) ;64: (SUPPL. 1):S24–30. |
[12] | Das B , Sengupta AK . Industrial workstation design: A systematic ergonomics approach. Appl Ergon. (1996) ;27: (3):157–63. |
[13] | Robinette KM , McConville JT . An alternative to percentile models. In: SAE Technical Papers. SAE International; (1981) . |
[14] | Zehner GF , Meindl RS , Hudson JA . A Multivariate Anthropometric Method for Crew Station Design: Abridged (U) (AL-TR-1992-0164). Wright-Patterson Air Force Base; 1993. |
[15] | Albin TJ , Vink P . An empirical description of the dispersion of 5th and 95th percentiles in worldwide anthropometric data applied to estimating accommodation with unknown correlation values. Work. (2015) ;52: (1):3–10. |
[16] | Garneaua CJ , Parkinsona MB . A comparison of methodologies for designing for human variability. J Eng Des. (2011) ;22: (7):505–21. |
[17] | Garneau CJ , Parkinson MB . A survey of anthropometry and physical accommodation in ergonomics curricula. Ergonomics. (2016) ;59: (1):143–54. |
[18] | Epifanio I , Vinué G , Alemany S . Archetypal analysis: Contributions for estimating boundary cases in multivariate accommodation problem. Comput Ind Eng. (2013) ;64: (3):757–65. |
[19] | Epifanio I , Ibáñez MV , Simó A . Archetypal shapes based on landmarks and extension to handle missing data. Adv Data Anal Classif. (2018) ;12: (3):705–35. |
[20] | BittnerAC. A-CADRE: Advanced family of manikins for workstation design. Proc XIVth Trienn Congr Int Ergon Assoc 44th Annu Meet Hum Factors Ergon Assoc ’Ergonomics New Millenn. (2000) ;(June):774–7. |
[21] | Essdai A , Spasojević Brkić VK , Golubović T , Brkić A , Popović V . Crane cabins’ interior space multivariate anthropometric modeling. Work. (2018) ;59: (4):557–70. |
[22] | Young K , Margerum S , Barr A , Ferrer MA , Rajulu S . Derivation of boundary manikins: A principal component analysis. SAE Tech Pap. (2008) ;(724). |
[23] | Alcacer A , Epifanio I , Ibáñez MV , Simó A , Ballester A . A data-driven classification of 3D foot types by archetypal shapes based on landmarks. PLoS One. (2020) ;15: (1):1–19. |
[24] | Bertilsson E , Högberg D , Hanson L . Using experimental design to define boundary manikins. Work. (2012) ;41: (SUPPL.1):4598–605. |
[25] | Brkić A , Veljković Z , Brkić VS , Essdai A , Pavicévić S . Differences in Serbian and Libyan crane operators’ anthropometric measurements and cabin interior space modeling. Work. (2021) ;68: (1):197–212. |
[26] | Zunjic A , Brkic VS , Klarin M , Brkic A , Krstic D . Anthropometric assessment of crane cabins and recommendations for design: A case study. Work. (2015) ;52: (1):185–94. |
[27] | Ray PK , Tewari VK . Ergonomic design of crane cabins: A case study from a steel plant in India. Work. (2012) ;41: (SUPPL.1):5972–6. |
[28] | Chang J , Jung K , Hwang J , Kang Y , Lee S , Freivalds A . Determination of bicycle handle diameters considering hand anthropometric data and user satisfaction. Proc Hum Factors Ergon Soc. (2010) ;3: :1790–3. |
[29] | Eksioglu M . Relative optimum grip span as a function of hand anthropometry. Int J Ind Ergon. (2004) ;34: (1):1–12. |
[30] | Lee SJ , Kong YK , Lowe BD , Song S . Handle grip span for optimising finger-specific force capability as a function of hand size. Ergonomics. (2009) ;52: (5):601–8. |
[31] | Rodríguez Vega G , Zaldívar Colado U , Zaldívar Colado XP , Rodríguez Vega DA , de la Vega Bustillos EJ . Comparison of univariate and multivariate anthropometric accommodation of the northwest Mexico population. Ergonomics. (2021) ;64: (8):1018–34. |
[32] | Jung K , Kwon O , You H . Development of a digital human model generation method for ergonomic design in virtual environment. Int J Ind Ergon. (2009) ;39: (5):744–8. |
[33] | Brolin E . Anthropometric diversity and consideration of human capabilities - Methods for virtual product and production development. (2016) . |
[34] | Jollife IT , Cadima J . Principal component analysis: A review and recent developments. Philos Trans R Soc A Math Phys Eng Sci. (2016) ;374: (2065). |
[35] | Klarin MM , Spasojević-Brkić VK , Sajfert ZD , Djordjević DB , Nikolić MS , Ćoćkalo DZ . Determining the width of the optimal space needed to accommodate the drivers of passenger vehicles using the analogy of anthropometric measurement dynamics and mechanical mechanisms. Proc Inst Mech Eng Part D J Automob Eng. (2011) ;225: (4):425–40. |
[36] | Lauterbach CE . The measurement of handedness. Pedagog Semin J Genet Psychol. (1933) ;43: (1):207–12. |
[37] | Jolliffe IT . Principal component analysis, second edition. Encycl Stat Behav Sci. (2002) ;30: (3):487. |
[38] | Vinué G . Anthropometry: An R package for analysis of anthropometric data. Journal of Statistical Software. (2017) ;77: (6):1–39. |
[39] | Pheasant S , Haslegrave CM . Bodyspace: Anthropometry, Ergonomics and the Design of Work. Boca Raton: CRC Press, (2015) . |
[40] | da Silva GV , Zehner GF , Hudson JA . Comparison of univariate and multivariate anthropometric design requirements methods for flight deck design application. Ergonomics. (2020) ;63: (9):1133–49. |


