
The role of ambient parameters on transmission rates of the COVID-19 outbreak: A machine learning model
Abstract
BACKGROUND:
In recent years the relationship between ambient air temperature and the prevalence of viral infection has been under investigation.
OBJECTIVE:
The study was aimed at providing the statistical and machine learning-based analysis to investigate the influence of climatic factors on frequency of COVID-19 confirmed cases in Iran.
METHOD:
The data of confirmed cases of COVID-19 and some climatic factors related to 31 provinces of Iran between 04/03/2020 and 05/05/2020 was gathered from official resources. In order to investigate the important climatic factors on the frequency of confirmed cases of COVID-19 in all studied cities, a model based on an artificial neural network (ANN) was developed.
RESULTS:
The proposed ANN model showed accuracy rates of 87.25%and 86.4%in the training and testing stage, respectively, for classification of COVID-19 confirmed cases. The results showed that in the city of Ahvaz, despite the increase in temperature, the coefficient of determination R2 has been increasing.
CONCLUSION:
This study clearly showed that, with increasing outdoor temperature, the use of air conditioning systems to set a comfort zone temperature is unavoidable. Thus, the number of positive cases of COVID-19 increases. Also, this study shows the role of closed-air cycle condition in the indoor environment of tropical cities.
1Introduction
The COVID-19 pandemic is originated from a type of beta-coronavirus called SARS-CoV-2 and was first identified in Wuhan, China. The disease is highly prevalent in low-temperature areas of the Northern Hemisphere [1–3]. It is a respiratory virus and disappears after 15 minutes of heating at 56°C and can be inactivated by ultraviolet rays, also alkaline (pH >12) and acidic (pH < 3) environments are able to eliminate it [4, 5]. Temperature and humidity play a major role in the transmission of respiratory viruses. Many respiratory viruses also have a specific seasonal spread, but there is no clear evidence for the seasonal spread of coronavirus, and in fact the frequency of positive cases of COVID-19 in Southern Hemisphere regions, such as Latin America and Australia, is reported in the summer [6]. However, the seasonal emergence of the SARS virus, which belongs to the family of cold viruses, especially in spring and winter, may indicate a seasonal outbreak cycle for the spread of these viruses. Climate change and rising temperatures are affecting the incidence of SARS, a member of the COVID-19 viruses [7, 8]. World Health Organization emphasizes that only 4%of COVID-19 outbreaks occur in tropical countries, but since it is difficult to accurately assess the behavior and structure of the COVID-19 virus, there is no scientific evidence to suggest a rise in temperature can affect the shelf life of the virus. Some recent studies have declared a relationship between changes in ambient temperature/relative humidity and reported positive COVID-19 cases [9–11]. The presentation of prediction models about the relationship between variables is generally based on the statistical models. The new approach is to use machine learning methods to predict changes in the response variables in various problems [12]. Artificial neural network (ANN) is one of the most successful data mining methods that can predict the relationship between phenomena through a series of link models inspired by human brain behavior and that have useful capabilities for medical research [13]. ANN is a data processing system that consists of a large number of interconnected and simple processing components, similar to the biological neural system, that has the ability to learn from experimental and real datasets to describe interventional and nonlinear effects with great success [14, 15]. The purpose of this study is to provide a statistical analysis to assess the relationship between temperature conditions and the number of cases of COVID-19 in Iran. A model based on ANN is presented to predict the incidence of COVID-19 disease according to meteorological factors.
2Materials and methods
The data of the present study was related to 31 provinces of Iran, between 04/03/2020 and 05/05/2020. Factors including maximum and minimum outdoor temperatures, and relative humidity (RH) were used to investigate the relationship between urban ambient temperature and the frequency of confirmed cases detected by the Real-time Reverse Transcriptase Polymerase Chain Reaction (RT-PCR) test. The initial dataset included the air temperature and RH of the centers of each province in the mentioned time period. In order to more accurately investigate and provide better results on the frequency of positive cases in relation to climatic factors in each province, the following method was used:
1. Instead of using environmental factors on a daily basis and examining their relationship with the frequency of positive cases of the disease, first, these factors were considered on a weekly basis.
2. Environmental factors were calculated as minimum outdoor temperature, maximum outdoor temperature and average outdoor temperature per week, and the average number of patients per week was also calculated.
3. Frequency of positive cases in two categories (cases above 500 and under 500 people) were considered. In order to examine the frequency of positive cases trend in the center of each province, a multilayer perceptron (MLP) artificial neural network was used [16]. In this network, the accuracy of classification and location of the center of each province in each of the two “frequency of positive cases” categories were calculated.
The study was approved by the ethics committee of the Ahvaz Jundishapur University of Medical Sciences (no. IR.AJUMS.REC.1399.024).
2.1Neural networks
To perform the classification in the present study, the MLP was used and this method was implemented in MATLAB 2017 software. The architecture of the neural network is Feedforward net with a range of maximum hidden layer values, including 5, 10, 15, 20 and 25. The outline of the neural network is depicted in Fig. 1.
Fig. 1
Neural network architecture with four input factors, ten neurons and two output categories.
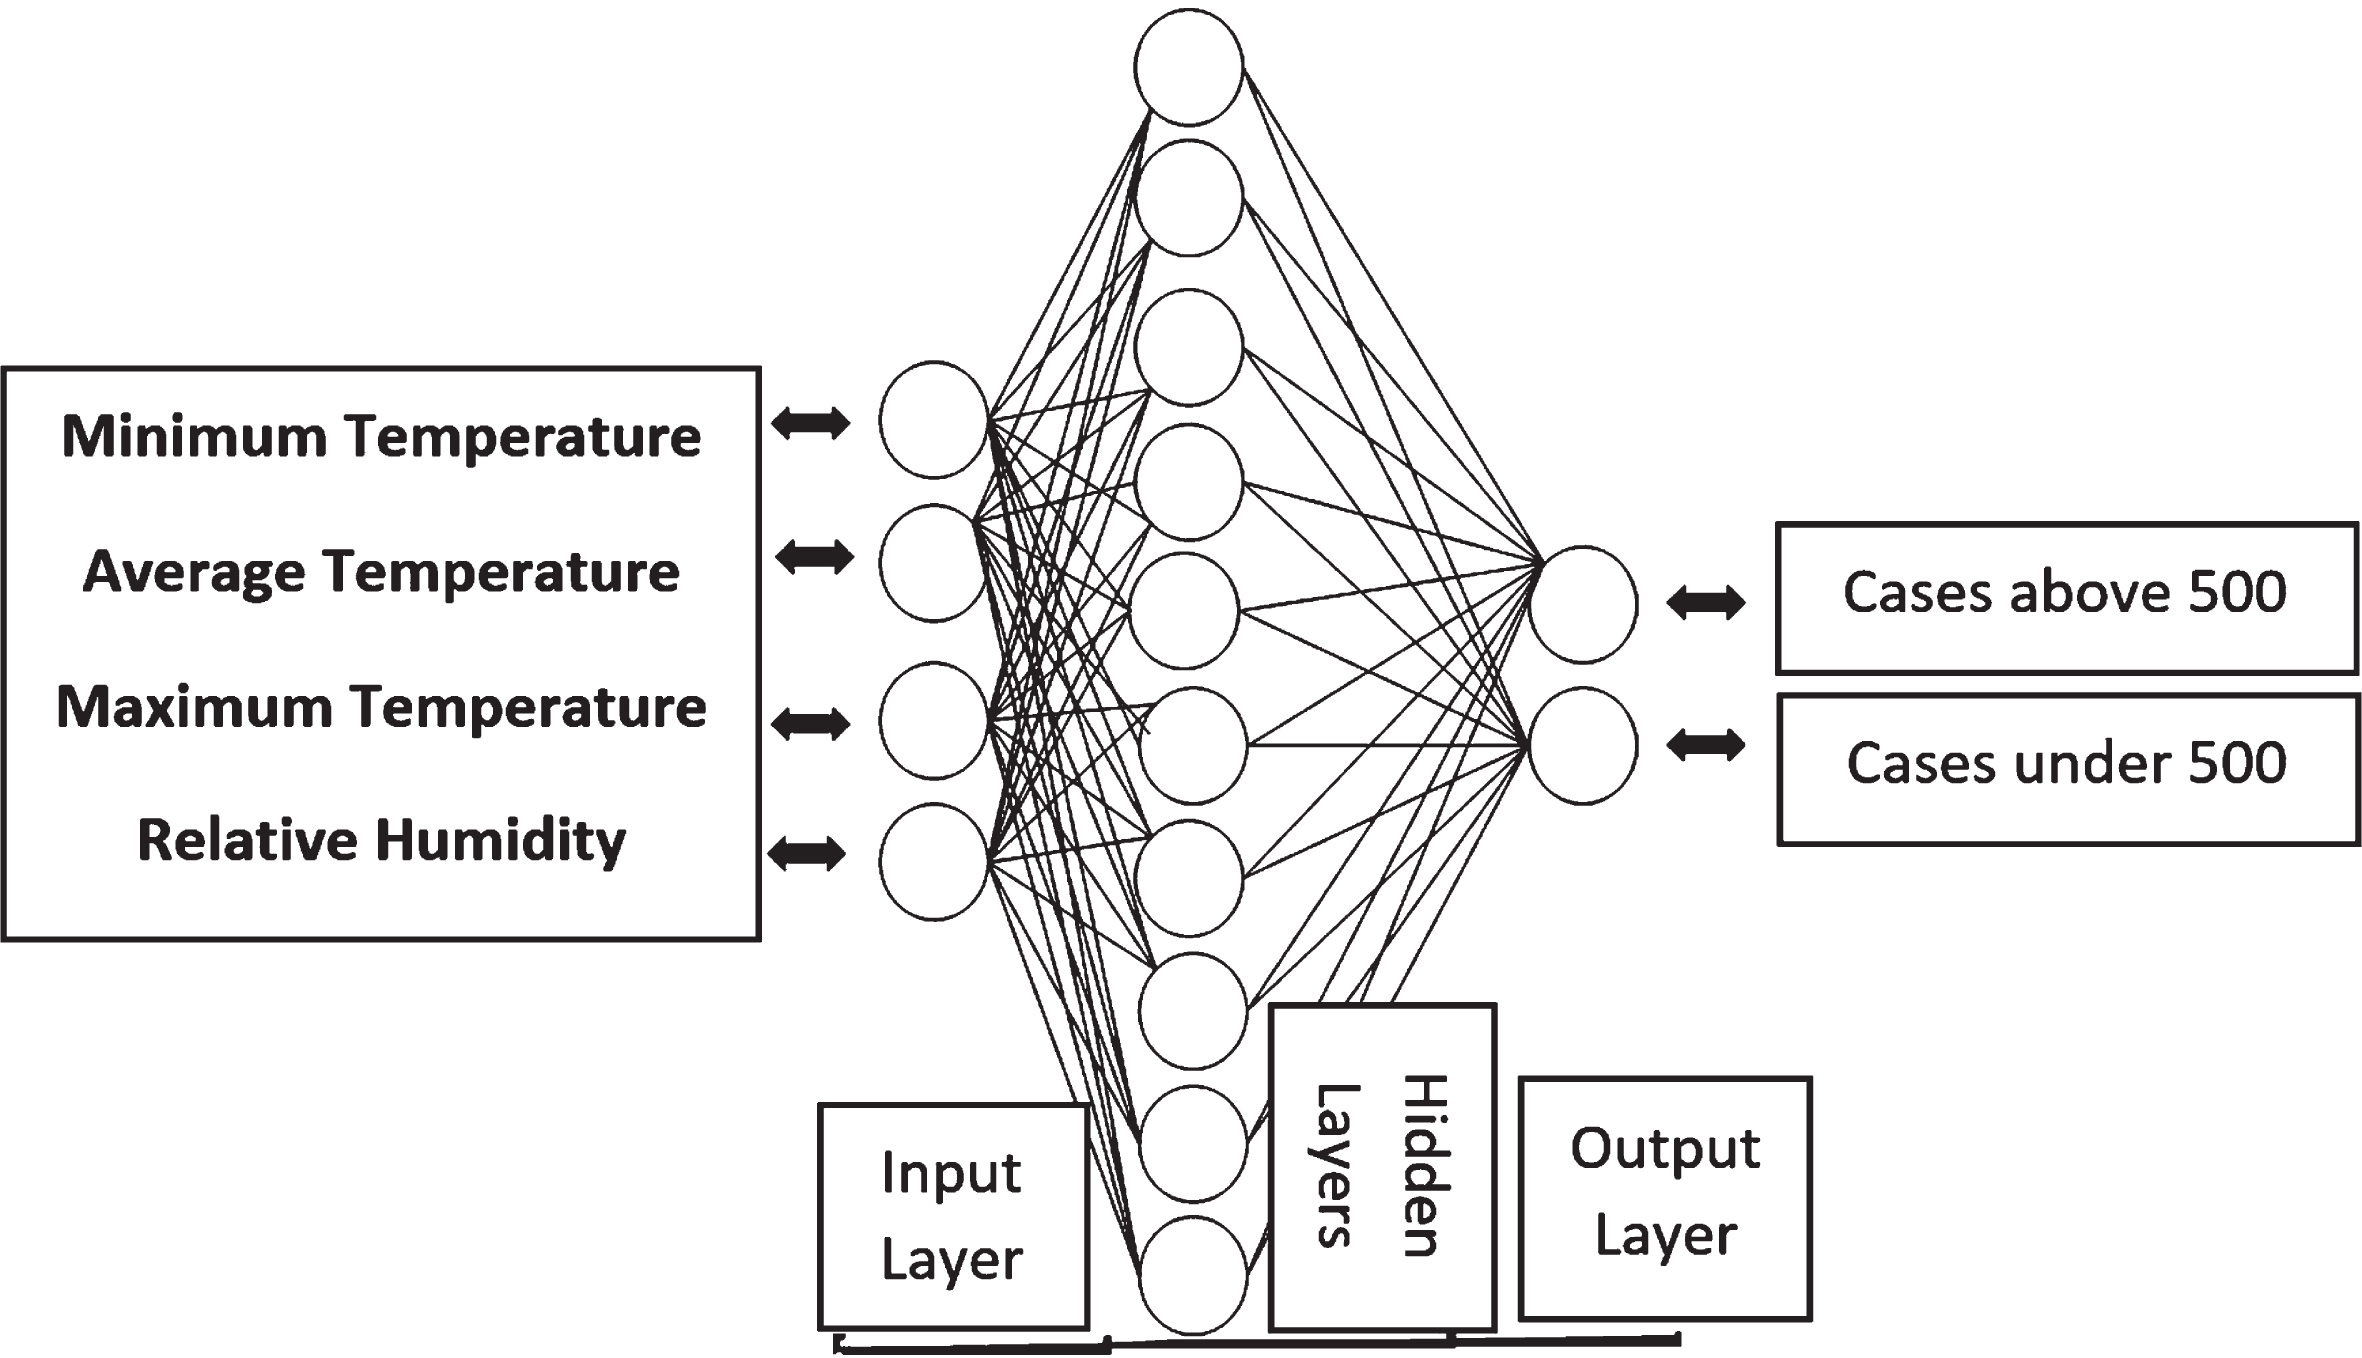
Neural networks are architecturally composed of a set of processing components called neurons or nodes, whose function is as a directional diagram in which each node acts according to formula number one based on the fi transfer function:
(1)
Where yi is the output of node, xj is the jth input of the node and wij is the weight between i and j. θi is also the bias threshold. fi is a nonlinear function and can be of the Gaussian or Sigmoid function. The transfer function in the architecture used in this study was a sigmoid type [17]. In this study, 279 inputs, each containing four predictor variables, were examined. Each input rate represents the value in a week. Thus, each province includes a range on nine weeks in the dataset, which create a total of 279 cases in the dataset. From the input dataset in each examination, 223 pieces of data (80%) were selected randomly as a training dataset and 56 pieces of data (20%) as a testing dataset. The neural network training algorithm was error propagation. This algorithm uses the lowest error gradient slope to adjust the weights and bias threshold in order to better train the neural network. The mathematical equations can be expressed in Formulas 2 and 3:
(2)
(3)
The λ in the above formulas means the learning rate (λ > 0) [16]. Also, four models with 20 different types of architecture were examined, which are fully listed in Table 1. To find the optimum architecture for ANN models, including maximum number of hidden layers and neurons, the experts’ knowledge and the trial and error method are used [18]. Before performing the classification using neural network, first the relationship between independent variables (minimum temperature, average temperature, maximum temperature, and RH) with the dependent variable (frequency of positive cases) was investigated. For this purpose, scatter plot, Pearson correlation coefficient, and multiple regression were used. SPSS (version 20) software was used to draw the scatter plot to investigate the relationship between the variables.
Table 1
Types of ANN architecture in four models
| Model No | ANN Architecture | Maximum number of neurons |
| 1 | (5 5 5 5 4) | 5 |
| 2 | (10 9 10 10 8) | 10 |
| 3 | (15 12 11 12 15) | 15 |
| 4 | (19 17 18 19 16) | 20 |
| 5 | (25 23 24 24 23) | 25 |
| 6 | (5 3 5 4 5 5 5 5 5 4 3) | 5 |
| 7 | (10 8 9 10 8 8 9 10 7 6) | 10 |
| 8 | (15 14 14 15 13 13 15 12 11 11) | 15 |
| 9 | (20 19 18 20 17 16 17 17 16 16) | 20 |
| 10 | (25 23 21 22 23 21 23 22 21 21) | 25 |
| 11 | (5 3 5 4 5 5 5 5 4 5 4 5 4 4 3) | 5 |
| 12 | (10 8 9 7 6 6 6 9 9 10 6 6 6 6) | 10 |
| 13 | (15 14 13 14 12 12 11 13 15 12 14 12 12 11 11) | 15 |
| 14 | (20 17 16 18 16 17 19 20 17 17 16 18 17 16 16) | 20 |
| 15 | (25 24 22 24 23 22 24 25 22 22 24 23 22 21 21) | 25 |
| 16 | (5 3 4 4 5 4 5 4 4 5 4 5 4 4 3 4 3 4 3 3) | 5 |
| 17 | (10 8 7 9 6 8 7 6 6 8 7 7 6 6 7 7 8 6 6 6) | 10 |
| 18 | (12 12 13 14 12 12 14 13 13 12 14 13 12 12 12 13 12 15 14 13) | 15 |
| 19 | (16 16 17 18 17 16 18 17 17 16 19 18 16 16 16 16 17 16 20 19 17) | 20 |
| 20 | (21 22 23 24 23 21 22 23 23 21 22 24 22 21 22 21 21 25 23 22) | 25 |
3Results
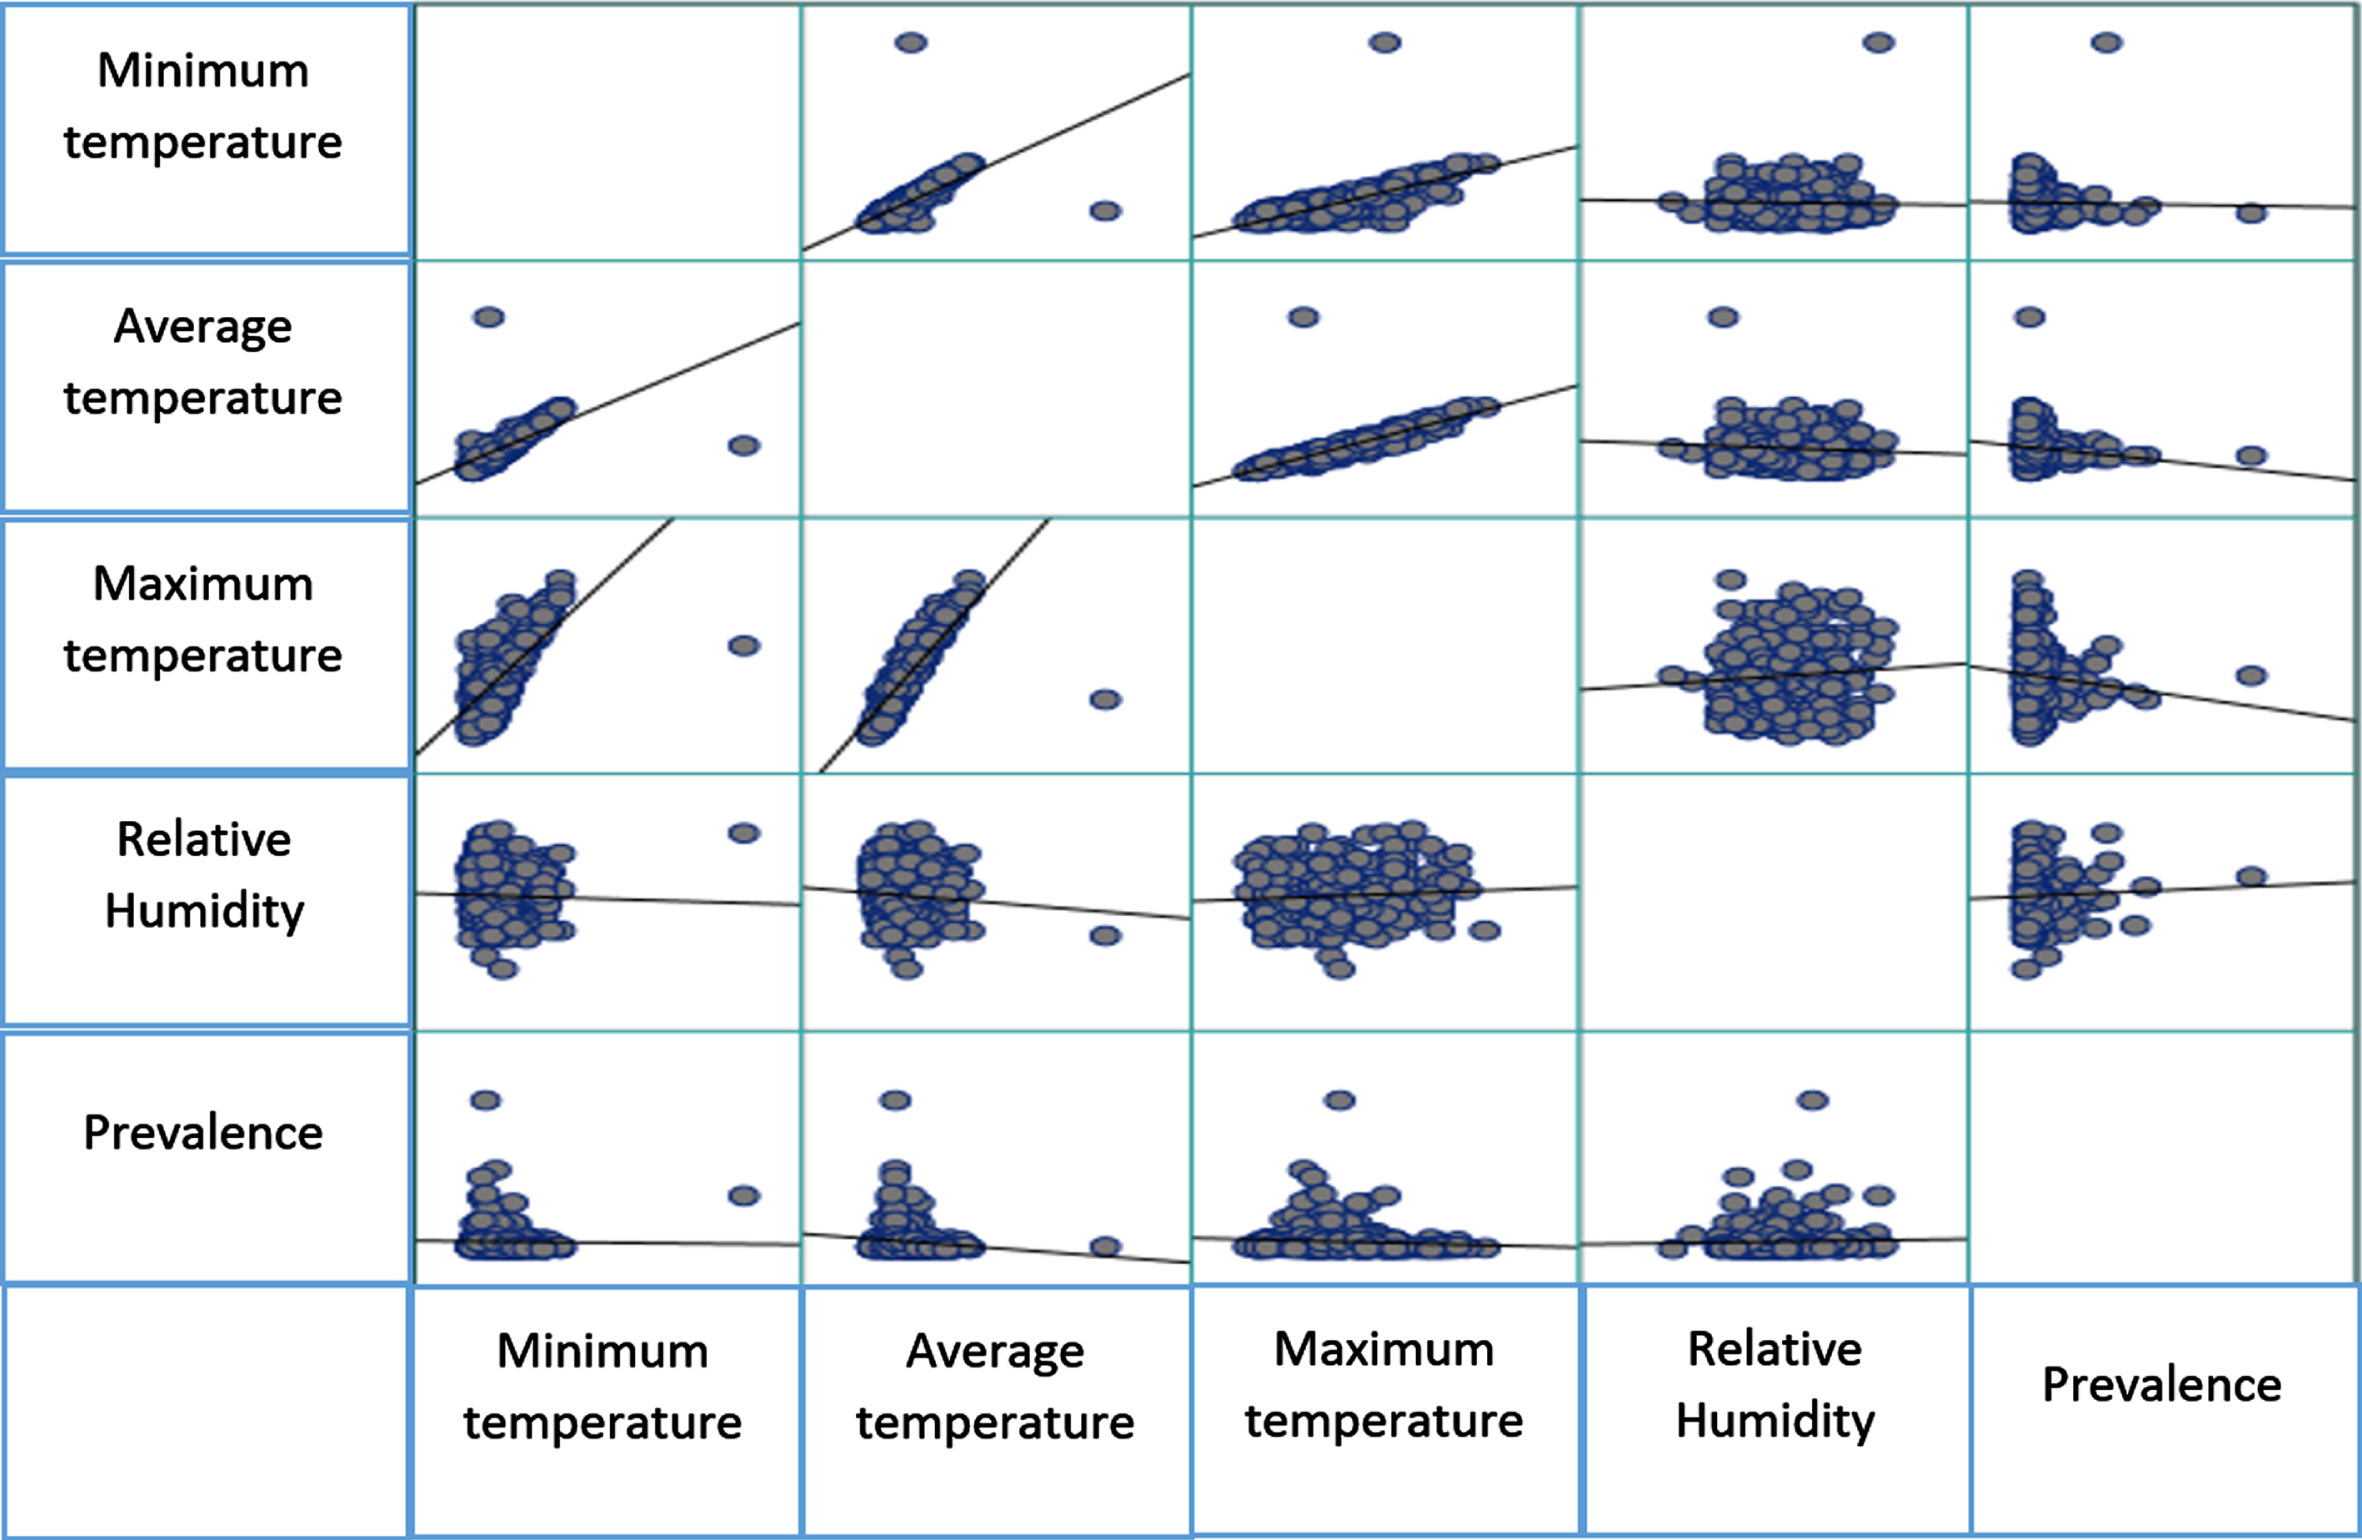
Figure 2 shows the results of linear relationship analysis between the independent and dependent variables by a matrix scatter plot. Figure 2 shows that there is no linear relationship between the frequency of positive cases in 31 provinces and independent parameters. Of course, it should be noted that the scatter plot only shows the totality of the relationships between the data and does not show the relationship details in full dimensions. Therefore, to examine the exact relationship between environmental factors and frequency of positive cases, the graphs of each province should be drawn separately. In this study, Khuzestan province was selected as a sample to study the trend of frequency of positive cases and environmental factors. In addition to plotting the matrix dispersion in order to achieve a suitable model in the neural network, it is necessary to study the relationship between independent variables and input parameters, so Pearson correlation coefficient was used to determine the relationship between independent variables. Pearson correlation coefficient, also
Fig. 2
The relationship between independent and dependent variables.
called torque correlation coefficient or zero-order correlation coefficient, was used to determine the relationship, type and direction of two distances or relative variables or a distance variable and a relative variable. The calculation of Pearson correlation coefficient was obtained from the following equation:
(4)
In the correlation coefficient formula X and Y, the values of each variable also
Table 2
The correlation coefficient between the independent and dependent variables
| Environmental Factors | Minimum temperature °C | Average temperature °C | Maximum temperature °C | Relative Humidity °C |
| Minimum temperature | 1 | 0.661 | 0.702 | –0.028 |
| Average temperature | 0.661 | 1 | 0.817 | –0.081 |
| Maximum temperature | 0.702 | 0.817 | 1 | 0.076 |
| Relative Humidity | –0.028 | –0.081 | 0.076 | 1 |
3.1Artificial neural network model
The MLP neural network architecture was implemented based on the topologies expressed in the method section in the MATLAB environment and the average accuracy from the different turns of its implementation in two stages of training and testing was listed in Table 3. However, the choice of the maximum number of hidden layers and the maximum number of neurons in each hidden layer was determined based on trial and error. The best average accuracy obtained in the training stage was 87.25%, which is related to model number 19, and the best average accuracy in the testing stage was 86.4%, which belongs to models number 10 and 15.
Table 3
The accuracy of the neural network model for classification of positive cases in each province (based on over 500 and below 500 cases)
| Model No | Maximum Layers | Maximum Neurons | Accuracy in Testing Stage (%) | Accuracy in Training Stage (%) |
| 1 | 5 | 5 | 85.95 | 86.3 |
| 2 | 5 | 10 | 85.5 | 84.95 |
| 3 | 5 | 15 | 86.15 | 86.5 |
| 4 | 5 | 20 | 84.8 | 86.35 |
| 5 | 5 | 25 | 84.3 | 85.1 |
| 6 | 10 | 5 | 85.5 | 86.55 |
| 7 | 10 | 10 | 86.35 | 85.1 |
| 8 | 10 | 15 | 86.2 | 85.8 |
| 9 | 10 | 20 | 85.6 | 86.35 |
| 10 | 10 | 25 | 86.4 | 86.85 |
| 11 | 15 | 5 | 86.15 | 86.2 |
| 12 | 15 | 10 | 85.85 | 85.05 |
| 13 | 15 | 15 | 86.35 | 85.8 |
| 14 | 15 | 20 | 85.25 | 86.15 |
| 15 | 15 | 25 | 86.4 | 87.1 |
| 16 | 20 | 5 | 85.85 | 85.35 |
| 17 | 20 | 10 | 85.3 | 86.15 |
| 18 | 20 | 15 | 84.75 | 85.85 |
| 19 | 20 | 20 | 85.95 | 87.25 |
| 20 | 20 | 25 | 85.01 | 85.75 |
3.2Multiple linear regression analysis
Multiple linear regression analysis was used to investigate the effect of environmental factors on the trend of positive cases. For this purpose, data related to environmental factors in the city of Qom, the capital of a province with the first reported COVID-19 cases and with cold weather conditions, and the city of Ahvaz, the capital of province in southwest of Iran with tropical conditions, was analyzed and compared. The results of regression model are expressed in Equations 2 and 3. Equation 2 is related to the regression model of Qom city, and the next equation is related to the regression model of Ahvaz city.
(5)
(6)
In the above equations, T is the climate temperature. The results showed that the coefficient of determination of R2 in the first and second equations are 0.40 and 0.68, respectively. It shows that despite the appropriateness of R2, the frequency of positive cases in Ahvaz has increased. Also, the predictor variables had a strong role in the prediction of confirmed cases of COVID-19. Co-linearity diagnostics analysis in the results of the second equation indicates the problem of alignment and dependence and overlap of some predictor variables, so it is possible to use a regression model in Ahvaz to justify changes in the frequency of positive cases’ trend to be a bit misleading. However, a careful study of the output of Equation 1, despite the lower R2, indicates no misalignment, and in this equation, where the frequency of positive cases has decreased relatively, the variables of average temperature, RH, and maximum temperature have the highest share and minimum temperature has the lowest share in frequency of positive cases’ changes.
3.3Correlation analysis charts
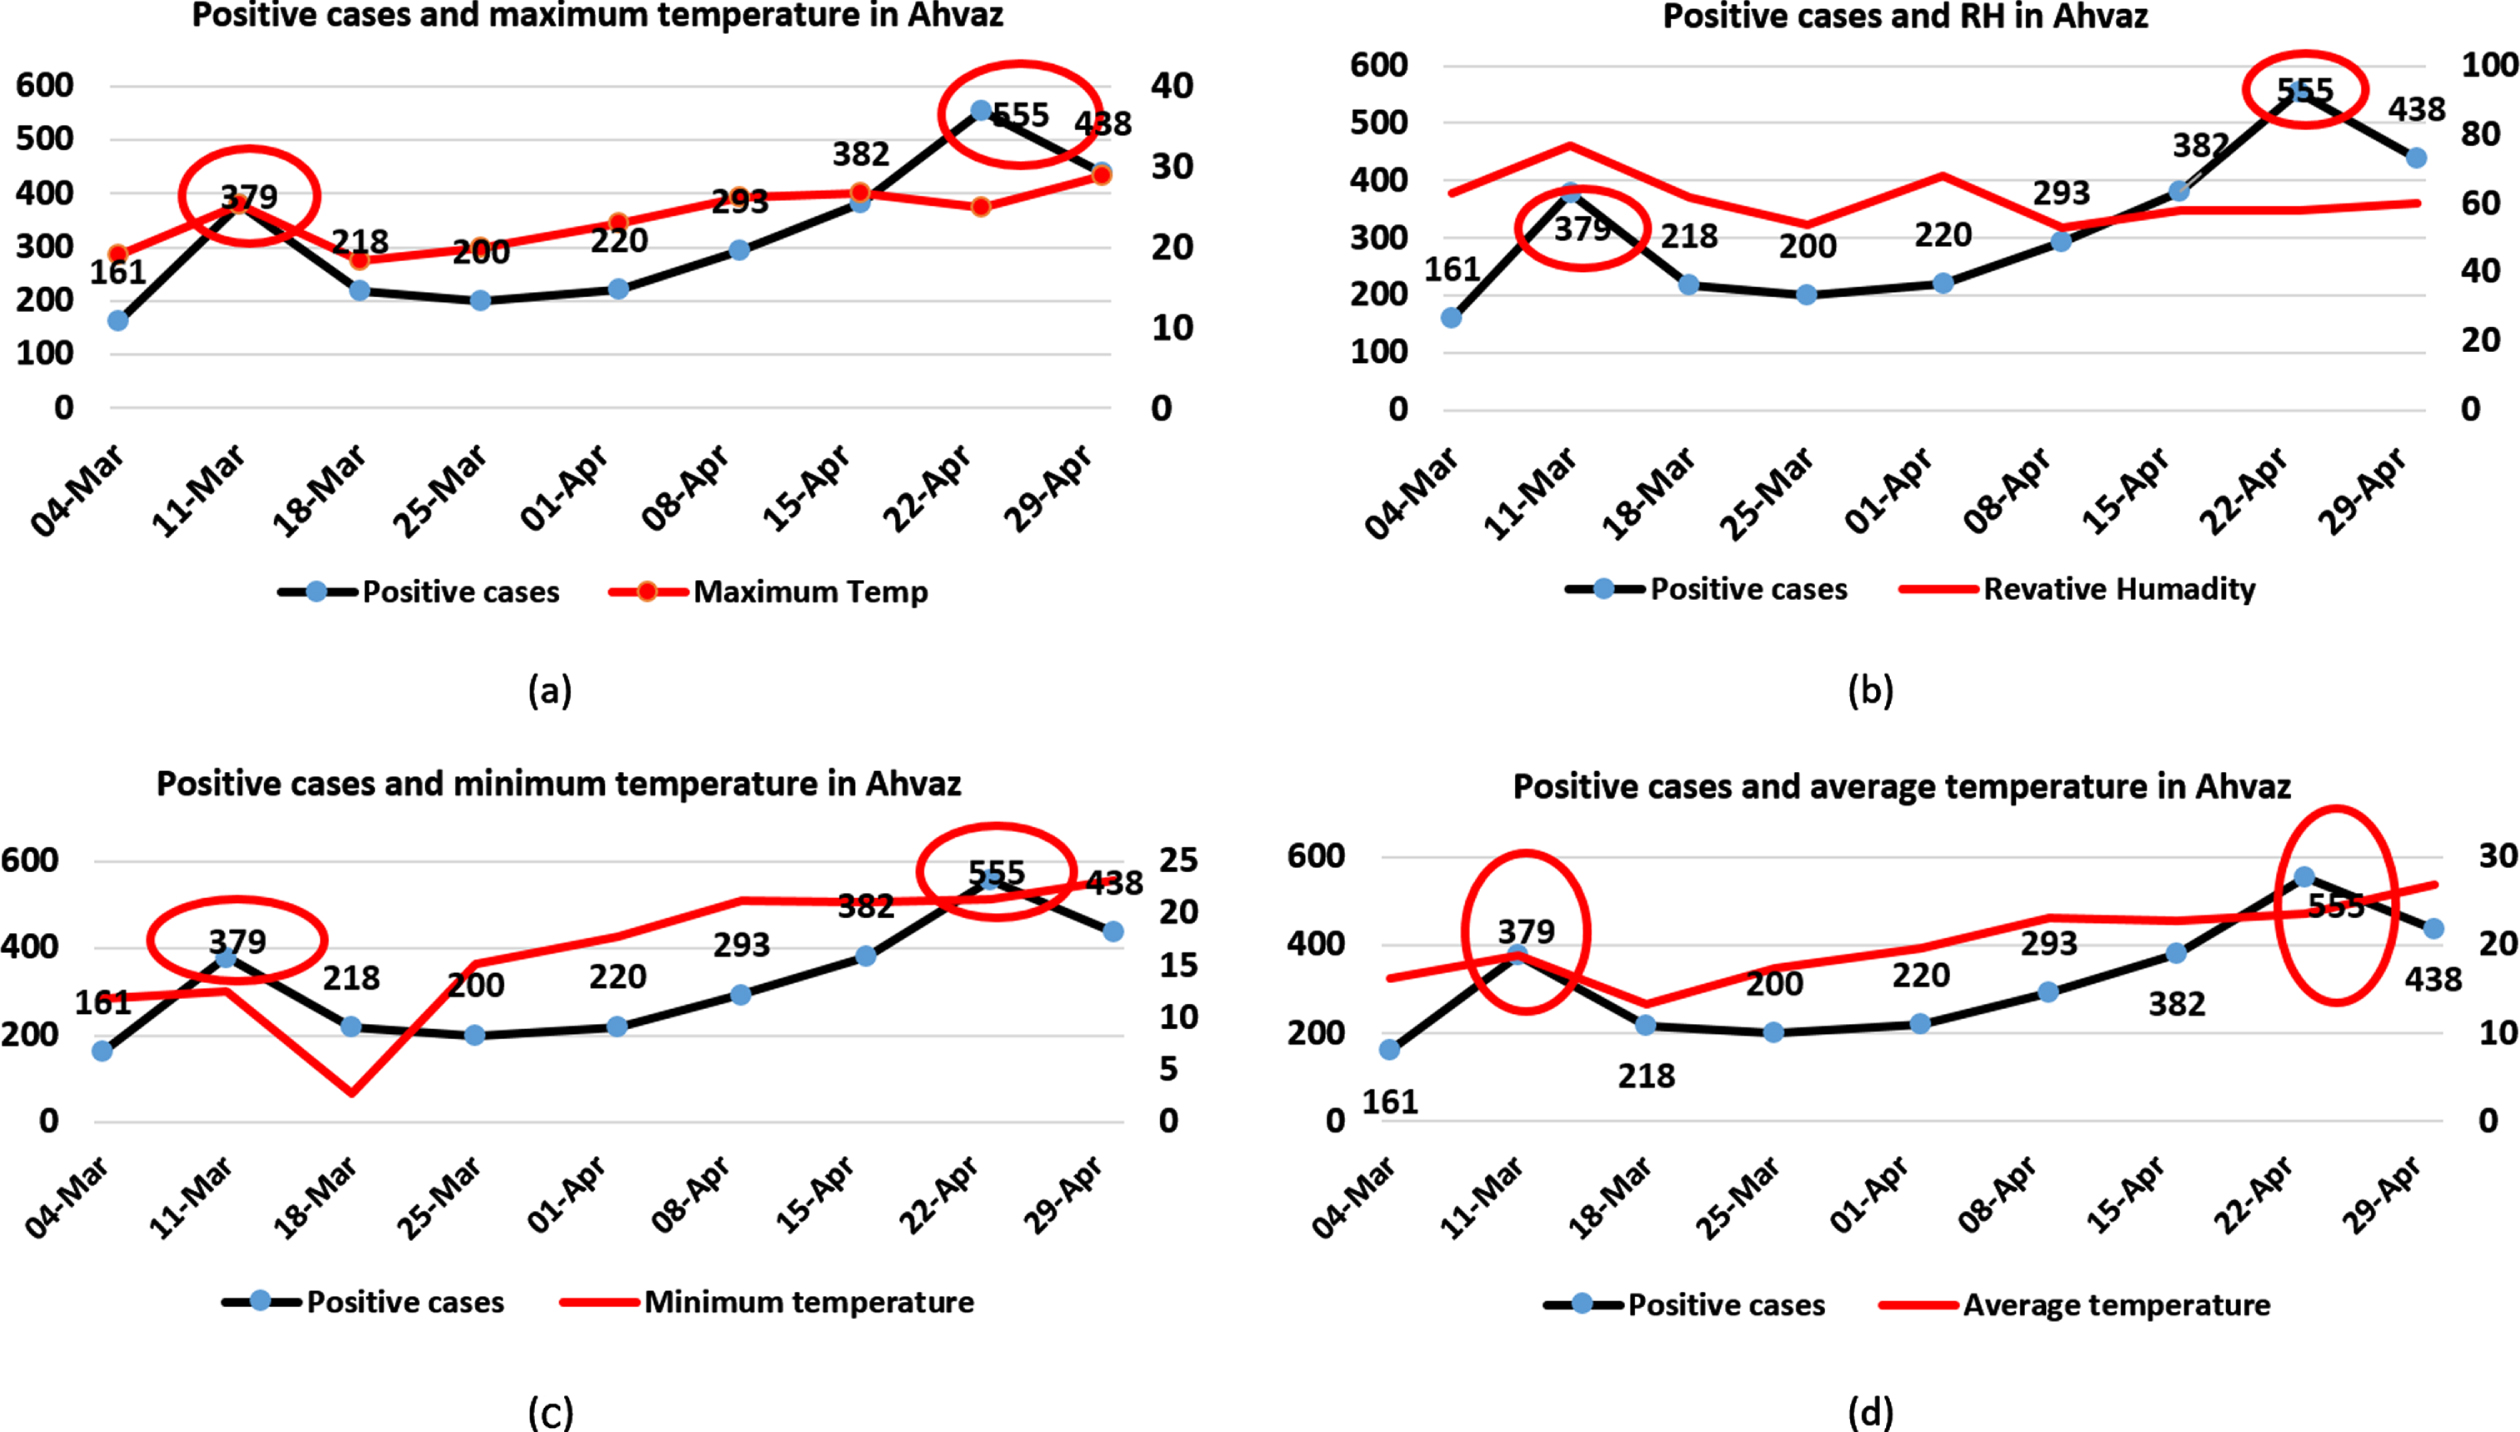
The relationship between frequency of positive cases and environmental factors was plotted for Ahvaz, the capital city of Khuzestan province, and is presented in Fig. 3. The results obtained from Fig. 3 show that from the 4th of March to the 13th of March in 2020, at the same time as the initial outbreak of this disease, despite the increase in temperature and RH, the disease has also increased. Also, from 1 to 22 April 2020, a growing trend for the frequency of positive cases was reported.
Fig. 3
Trend of positive cases of COVID-19 and weather condition in Ahvaz; a: Daily frequency of confirmed cases and maximum temperature, b: Daily frequency of confirmed cases and relative humidity, c: Daily frequency of confirmed cases and minimum temperature, d: Daily frequency of confirmed cases and average temperature.
4Discussion
In the present study, statistical methods were applied to analyze the effect of weather factors on the frequency of positive cases of COVID-19 in Iran. Also, using an ANN method, each city was considered for the frequency of positive cases in two categories (under and above 500 positive weekly cases). The accuracy obtained from the classification of ANN was 87.25%and 86.4%in the training and testing stage, respectively, and indicates the appropriate performance of this method in the predictor model. However, the results of the scatter plot due to the entry of all data related to 31 provinces did not show a strong accuracy rate in the relationship between frequency of positive cases and environmental factors, so to achieve accurate results, the data of each city should be examined separately. The comparisons between machine learning and statistical methods in this study confirmed that the developed MLP model might be an appropriate method in predicting the frequency of positive cases of COVID-19 using the input daily climate factors. The relationship between predictors and the frequency of positive cases of data related to the city of Ahvaz and Qom was investigated. The regression equations of these two cities were obtained. In the city of Ahvaz, despite the increase in temperature, the coefficient of determination R2 has been increasing. It shows the growth of the frequency among the positive cases of COVID-19 in Ahvaz city. According to a study by Poirier et al., temperature and humidity alone cannot indicate the exact trend of coronavirus outbreaks, and further studies are recommended to investigate the effects of environmental factors on coronavirus outbreaks [20]. This study may explain Ahvaz conditions and indicate the existence of other interfering and distorting factors in the study of the frequency of positive cases. According to the co-linearity diagnostics results and the existence of overlap with some predictive factors, it is not possible to make a definite statement about the effect of predictive factors alone. The cause could be related to the interaction of outside temperature with indoor temperature. In such a way that with increasing outdoor temperature, indoor temperature decreases to maintain the range of comfort and optimal performance. According to the American Society of Heating, Refrigerating and Air-Conditioning Engineers (ASHRAE) standard, this range is 21 to 24 degrees Celsius and RH is 50%[21]. Also, according to studies on the effect of temperature and RH on the persistence of viruses, it has been stated that low temperature and humidity provide the best conditions for the spread and stability of the virus [4, 22]. Given that most people’s activities are indoors, conditions are provided for the transmission of viral diseases, such as COVID-19, inside the working environment. Regarding the results of temperature changes and positive cases in the city of Ahvaz, it can be stated that the use of open or closed air cycle to provide comfort in indoor environments depends on the outside temperature. In other words, when the outside temperature is in the comfort range, the natural ventilation of outdoor air is used for indoor environments (open air circulation cycle), which has led to a reduction in the positive cases of the disease. However, when the outside temperature increases, cooling devices, such as air conditioners (closed air circulation cycle), should be used to provide the desired temperature conditions indoors, which is in line with the increase in the number of positive cases of COVID-19. The evidence showed that not only in terms of temperature and RH but also population density in the city of Ahvaz and the lack of social distance, not using masks and other health protocols, as well as participating in ceremonies and close contact with people in the community can accelerate the virus spike. The results of the present have also been confirmed in a review study by Zhan et al. on the impact of environmental factors on the spread of COVID-19 [23]. In a similar study by Pirouz et al., the results of the multiple linear regression model showed that the frequency of positive cases of COVID-19 was decreased in Wuhan 14 days after quarantine, and fluctuations in increasing frequency of positive cases may be influenced by environmental factors [19]. The results of the study by Mandal et al. showed that with increasing temperature and humidity, the frequency of positive cases’ trend in India decreased, and temperature and humidity can affect the frequency of positive cases of COVID-19 [24]. The results of the regression model in Qom are consistent with the results of the study of Mandal et al. So that in the regression model and co-linearity diagnostics in Qom, the factor of humidity can explain 85%and maximum temperature can explain 94%of the share of effects in predicting the frequency of positive cases’ trend. In similar work by Wu et al., increasing temperature and humidity showed a positive effect on reducing the frequency of positive cases of COVID-19 disease, but nevertheless, preventive and control measures have been emphasized in identifying the sources of infection and preventing the spread of virus outbreaks [25–27].
5Limitations
Due to the onset of COVID-19 spread and its unknown nature that made it nearly impossible to predict its behavior in different environments, the following limitations in the study can be stated; time limitation on data gathering, lack of exact data on indoor ventilation systems and lack of indoor air temperature for all cases.
6Conclusion
In the present study, the relationship between urban ambient temperature and the frequency of positive cases of COVID-19 was investigated through machine learning and statistical analysis. The developed MLP model presented the suitable performance capacities in predicting and classifying the positive COVID-19 cases. Moreover, the results showed the growth of the frequency among the confirmed cases of COVID-19 with increasing the climatic temperature in the tropical city. Considering the reverse effect of outdoor temperature on indoor temperature (comfort zone), suitable conditions for virus spread are provided in sheltered environments where life is going on and the virus finds more hosts. It is recommended that other factors, including indoor ambient temperature and ventilation system effectiveness, should be taken into account in future studies.
Acknowledgments
The authors gratefully acknowledge the support from the Meteorological Organization and the National Productivity Organization and the Statistics Center of Iran.
Conflict of interest
The authors declare that there is no conflict of interest regarding the publication of this article.
Funding
This work was supported by a grant from the Ahvaz Jundishapur University of Medical Sciences, Ahvaz, Iran (grant no. U-99016).
References
[1] | Bannister-Tyrrell M , Meyer A , Faverjon C , Cameron A . Preliminary evidence that higher temperatures are associated with lower incidence of COVID-19, for cases reported globally up to 29th February 2020. |
[2] | Dehaghi BF , Teimori-Boghsani G , Ghavamabadi LI , Mohammadi A . Public Eye toward COVID- A Systematic Review. Open Access Macedonian Journal of Medical Sciences. (2020) ;8: (T1):61–5. |
[3] | Prabhu N , Issrani R . Dilemma in the foreign lands during COVID- An outlook of expat health care professionals with a take on a social perspective. Work. (2020) ;67: :779–82. |
[4] | Chan KH , Peiris JS , Lam SY , Poon LL , Yuen KY , Seto WH . The Effects of Temperature and Relative Humidity on the Viability of the SARS Coronavirus. Advances in virology. (2011) ;2011: :734690. |
[5] | Jahangiri M , Cousins R , Gharibi V . Let’s get back to work: Preventive biological cycle management of COVID-19 in the workplace. Work. (2020) ;66: :713–6. |
[6] | Alamo T , Reina DG , Mammarella M , Abella A . Covid- Open-Data Resources for Monitoring, Modeling, and Forecasting the Epidemic. Electronics. (2020) ;9: (5):827. |
[7] | Bi P , Wang J , Hiller JE . Weather: driving force behind the transmission of severe acute respiratory syndrome in China? Intern Med J. (2007) ;37: (8):550–4. |
[8] | Cai QC , Lu J , Xu QF , Guo Q , Xu DZ , Sun QW , et al. Influence of meteorological factors and air pollution on the outbreak of severe acute respiratory syndrome. Public Health. (2007) ;121: (4):258–65. |
[9] | Arumugam M , Menon B , Narayan SK . Ambient temperature and COVID-19 incidence rates: An opportunity for. Emerging Microbes & Infections. (2020) ;9: (1). |
[10] | Battineni G , Chintalapudi N , Amenta F . Tropical Conditions and Outbreak of COVID-19. Pharmaceutical and Biomedical Research. (2020) ;6: (0):9–16. |
[11] | Neher RA , Dyrdak R , Druelle V , Hodcroft EB , Albert J . Potential impact of seasonal forcing on a SARS-CoV-2 pandemic. Swiss Medical Weekly. (2020) ;150: :w20224. |
[12] | Mollalo A , Rivera KM , Vahedi B . Artificial Neural Network Modeling of Novel Coronavirus (COVID-19) Incidence Rates across the Continental United States. Int J Environ Res Public Health. (2020) ;17: (12):4204. |
[13] | Ayer T , Chhatwal J , Alagoz O , Charles Kahn EJ , Woods RW , Burnside ES . Comparison of Logistic Regression and Artificial Neural Network Models in Breast Cancer Risk Estimation. RadioGraphics. (2010) ;30: (1):13–22. |
[14] | Fadare D . Modelling of solar energy potential in Nigeria using an artificial neural network model. Applied Energy. (2009) ;86: :1410–22. |
[15] | Tamang S , Singh P , Datta B . Forecasting of Covid-19 cases based on prediction using artificial neural network curve fitting technique. Global Journal of Environmental Science and Management. (2020) ;6: :53–64. |
[16] | Svozil D , Kvasnicka V , Pospíchal J . Introduction to multi-layer feed-forward neural networks. Chemometrics and Intelligent Laboratory Systems. (1997) ;39: :43–62. |
[17] | Xin Y . Evolving artificial neural networks. Proceedings of the IEEE. (1999) ;87: (9):1423–47. |
[18] | Ploj B , Harb R , Zorman M . Border Pairs Method—constructiveMLPlearning classification algorithm. Neurocomputing. 2013. |
[19] | Pirouz B , Shaffiee Haghshenas S , Shaffiee Haghshenas S , Piro P . Investigating a Serious Challenge in the Sustainable Development Process: Analysis of Confirmed cases of COVID-19 (New Type of Coronavirus) Through a Binary Classification Using Artificial Intelligence and Regression Analysis. Sustainability. (2020) ;12: (6):2427. |
[20] | Poirier C , Luo W , Majumder MS , Liu D , Mandl KD , Mooring TA , et al. The Role of Environmental Factors on Transmission Rates of the COVID-19 Outbreak: An Initial Assessment in Two Spatial Scales. SSRN. (2020) :3552677: . |
[21] | American Society of Heating, Refrigerating and Air-Conditioning Engineers, ‘Thermal Environmental Conditions for Human Occupancy’,ASHRAEStandard, 55-2010, (www.ashrae.org). |
[22] | Safronetz D , Rockx B , Feldmann F , Belisle SE , Palermo RE , Brining D , et al. Pandemic swine-origin H1N1 influenza A virus isolates show heterogeneous virulence in macaques. Journal of Virology. (2011) ;85: (3):1214–23. |
[23] | Zhan J , Liu QS , Sun Z , Zhou Q , Hu L , Qu G , et al. Environmental impacts on the transmission and evolution of COVID-19 combing the knowledge of pathogenic respiratory coronaviruses. Environ Pollut. (2020) ;267: :115621. |
[24] | Mandal M , Patra S , Pal S , Acharya S , Hazra M . Study of the Dependence of Effective Reproduction Number of COVID-19 on the Temperature and Humidity: A Case Study with the Indian States. medRxiv; 2020. |
[25] | Fouladi Dehaghi B , Ghodrati-Torbati A , Teimori G , Ibrahimi Ghavamabadi L , Jamshidnezhad A . Face masks vs. COVID-19 a systematic review. Investigacion y Educacion en Enfermeria. (2020) ;38: (2). |
[26] | Wu Y , Jing W , Liu J , Ma Q , Yuan J , Wang Y , et al. Effects of temperature and humidity on the daily new cases and new deaths of COVID-19 in 166 countries. The Science of the Total Environment. (2020) ;729: :139051. |
[27] | Najafabadi MG , Khah AS , Rostad M . Sedentary lifestyle among office workers and coronary heart disease risk factors due to the COVID-19 quarantine. Work. (2020) ;67: :281–3. |


