
Seat pitch and comfort of a staggered seat configuration
Abstract
BACKGROUND:
Staggered seats are a solution for the Flying-V aircraft, where the cabin’s longitudinal axis has a 26 degrees angle with respect to the direction of flight, to compensate for an otherwise oblique sitting position. However, little is known on acceptable pitches in this staggered configuration.
OBJECTIVE:
The goal of this research is to evaluate the comfort of different pitches for seats that are staggered relative to the cabin’s longitudinal axis.
METHODS:
Two rows of staggered seats are positioned at three different pitches (27, 29 and 31 inches). 53 participants were seated in each setup. For each, a questionnaire was completed including questions on comfort and discomfort, top view photos were taken to analyse postures and physical dimensions were recorded to define passengers’ space.
RESULTS:
Comfort as well as discomfort were significantly different for the three setups. The comfort at 27 inches was seen as unacceptably low. The 29 and 31-inch configurations showed to result in acceptable levels of comfort, comparable to higher-end seating layouts. There were very little complaints about space in lateral direction (elbow and seat width), showing the advantage of having your won armrest and shoulder space in the staggered configuration. Interesting was that at larger pitches more complaints were found for the seat characteristics, probably in the shorter pitch the other discomfort was overruling this.
CONCLUSION:
The 26-degree staggered configuration offers improvements in shoulder- and elbow-space. The results for the 29- and 31-inch are expected to allow enough design freedom for further exploration of such a configuration for the Flying-V cabin interior.
1Introduction
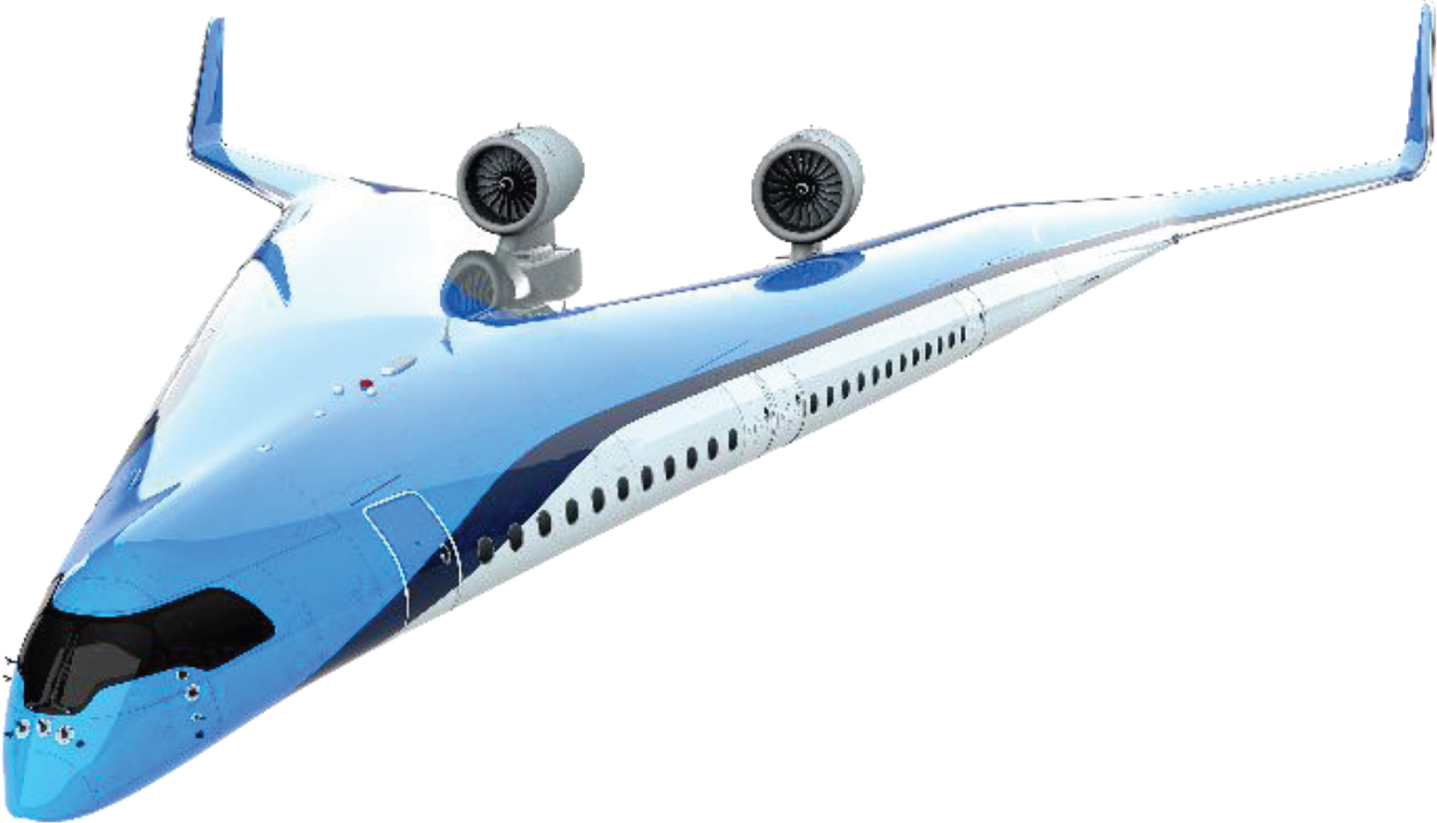
According to the International Civil Aviation Organization, 4.1 billion passengers were transported by aircraft in 2017 and this number will continue to grow [1]. In addition, 2% of all CO2 generated worldwide is produced by air transport annually. This shows the need to develop more energy-efficient aircrafts. The Flying-V aircraft is a long-haul aircraft in development, which is targeted to be more energy-efficient due to a large reduction in drag. It also has options for alternative propulsion like synthetic kerosene and hydrogen. In this Flying-V the passengers are seated inside the wing, in a cabin with a flat oval cross-section (see Fig. 1). There is no separate fuselage anymore. This study is a first step in investigating the passenger experience in this aircraft.
Fig. 1
The Fling V showing that passengers are located in the wing.
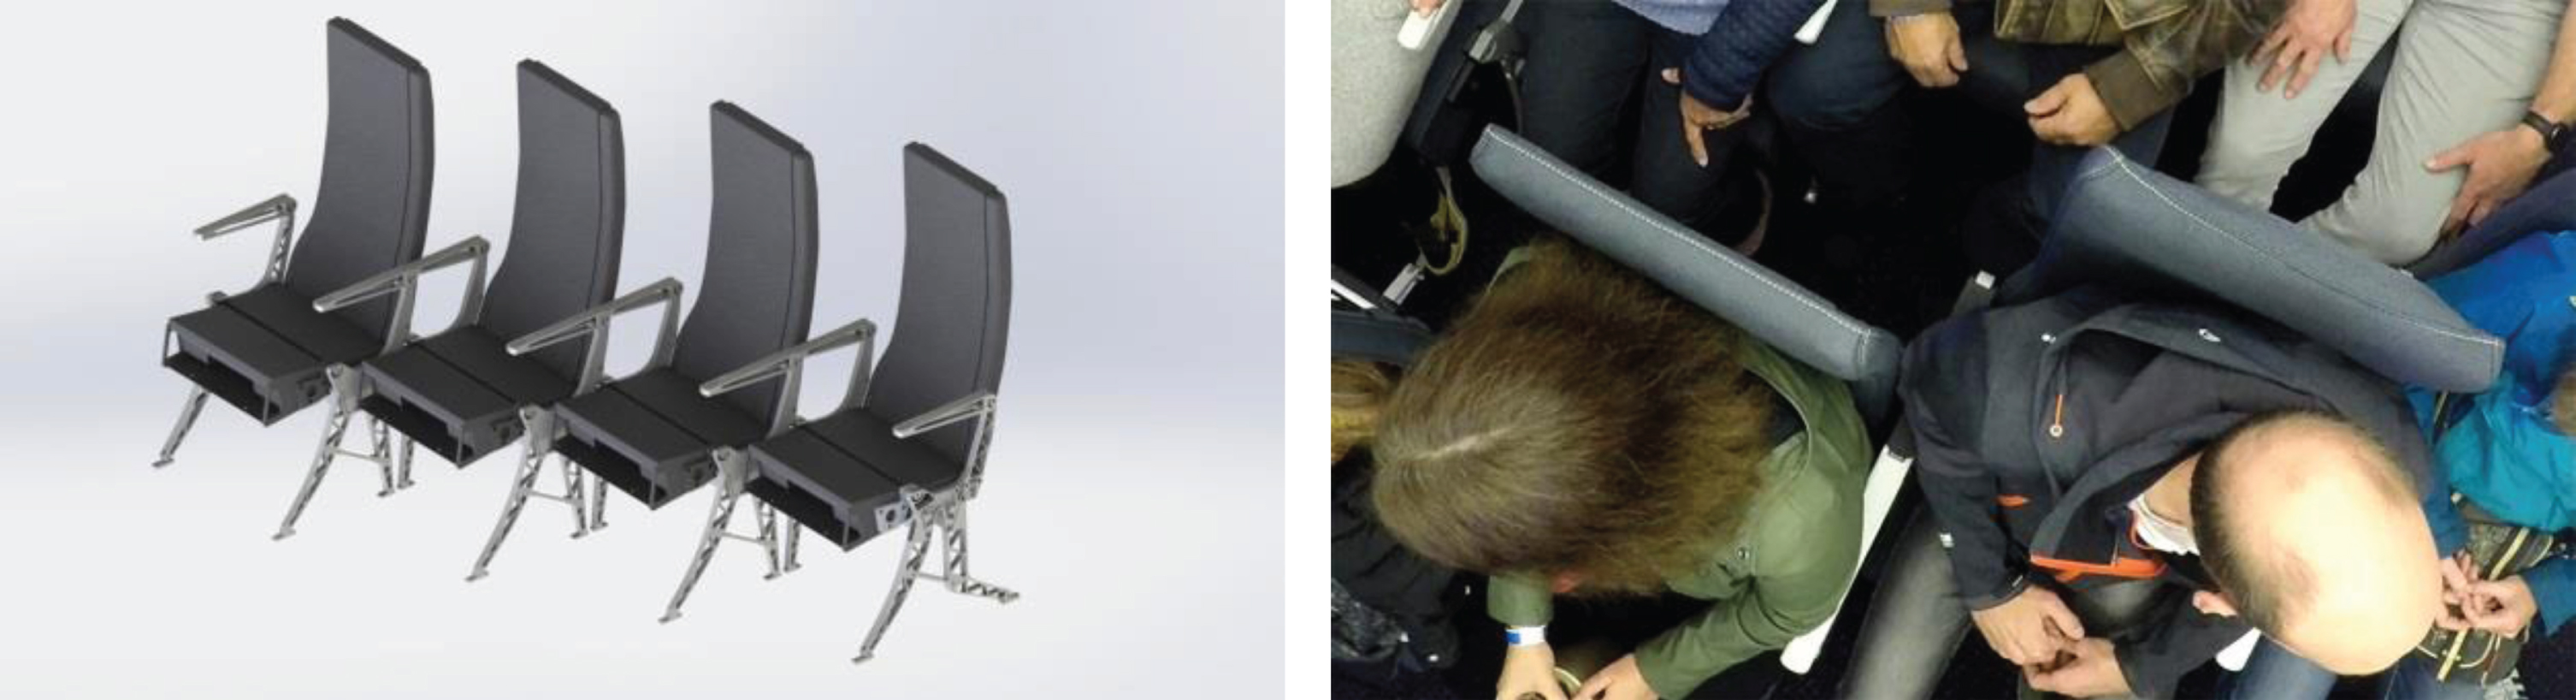
In conventional aircraft, the cabin’s longitudinal axis is equivalent to the direction of flight (DOF). Rows of seats are commonly positioned perpendicular to this axis, so seats are facing the DOF. In the Flying-V however, the angle between the cabin’s longitudinal axis and the DOF is 26 degrees. Seat rows cannot be placed conventionally, perpendicular to the cabin’s longitudinal axis, without second thought as Federal Aviation Administration (FAA) regulations state that only seats with an angle of 0–18 degrees the DOF would offer an adequate level of safety (FAA, 2006; USCFR-1988). For seats installed at angles greater than 18 degrees from the DOF, additional safety requirements are required. A crash at these high angles will not be survivable [2]. Therefore, in the current Flying-V layout each individual seat is positioned facing DOF, but still in rows perpendicular to the cabin’s longitudinal axis, resulting in 26-degrees staggered configuration (see Fig. 1). This creates unconventional non-rectangular legroom, but passenger’s shoulders will not touch those of neighbours, and on the armrest, neighbouring passengers will each use different areas, which is expected to be beneficial to the comfort experience as well (see Fig. 2).
Fig. 2
Staggered seats (left), creating a situation where there is less shoulder contact and where passengers next to each other use other areas at the armrests (right).
In this new situation, it is unclear what an acceptable distance is between two rows (the seat pitch) to sit comfortably and at the same time have a viable passenger capacity in the airplane. In the traditional definition of pitch, the seat pitch itself is measured from a point on a seat to the exact same point of the seat in-front/behind it [3]. This definition can still be used, but it does not directly compare to legroom and living space of conventional configurations at the same pitch.
In a pre-study comparing the staggered configuration to a conventional configuration, both at a pitch of 32 inches, the staggered configuration was seen as much more comfortable. However, placing each seat diagonally to the cabin’s longitudinal direction would result in a larger total row width. In initial analysis it was determined that this would not fit within the Flying-V’s cabin and that a reduction is needed, from a 10-abreast configuration to a 9-abreast configuration. To compensate for the capacity loss, the pitch should then be close to 27 inches. However, preliminary analysis also showed that at pitches smaller than this, in- and egress will become difficult, if not impossible. The minimum hip-to-knee space is then reduced to 593 mm (more dimensions can be found in Figure 32, Fig. 3 and Table 1 in the ‘Method’ section), which accommodates only P5 of the Dutch male population. Therefore, a 27-inch pitch is seen as the minimum, and configurations at pitches of 31, 29 and 27 inches will be studied with the aim to define the comfort experience in this unconventional seat configuration. A pitch of more than 31 inches is certainly not favourable with this 9-abreast configuration, as commercial profitability will be hard to achieve. Anjani et al. [4] defined comfort levels for conventional configurations with several pitches and seat widths, which will be used as reference. Anjani et al. also discussed that a comfort level lower than 5 on a scale 1–10 is in fact unacceptable.
Fig. 3
Dimensions of the Rebel Aero aircraft seat used in the test.
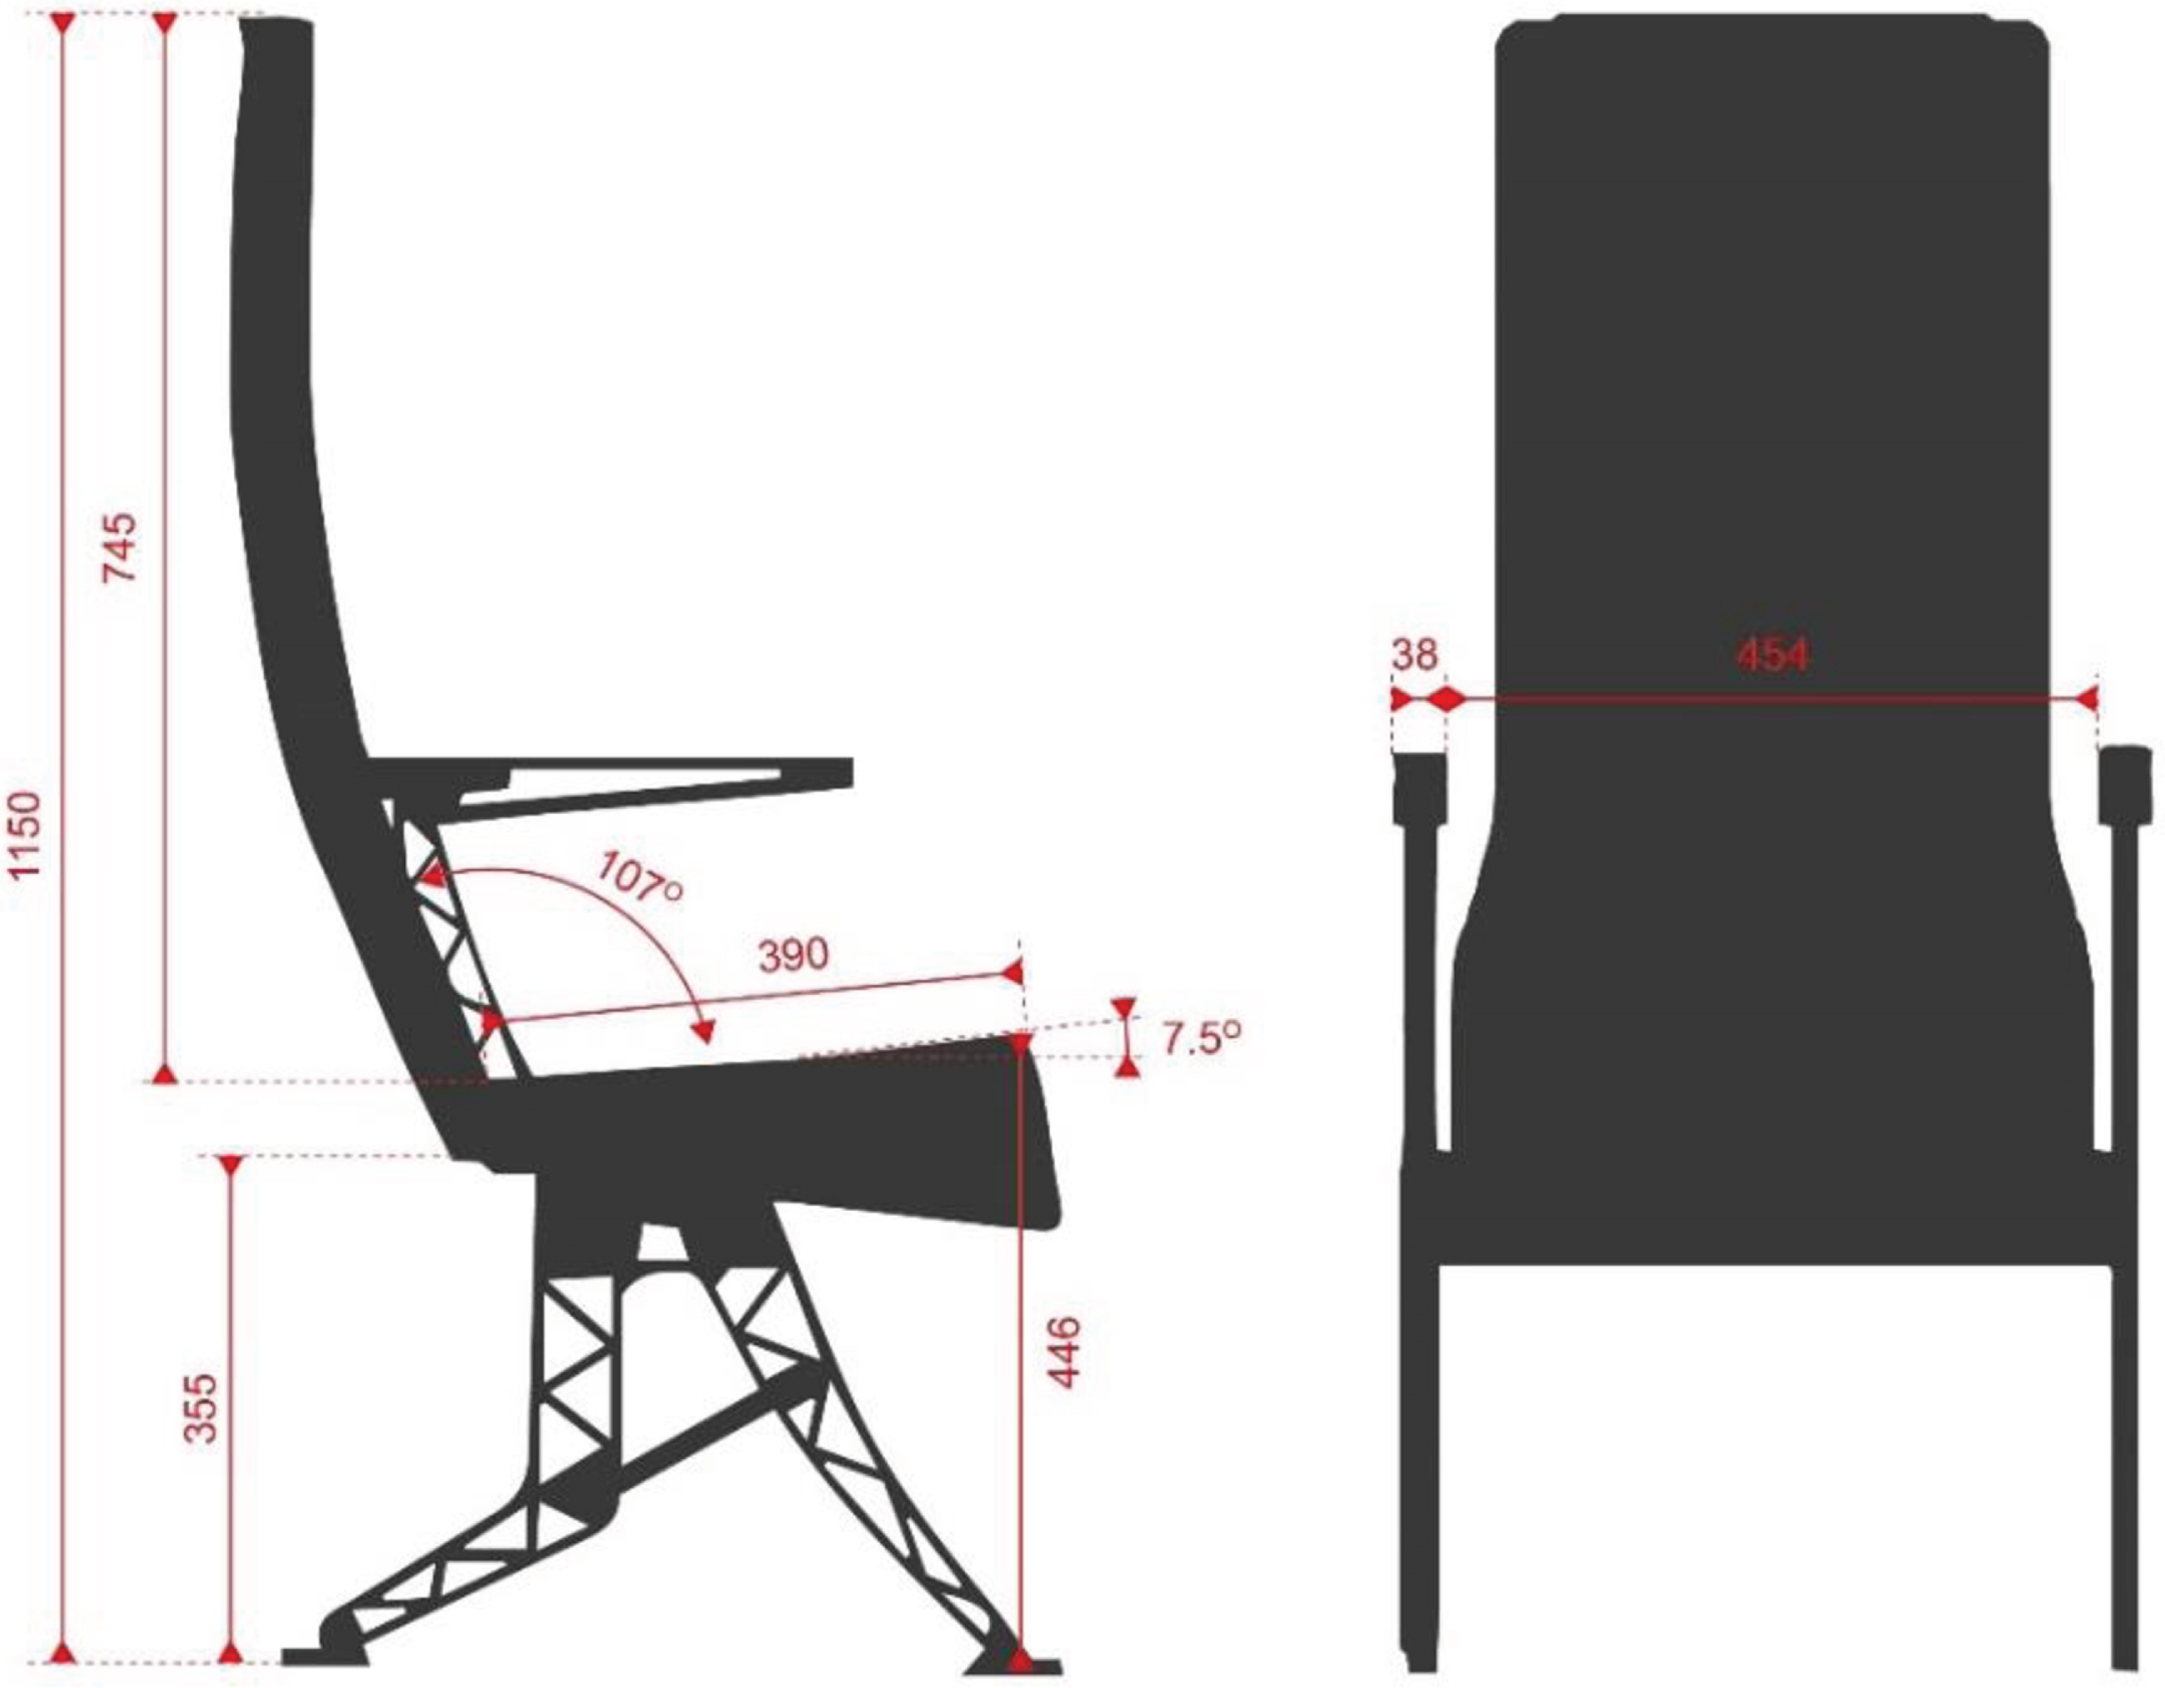
Table 1
Dimensions of the 26-degree staggered seat configuration, per setup, related to Figure 3
| Dimension setup | A | B | C | |
| 1 | Pitch longitudinal (mm and inch) | 737 | 787 | 686 |
| 29.0′′ | 31.0′′ | 27.0′′ | ||
| 2 | Staggering step (mm) | 240 | ||
| 3 | Clear depth at top of backrest (mm) | 175 | ||
| 4 | Pitch DOF min. (mm and inch) | 662 | 710 | 616 |
| 26.1′′ | 28.0′′ | 24.3′′ | ||
| 5 | Pitch DOF max. (mm and inch) | 893 | 940 | 847 |
| 35.2′′ | 37.0′′ | 33.3′′ | ||
| 6 | Knee space in plane of seat pan min. (mm) | 232 | 270 | 182 |
| 7 | Hip-knee space 100 mm above seat pan min. (mm) | 639 | 684 | 593 |
| 8 | Knee space in plane of seat pan max. (mm) | 454 | 520 | 413 |
| 9 | Hip-knee space 100 mm above seat pan max. (mm) | 877 | 923 | 831 |
| 10 | Leg position from seat pan edge ground level depth (mm) | 121 | 167 | 81 |
| 11 | Leg position from seat pan edge ground level width (mm) | 291 | 313 | 267 |
The research question for this study is: what is the comfort level sitting in this 26-degree staggered seat configuration at 31, 29 and 27 inches, is this still acceptable and how does this compare to conventional configurations?
2Method
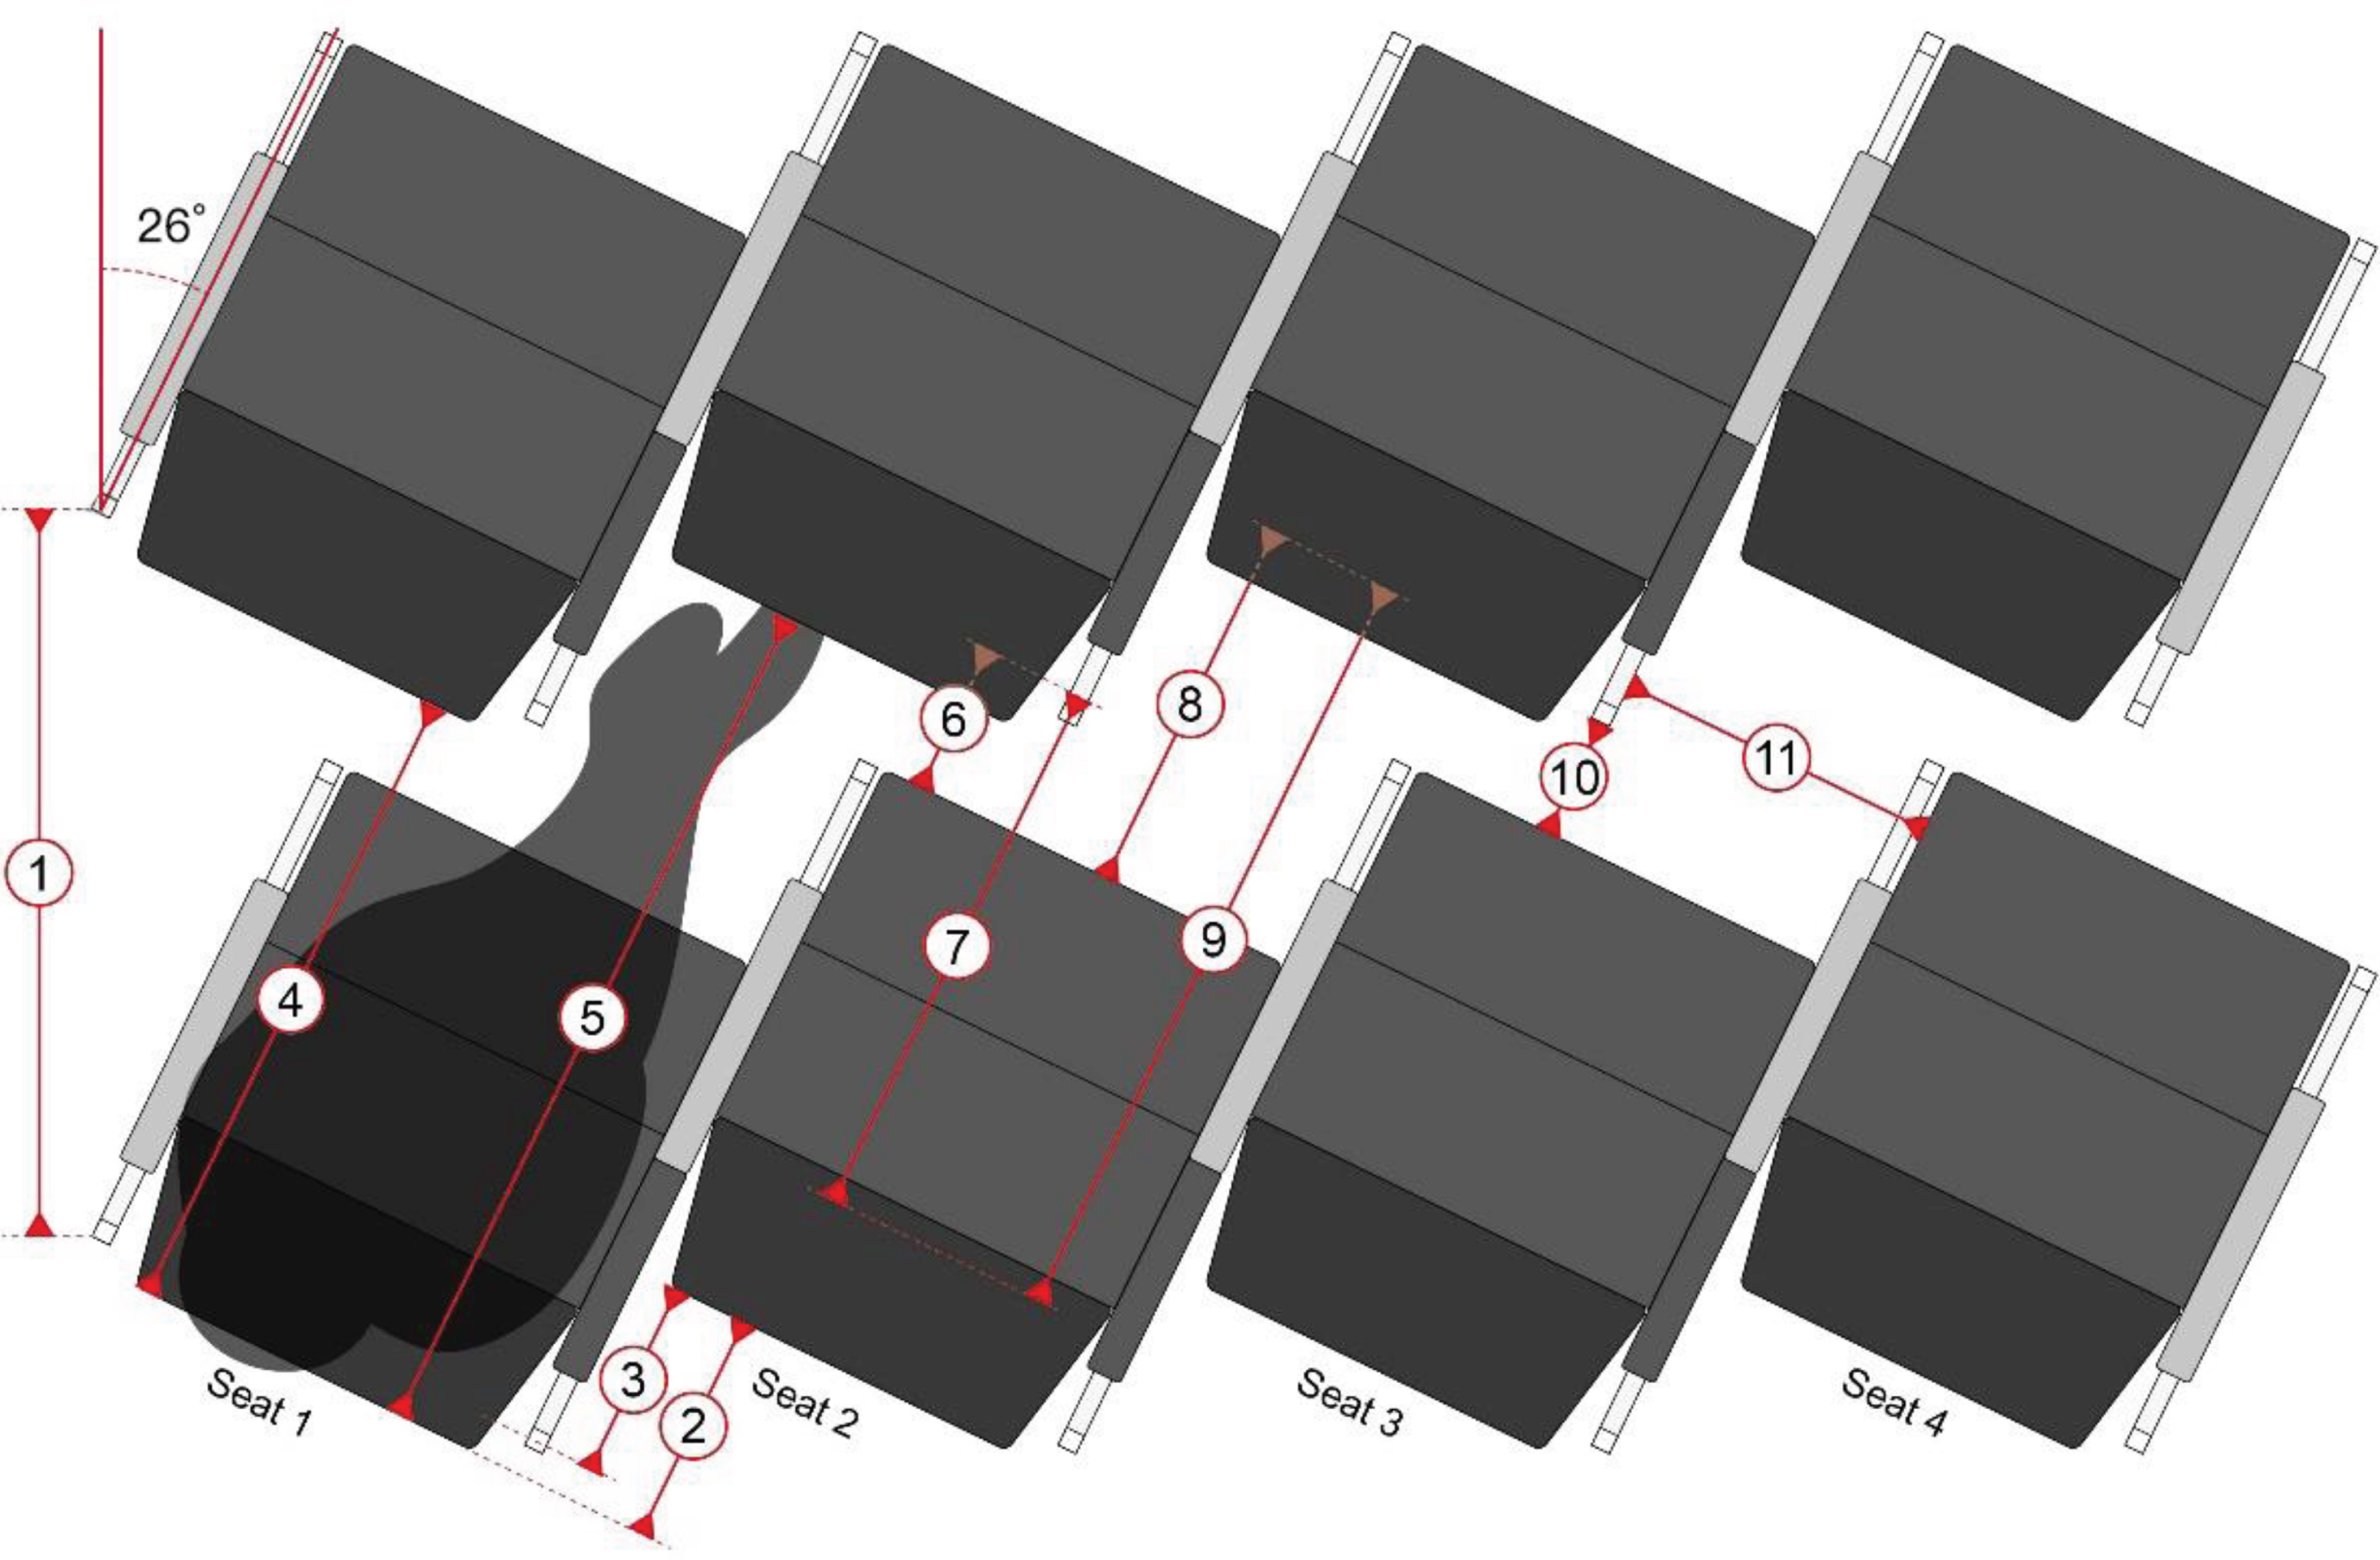
This study was conducted in a true-scale mock-up of a part of the Flying V at the campus of Delft University of Technology. The seats used were 17.9-inch-wide Rebel Aero seats (for main dimensions see Fig. 3). Two rows of four seats were placed in a 26-degree staggered configuration. Because the seats were not originally designed for this configuration, each seat has its own legs, possibly creating hindrance in the row behind. This is expected to show in the results and was specifically asked for. All seats had a seat pan, which could partially be flipped up to accommodate in and egress. During the experiment, the participants only used the second row, with the seat in the flipped down position. The first row could be set at three distances from the second row, named: A at 29 inches; B at 31 inches; and C at 27 inches. The resulting passenger’s living space is provided in Fig. 4 and Table 1.
Fig. 4
Parameters of the 26-degree staggered seat setup.
From the 53 participants aged between 20 and 30 years old, 16 were males, 37 females (average height 171 cm; SD = 9.40; weight 68.8 kg, SD = 18.04). They were asked to sit in a seat three times for five minutes and complete a questionnaire on their smart phone while in the seat. Before the experiment, all participants were asked to sign an informed consent form, allowing the data to be used in research and education and take top view photos.
The participants were given verbal explanation of the research protocol. Every group of participants fulfilled three rounds at the three different pitches to enable a within subject design, and every round lasted 5–10 minutes. The order of pitch dimensions was varied using the Latin square method, where each pitch was labelled with the letters described before, so the participants did not know the exact pitch size. In the first round, seat choice was free between: (1) the left aisle seat; (2) the left middle seat; (3) the right middle seat middle or; (4) the right aisle. If less than four participants were seated in a session, the participants were asked to leave the rightmost seat(s) vacant. A researcher would take the leftmost vacant seat to function as a neighbour to the rightmost participant. After the first round, the participants were asked to leave the mock-up so the pitch could be adjusted out of sight of the participants. In the second and third round, participants were asked to take the same seat as before. Participants were not allowed to use the tray table and not allowed to flip up the seat pan while seated.
2.1Questionnaire
The questionnaire requested input on the participant’s height, weight and gender, which were asked only once. The other questions were asked repeatedly for each setup. More general questions were included such as, ‘rate the comfort of this seat’ (scale 1–10; 1 = least comfortable, 10 = most comfortable) and ‘rate the discomfort of this seat’ using the same scale. Other questions focused more specifically on leg room, seat width, etc. At the end of one session, the participants were asked for the main restrictive factors from a list of predefined options, such as, ‘the width of the seat’ or ‘the seat in front at knee-height’, with the option of adding their own suggestions. At the very end of the questionnaire, additional remarks are also asked.
After the test a spontaneous open interview was held, where participants gave their feedback and could be asked for explanations.
2.2Photo analysis
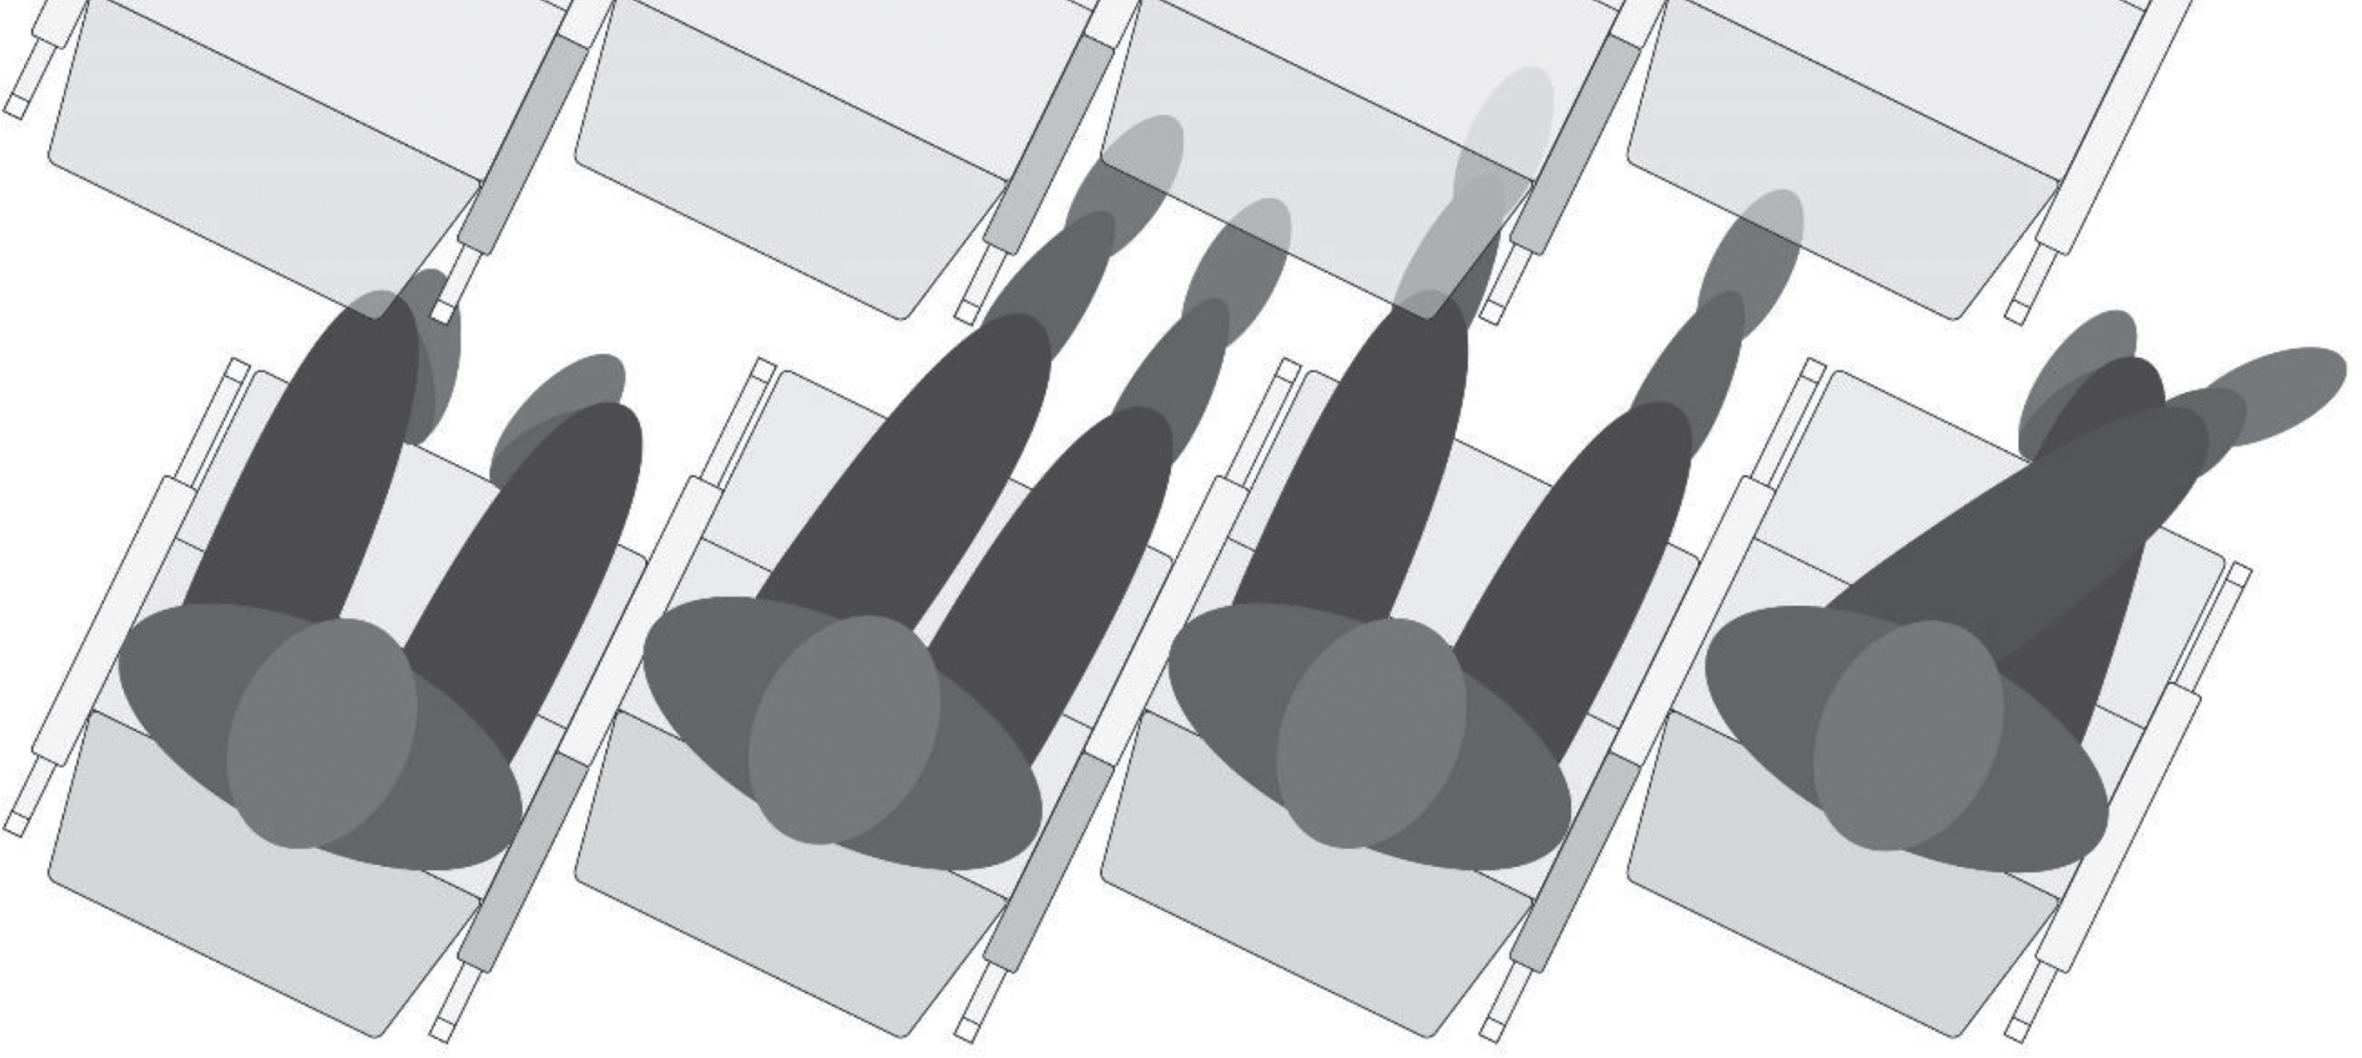
Photos were taken in top view, while the participants were completing the test. One photo was taken every 60 seconds. The photos were visually analysed and the posture of the legs in particular, for each participant was categorised as (1) Straight / pulled in, (2) Stretched to one side, (3) Stretched straight forward, and (4) Crossed (on top of each other), see Fig. 5. Postures 1 and 2 are expected to be an indicator of little space for each passenger, postures 3 and 4 as an indicator of a lot of space.
Fig. 5
Categorisation of postures. From left to right: (1) Straight / pulled in, (2) Stretched to one side, (3) Stretched straight forward, and (4) Crossed (on top of each other).
All data were imported in Excel and SPSS version 24. Averages and standard deviations were recorded over participants and differences between two positions were tested using Wilcoxon (p < 0.05), as usually comfort scores are not normally distributed. A correlation between stature height and discomfort and was calculated as well.
3Results
3.1Questionnaire results
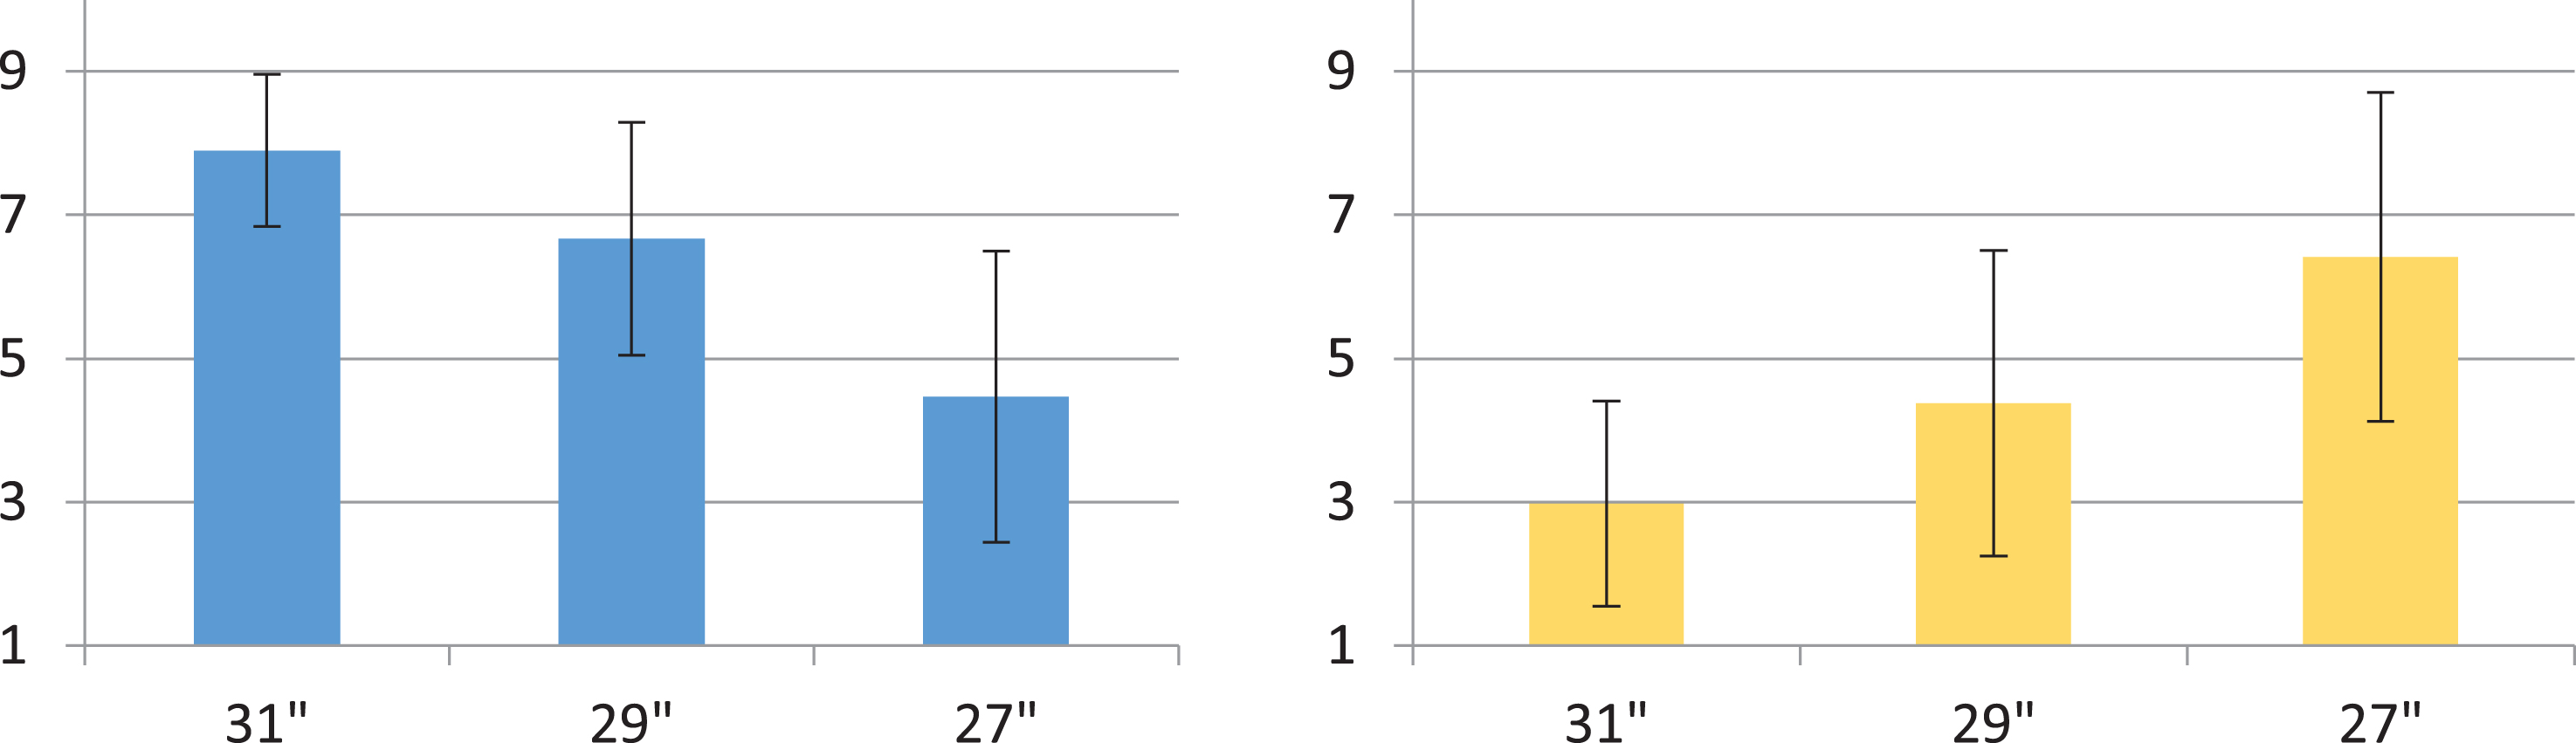
In Fig. 6 the comfort and discomfort scores of the different setups are shown. As was expected the largest pitch resulted in highest comfort and lowest discomfort scores. The smallest pitch had the lowest comfort and highest discomfort scores. All differences were significant with the Wilcoxon paired test (p < 0.05). It was expected that there was a correlation between height of the participant and comfort score in the 27-inch seat pitch. However, correlations were low. For instance, one of the highest correlation coefficients was between stature height and ‘I score my leg room as..’.
Fig. 6
Average comfort scores (left) and discomfort scores (right) and standard deviation of the three different pitches on a scale 1–10. All differences between 27 and 29 inches and 29 and 31 inches were significant (Wilcoxon, p < 0.05), n = 53.
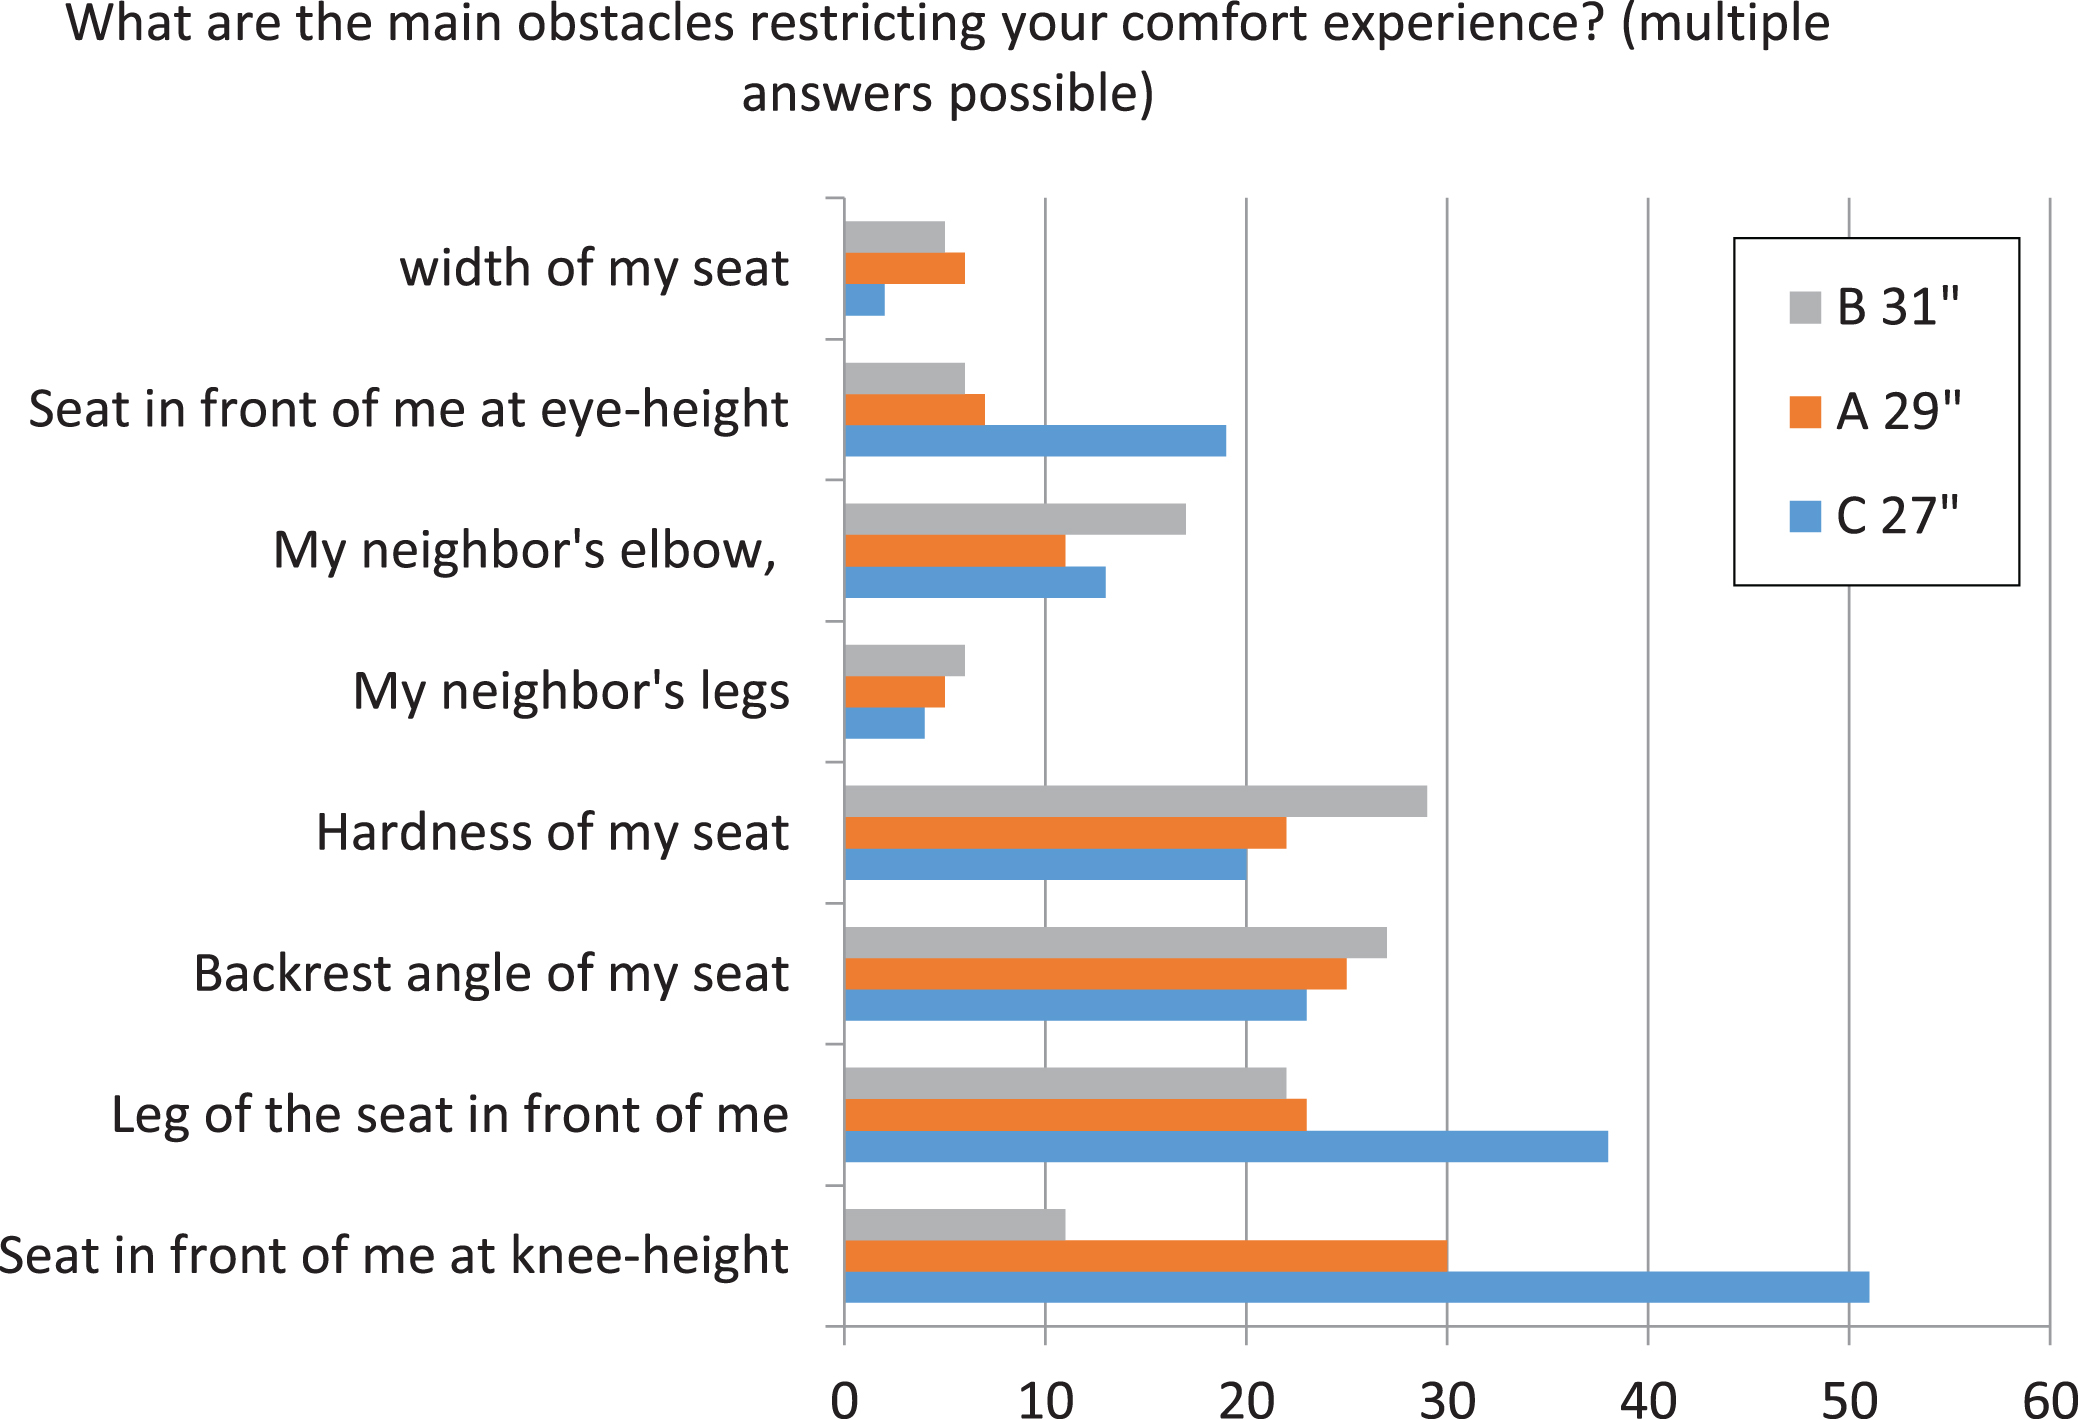
The main restrictive factors to the comfort experience (Fig. 7) for the 31-inch setup were the hardness of the seat and backrest angle (the backrest was too far upright as was mentioned in the open interview at the end). Approximately half of the group mentioned these. At a smaller pitch these complaints reduced. For the 27-inch setup, 86% of the participants complained about the seat in front at knee height and 64% complained about the leg of the seat in front of them. At the 29-inch setup, half of the group complained about the seat in front at knee height. It was clear that with reduced pitch this complaint increased. It was also seen that the factors related to space in lateral direction (‘width of seat’, ‘neighbour’s elbow’, ‘neighbour’s legs’) were mentioned least for all pitch settings, as well as the factor ‘seat in front at eye-height’ for the 29- and 31-inch configurations. For the 27-inch configuration this latter factor was mentioned relatively more frequent.
Fig. 7
Number of participants out of 53 mentioning the problem as described in the figure for the three seats.
In the open interview it became clear that the 27-inch configuration was considered unacceptable by most participants for flying in a long-haul airplane. Many of the participants mentioned that the seats in front of them hinder the space for feet and legs while sitting. However, often it was said that it is also nice to have something higher than the floor to put your feet on. The armrest of the seat in front of the passenger did restrict movement as well and it had hard pointy elements, interfering with the knee. A redesign is advised. Some participants mentioned that when the row in front of the participants would have been occupied, the situation would have been more realistic. Privacy issues were also mentioned, since each left neighbour is sitting slightly behind, watching over the shoulder of their right neighbour. Participants also mentioned that there was a difference between the left and right arm rest, but they could not report this in the questionnaire. Also, some participants mentioned that naming the rows illogically and not A, B and C consecutively does not matter as you easily see what is changed on the ground, which can influence the outcome.
3.2Photo analysis results
For analysis, three stable postures for each person were extracted in three setups. There are 53 participants in total, so 159 posture samples were collected in all the photos.
In the photos analysed it was seen that the ‘straight / pulled in’ postures were taken most (51%), see Fig. 8, followed by the postures ‘stretched to one side’ and ‘stretched straight forward’, almost equally frequent (23% and 22% respectively). Lastly, 4% of the participants had crossed legs during the experiment.
Fig. 8
Percentage of participants observed per leg posture.
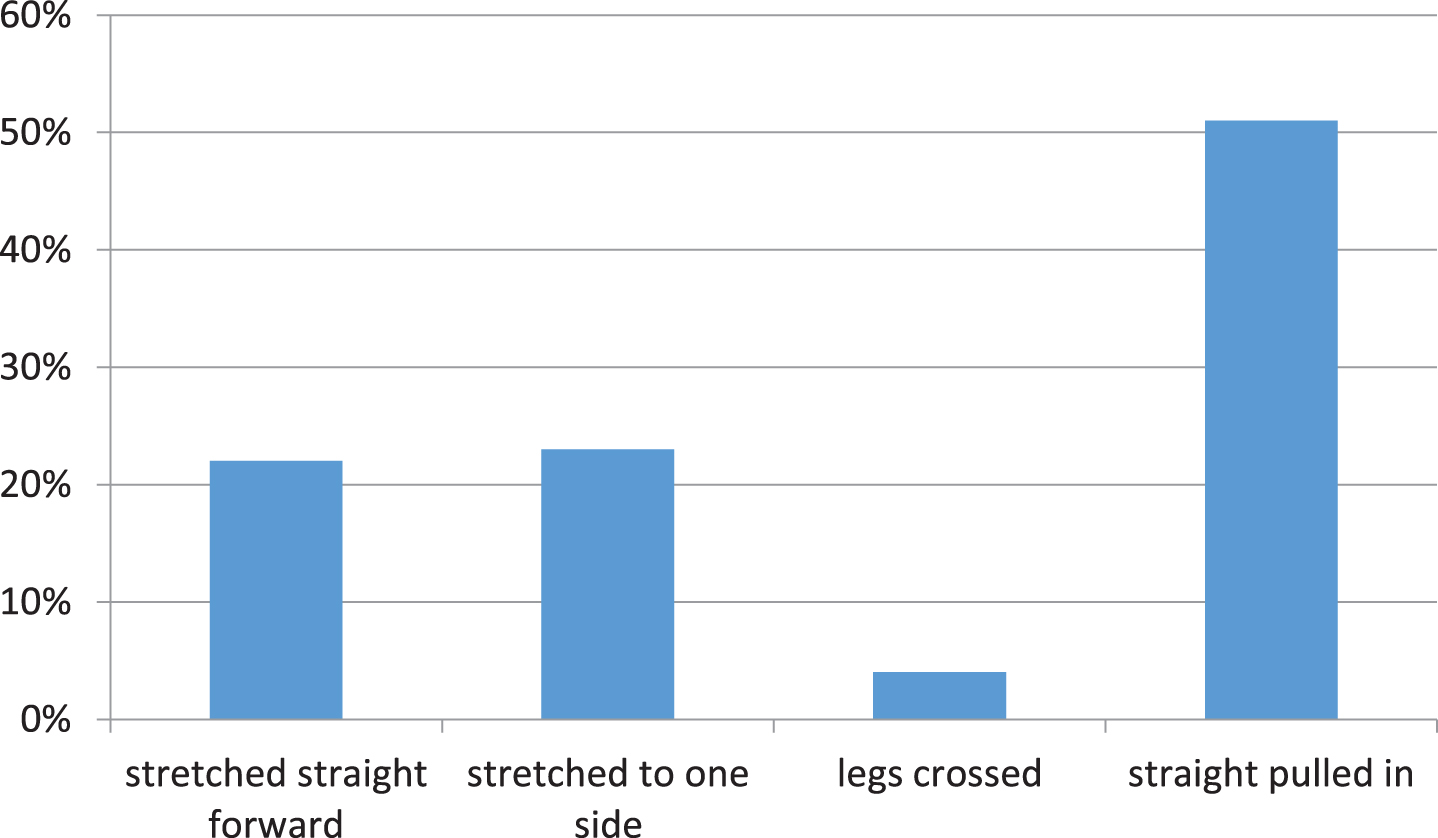
Figure 9 shows the postures found for the different setups. It shows that the 31-inch setup facilitates more variety than the other two, with posture types more evenly distributed. The 29-inch setup showed to be less evenly distributed, and the 27-inch setup is skewed towards the ‘stretched to one side’ and ‘straight / pulled in’ postures. This infers that passengers have enough space to take flexible postures in the 29- and 31-inch setups.
Fig. 9
Frequency of participants observed per leg posture per setup.
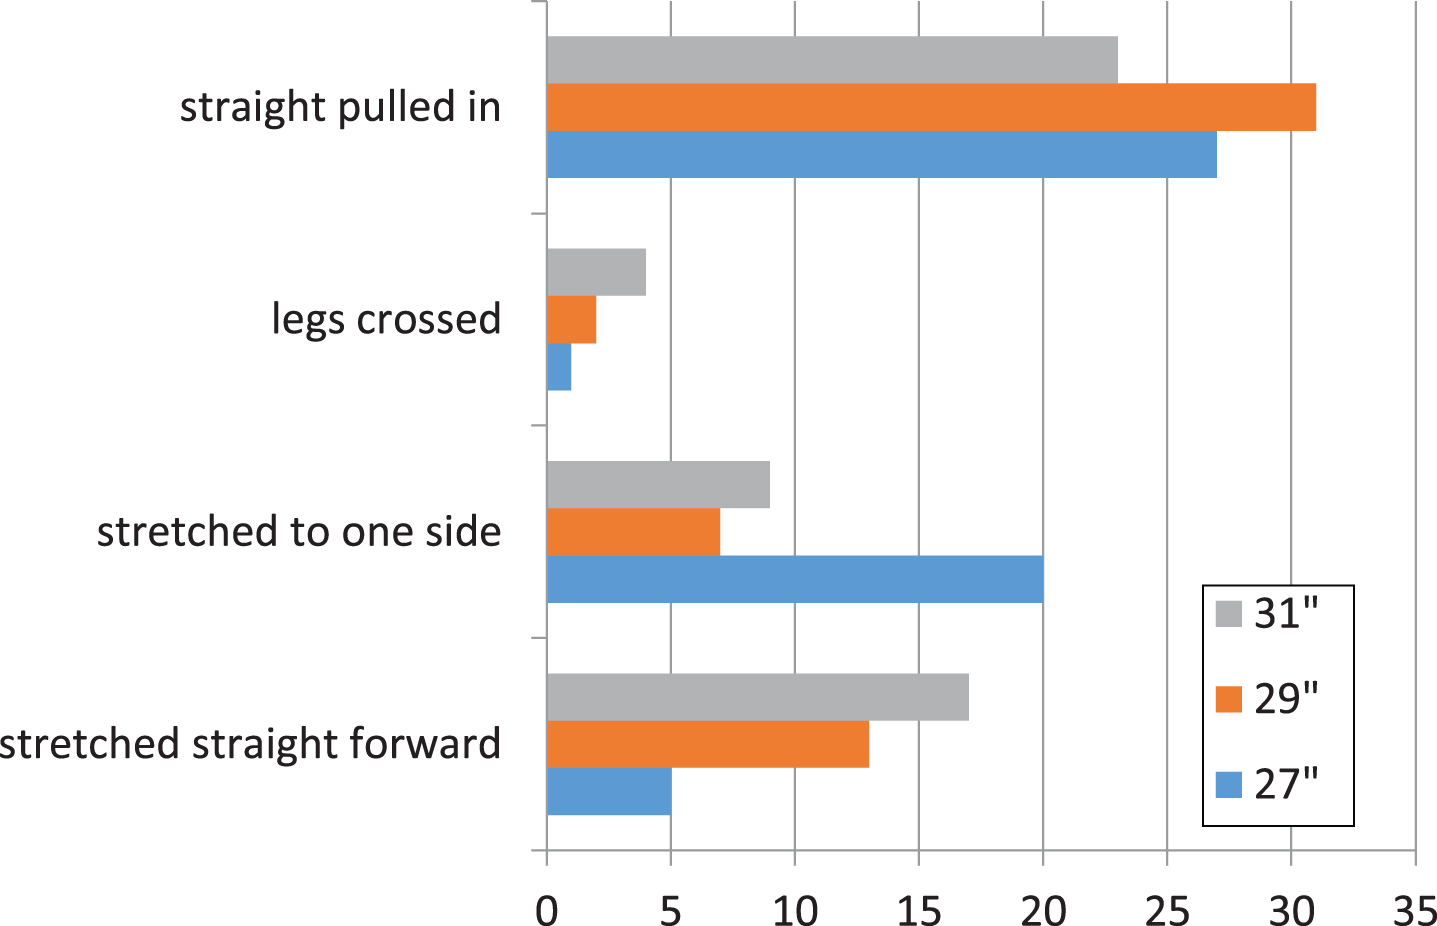
Fig. 10
Average comfort scores on a scale 1–10, as found in this study (left) and by Anjani et al. [4] (right) for different configurations.
![Average comfort scores on a scale 1–10, as found in this study (left) and by Anjani et al. [4] (right) for different configurations.](https://ip.ios.semcs.net:443/media/wor/2021/68-s1/wor-68-s1-wor208014/wor-68-wor208014-g010.jpg)
4Discussion
The responses given by the 53 participants of this study showed that, for this 26-degree staggered configuration, a large pitch resulted in the highest comfort and lowest discomfort, whereas the smallest pitch resulted in the lowest comfort and highest discomfort, which is not surprising. The comfort scores for the 29- and 31-inch setups were acceptable at 7.9 and 6.7 respectively, while the 27-inch setup resulted in an unacceptable score (4.5) which was lower than 5.
With a mean score of 7.9, this study’s 31-inch configuration, with seat width of 17 inches, offers a comparable level of comfort to a 30-inch pitch, 18-inch width conventional configuration, which was shown to result in a mean comfort score of 7.6. This study’s 29-inch configuration, with a mean comfort score of 6.7, is comparable to a conventional configuration of 32-inch pitch, 17-inch seat width, also scores 6.7 [4]. In the study of Anjani et al. [4] it is mentioned that this 6.7 score can be considered on the higher end of today’s economy class cabin layouts.
The proximity of the seat in front of the participant at knee-height and the leg of the seat in front of the participants were the most dominant factors affecting the unacceptable low comfort score for the 27-inch configuration as shown in the questionnaire. These were also mentioned in the discussion after the test. Comparing the minimum hip-to-knee space of the 29-inch configuration (639 mm) with the buttock-knee length (680 mm for p95 male and 640 mm for p95 female [5]), it shows that still a large portion of the population will not fit the smallest section of this configuration. These two factors were mentioned less when the pitch increases. Surprisingly, the opposite was found for the hardness of the seat and the (upright) backrest angle. The larger the pitch, the more frequent these latter two factors were mentioned. This suggests that, at a small pitch, the more severe comfort-affecting factors related to leg space distract from the seat’s unfavourable characteristics. Lewis [6] also found that additional auditory stimuli could distract partly from the auditory discomfort of for instance the sound of a crying baby.
During the experiment, participants could select only the leftmost seats, therefore seat 3 and particularly seat 4 were used less. This means conclusions regarding preferred seats within the row of four cannot decisively be drawn. Furthermore, the questionnaire did not differentiate between left or right armrest, while there was a difference in armrests, which means that the data regarding armrests are also less valuable.
On the other hand, it is clear that the number of complaints regarding seat width and the elbow of the neighbour are low, which makes sense as there is more space for shoulder and elbow in this staggered configuration than in conventional straight configurations, where shoulders are side by side. Torkashvand et al. [7] showed that the middle seat in a conventional configuration is the least preferred seat.
Photo analysis showed that a ‘straight / pulled in’ posture is the most common sitting posture in this staggered configuration. Postures ‘stretched to one side’ and ‘stretched straight forward’ were also seen, the ‘crossed leg’ posture was rare. In the 31-inch setup, the frequency of posture types was more evenly distributed. Skewing towards the ‘stretched to one side’ and ‘straight / pulled in’ postures at smaller pitches, in particular in the 27-inch configuration. Assuming that these postures are the best, if not only, ways for sitting in a small space, the results from the photo analysis and the anthropometric data support the results from the comfort questionnaire in that a pitch of 27 inches in this configuration is not comfortable.
Within the comfort and discomfort literature there are studies that show that discomfort is more related to physical factors and comfort more to other factors like luxury and feeling refreshed (e.g. [8] and [9]). However, this study shows that both factors are influenced by the pitch. In addition, Ahmadpour et al. [10] did not establish differences between comfort and discomfort for an aircraft interior. On the other hand, theoretically the discomfort in our study could be caused by leg room and comfort by change in visual space linked to luxury. This study does not contribute to this discussion. It could be that the short duration of the test did not allow to find the differentiation between comfort and discomfort. Dangal et al. [11] found differences between effects of a seat on comfort and discomfort while sitting for 90 minutes. Therefore, further study is needed with longer durations to show the effect of time in this restricted space. This study only observed young people, the result might differ for elderly with movement limitations. Participants also mentioned the absence of passengers in the front row, which might also effect (dis)comfort in the seat. However, this experiment was useful in deciding not to continue with the 27-inch pitch configuration.
5Conclusion
A 26-degree staggered configuration at a pitch of 27 inches is preferred from a passenger capacity point of view, but it does not offer an acceptable level of comfort in subjective rating, in dimensions and in postures taken. However, it was found that comfort was not frequently restricted in the lateral direction. This implies that the staggered configuration indeed offers benefits for shoulder- and elbow-space. Furthermore, for the 29- and 31-inch configurations, acceptable general comfort scores were found, comparable to higher-end seating layouts. Through the photo analysis, it also proved that in the 29- and 31-inch configurations, passengers have more posture variation, which in itself is preferred. This is expected to allow enough design freedom for further exploration, leaving the 26-degrees staggered configuration still a viable solution to the unconventional Flying-V design, particularly at the smaller pitch of 29 inches. Further studies are needed to see the effect of time, different age groups and additional surrounding passengers on (dis)comfort, as well as to further define the design and details of this staggered seat row.
Conflict of interest
None to report.
References
[1] | International Civil Aviation Organization(ICAO)[icao.int/Pages/default.aspx]. Continued passenger traffic growth and robust air cargo demand in 2017; 2017. Available from: https://www.icao.int/Newsroom/Pages/Continued-passenger-traffic-growth-and-robust-air-cargo-demand-in-2017.aspx. |
[2] | Humm JR , Yoganandan N , Pintar FA , Weese RL , Moorcroft DM , Taylor AM , Peterson B . Responses and injuries to PMHS in side-facing and oblique seats in horizontal longitudinal sled tests per FAA emergency landing conditions. Stapp Car Crash Journal. (2016) ;60: :135–63. |
[3] | DINED. [dined.io.tudlft.nl/en]. 1D Anthropometric database; 2004. Available from: https://www.dined.io.tudelft.nl/en/database/tool. |
[4] | Anjani S , Li W , Ruiter I , Vink P . The effect of aircraft seat pitch on comfort. Accepted in Applied Ergonomics. 2019. |
[5] | Molenbroek JFM , Albin TJ , Goossens RHM , Vink P . 29 years of anthropometric changes among students relevant for seat design. Applied Ergonomics. (2017) ;65: :130–8. |
[6] | Lewis L , Patel H , Cobb S , D’Cruz M , Bues M , Stefani O , Grobler T . Distracting people from sources of discomfort in a simulated aircraft environment. Work. (2016) ;54: :963–79. |
[7] | Torkashvand G , Stephane L , Vink P . Aircraft interior design and satisfaction for different activities: A new approach toward understanding passenger experience. International Journal of Aviation, Aeronautics and Aerospace. (2019) ;6: (2):1–14. |
[8] | Looze MP De , Kuijt-Evers LFM , Dieën JH Van . Sitting comfort and discomfort and the relationships with objective measures. Ergonomics. (2003) ;46: :985–97. |
[9] | Helander MG , Zhang L . Field studies of comfort and discomfort in sitting. Ergonomics. (1997) ;40: (9):895–915. |
[10] | Ahmadpour N , Robert JM , Lindgaard G . Aircraft passenger comfort experience: underlying factors and differentiation from discomfort. Applied Ergonomics. (2016) ;52: :301–8. |
[11] | Dangal S . Implementing spring-foam technology to design a lightweight and comfortable aircraft seat pan. Master thesis, Delft University of Technology, 2019. |


