
PCQ: Preferred Comfort Questionnaires for product design
Abstract
BACKGROUND:
Selecting the most suitable questionnaire(s) in comfort research for product design is always a challenge, even for experienced researchers.
OBJECTIVE:
The objective of this research is to create a list of Preferred Comfort Questionnaires (PCQ) for product design to help researchers in the selection of questionnaires for comfort research.
METHODS:
Fifteen questionnaires that are often used in comfort research for product design were selected as candidate questionnaires. During the Second International Comfort Congress (ICC 2019), 55 researchers and practitioners working in the field of comfort joined together in a workshop to rate these questionnaires individually as well as rank them in groups based on their experience. The criteria of rating and ranking included easiness to answer, easiness for data interpretation, time needed to complete, the need for prior training, as well as mapping the applicable design phases and field of application.
RESULTS:
The elicited responses related to each questionnaire were analyzed. For comfort research in five proposed application fields and four design phases, the preferred questionnaires were highlighted and categorized into four categories: preferred questionnaire, suitable for less prior training, suitable for fast completion and generally applicable, which led to a list of PCQ for product design.
CONCLUSION:
We expect that the PCQ list can be used as a useful instrument to help researchers in selecting questionnaires for comfort research in product design.
1Introduction
The need for comfort is common for all people across different stages of their life [1]. However, comfort is an individual and subjective concept, and it depends on the personal experience and the physiological, physical, mental, emotional and social state of the person over time. This individual and subjective concept of comfort is important in product design. Dimensions of product design, such as the user, the product and the context will interact with each other over time and contribute to the perception of comfort.
Vink and Hallbeck [2] defined comfort as “a pleasant state or relaxed feeling of a human being in reaction to its environment” and discomfort as “an unpleasant state of the human body in reaction to its physical environment”. These definitions clarified the difference between comfort and discomfort, and also highlighted the importance of the subjective aspects of comfort. Therefore, in the evaluation of users’ feeling of comfort/discomfort over time, in addition to objective measures such as posture (changes), pressure distribution of different parts of the body and/or physiological measures, questionnaires have been, and will continue to, be important research instruments.
In the past decades, researchers developed many types of questionnaires, and they were proven to be useful instruments in evaluating the subjective feeling of people in comfort studies applied to diverse fields. Examples of those questionnaires are hand map discomfort [3], CP50 [4], Localised Postural Discomfort (LPD) [5], etc. New application fields continuously emerge and the requirements/constraints are different in each application. Questions such as “What is the cost of each questionnaire regarding time and the effort of the participants?”, “Which one is more suitable for a given design phase?”, “What is the most suitable questionnaire for evaluating the use of a particular product?” often appear in the planning of comfort research. In most cases, the selection of the questionnaire(s) is strongly based on the experience of the researchers.
In the Second International Comfort Congress 2019 (ICC 2019 [6]), comfort researchers and practitioners from around the world joined together in a workshop to create an instrument for questionnaire selection. The outcome of the workshop is the list of Preferred Comfort Questionnaires (PCQ) for product design. It is expected that this list will facilitate researchers in selecting the most suitable questionnaire(s) considering different requirements/constraints in comfort studies, especially at the research planning stage.
In this paper, we describe the selected candidate questionnaires, the setup of the workshop, and the data processing method in the materials and methods section. The workshop results are presented regarding the perceived characteristics of each questionnaire, the preferred application field, and the most appropriate stage of the product design progress. Characteristics and categorizations of the questionnaires and the usage of them are discussed. Finally, based on the synthesis of the results, we propose the list of PCQ for product design.
2Materials and methods
Based on a review of the literature on the topic of comfort in product design, and with the advice of experts on both design research and design applications, 15 candidate questionnaires were identified and used as the basis of the research. Table 1 lists the type of questionnaire and the characteristics of each questionnaire regarding visual representations, number of questions, type of scales, scale range, and statistical/analysis method.
Table 1
Candidate questionnaires and their characteristics
| No. | Name | Visual representation | Number of questions | Type of scales | Scale range | Analysis method |
| 1 | Hand map discomfort [3, 33] | Image | 13 | NRS-fully anchored | 0 (no discomfort) –5 (extreme discomfort) | ANOVA; Spearman; Friedman |
| 2 | Seat elements questionnaire [34] | Text | 11 | NRS-end anchored | 0 (dislike) –9 (like) | Wilcoxon test |
| 3 | CP50 [4] | Text | 1 (2 stages) | Stage 1; GRS; Stage 2: NRS | 0 (very light discomfort)–52 (exceeding very severe discomfort) | Linear = t-test; quadratic = F-test |
| 4 | Localised postural discomfort (LPD) [5] | Image | 19 | NRS-fully anchored | 0 (no discomfort) –10 (extreme discomfort) | Wilcoxon |
| 5 | Green red body map [35] | Image | 22 | Colors (red green) | red=discomfort, green = comfort | |
| 6 | Task specific comfort [32, 36] | Text | 25 | NRS-fully anchored | varies | Pearson |
| 7 | Simple comfort score [37, 38]. | Text | 2 | NRS-end anchored | 0 (no discomfort) –10 (extreme discomfort) and 0 (no comfort) –10 (extreme comfort) | Wilcoxon; t-test |
| 8 | Postural comfort (joint and segments) [39] | Text | 1 | NRS-end anchored | –1 –10 (comfort) | Statistical distribution |
| 9 | Body region discomfort [33] | Image | 12 | NRS-end anchored | 1 (extremely comfortable) –7 (extremely uncomfortable) | |
| 10 | Modified ASHRAE thermal comfort [40, 41] | Text | 14 | NRS-fully anchored | 0 (very hot with excessive discomfort) –3 (neither hot nor cold comfort) –0 (cold with excessive discomfort) | Pearson |
| 11 | Modified SAE for reachability [42] | Text | 1 | VDS | 1 (high) –10 (none) | Correlation index |
| 12 | Modified body region discomfort [43] | Image | 25 | NRS-end anchored | 1 (no discomfort)–10 (extreme discomfort) | T-test |
| 13 | Multi factorial methods –cross modal matching ISO 20882 [44] | Text | 19 | GRS | ||
| 14 | Mansfield’s two-stage method [45, 46] | Image | No. 1 : 5; No. 2 : 1 (2-stages) | No. 1: NRS-fully anchored No. 2: stage 1: GRS; stage 2: NRS | No.1 : 1 (not uncomfortable) –6 (extremely uncomfortable) No. 2 : 0 (no discomfort at all) –>120 absolute maximum | T-test |
| 15 | Auditory comfort [27] | Text | 1 (2-stages) | Stage 1: VDS Stage 2: NRS-end anchored | 0 (not at all) –10 (extremely) |
The use of scales in formulating the questionnaires varies among questionnaires. Some opt for a numeric rating scale (NRS), others chose a graphical rating scale (GRS) or a verbal descriptor scale (VDS) with text. An NRS is defined as a set of numbers and an anchored endpoint, where these anchors serve as reference points for the participants [7]. A GRS is a visual analogue scale (VAS) with verbal anchors positioned on the line. The user can use GRS to report body sensations which is harder to describe by using a basic VAS [8]. VDS is a scale comprising verbal descriptors which have been found to be capable of, for example, capturing the intensity of pain and was preferred by older participants [9]. The scale range also differs among questionnaires. Preston and Colman [10] recommended the use of 7, 9, or 10 response categories for questionnaires, as fewer categories results in lower reliability (stability), internal consistency, validity, discriminating power and respondent’s preference. Moreover, the reliability also decreases for scales using more than more than 10 categories. Researchers may consider the target group especially the context, the grading system and the mother language when specifying the type and range of scales of the questionnaire.
Most of the candidate questionnaires are 1-stage questionnaires except Questionnaire 3 (CP50), 14 (Mansfield’s two-stage method) and 15 (Auditory comfort), which have two stages and the first question is often used as a priming question. Tulving and Schacter [11] defined priming as a “nonconscious form of human memory, which is concerned with perceptual identification of words and objects and which has only recently been recognized as separate from other forms of memory or memory systems.” The priming effect increases the accessibility of the information relevant to the question [12], and therefore influences the choice of response alternatives for the upcoming question [13]. Questions with priming attempt to steer the cognitive processes prior to the main question in an attempt to improve repeatability, and to minimize the cognitive processing needed to answer it [13].
Fifty-five participants of ICC 2019 conference joined the workshop and they were randomly assigned to one of 3 studios. For each studio, participants were clustered into 3 or 4 groups with 5 or 6 members, depending on the actual number of participants. The workshop was executed in two phases: an individual evaluation phase and a group discussion phase, each approximately 40 minutes long. In the individual evaluation phase, each group divided 15 questionnaires among the group members, so each participant analyzed 3 questionnaires regarding 1) Experience with the questionnaire, 2) Easiness to answer, 3) Easiness for data interpretation, 4) Estimate of the time needed to complete the questionnaire, 5) In which stage of experimental study the questionnaire is recommended, 6) The need for participant training prior to the experiment, and 7) Which design phase the questionnaire belongs to. Participants were also able to add extra comments and they were encouraged to propose relevant questionnaires that were not in the list.
After the individual phase, participants discussed with their group the preferred questionnaire(s) regarding design phases and different application fields. The design phases included: 1) Early design phase; 2) Studying prototypes; 3) Comparing two products/prototypes; and 4) Evaluating the final product; and the application fields were: 1) Hand tool and handle; 2) Feet/leg study; 3) Seat study; 4) Total environment and 5) All sorts of products.
165 individual responses were collected; one record was excluded due to incorrect labelling of a candidate questionnaire. Eleven group responses were collected. In the processing of individual responses, the experience of the participant was used as a weight factor of the scores, i.e. for a given item, its score was normalized as
where k is the index of items and n is the number of participants. For experiencek, it was set as 3 for participants who used it before, 2 for participants who knew it and 1 for participants who had no experience with it. All weighted scores are then normalized between 0 and 1 using the MinMaxScaler [14] except two items: “Time to complete questionnaire?” and “Is training prior to the experiment required?”, as the answers to those questions were the estimation of a time scale and Boolean values, respectively.
For the individual phase, each participant was given a printed booklet with all 15 questionnaires and another booklet to complete the survey of the assigned questionnaire and to suggest other recommended questionnaires. The usage context and references were included in the description accompanying each questionnaire. Participants were also supplied with the full reference in a link provided for the workshop. During the group phase, a sheet with a blank table was provided and groups were instructed write the index of top 3 questionnaires regarding the suitable design phases in different application fields.
The collected data was digitalized and where necessary, two researchers discussed the answers to avoid misinterpretation of the handwriting. Two researchers independently analysed the data using different tools, i.e. Microsoft Excel and a self-developed Python program. A Pearson correlation using SPSS version 25 was conducted to identify possible correlation between “Easiness for data interpretation” and “The time needed for finishing the questionnaire”. After finishing the individual analysis, two researchers compared the results against each other and in the case of discrepancy between the intermediate results, e.g. a bug in the code, they analyzed and understood the differences and were able to reach a consensus.
3Results
3.1Experience of participants
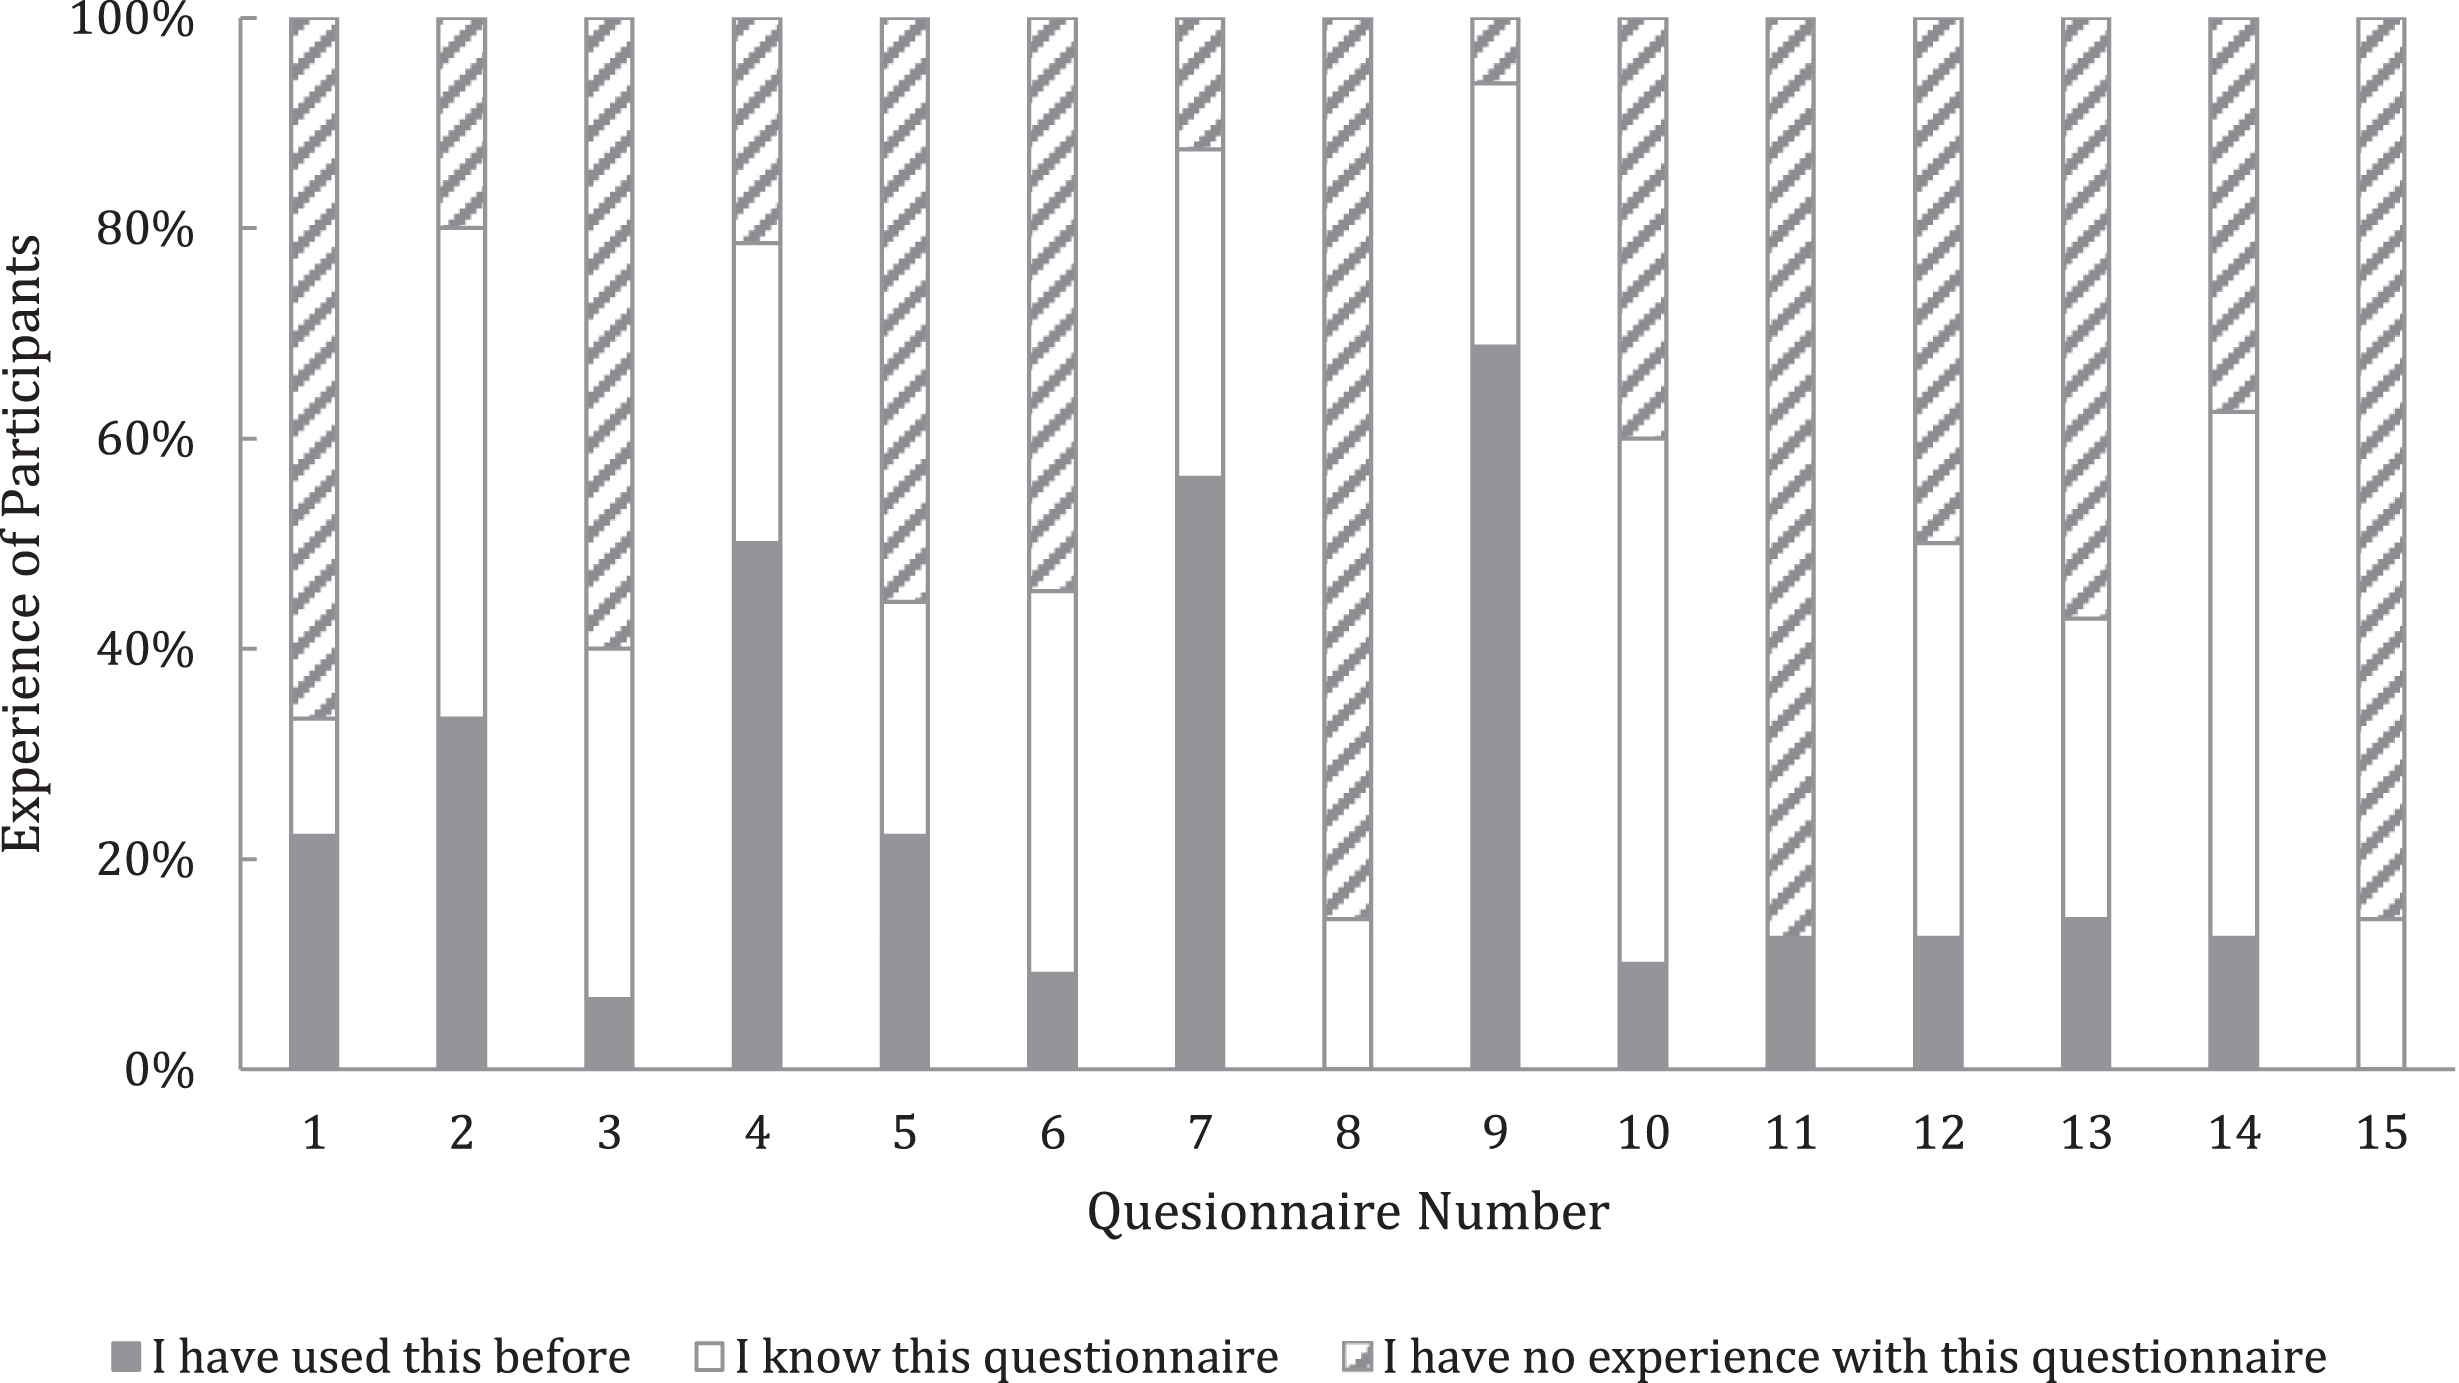
The participants of this study were already working in the field of comfort research and application, so most of them knew some of the questionnaires well. For instance, most participants assigned to Questionnaire 9 knew the questionnaire and the majority had used this before. An exception was Questionnaire 8 and 15, which no participants had experience though some participants knew of it (Fig. 1).
Fig. 1
Experience of participants in using the questionnaires.
3.2Usage of questionnaires
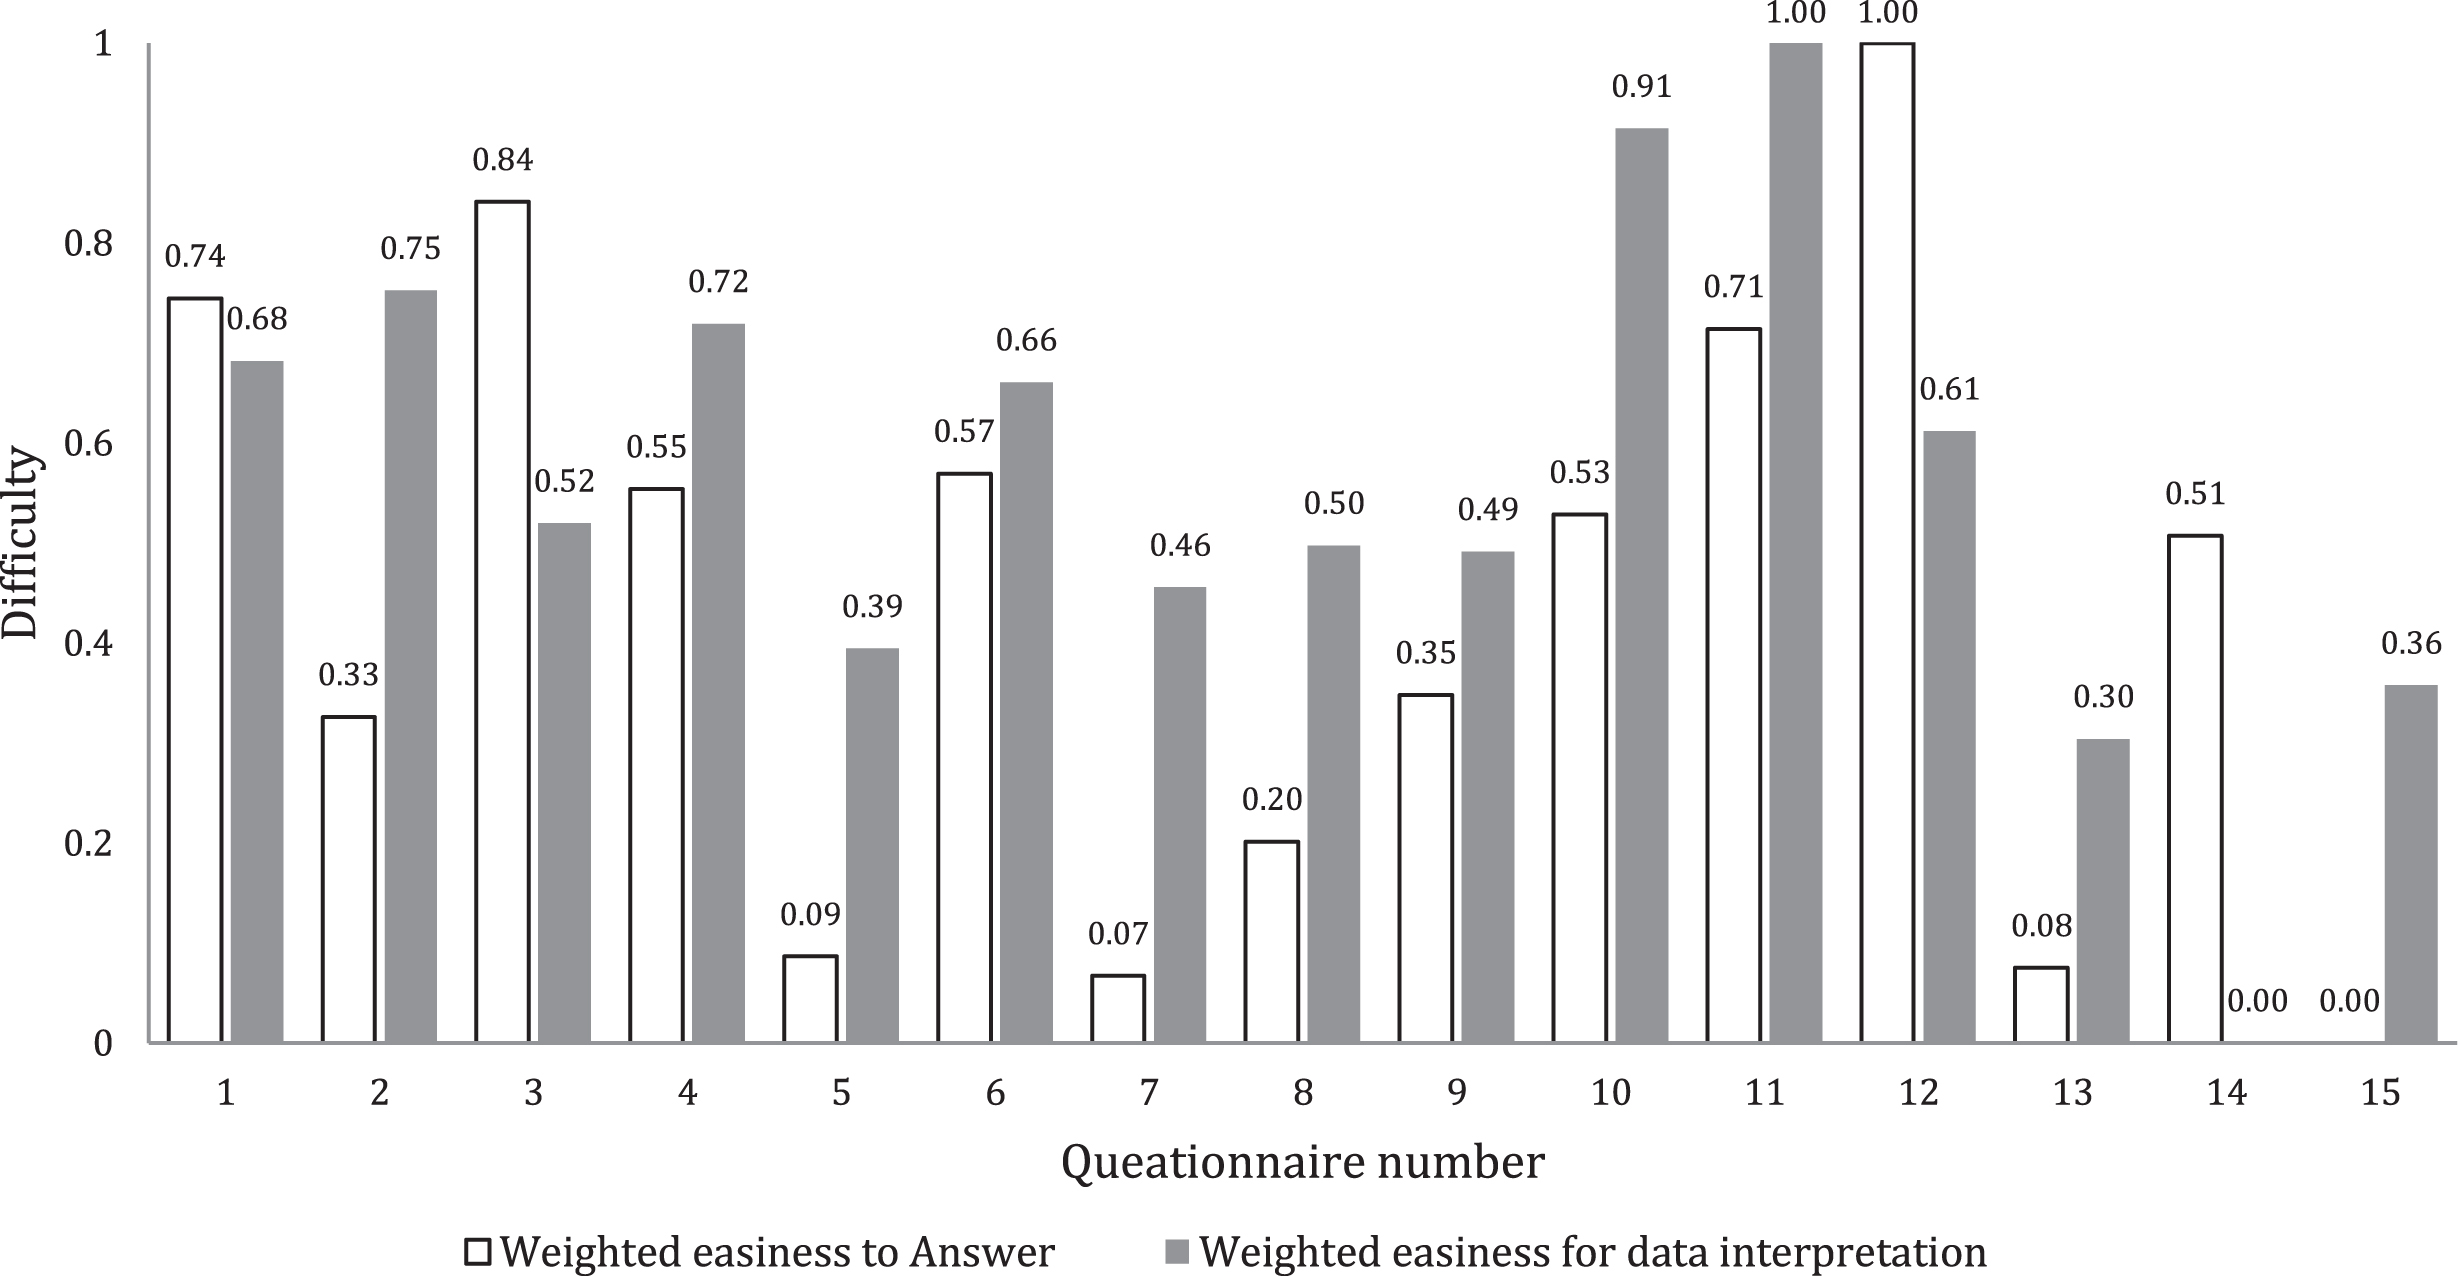
Considering the results of “Easiness to answer” and “Easiness for data interpretation” questions it was found that Questionnaire 5, 7, 8, 13 and 15 were among the easiest questionnaires to be answered where Questionnaire 3 and 12 were relatively difficult (Fig. 2). Participants of the workshop also indicated that Questionnaire 14 was easy to interpret where Questionnaire 10 and 11 were relatively difficult.
Fig. 2
Individual evaluation of questionnaires regarding easiness of answer and easiness of interpretation.
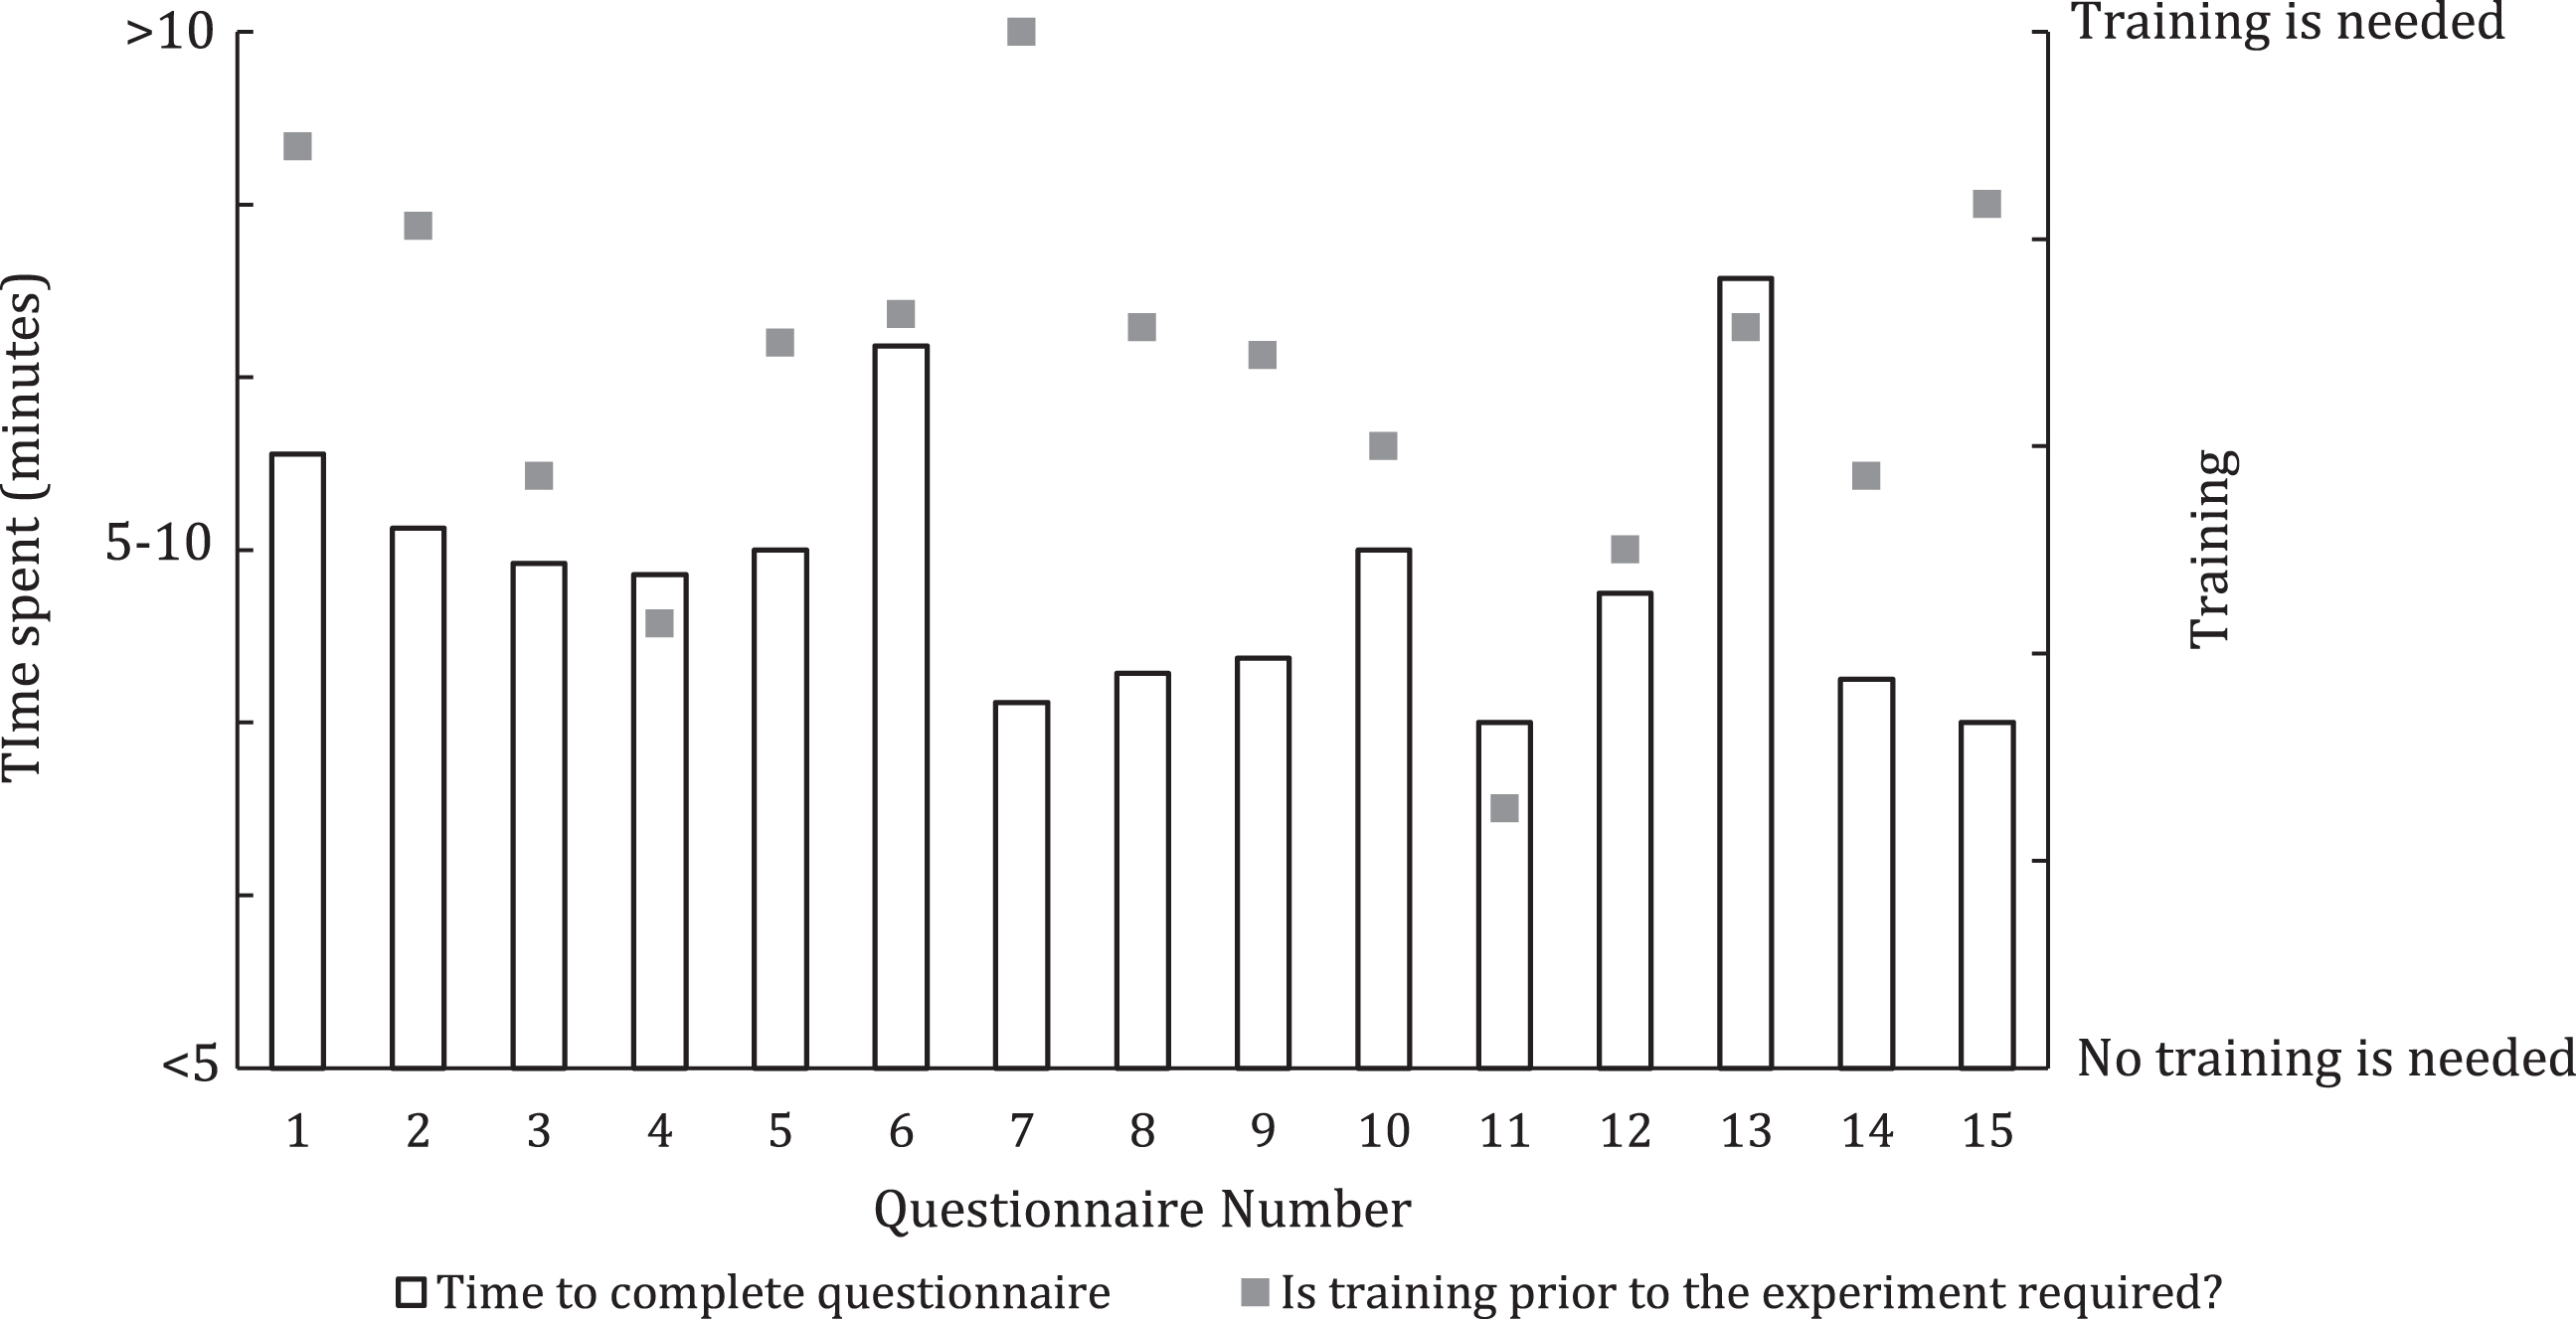
Considering the results of “The time needed for completing the questionnaire” and “Is prior training needed?” questions it was found that Questionnaire 7, 11, 14 and 15 required less completion time than others (Fig. 3). On the contrary, Questionnaire 1, 6 and 13 took more time. Regarding the question “Is prior training needed?”, participants strongly suggested that prior training was needed for Questionnaire 1, 2, 7 and 15, but less for Questionnaire 4, 11 and 12.
Fig. 3
Individual evaluation of questionnaires regarding needed time and training.
3.3Application fields in product design
The questionnaires that were preferred by the groups showed variation across different design stages and different application fields (Table 2). In Table 2, if a questionnaire was recommended by more than 50% of the participating groups, it is highlighted. It can be observed that: 1) For the ‘hand tool and handle’, ‘seat study’, and ‘total environment’, the participating groups’ recommendations converged towards one or two questionnaires; 2) the recommendations were relatively diverse and showed less consensus regarding the ‘feet/leg study’.
Table 2
Results of the choice of groups regarding different design stages and different applications (shaded = > 50%)
| Phase | Rank | Hand tool and handle | Feet/leg study | Seat study | Total environment | All products | |||||
| Questionnaire no. | Percentage | Questionnaire no. | Percentage | Questionnaire no. | Percentage | Questionnaire no. | Percentage | Questionnaire no. | Percentage | ||
| Early design phase | 1 | 1 | 36% | 8 | 45% | 2 | 55% | 7, 15 | 45% | 7 | 55% |
| 2 | 7, 8, 11 | 18% | 1 | 18% | 6 | 27% | 13 | 36% | 3, 5, 15 | 18% | |
| 3 | 5, 13, 14 | 9% | 2, 3, 4, 5, 6, 7, 11, 14 | 9% | 3, 4, 5, 7, 14 | 18% | 2 | 18% | 2, 4, 6 | 9% | |
| Studying prototypes | 1 | 1 | 82% | 9 | 27% | 2 | 64% | 13 | 64% | 3 | 64% |
| 2 | 8, 11 | 18% | 3, 4, 10, 14 | 18% | 9 | 55% | 3, 7, 10, 15 | 36% | 7, 9 | 36% | |
| 3 | 2, 3, 6, 10, 13, 14 | 9% | 1, 2, 6, 8 | 9% | 14 | 45% | 4, 6 | 18% | 5, 10 | 18% | |
| Comparing two products | 1 | 1 | 82% | 8, 9 | 27% | 2, 14 | 64% | 13 | 64% | 3 | 45% |
| 2 | 3 | 18% | 2, 3, 4, 6, 14 | 18% | 9 | 55% | 3, 7 | 36% | 7, 9 | 36% | |
| 3 | 2, 4, 5, 7, 8, 9. 10, 11, 14 | 9% | 5, 10 | 9% | 6 | 45% | 10, 15 | 27% | 5, 6 | 27% | |
| Evaluating an end product | 1 | 1 | 82% | 3 | 36% | 2, 14 | 55% | 13 | 64% | 7 | 55% |
| 2 | 3, 6, 11 | 18% | 9 | 27% | 9 | 45% | 7 | 45% | 3 | 45% | |
| 3 | 2, 4, 7, 9, 10, 14 | 9% | 4, 5, 6, 14 | 18% | 3, 6 | 36% | 3, 10, 15 | 27% | 9, 10 | 27% | |
3.4Other recommendations
Besides the selected 15 candidate questionnaires, participants also recommended other questionnaires which might be useful for comfort research. They are: 1) Shoe microclimate evaluation questionnaire [15]; 2) Situation awareness global assessment technique (SAGAT) [16]; 3) Methodologies for subjective evaluations of indoor environment in ISO 15251 [17]; 4) The scale used in ESI virtual seat solutions (PAM comfort) [18]; 5) the Kano model [19] and 6) Multifactorial assessment of comfort of clothing [20]. It is noted that whilst these questionnaires may be very useful for their targeted applications, they are difficult to apply outside of their application area focus.
4Discussion
4.1Validity of the study
Fifty-five participants joined the workshop, each of whom were working in the field of comfort research or application; expertise of the participants can be reflected in that at least one person knew each questionnaire (Fig. 1), despite the fact that the questionnaires were randomly assigned to each participant. Previous studies tried to compare the objectivity between questionnaires without the use of experts [4, 21], however, Olson [22] found that experts can better predict questions with data quality problems and questions leading to inaccurate reporting compared to a computerized question evaluation tool. Research has also indicated that people with similar backgrounds would rate the face validity similarly [23], expert judgement could also determine the face validity which makes sure that a test would be not only be valid but also appear valid [24]. Therefore, the 55 experts’ opinions can be used as a quality assurance of the outcomes of this study.
4.2Characteristics of questionnaires
Characteristics of a questionnaire may influence its deployment in comfort studies. For instance, if a questionnaire takes a long time to complete, it may be not suitable for comfort studies on the development of comfort/discomfort over time where it needs to be applied multiple times. Training users might also be a problem for large scale studies, e.g. in an experiment of studying comfort of a product based on visitors in an exhibition, prior training of the participants can be difficult.
Based on the results, it was found that regarding general comfort, Questionnaire 7 Simple comfort score was easy to answer and takes less time to complete for participants with prior training. Therefore, it is suitable for studying comfort over time in a controlled experiment where prior training can be deployed. Questionnaire 5 Green red body map and Questionnaire 15 Auditory comfort have similar characters; however, they will take a bit more time to complete as the number of questions is more. Questionnaire 4 LPD was highlighted as being relatively easy to answer and that little prior training is needed, this makes it suitable for large scale on-site experiments where the participants can just “walk-in” for the experiment.
Statistics show that “The time needed for finishing the questionnaire” was significantly correlated (p =.006) with the number of questions of each questionnaire, but has no statistically significant correlations with “Easiness to answer”. This shows that respondents would need more processing time to answer many questions, even for questions with low difficulty level.
4.3Design phases and application fields
Generally, the narrower the application fields are, the more specific the recommended questionnaires are. For instance, Questionnaire 1 Hand map discomfort was strongly recommended for application field Hand tool and handle. However, it was found that for application fields All sorts of products, the recommendations of all groups converged towards several candidate questionnaires (3 and 7 in this case). This indicates that Questionnaire 3 CP50 and 7 Simple comfort score are “universal” questionnaires and it can always be a (secondary) choice for different types of comfort studies.
Regarding different design phases, participants found fewer questionnaires were suitable for Early design phases where Questionnaire 7 was strongly recommended as an instrument to get a holistic view of comfort, though the coefficient of variation was larger showing the participants’ opinions differ more. For the remaining design phases, the number of recommended questionnaires were more and the opinions converge more, which were represented by smaller coefficients of variation. Participants suggested that during the study of the prototype and while comparing two products, more detailed examination of comfort was needed, therefore Questionnaires 3, 4, 5 and 6 were often recommended. However, in the final examination of products, Questionnaire 7 Simple comfort score was recommended again to obtain a holistic view of comfort. This holistic view –detail examination –holistic view approach is in accordance with the diverging-converging product design process [25].
4.4Language of questionnaires
Language and its comprehension are important factors to consider during questionnaire design in order to minimize queries, unanswered questions and misinterpretations to resolve [26]. All questionnaires discussed in this study were in English or had been previously translated to English, for example the Modified Body Region Discomfort questionnaire was originally developed in German and Postural Comfort questionnaire was originally in Italian. This translation could cause a different understanding, as people from different regions consider the same word at different levels of strength, e.g. Fields et al. [27] compared wording in three English speaking countries (Australia, USA and UK) and they concluded that the perceived intensity of some words vary with region of domicile. The participants of this workshop came from all over the world too, which could have resulted in different understanding, though none of the participants reported a misunderstanding of the questionnaires provided in the workshop. Greco [28] recommended that the translation is best done by someone well aware of the intent of each question, moreover, the results could then be check by using expert evaluators to evaluate its content, meaning, clarity of expression and comparability to the original item; back-translation; and/or cross-language equivalence.
4.5Scales used in questionnaires
The selection of scale for each question should also be considered by researchers. Annett [29] mentioned that subjective rating scales used in questionnaires are based on the assumption that the human participant normally responds quantitatively to variations in the specified sensory attribute of the stimulus object or situation, therefore the design of these subjective rating scales in the field of comfort varies in terms of the stimuli that the content of the questions may trigger. Cameron [30] conceptualized the tradeoffs between ease of use and precision of measurement in work-related body-part comfort questionnaires. This study shows that binary yes/no options and scales with verbal categories are easy to use with a lower precision, while numerical scales (e.g. CR-10) is harder for participants, but with a higher precision. In this study, it was also found that Questionnaire 5 which uses the binary scale and Questionnaire 15 which utilizes the verbal scale are the easiest two. On the other hand, Questionnaire 7 which uses a CR-10 also was also rated as an easy to answer questionnaire.
Most comfort questionnaires utilize standard scales or variations thereof e.g. Likert (Questionnaire 2 and 7), Borg (Questionnaire 4, 7 and 14), ISO (Questionnaire 2, 10, 13 and 14) and SAE (Questionnaire 11). Questionnaire 4 and 7 opt for the Borg CR-10 scale, Questionnaire 14 uses the Borg CR-100 scale. The effectiveness and efficiency of the used scales have been discussed in the literature, e.g. Fields et al. [27] compared different options of scales for auditory comfort and they opted a 5-point verbal scale and a 0-to-10 numerical scale for Questionnaire 15. Scales in CP-50 were also selected based on a comparison with the Borg CR-10 scale, the Corlett discomfort scale, an 8-point ordinal scale, a modified intensity and discomfort scale, and a 21-point ratio regarding the overall reliability and validity for pressure intensity and discomfort ratings [4].
While most questionnaires opt for an NRS which has quantifiable numbers to describe the sense of comfort, Questionnaire 1, 4, 9, 12 and 14 used an image to show the locations of the body part for specifying the location of the stimuli. On the other hand, questionnaires which are not directly linked to specific parts of the body e.g. Questionnaire 2, 3, 6, 7, 10 and 15 chose to use a textual representation paired with an NRS. Another aspect to consider when choosing a scale is the topic and characteristic of respondents. When the topic is relevant to the respondents’ context, providing more points may improve the accuracy, but it will cost more time of the users due to the needs of more detailed judgement [31]. On the other hand, having enough points to show the sensitivity of the data is also important, e.g. Questionnaire 6 mostly used a 6-point scale, whilst the author debated whether this scale was long enough to capture the results [32].
4.6Limitations
This research analyzed discussion and comparison of different types of comfort questionnaires in a workshop using a limited number of participants. The questionnaires included were identified by literature study and recommended by experts in the field. Besides other questionnaires recommended by participants, which will be further investigated, there is still a small chance that some alternative questionnaires are still missing. In the future, new questionnaires may come up and the PCQ would need to be updated.
During the workshop, it was found that in the pre-prepared document, Questionnaire 3 had an incorrect image, and Questionnaire 7 had an image of the updated questionnaire instead of the original version. Though most participants reported and corrected the mistake during the workshop based on their own expertise, this might lead to different understanding of the participants in the individual evaluation.
5PCQ for product design
Based on the outcomes of the workshop and discussion, we identified the following list of PCQ for product design for different application fields regarding different design phases (Table 3). In the Table, beside the preferred questionnaires, we also recommend 1) a set of questionnaires for large scale experiments where training cannot be provided to the participants; 2) a set of questionnaires for fast completion, where in the experiment, the completion time is a constraint; and 3) a set of questionnaires which can be helpful for this particular application field in the specified design phases.
Table 3
PCQ for product design
| Hand tool and handle | Feet/leg study | Seat study | Total environment | All sorts of products | ||
| Early design phase | Preferred | 1 | 8 | 2 | 7, 15 | 7 |
| Less prior training | 11 | 3, 4, 11 | 3, 4 | N/A | 3, 4 | |
| Fast completion | 7, 8, 11, 14 | 8, 7, 11, 14 | 7, 14 | 7, 15 | 7, 15 | |
| Generally applicable | 5, 13 | 1, 2, 5, 6 | 5, 6 | 2, 13 | 2, 5, 6 | |
| Studying prototypes | Preferred | 1 | 9 | 2, 9 | 13 | 3 |
| Less prior training | 3 | 3, 4, 11 | 14 | 3, 4 | 3 | |
| Fast completion | 8, 11, 14 | 8, 14 | 9 | 7, 15 | 7, 9 | |
| Generally applicable | 2, 6, 10, 13 | 1, 2, 6, 10 | N/A | 6, 10 | 5, 10 | |
| Comparing two products | Preferred | 1 | 8, 9 | 2, 14, 9 | 13 | 3 |
| Less prior training | 3, 4 | 3, 4 | N/A | 3 | 3 | |
| Fast completion | 7, 8, 9, 11, 14 | 8, 14 | 9, 14 | 7, 15 | 7, 9 | |
| Generally applicable | 2, 5, 10 | 1, 2, 6, 5, 10 | 6 | N/A | 5, 6 | |
| Evaluating an end product | Preferred | 1 | 3 | 2, 14 | 13 | 7 |
| Less prior training | 3, 4, | 3, 4 | 3 | 3, 15 | 3 | |
| Fast completion | 7, 9, 14 | 9, 14 | 9, 14 | 7 | 7 | |
| Generally applicable | 2, 6, 11, 10 | 5, 6 | 6 | 10 | 9, 10 |
6Conclusion
Selecting proper questionnaires for investigating the comfort of users can be a challenging task, even for experienced researchers and practitioners. In this research, we propose a list of PCQ for product design regarding different design phases and application fields, and we expect it can be used as an instrument to help researchers in selecting questionnaires in comfort research. Meanwhile, based on the feedback of the researchers and new research outcomes, we will continue consolidating this list for a better recommendation for researchers in the field of designing for comfort.
This research is partly funded by EU Horizon 2020 CleanSky COMFDEMO (COMFort in the cabin DEMOnstrator) project under grant agreement 831992. The authors of this paper also want to thank Lembaga Pengelola Dana Pendidikan Republik Indonesia (Indonesian Endowment Fund for Education) for funding the PhD work of Shabila Anjani and express their gratitude and appreciation to all participants of the Second International Comfort Congress 2019 (ICC2019) for their contributions.
Conflict of interest
None to report.
Acknowledgments
References
[1] | Melo GAA , Silva RA , Pereira FGF , Caetano JÁ . Cultural adaptation and reliability of the General Comfort Questionnaire for chronic renal patients in Brazil. Rev Lat Am Enfermagem. (2017) ;25: :e2963. |
[2] | Vink P , Hallbeck S . Editorial: Comfort and discomfort studies demonstrate the need for a new model. Appl Ergon [Internet]. (2012) ;43: (2):271–6. Available from: http://www.sciencedirect.com/science/article/pii/S0003687011000743 |
[3] | Dianat I , Nedaei M , Mostashar Nezami MA . The effects of tool handle shape on hand performance, usability and discomfort using masons’ trowels. Int J Ind Ergon.. (2015) ;45: :13–20. |
[4] | Shen W , Parsons KC . Validity and reliability of rating scales for seated pressure discomfort. Int J Ind Ergon [Internet]. (1997) ;20: (6):441–61. Available from: http://www.sciencedirect.com/science/article/pii/S0169814196000686 |
[5] | Grinten M van der , Smitt P . Development of a practical method for measuring body part discomfort. In: Kumar S, editor. Advances in Industrial Ergonomics and Safety IV. Taylor & Francis, London; 1992. pp. 311-318. |
[6] | Vink P , Naddeo A , Frohriep S , Mansfield N . The Second International Conference on Comfort. In: Vink P, Naddeo A, Frohriep S, Mansfield N, editors. Proceeding of the Second International Conference on Comfort. Aug.29-30, Delft: Delft University of Technology; 2019. |
[7] | WallenNE, FraenkelJR. Educational Research: A Guide to the Process [Internet]. 2nd Ed. Educational Research. New York: Routledge; 2013. Available from: https://www.taylorfrancis.com/books/9781410601001 |
[8] | Heft MW , Parker SR . An experimental basis for revising the graphic rating scale for pain. Pain [Internet]. (1984) ;19: (2):153–61. Available from: http://www.sciencedirect.com/science/article/pii/0304395984908352 |
[9] | Jones KR , Vojir CP , Hutt E , Fink R . Determining mild, moderate, and severe pain equivalency across pain-intensity tools in nursing home residents. J Rehabil Res Dev [Internet]. (2007) ;44: (2):305. Available from: http://www.rehab.research.va.gov/jour/07/44/2/pdf/jones.pdf |
[10] | Preston CC , Colman AM . Optimal number of response categories in rating scales: reliability, validity, discriminating power, and respondent preferences. Acta Psychol (Amst) [Internet]. (2000) ;104: (1):1–15. Available from: https://linkinghub.elsevier.com/retrieve/pii/S0001691899000505 |
[11] | Tulving E , Schacter D . Priming and human memory systems. Science (80-) [Internet]. (1990) ;247: (4940):301–6.Available from: https://www.sciencemag.org/lookup/doi/10.1126/science.2296719 |
[12] | Strack F , Martin LL , Schwarz N . Priming and communication: Social determinants of information use in judgments of life satisfaction. Eur J Soc Psychol [Internet]. (1988) ;18: (5):429–42. Available from: http://doi.wiley.com/10.1002/ejsp.2420180505 |
[13] | Jenkins CR , Dillman DA . Survey Measurement and Process Quality. In: Lyberg L, Biemer P, Collins M, DeLeeuw E, Dippo C, Schwarz N, et al., editors. New York: Wiley-Interscience; 1995. |
[14] | Scikit-learn. MinMaxScaler [Internet]. 2015. Available from: https://scikit-learn.org/stable/modules/generated/sklearn.preprocessing.MinMaxScaler.html |
[15] | West AM , Schönfisch D , Picard A , Tarrier J , Hodder S , Havenith G . Shoe microclimate: An objective characterisation and subjective evaluation. Appl Ergon [Internet]. (2019) ;78: :1–12. Available from: https://linkinghub.elsevier.com/retrieve/pii/S0003687019300171 |
[16] | EndsleyMR. Situation awareness in dynamic human decision-making: Theory and measurement. ProQuest Diss Theses. University of Southern California; 1990. |
[17] | BSI. EN 15251 Ventilation standard [Internet]. 2006. Available from: http://www.sysecol2.ethz.ch/OptiControl/LiteratureOC/CEN_06_prEN_15251_FinalDraft.pdf |
[18] | ESI. Virtual Seat Solution [Internet]. [cited 2019 Dec 9]. Available from: https://www.esi-group.com/software-solutions/virtual-performance/virtual-seat-solution |
[19] | Kano N , Seraku N , Takahashi F , Tsuji S . Attractive Quality and Must-Be Quality. J Japanese Soc Qual Control. (1984) ;41: :39–48. |
[20] | Raccuglia M , Heyde C , Havenith G , Hodder S . Comfort in clothing – Determining the critical factors. In: 1st Int Comf Congr. 2017. pp. (Comfort in clothing):5. |
[21] | Hjermstad MJ , Fayers PM , Haugen DF , Caraceni A , Hanks GW , Loge JH , et al. Studies Comparing Numerical Rating Scales, Verbal Rating Scales, and Visual Analogue Scales for Assessment of Pain Intensity in Adults: A Systematic Literature Review. J Pain Symptom Manage.. (2011) ;41: (6):1073–93. |
[22] | Olson K . An Examination of Questionnaire Evaluation by Expert Reviewers. Field methods [Internet]. (2010) ;22: (4):295–318. Available from: http://journals.sagepub.com/doi/10.1177/1525822X10379795 |
[23] | Nevo B . Face Validity Revisited. J Educ Meas [Internet]. (1985) ;22: (4):287–93. Available from: http://www.jstor.org/stable/1434704 |
[24] | Mosier CL . A critical examination of the concepts of face validity. Educ Psychol Meas. (1947) ;7: :191–206. |
[25] | Buijs J . The Delft Innovation Method: A Design Thinker’s Guide to Innovation. 2012. pp. 120. |
[26] | Wright P , Barnard P . ‘Just fill in this form’ —a review for designers. Appl Ergon [Internet]. (1975) ;6: (4):213–20. Available from: https://linkinghub.elsevier.com/retrieve/pii/0003687075901131 |
[27] | Fields JM , De Jong RG , Gjestland T , Flindell IH , Job RFS , Kurra S , et al. Standardized General-Purpose Noise Reaction Questions for Community Noise Surveys: Research and a Recommendation. J Sound Vib [Internet]. (2001) ;242: (4):641–79. Available from: https://linkinghub.elsevier.com/retrieve/pii/S0022460X00933844 |
[28] | Greco L Del , Walop W , Eastridge L . Questionnaire development: 3. Translation. CMAJ. 1987;136. |
[29] | Annett J . Subjective rating scales: science or art? Ergo-nomics. (2002) ;45: (14):966–87. |
[30] | Cameron JA . Assessing work-related body-part discomfort: Current strategies and a behaviorally oriented assessment tool. Int J Ind Ergon [Internet]. (1996) ;18: (5-6):389–98. Available from: https://linkinghub.elsevier.com/retrieve/pii/0169814195001018 |
[31] | Joshi A , Kale S , Chandel S , Pal D . Likert Scale: Explored and Explained. Br J Appl Sci Technol [Internet]. (2015) ;7: (4):396–403. Available from: http://www.sciencedomain.org/abstract.php?iid=773&id=5&aid=8206 |
[32] | Groenensteijn L . Seat design in the context of knowledge work. Delft; 2014. pp. 197. |
[33] | Corlett EN , Bishop RP . A technique for assessing postural discomfort. Ergonomics. (1976) ;19: (2):175–82. |
[34] | Van Veen S , Orlinskiy V , Franz M , Vink P . Investigating Car Passenger Well-Being Related to a Seat Imposing Continuous Posture Variation. J Ergon. (2015) ;05: (03). |
[35] | Hiemstra-van Mastrigt S . Comfortable Passengers Seats. Recommendation for design and Research. 2015. pp. 307. |
[36] | Ellegast RP , Keller K , Hamburger R , Berger H , Krause F , Groenesteijn L , et al. Ergonomische Untersuchung besonderer Büroarbeitsstühle (BGIA-Report 5/2008). 2008. |
[37] | Vink P , Bazley C , Kamp I , Blok M . Possibilities to improve the aircraft interior comfort experience. Appl Ergon. (2012) ;43: (2):354–9. |
[38] | De Lille C , Bouwens JM , Santema S , Schultheis U , Vink P . Designing the cabin interior knowing high and low peaks in a passenger flight. AEGATS 2016. Paris, France; 2016. |
[39] | Naddeo A , Cappetti N , D’Oria C . Proposal of a new quantitative method for postural comfort evaluation. Int J Ind Ergon. (2015) ;48: :25–35. |
[40] | American Society of Heating, Refrigerating and Air-conditioning I. Proposed Standard 189.1P, Standard for the Design of High-Performance Green Buildings Except Low-Rise Residential Buildings. Draft ASHRAE Stand. 2009;Third Publ:1-185. |
[41] | Califano R , Naddeo A , Vink P . The effect of human-mattress interface’s temperature on perceived thermal comfort. Appl Ergon. (2017) ;58: :334–41. |
[42] | Naddeo A , Cappetti N , Ippolito O . Dashboard reachability and usability tests: A cheap and effective method for drivers’ comfort rating. SAE Tech Pap. (2014) ;1: (December):7–9. |
[43] | Hartung J , Mergl C , Bubb H . Reliability of pressure measurement on car seats. SAE Tech Pap. 2004;(July). |
[44] | ISO. ISO 28802. Vol. 28802. 2012. |
[45] | Mansfield N , Sammonds G , Darwazeh N , Massoud S , Patel T , Sehdev A . Movement analysis to indicate discomfort in vehicle seats. 2017;1-6. |
[46] | Sammonds GM , Fray M , Mansfield NJ . Effect of long term driving on driver discomfort and its relationship with seat fidgets and movements (SFMs). Appl Ergon.. (2017) ;58: :127–99. |


