
Putting the world back to work: An expert system using big data and artificial intelligence in combating the spread of COVID-19 and similar contagious diseases
Abstract
BACKGROUND:
To combat COVID-19, curb the pandemic, and manage containment, governments around the world are turning to data collection and population monitoring for analysis and prediction. The massive data generated through the use of big data and artificial intelligence can play an important role in addressing this unprecedented global health and economic crisis.
OBJECTIVES:
The objective of this work is to develop an expert system that combines several solutions to combat COVID-19. The main solution is based on a new developed software called General Guide (GG) application. This expert system allows us to explore, monitor, forecast, and optimize the data collected in order to take an efficient decision to ensure the safety of citizens, forecast, and slow down the spread’s rate of COVID-19. It will also facilitate countries’ interventions and optimize resources. Moreover, other solutions can be integrated into this expert system, such as the automatic vehicle and passenger sanitizing system equipped with a thermal and smart High Definition (HD) cameras and multi-purpose drones which offer many services. All of these solutions will facilitate lifting COVID-19 restrictions and minimize the impact of this pandemic.
METHODS:
The methods used in this expert system will assist in designing and analyzing the model based on big data and artificial intelligence (machine learning). This can enhance countries’ abilities and tools in monitoring, combating, and predicting the spread of COVID-19.
RESULTS:
The results obtained by this prediction process and the use of the above mentioned solutions will help monitor, predict, generate indicators, and make operational decisions to stop the spread of COVID-19.
CONCLUSIONS:
This developed expert system can assist in stopping the spread of COVID-19 globally and putting the world back to work.
1Introduction
COVID-19 is a dangerous and infectious virus, which has evolved from an epidemic to a pandemic, due to the fact that it is not limited in space and time affecting many countries around the world. The contagiousness rate is very high (from 2.5 to 5.7) and the mortality rate is between 2 and 6%. The most common symptoms of COVID-19 are fever, dry cough and fatigue, with some patients experiencing pain, nasal congestion, and/or sore throat [1]. COVID-19 is transmitted by people carrying the virus. The disease is transmitted mainly from person to person through respiratory droplets expelled through the nose or mouth when an ill individual coughs, sneezes or talks [1, 2]. Governments around the world have taken several measures to protect themselves from this virus and monitor the evolution of symptoms with the adoption of strict instructions to people on self-isolation (Stay home, isolate yourself, social distancing) [3].
The International Labor Organization reported that in the second quarter of 2020, the global working hours are estimated to be 10.5 percent lower than in the previous pre-crisis quarter in 2019. This led to the loss of an estimated 305 million full-time jobs [4].
Almost every region in the world experienced un-employment percentage increase because of COVID-19. However, the world’s biggest economies are more affected by this. According to the U.S. Labor Bureau of Statistics, COVID-19 brought the total of unemployed individuals to a staggering 40.8 million, as it increased unemployment to a record high of 14.7% in April 2020 [5]. In Japan, 1.76 million are without jobs [6]. China has reported an estimated 80 million individuals without work as of March 2020 [7]. The European Union’s workforce has also taken a toll due to COVID-19, as of March 31, 2020 it was reported that an estimated 14 million people were unemployed [8].
When deciding to return to work after testing positive for COVID-19 the Center for Disease Control and Prevention in the USA recommends that the individual wait at least 10 days from the day their symptoms first appeared [9]. After the ten days the CDC states the person should wait at least an additional 3 days that are marked without the use of fever-reducing medicine and improvement in any respiratory symptoms such as, cough or shortness of breath, before returning to work. Once the person returns to work the CDC recommends that the individual should always wear a face mask and they should self-monitor in case symptoms reoccur or worsen, including taking their temperature twice daily.
Safety at work is even more crucial specifically for people with pre-existing health condition and older adults who may be frail and having some pre-existing health condition such as cardiopulmonary conditions and diabetes.
Preventive measures for older workers are necessary in order for them to continue working and remain healthy [10]. Now this is even more vital due to COVID-19.
The Occupational Safety and Health Administration (OSHA) in the USA advised employers and workers to follow some general practices to help prevent exposure to COVID-19 [11] such as:
• Washing your hands frequently with soap and water for at least 20 seconds;
• Using an alcohol-based hand rub that contains at least 60% alcohol if soap and running water are not available;
• Avoiding touching the eyes, nose, or mouth with unwashed hands;
• Avoiding close contact with people who are sick;
• Assessing the hazards of workers exposure to the virus;
• Evaluating the risk of exposure;
• Ensuring that workers are adhering to use physical barriers to control the spread of the virus, social distancing, use appropriate personal protective equipment, hygiene, and cleaning supplies.
While many people lost their jobs, some other workers such as healthcare workers and other essential workers are overworked and need more protection because the entire society now is relying on them. Studies have shown that healthcare workers are predisposed to work related muscular disorders [12]. The highest group of healthcare workers with this risk is nurses [13, 14]. A study found that 63.8% of nurses in a hospital in Saudi Arabia experienced discomfort during the last 12 months in their lower back, followed by shoulders (50%), and upper back (48.9%) [15]. Perhaps the struggle of these workers may increase with the influx of more sick people and most hospitals reaching their full capacity especially with more people who are very sick and need more assistance. Governments are now required to do even more to protect these very important workers such as nursing by providing them whatever equipment they need. OSHA for example recommends that healthcare workers with exposure to suspected or confirmed COVID-19 patients need to wear gloves, gowns eye/face protection (e.g., goggles, face shield) and N95 filter face piece respirators or better that are certified by the National Institute for Occupational Safety and Health [16].
Several countries such as the USA, China, and Taiwan for example, have turned to Big Data (BD) and Artificial Intelligence (AI) to contain this scourge, to detect, to monitor cases of contamination, and to predict the spread of the epidemic [17]. In order to contain contamination, some countries share medical, transportation data (trains and planes in particular), and people’s mobility among other things by utilizing the BD and monitoring the travel history of people. Since the Severe Acute Respiratory Syndrome Coronavirus (SARS-CoV) (outbreak of 2003 [18], Taiwan has put in place a robust pandemic prevention plan based on new technologies, AI and BD, among others [19].
As such, researchers are currently working at pandemic sites collecting vital data on COVID-19, such as transmissibility, risk factors, incubation period, and mortality rate [20]. Data are used for visualizations, creation of mathematical models and neural network formation. In addition to the work that has been done, this research team designed an expert system that combines multi solutions such as predictive analysis by learning algorithms Machine Learning (ML) to provide preventative and information system based on scientific data. An expert system is a programmed tool capable of answering questions, making a reasoning based on known facts and rules. This expert system is one of the common applications used to solve complicated problems in different fields. It focuses on the construction of high- performance programs in specific professional domains [21]. Generally speaking, this expert system is a computer tool based on ML and AI designed to solve certain problems due to the specialist expertise and knowledge in a specific field [22].
The expert system also allows the modeling of an expert’s reasoning, the manipulation of knowledge in a declarative form, the facilitation of its acquisition, modification and updating of data, the obtaining of inferences and conclusions, and the production of explanations on how results are obtained [23]. Therefore, this expert system will address the questions of how can we combat and stop the spread of COVID-19, saving people’s lives, and put the world back to work.
To answer this question, we developed a new sys-tem to provide a General Guide (GG) to the users, containing a set of information concerning the COVID-19 pandemic. Once the users receive enough information about COVID-19, the recommendation is to complete the online check-up. This will provide us with data that will be analyzed using BD and AI algorithms. The results obtained from this analysis will provide indicators that will help decision-makers to make the best decision in terms of monitoring and intervening to limit the spread of COVID-19. With the same objective, other complementary solutions will be introduced such as the as smart automatic car and passenger sanitizing system, smart thermal cameras, and multi-use drones.
In method section of this article it will be discussed how BD should be used and what is being done around the globe to put people back to work in a safe manner. In addition, the proposed expert system to stop the spread of COVID-19 is discussed in multi solutions. Moreover, the discussion will addresses the main solution to COVID-19 concerns and the proposed analysis models that will be used, and the analysis methods that are used in BD and ML to analyze and predict the data of the identified problem.
2Methods
2.1Predictive analyses process with BD
Predictive analysis not only predicts what is happening, but it can also predict what will happen in the future, which is very valuable for better planning and preparation. Rather than simply explaining who, what, where, when, predictive analysis predicts the best course of action that will generate the most optimal return based on an algorithm, such as a regression equation [24]. The objective of predictive analysis is to analyze data and variables to extract predictive capabilities from existing data. Predictive analysis techniques rely on variables that can be measured, manipulating metrics to predict future behavior or outcomes based on a variety of quantifiable approaches. Predictive analysis models combine multiple predictors or quantifiable variables into a predictive model [25, 26]. This approach allows for the collection of data and subsequent formulation of a statistical model, to which additional data can be added as they become available. The prediction process involves the following steps depicted in Fig. 1.
![Predictive analysis process [27].](https://ip.ios.semcs.net:443/media/wor/2020/67-3/wor-67-3-wor203309/wor-67-wor203309-g001.jpg)
The predictive analysis of data plays a major role in the fight against the factors that cause epidemics. Predictive data analysis has become more than a powerful tool to help prevent epidemics. Several areas of research have used prediction models such the return of workers with injuries in Hong Kong [28].
The use of predictive data analysis models based on AI, ML, and BD analytics techniques are well suited for tracking and controlling the spread of COVID-19 around the world. Sophisticated predictive analysis platforms that process billions of data obtained from a variety of sources are also helping the World Health Organization (WHO) and other health care organizations around the globe in the fight against the pandemic.
2.2Predictive technical analytics
The predictive technical analytics is a sub-branch of the BD also called predictive logic or advanced analysis, it brings together advanced analytical and statistical techniques to establish predictive scenarios about future events. Predictive analysis uses specific methods from ML and game theory. Thanks to complex algorithms, the combination of these techniques makes it possible to generate models that accurately predict future events [29, 30].
The algorithms of the ML are classified according to supervised or unsupervised learning type depicted in Fig. 2.
![Machine learning algorithms type [31].](https://ip.ios.semcs.net:443/media/wor/2020/67-3/wor-67-3-wor203309/wor-67-wor203309-g002.jpg)
2.2.1Supervised learning
For this type of algorithm, the input data is labeled and each is indicated by the corresponding target. The objective of the algorithm is to provide every new input with a label, then to learn from the initial data, while calculating a function that will represent the best model found after this learning, and to make predictions on the unlabeled data. In this type of training, we need to distinguish two types of algorithms: classification algorithms and regression algorithms [32, 33].
Classification algorithms: When the output variables are discrete, i.e. numeric and countable. The problem is then to predict the category of data. The classification can be binary if we have two classes or multinomial if the number of classes is more than two.
Regression algorithms: various type of regression can be applied in the data prediction as the linear regression model and the polynomial regression model among the models which will be applied in this work to predict an example of COVID-19 data. In this application, the output values to be predicted are continuous numerical variables.
2.2.2Unsupervised learning
This type of learning consists of analyzing unlabeled data, then extracting a pattern from this data so we can generate predictions. Unsupervised learning refers to the clustering or partitioning of data into homogeneous groups, calculating a measure of similarity, when the system has only examples, and the number of classes and their nature have not been predetermined. This is called unsupervised learning or clustering [34, 35].
2.2.3Principal algorithms for machine learning
In this research project, the team chose to work with the type of supervised learning and more precisely with the algorithms most used in the analysis and prediction of health data.
Logistic regression: Logistic regression is one of the most widely used ML algorithms for binary classification. Like many other ML techniques, it is obtained from the field of statistics, not as what its name refer to, it is not an algorithm for regression problems, in which one wishes to predict a continuous output. Instead, logistic regression is the reference method for binary classification [36].
The support vector machine (SVM): The SVM is a predictive analysis data-classification algorithm that assigns new data elements to one of labeled categories. SVM is, in most cases, a binary classifier. It assumes that the data in question contains two possible target values [37].
Decision tree: Decision tree is a predictive model to move from observations about an item to conclusions of its target values. It is one of the predictive modeling approaches used in statistics, data mining, and ML. Tree models, in which the target variable can take a discrete set of values. They are called classification trees. In these trees, leaves represent class labels and branches represent conjunctions of entities leading to these class labels.
For example, in the health-work subject we found the work [38] that used logistic regression to process data on past sick leave and demographic variables to predict absences due to illness other work [39, 40] used also the logistic regression to trait measuring psychosocial factors and predicting work ability among cemetery workers.
Gradient Boosting: Gradient Boosting is a technique for automatically learning regression and classification problems [41], which produces a prediction model in the form of a set of weak prediction models, usually decision trees. It builds the model in a stepwise fashion.
Neural network: The neural network algorithm is widely used for data classification. Neural networks process past and current data to estimate future values uncovering all the complex correlations hidden in the data in a manner similar to that used by the human cerebrum. In the rest of the expert system being developed, the structure of a neural network algorithm consists of three layers:
The input layer feeds past data values into the next (hidden) layer. The hidden layer encapsulates several complex functions that create predictors; the output layer collects the predictions made in the hidden layer and produces the final result which is the prediction of the model [42] as depicted in Fig. 3.
![Neural network predictor [43].](https://ip.ios.semcs.net:443/media/wor/2020/67-3/wor-67-3-wor203309/wor-67-wor203309-g003.jpg)
The Deep Learning DL is an approach from the representation learning family of ML. Representation learning is also often referred to as feature learning [44]. This type of algorithm gets its name from the fact that it uses data representations rather than explicit data features to perform tasks.
Other predictive models: There are other efficient models that can be applied in the prediction of many parameters of data related principally to seasonality in time series. The first model is Autoregressive Integrated Moving Average Model (ARIMA) that is based on parameterized analytical equations which these parameters are related to degree of divergence, order of the non-seasonal moving average of the error. The second preferred model is the Holt-Winters’ seasonal model when the seasonal variations are roughly constant through the series, comprises the forecast equation and parameters [45]. Also, we can use the genetic algorithms for more performance and results [46, 47].
3The proposed expert system to stop the spread of COVID-19
3.1The general guide application
The main solution of this research team system expert is to use the online application called General Guide (GG) application to limit the spread of COVID-19 in each country worldwide using BD and AI. The use of the GG application is depicted in the examples shown in Fig. 4.
Fig. 4
Example of the home screen of the GG application.

Application home page: guide containing all the information and news about COVID-19, ensuring a diversified awareness that targets all citizens of a specific country.
Online consultation page: Entry of data by citizens will identify the health status of each citizen related to the risk factors of COVID-19. This will generate a massive database that will help in minimizing the spread of this virus and that data could be used in making a scientifically informed decision in how to address COVID-19.
3.1.1GG application figures
This expert system is a web application. It is in Arabic and English and can be available on tablet, smartphone, and computer. It can inform the user about the following points:
• General definition of COVID-19.
• How COVID-19 is transmitted.
• How to protect yourself from COVID-19.
• Symptoms of COVID-19.
• Mental health resources manual.
• Counseling centers.
• Number of infected people and other statistics.
• Remote learning links from educational institutions.
• Working from home tutorial manual.
• Most asked questions with answers.
• Emergency phone numbers.
3.1.2Online consultation using the app
This application allows each person to input their personal information (Obligatory step with full respect of the privacy and confidentiality protection).
Personal Information Input (PII): The PPI includes: The first name, last name, sex, date of birth, identification number, nationality, email address, phone number, address function, employer, workplace, etc.
Symptom Identification Input (SII): The SII includes: Fever, cough, respiratory problems, sore throat, runny nose, head-ache, diarrhea, loss of smell or taste, etc, or no symptoms.
Risk factors (RF):
• Did you have any contact with a person contaminated with COVID-19?
• Do you have any close family member contaminated with COVID-19?
• Did you take a COVID-19 test?
• Do you continue to work or are you in confinement?
• Have you been in a group of more than 10 people in the past month?
• Have you used public transportation in the past month?
• Are you using a vehicle or public transportation right now?
• Do you know at least 5 people infected with COVID-19 in your area?
• Health history in the last three months: diabetes, hypertension, respiratory, asthma, allergy, weak immune system, influenza, cold, etc.
• Are you already infected with COVID-19?
• Did you visit a hospital or a medical office recently?
Just to point out that this is not an inclusive list of risk factors. Other risk factors can be added to it.
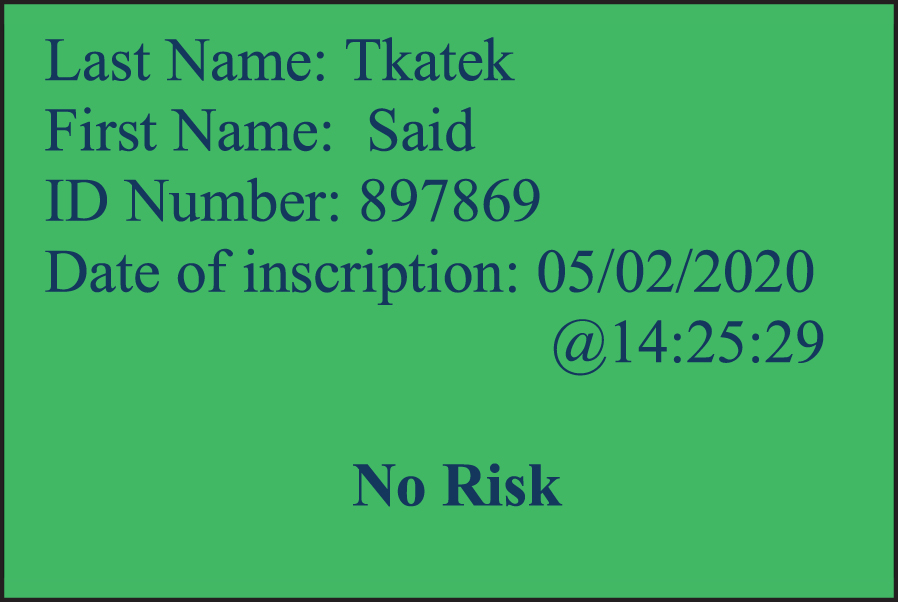
At the end of entering all the information requested by the GG application, a response evaluated by an algorithm will give one of three types of results depicted below in three colored types of flags:
 Green flag: Person with very low risk infection of COVID-19.
 Yellow flag: Person may have COVID-19.
 Red flag: Person is at a high risk of COVID-19 infection.
4Figures and explanation
This result means that the person has no COVID-19 symptoms nor risk factors as depicted in Fig. 7.
Fig. 5
Example of the home screen of the GG application.
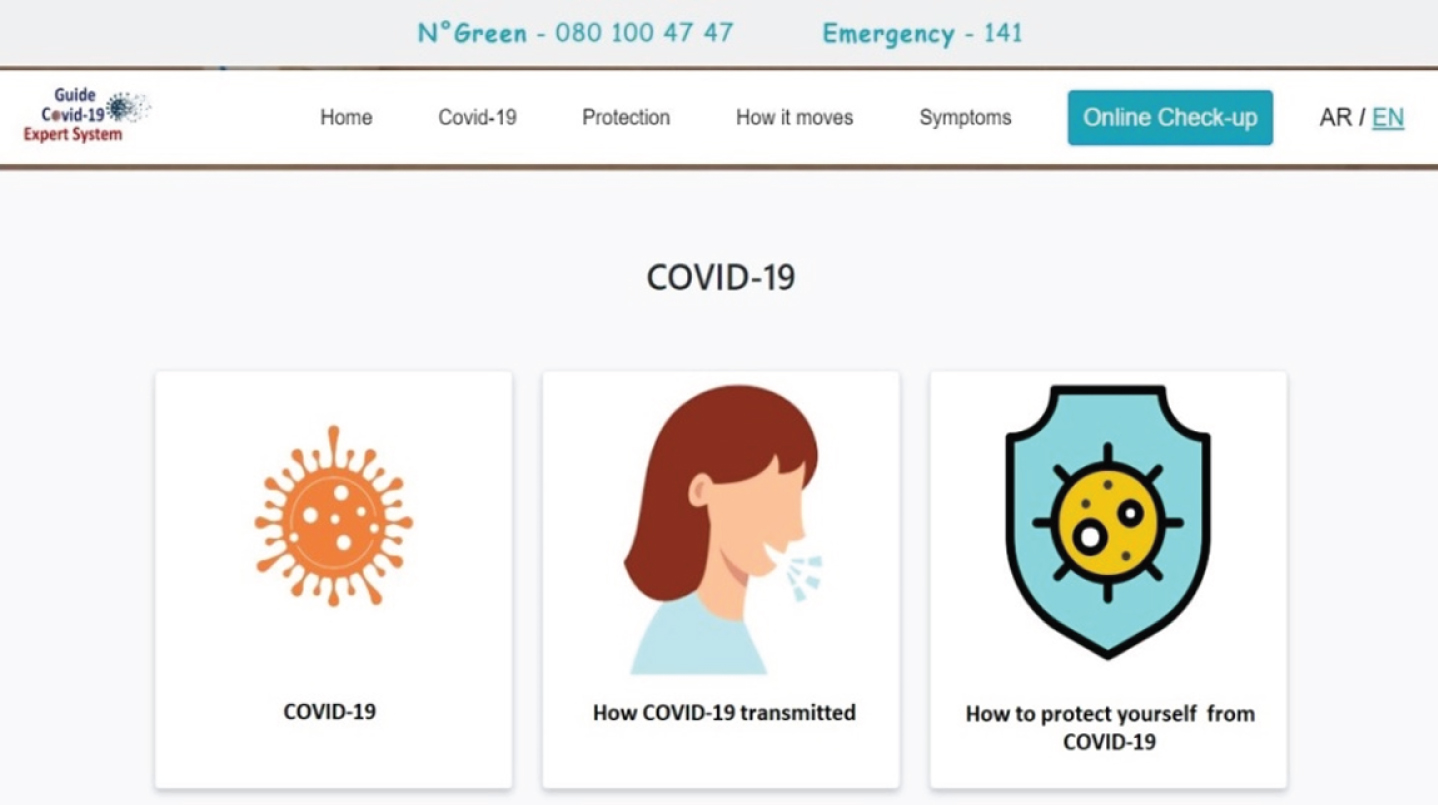
Fig. 6
Example of the home screen of the GG application.
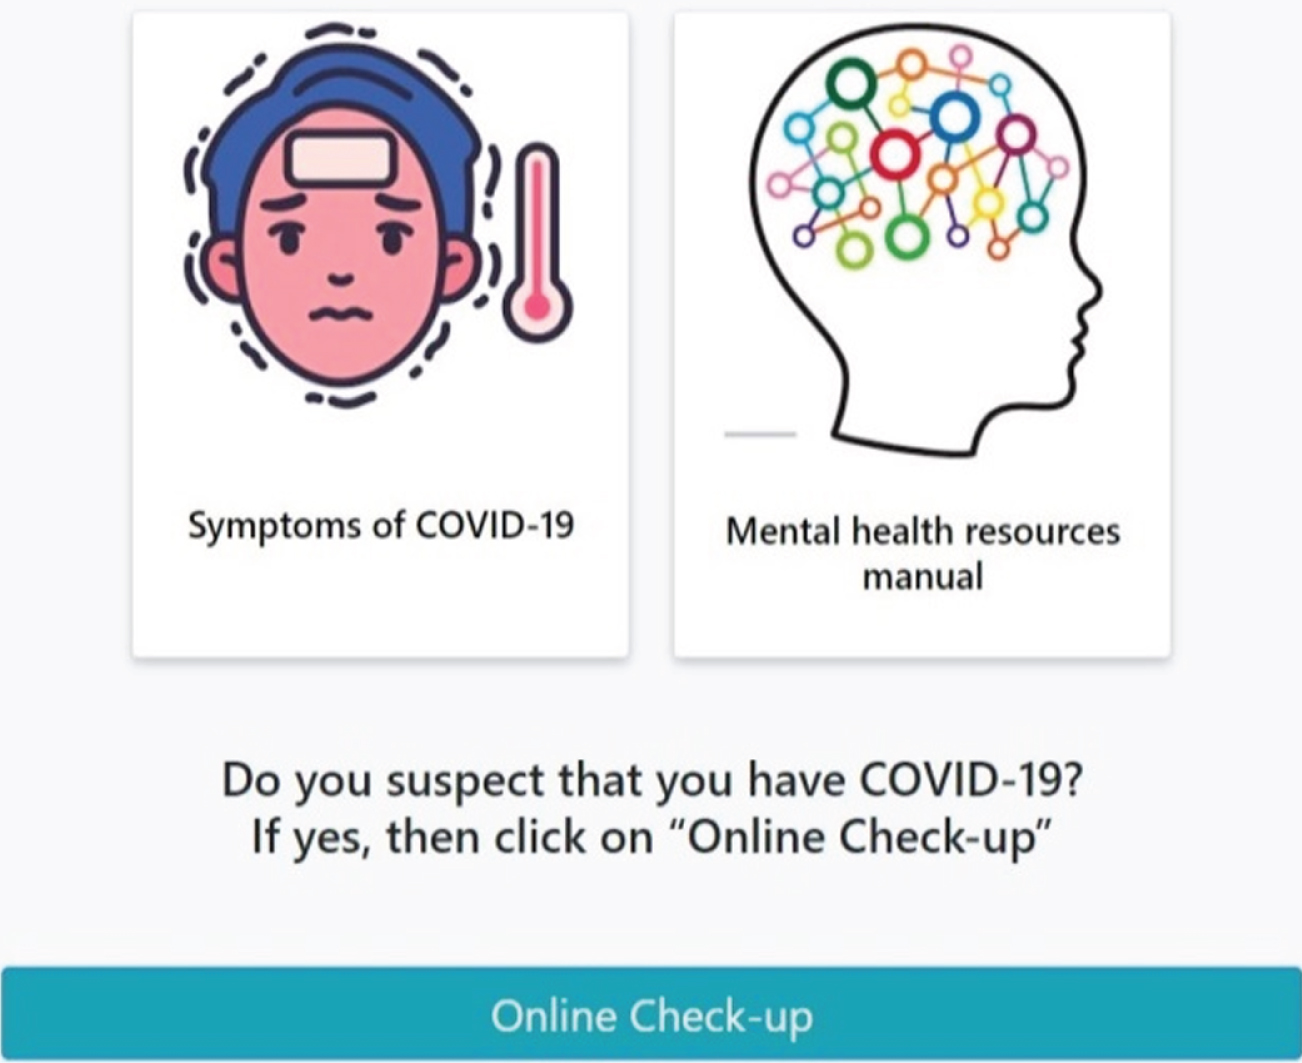
Fig. 7
Green flag: Person with a very low risk infection of COVID-19.
This result means that the person has at least one symptom of COVID-19 or at least one risk factor as depicted in Fig. 8.
Fig. 8
Yellow flag: Person is probably contaminated with COVID-19.
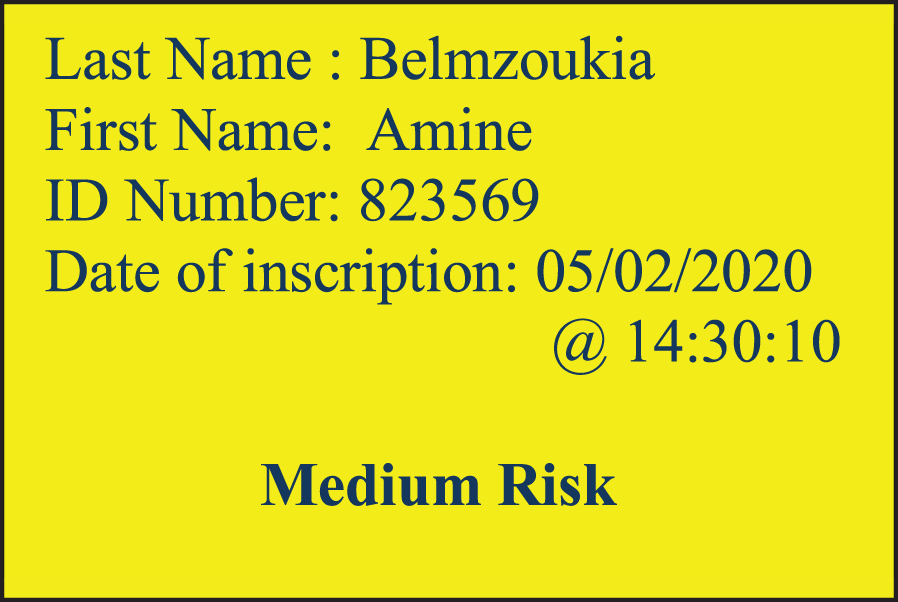
The person with a yellow flag should stay isolated at home and contact the appropriate health care services.
This result means that the person has at least three major symptoms of COVID-19 and one or risk factors as depicted in Fig. 9.
Fig. 9
Red flag: Person is at a high risk of infection with COVID-19.
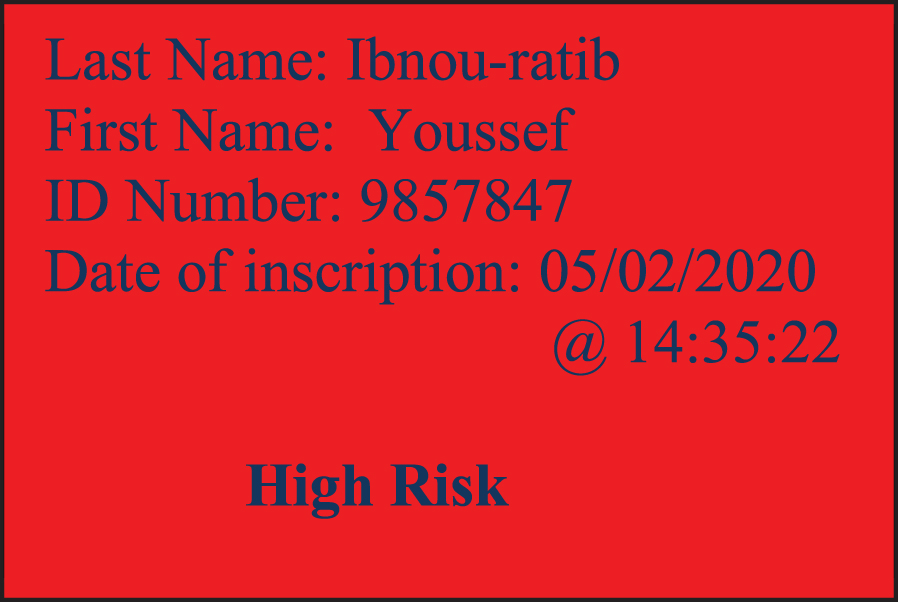
A person with a red flag needs to stay isolated at home, concerned medical facility will receive an alert about his situation and will contact the person immediately to schedule an appointment to perform a COVID-19 test at home. This will reduce traffic and congestions in medical emergency areas and hospitals, and reduce the number of emergency calls.
This will help in reducing overburden on health care workers and minimize the demand of additional heath care workers. In addition, it will help health care systems optimize test planning and response to prevent waste of tests.
The GG application was developed by this research team to allow for these benefits:
• Identify symptoms and risk factors of citizens and regions to get the exact level of the pandemic situation.
• Identify people who are suspected to be infected.
• Identification of areas and regions with high-risk of the spread of COVID-19 to which the government can apply an automatic alert system based on data for example a region can be in a lock down if 10% of its inhabitants have high fever or high number of people with red flags. The exact parameter percentages for fever and other symptoms will be up to the local health care officials and government.
• To provide maximum information to citizens and stakeholders about COVID-19.
• To permit citizens and stakeholders to make the right decision about confinement and deconfinement.
•
Safe region, state, city, or district with a very low risk of COVID-19.•
Region, state, city, or district with medium risk of COVID-19 in which the government should remain vigilant on the pandemic situation in this area.•
When the expert system indicates a red flag in a region, state, city, or district it means that those areas are with high risk. The government should execute special intervention protocol. Doing so will facilitate reopening the concerned areas ensuring safer and faster deconfinement. This intervention protocol should include:• Mobile hospital units, military medical and logistic units.
• The use of isolation areas such as: hotels, stadiums, schools, university, conventions space, camps, etc.
• People in this region must register using the online check up in the GG application to receive their flag color.
• Control and supervise people’s mobility by using their flags’ color.
• For distant flags’ color control and verification.
• Install vehicles and passengers sanitizing gate in these areas as depicted in Fig. 12.
• Using multipurpose drones can ensure an easy and safe distant control, supervising and interventions in these areas as depicted in Fig. 13.
• People in this area need to wear masks and face shields to maximize prevention.
• Permanent thermal cameras with automatic alert in the entrance and inside of working areas for high fever control and identification.
• Only people with green flags can go to work in these areas. People with red and yellow flags should be confined at home or remain in isolation facilities.
• To get people back to work in the fastest and safest way by using the flag system on regions, states, cities, districts, or work places to know what area needs temporary closure and confinement in which the flag system will be applied. This will ensure what people can work safely and what people can continue to stay confined at home.
• Assist health care systems in optimizing COVID-19 tests planning and response to prevent waste of tests.
• Reducing the flow on hospitals and emergency phone lines.
• Optimize medical intervention resources by reducing overburden on health care workers and minimize the demand of additional heath care workers.
• Controlling the mobility of movement of citizens according to each person’s condition to prevent the spread of COVID-19.
• Applying the GG application will enable the predictive analysis model to predict the evolution of the suspected infected people. This will assist the government in flattening the curve and forecasting the peak of the pandemic situation in an early preventative way using the numbers of suspected cases instead of waiting to use the number of infected people.
• Filling out information in the GG application is voluntary but it may be mandatory in areas with high risk of infection to help the government in ending partial closure.
• The GG application will be secured to protect people’s privacy and information. People’s information will be deleted at end of the pandemic situation.
3.2Automatic vehicle and passengers sanitizing system
This vehicle and passenger sanitizing system is recommended to be used in the red flag areas or areas with high infection risks. It is composed of two units. The first unit called “Safe Vehicle Gate” which will sanitize all exterior and interior surface areas of the vehicle. The second unit called “Safe Passenger Gate” which will sanitize the entire body surface of the passenger. Both units should use revolving sprayers of disinfectants, also it can use Ultraviolet Light for a complete surfaces sanitizing.
To maximize the benefits of this disinfecting system (Fig. 18) which will be equiped with:
Fig. 10
Example of online consultation from the GG application for a person’s identification.
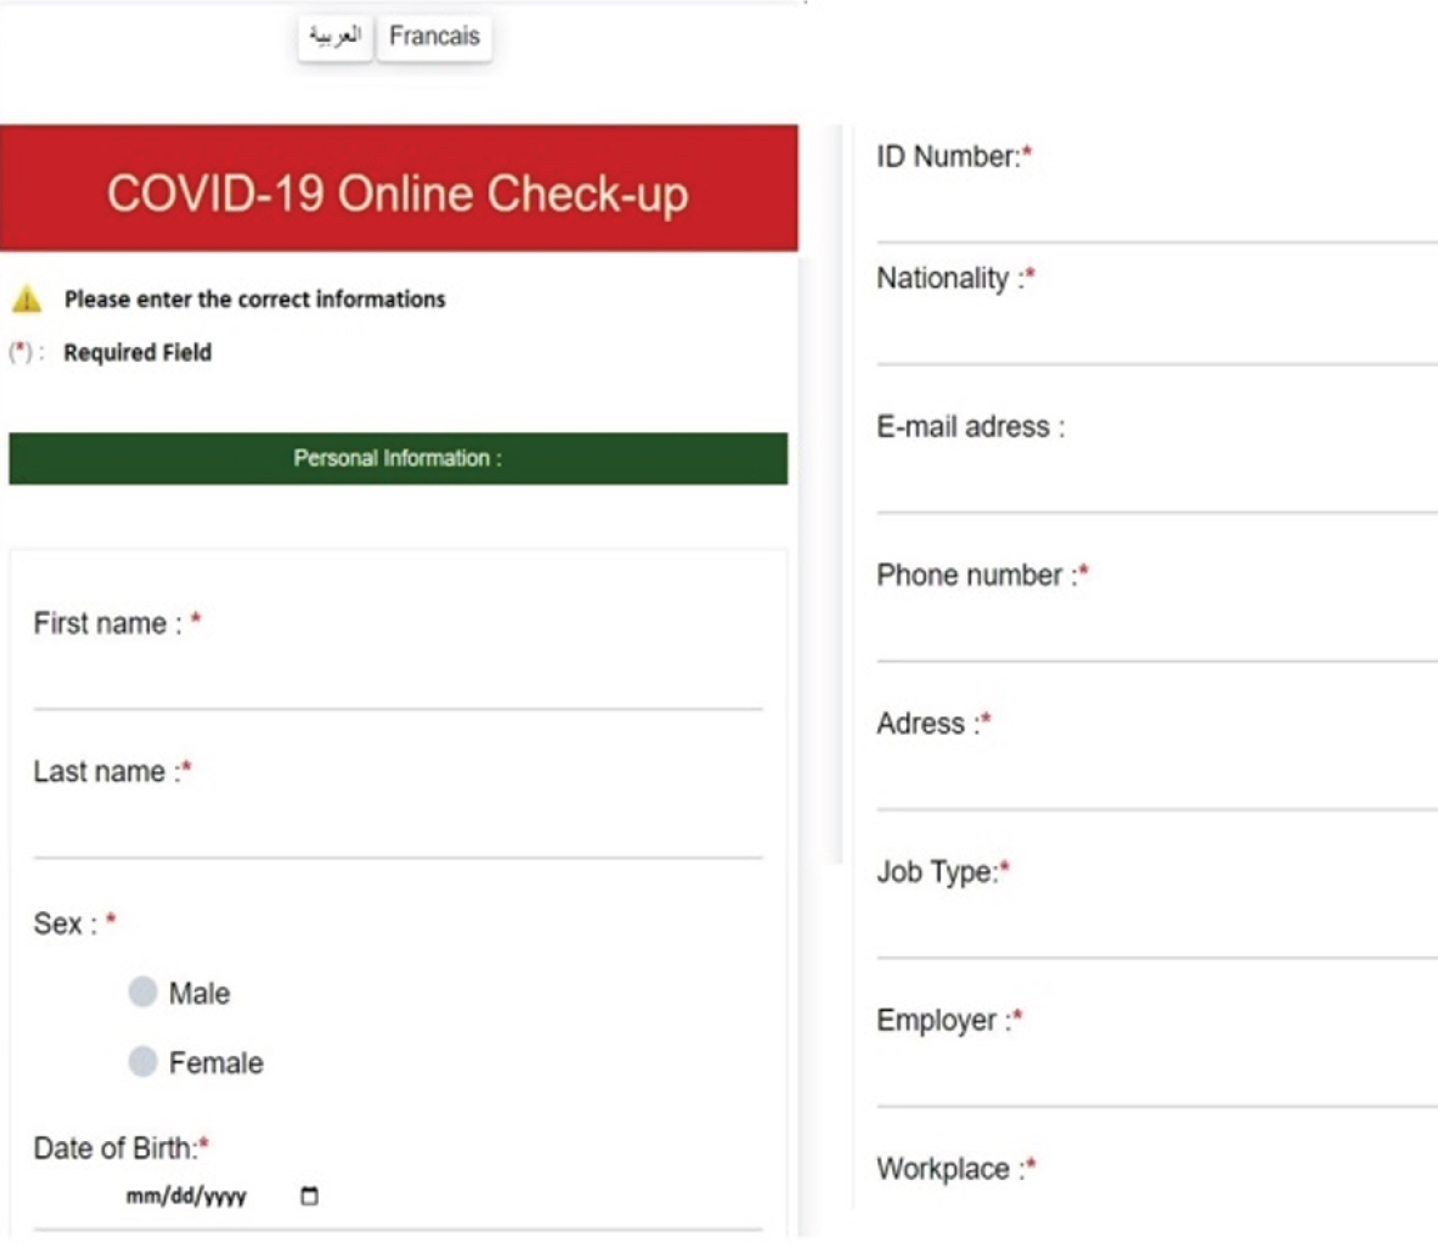
Fig. 11
Example of the online consultation form in the GG application risk factors.
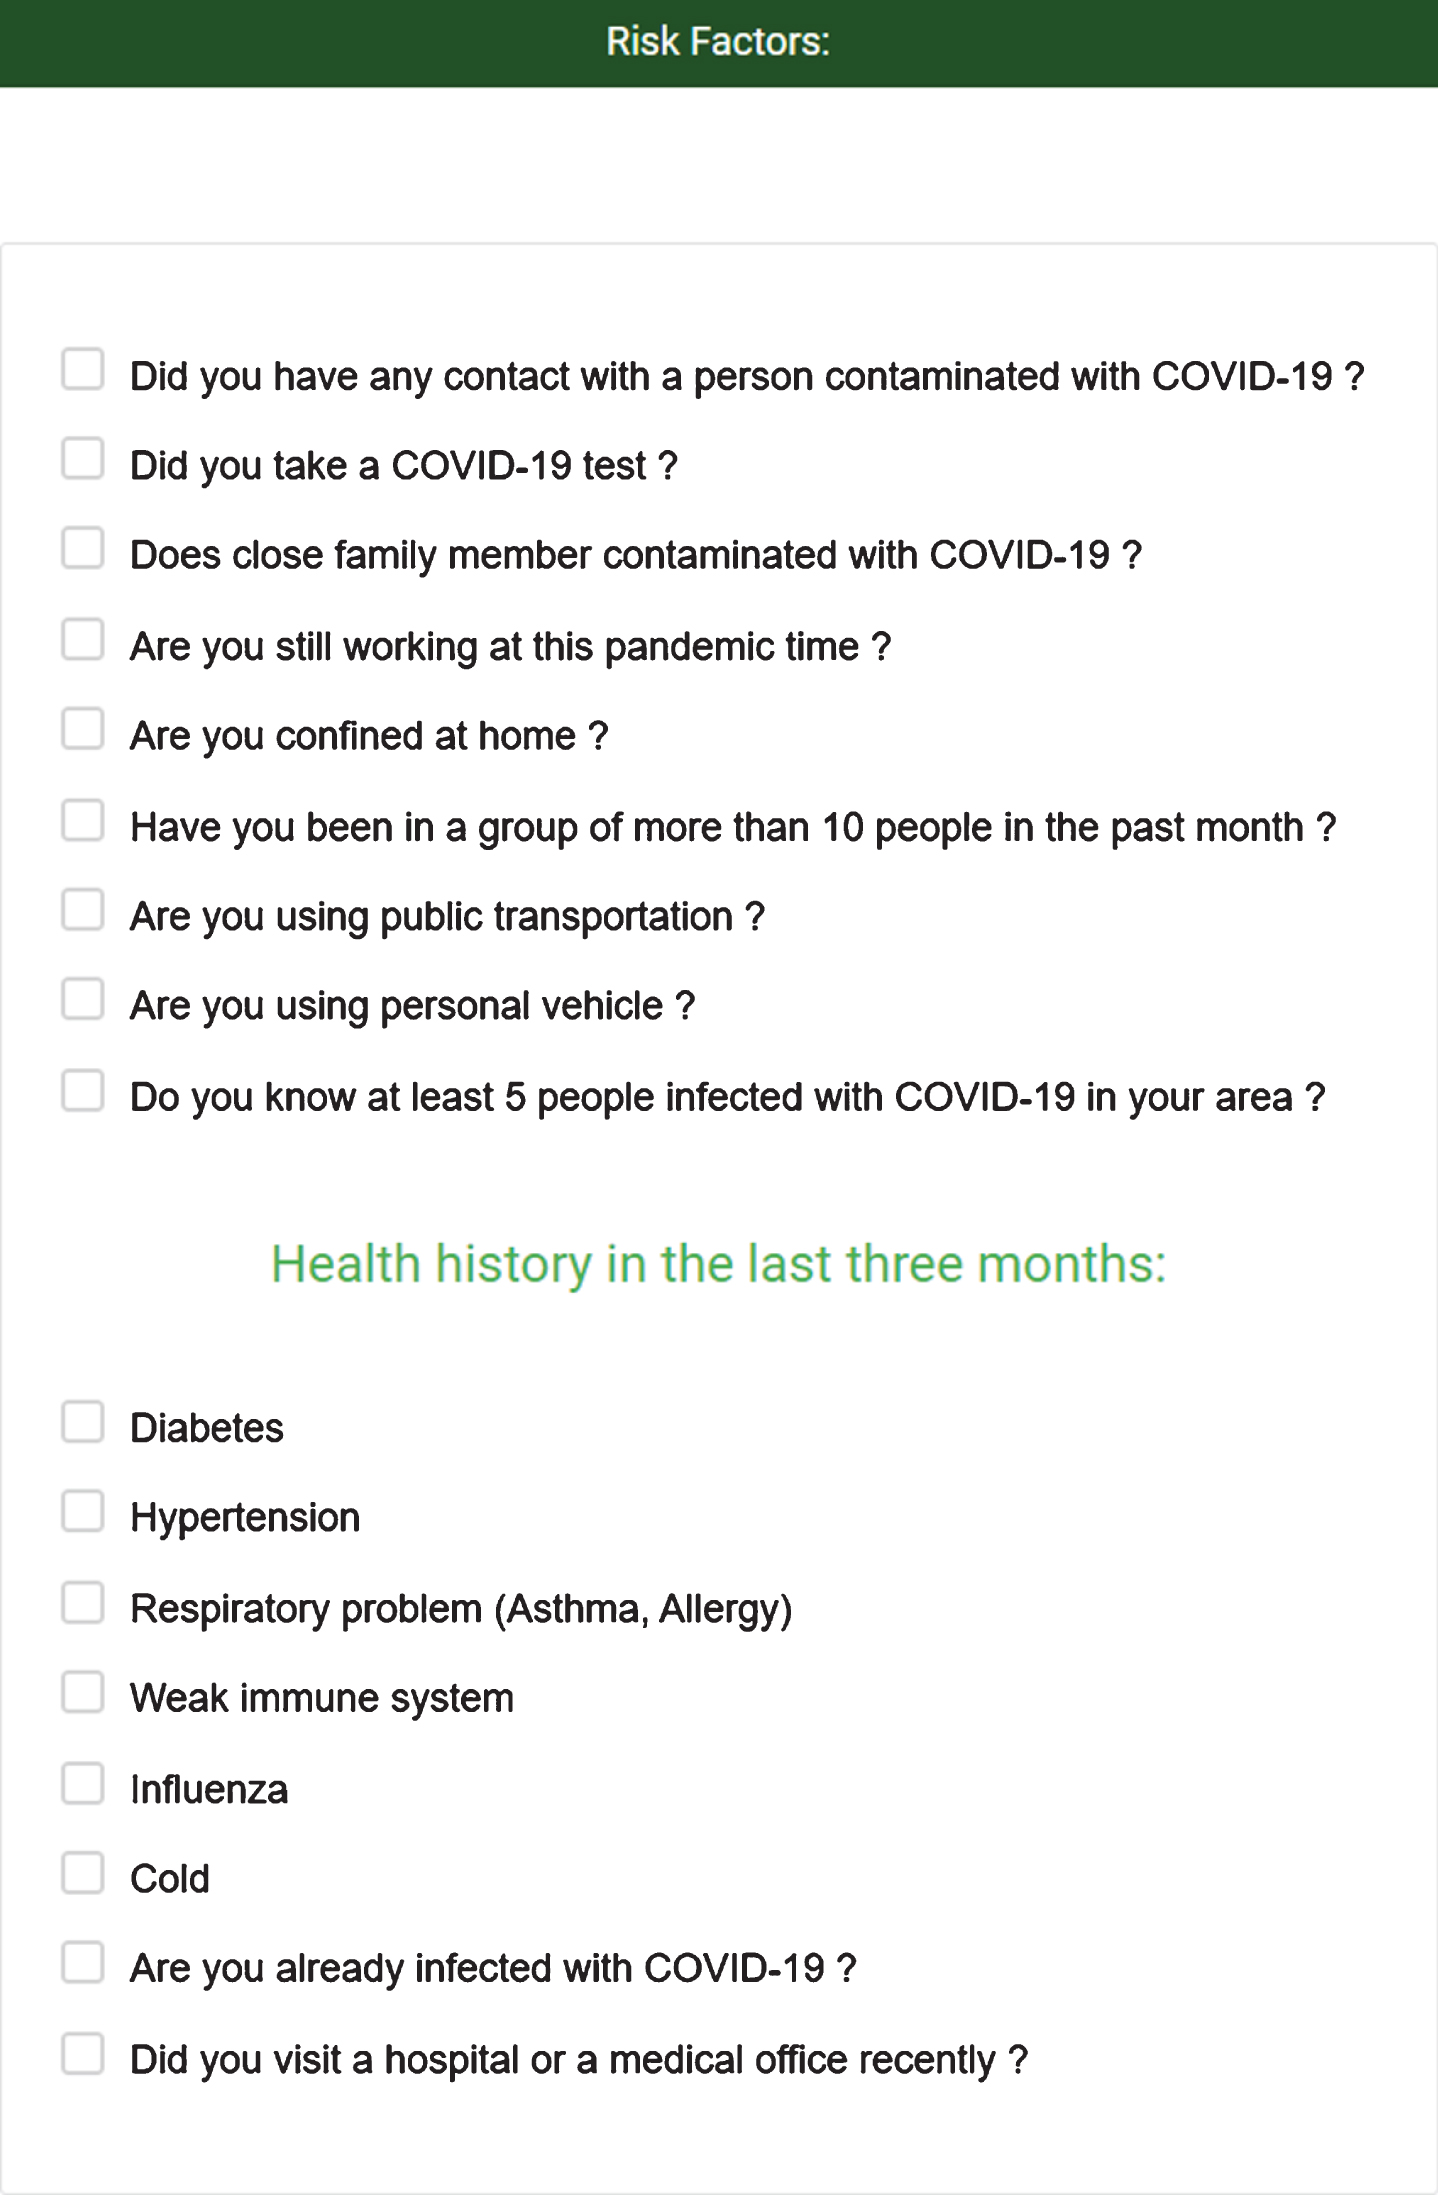
Fig. 12
Proposed conception of future disinfecting system.
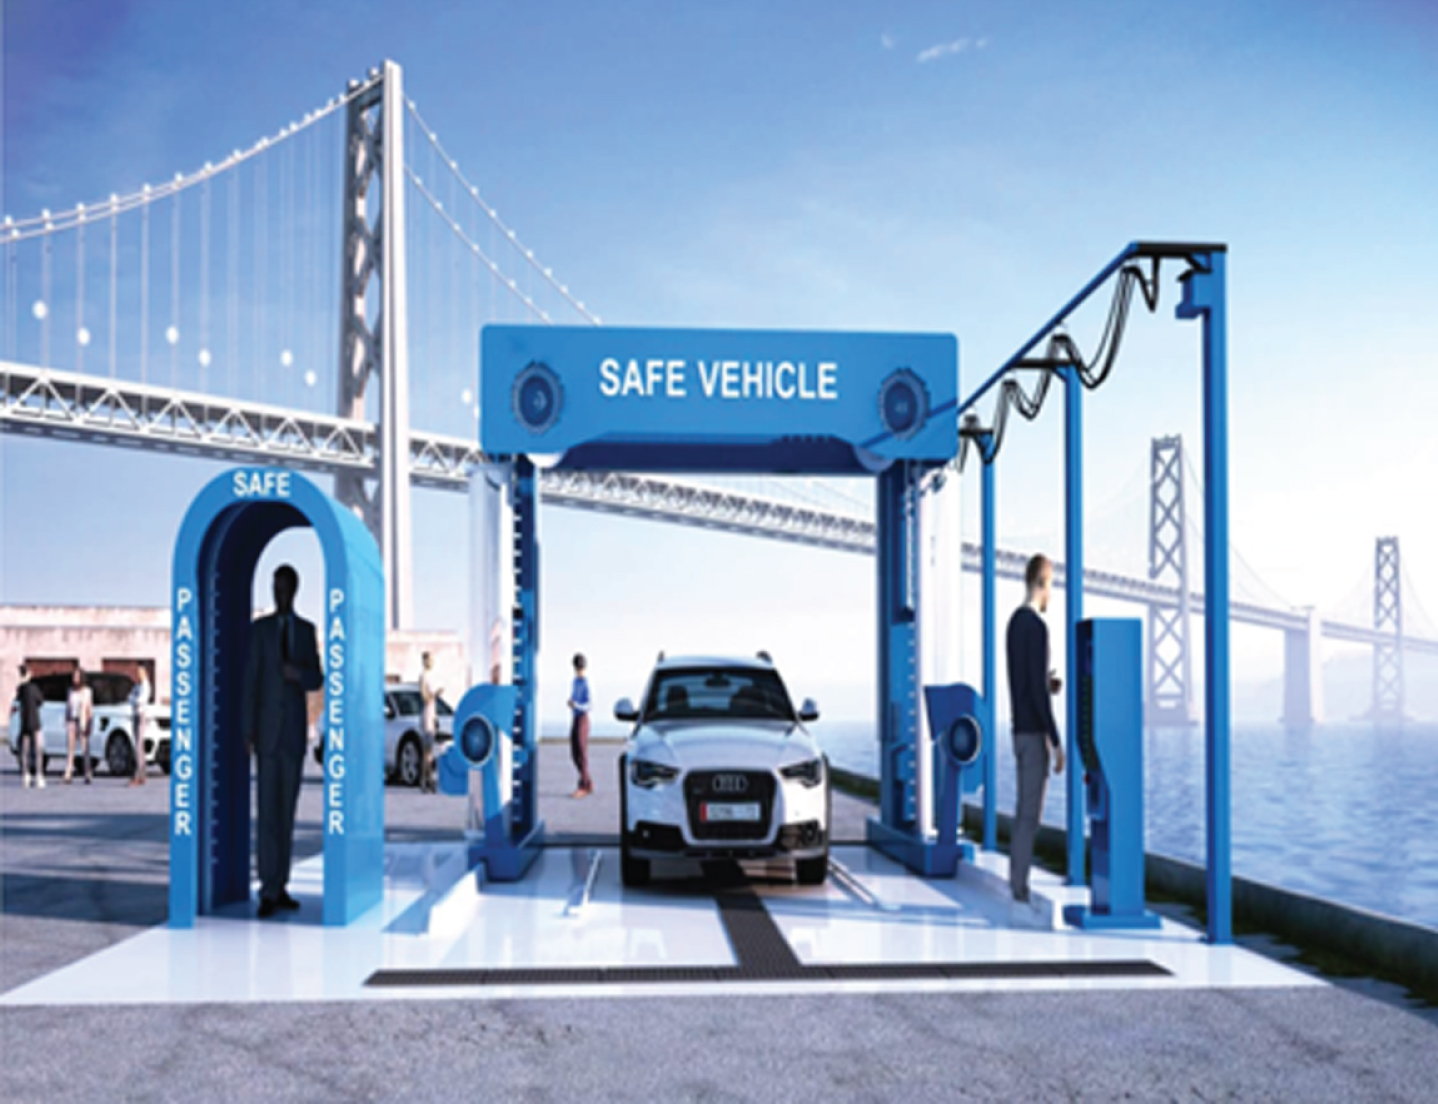
Fig. 13
Examples of multi-purpose drones.
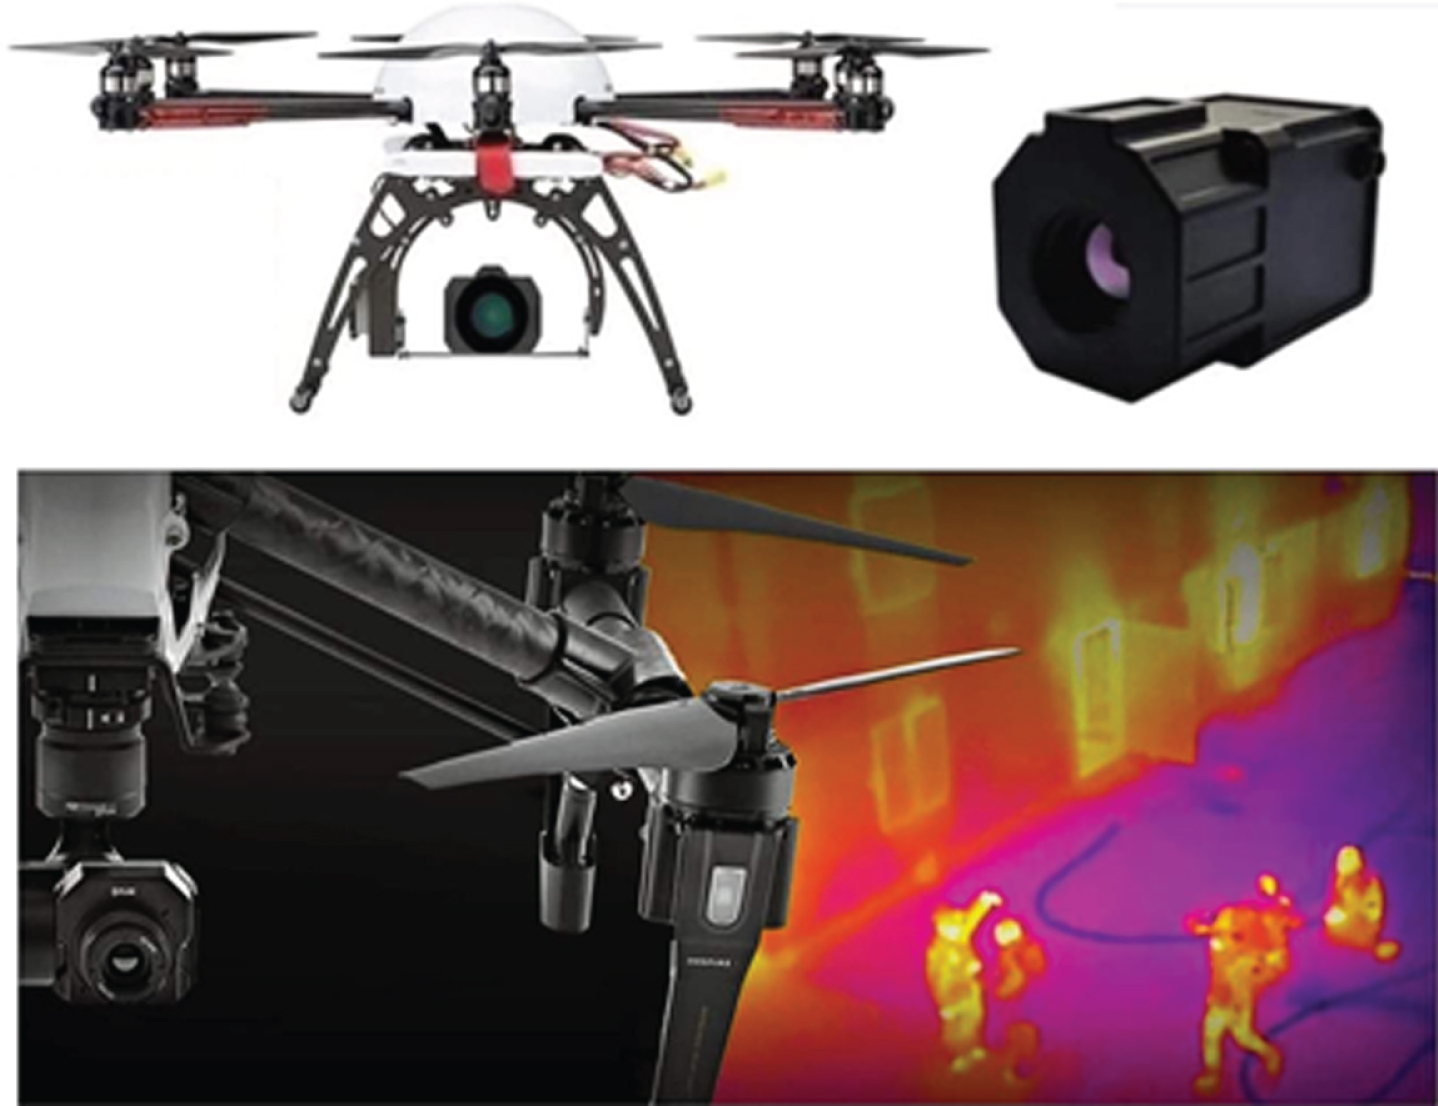
Fig. 14
Actual values and predicted values.
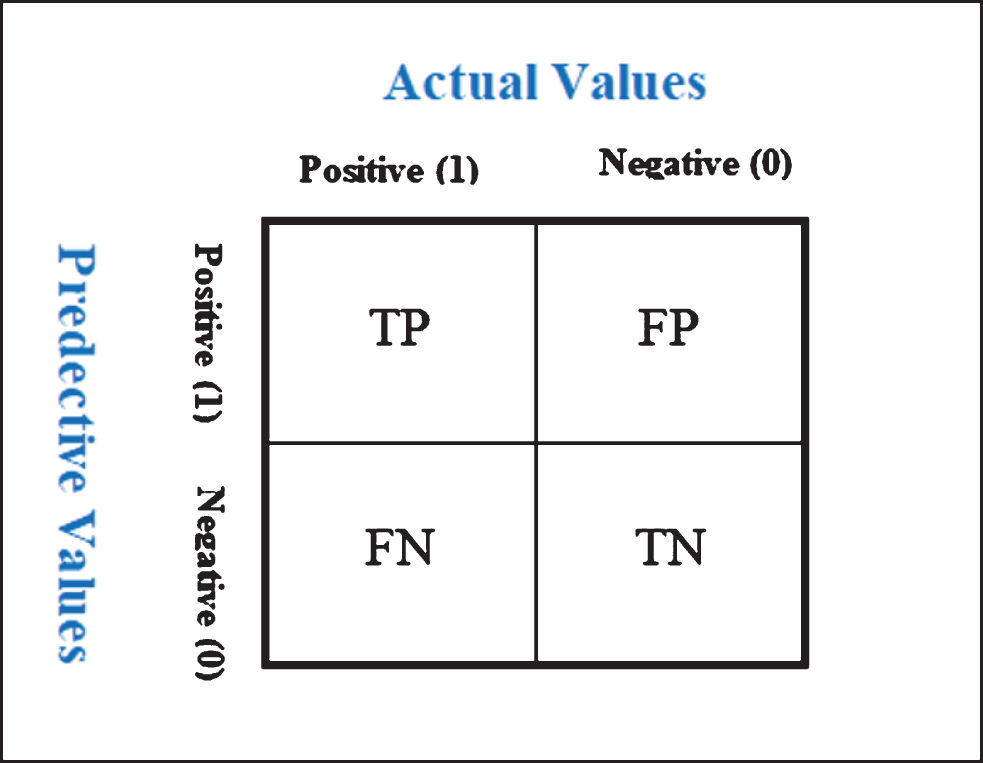
Fig. 15
ARIMA model for daily time series.
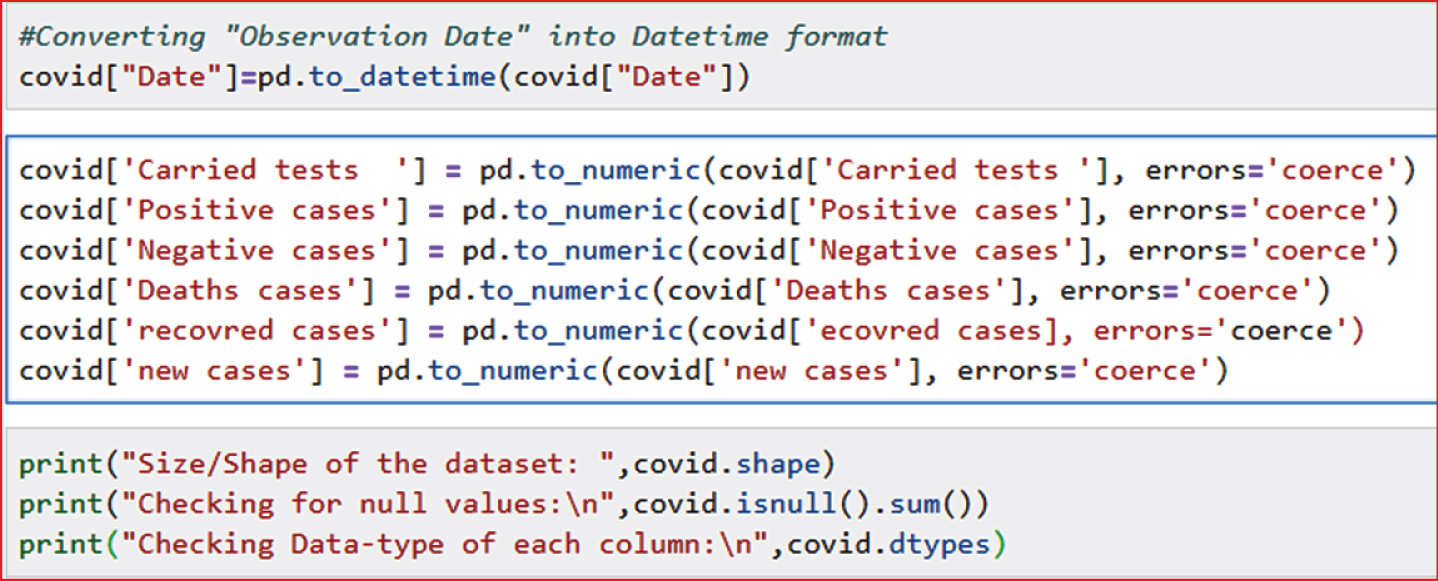
Fig. 16
Structure and basic information of COVID-19 data in Morocco.
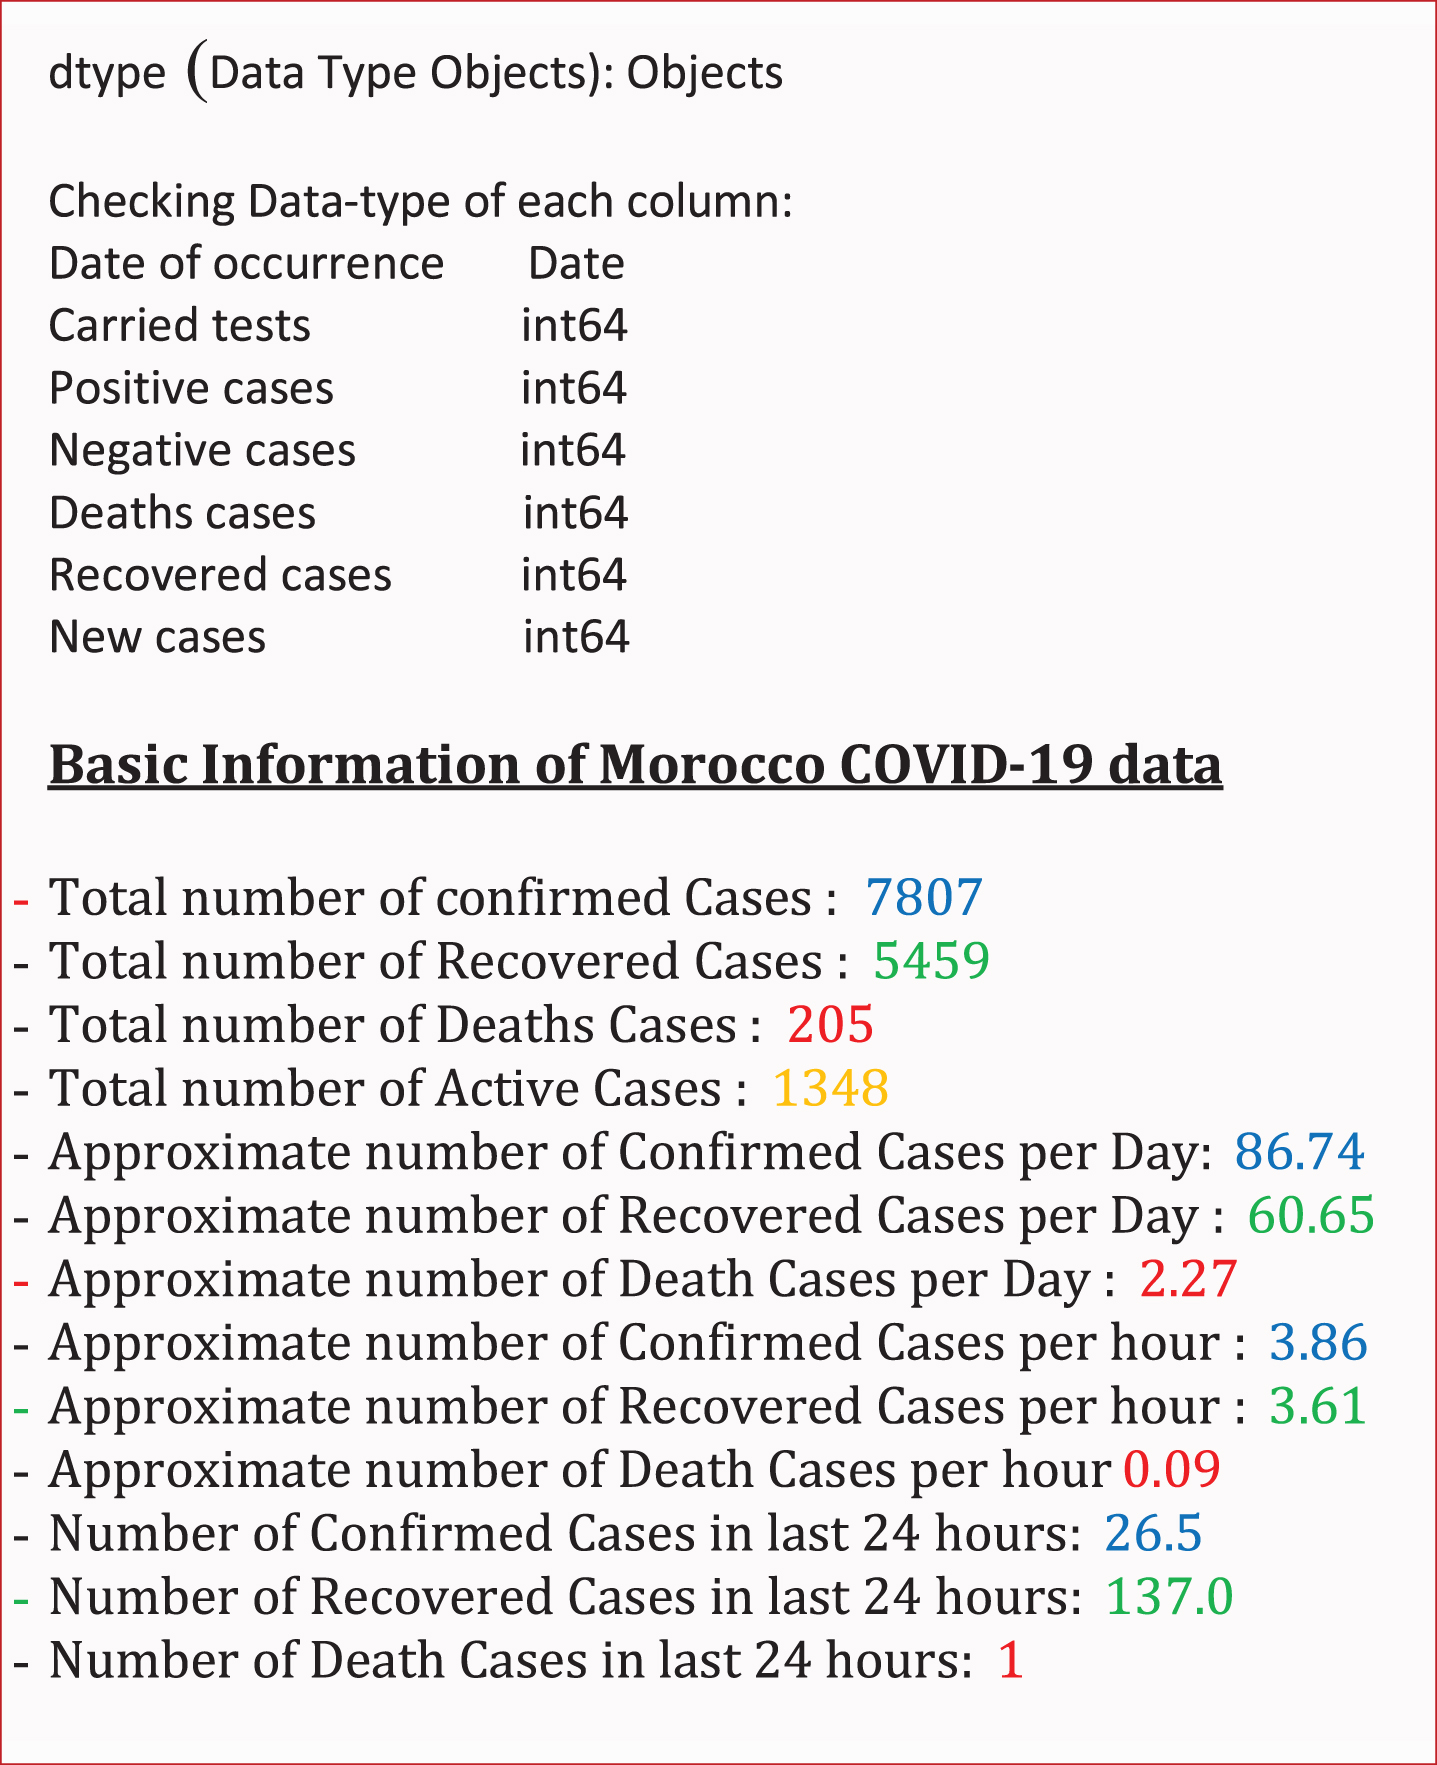
Fig. 17
ARIMA model for daily time series code.
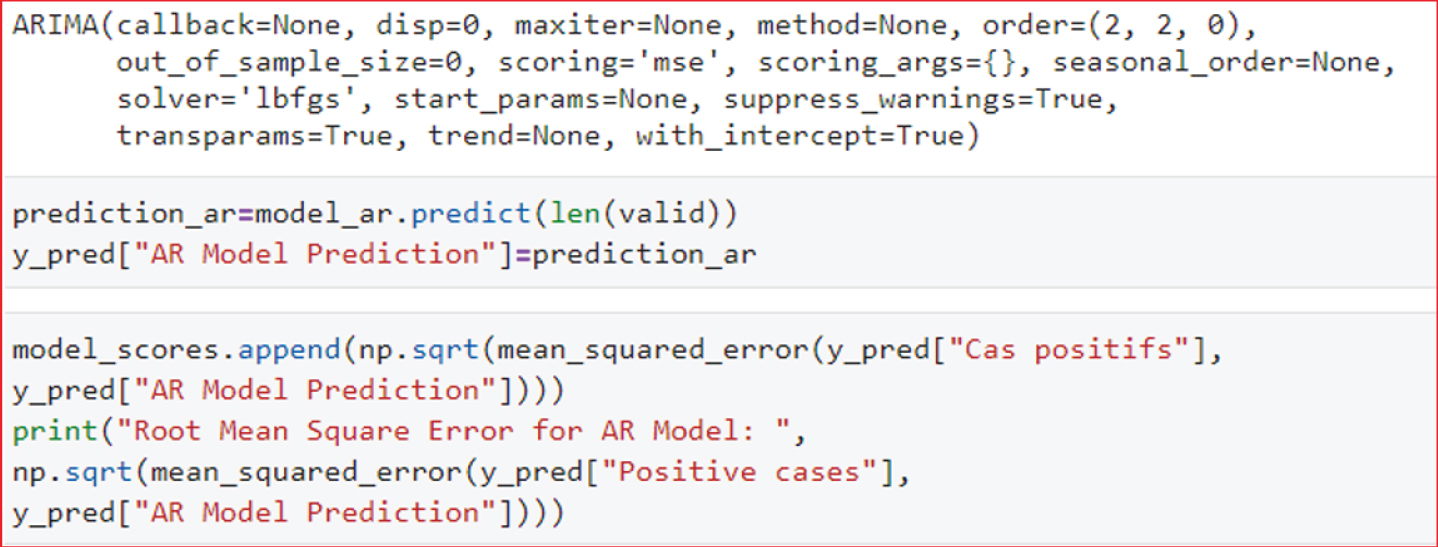
Fig. 18
Holt-Winters model for daily time series code.
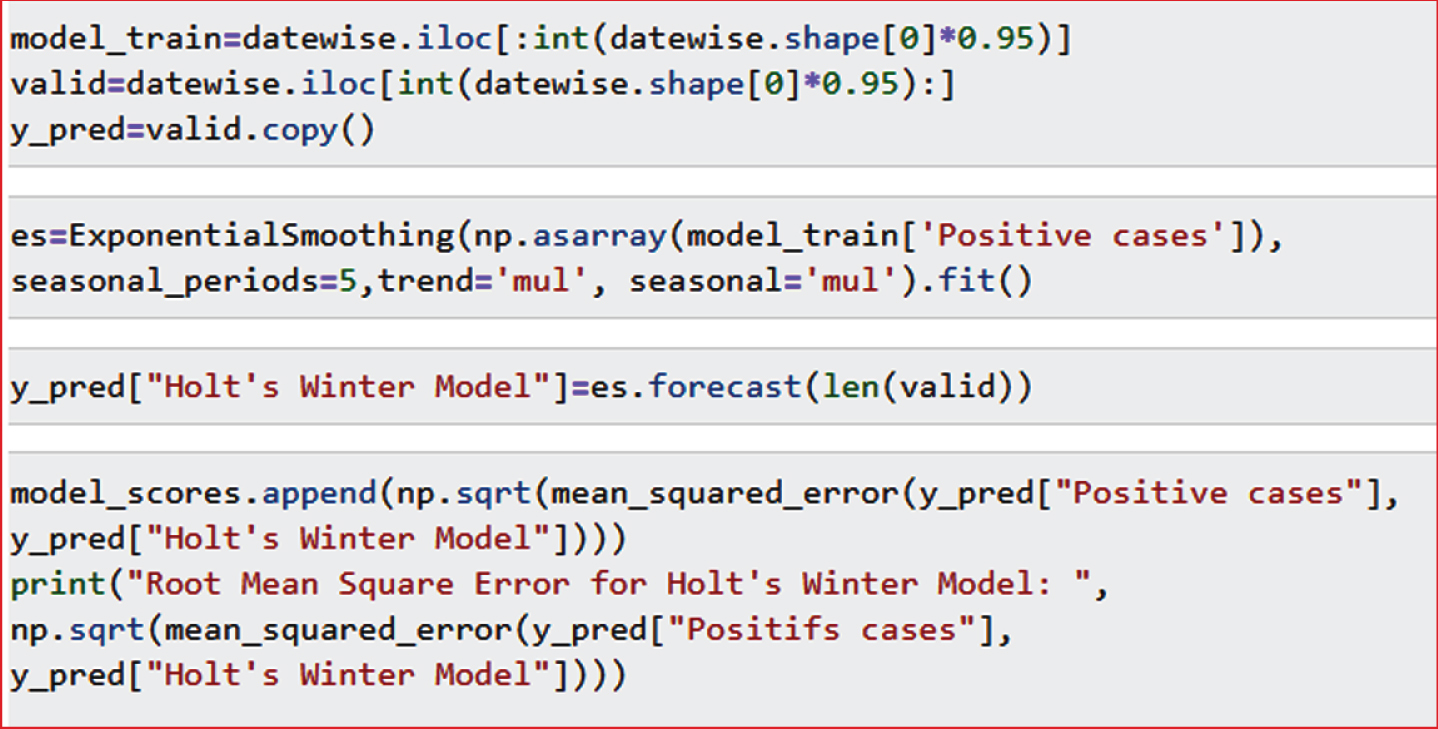
Fig. 19
Evolution of number of performed tests of COVID-19 in Morocco.
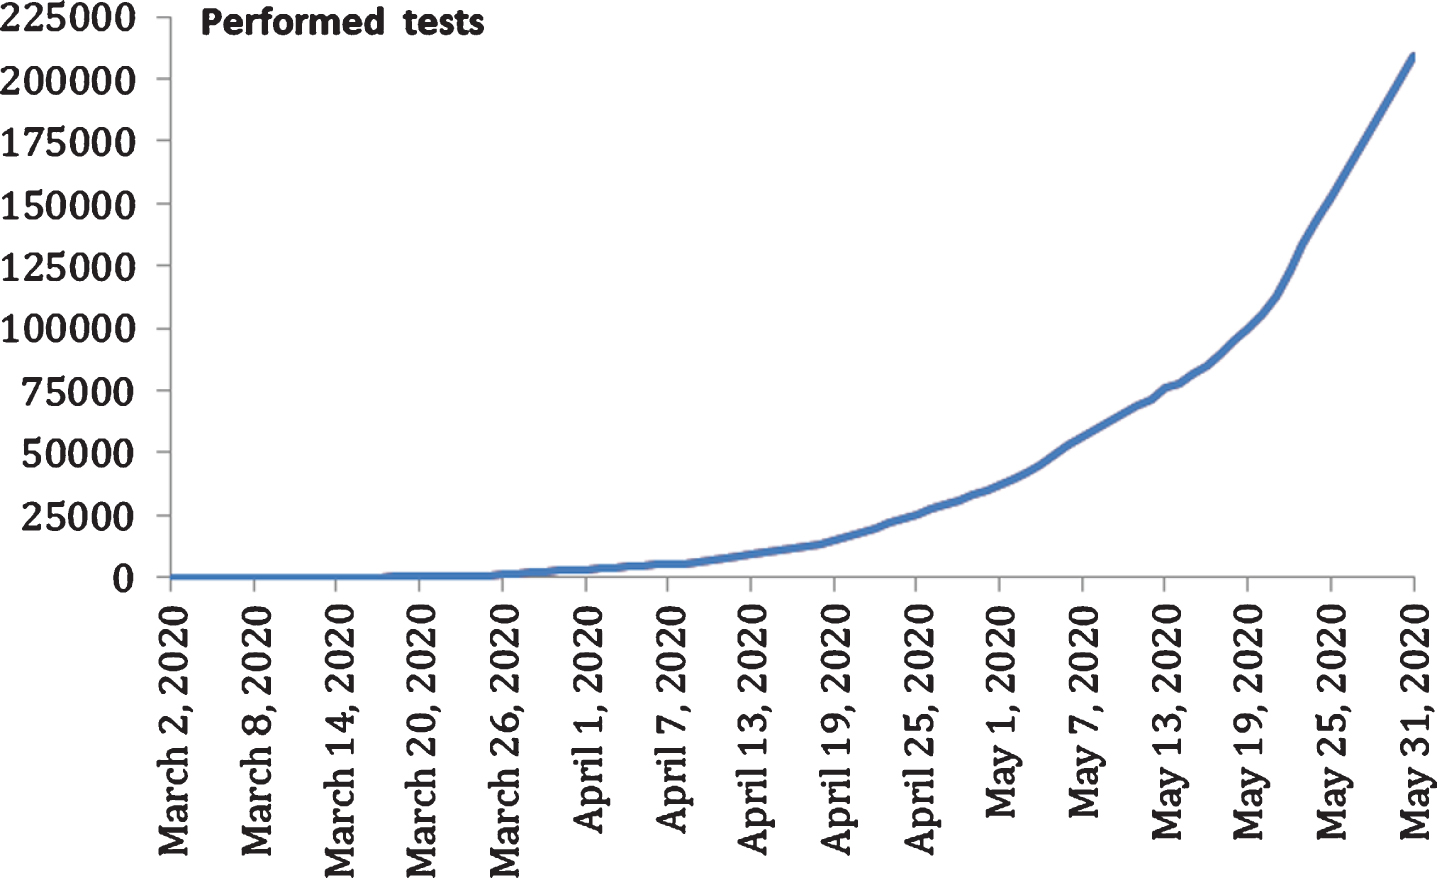
Fig. 20
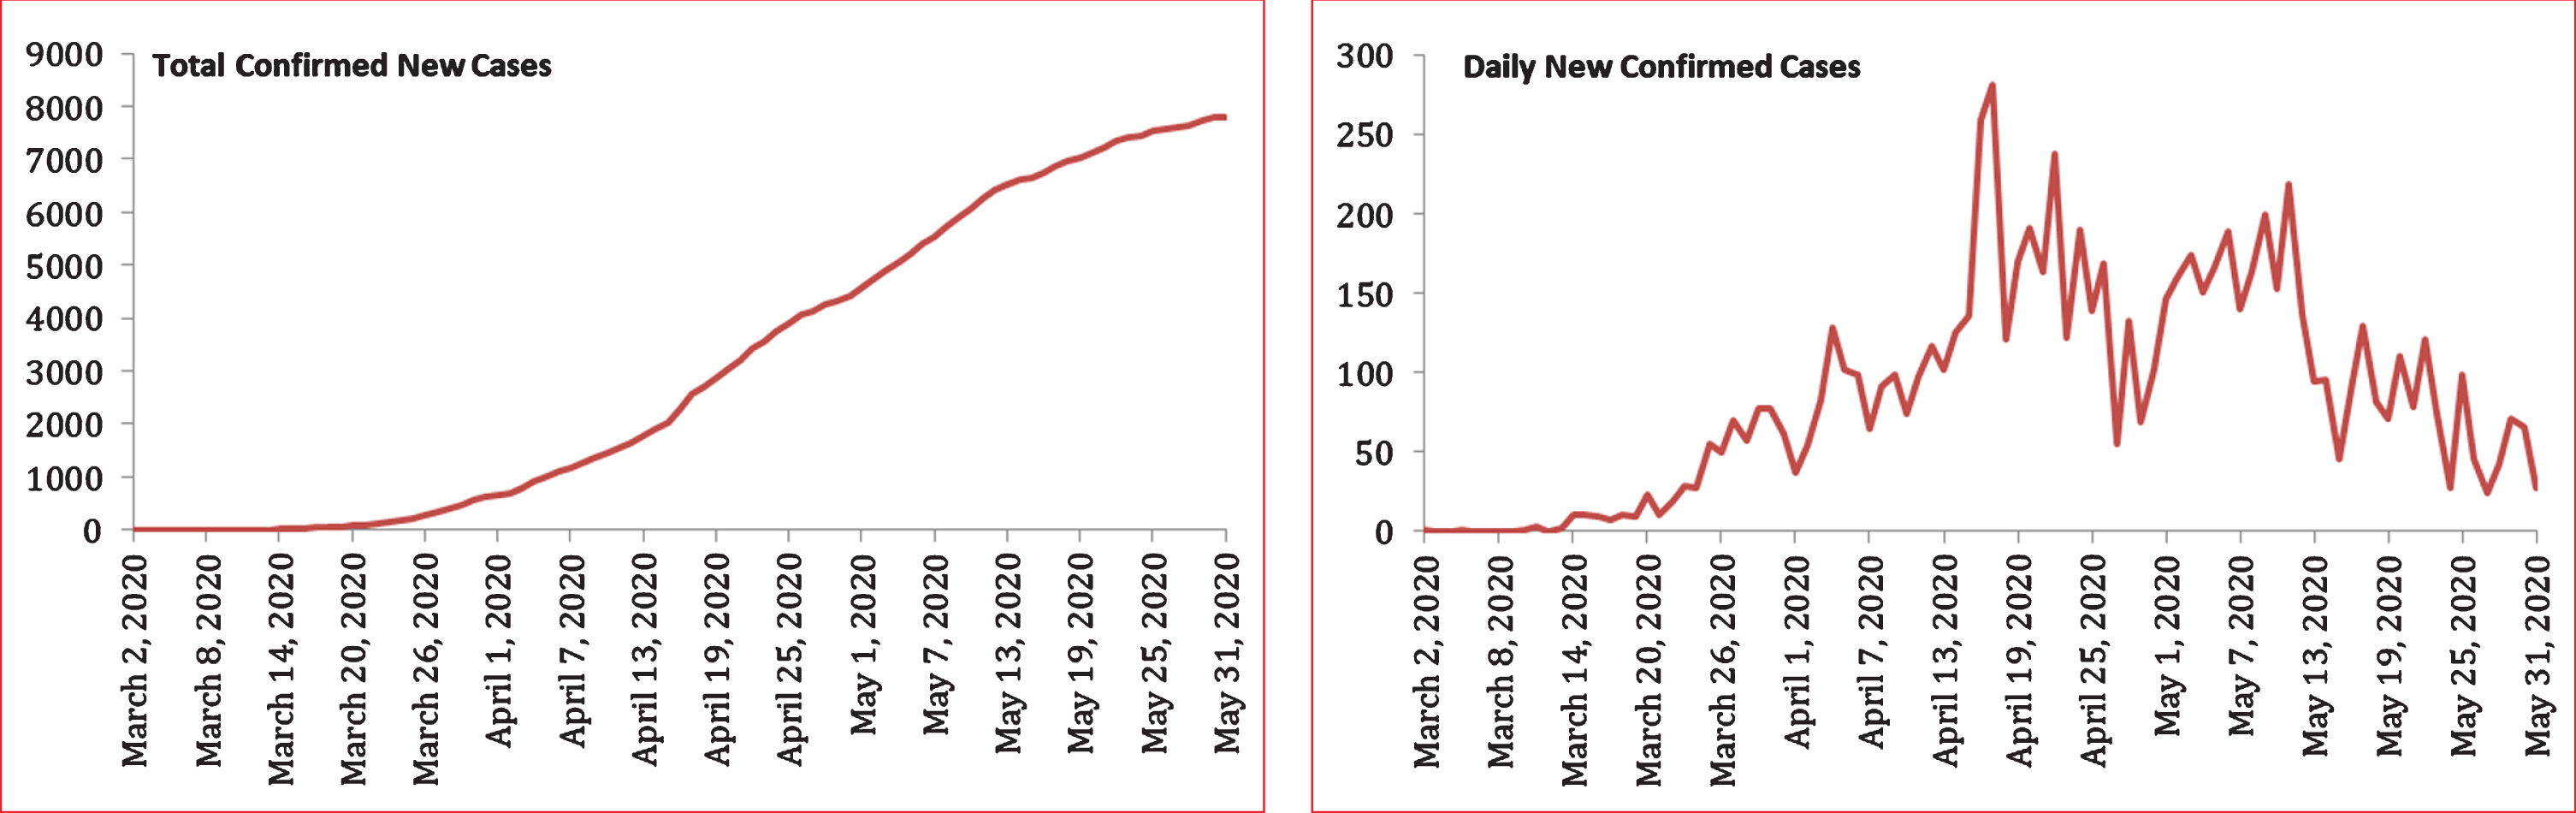
Evolution of total number of daily new cases of COVID-19 in Morocco.
• Touch screen for the GG application where passengers are required to fill out the check up form before going inside the protected area.
• HD camera to retrieve the plate numbers of vehicles passing through the system and implement it in the GG application database automatically.
• Thermal camera to check the passengers’ temperature with an automatic alert to flag passengers with high fever.
The purpose of this system is to limit the spread of COVID-19 between areas, especially that this virus does not move by itself but only through infected people and contaminated surfaces.
3.3Multi-purpose drones
The use of multifunction drones in areas with high risk of infection can ensure easy and safe distant interventions using these steps:
• Control and supervise people’s mobility by using their flags’ color.
• Use of drones with thermal camera in public areas to identify people with high fever. Same drones will have HD camera for distant flags’ color control.
• Drones with speakers can be used for educational campaign about the pandemic and delivering warnings such as people not wearing masks or not respecting social distancing.
• Drones can be used for sanitizing of small areas, objects, and people.
• Drones can deliver food such as small meals and medication to people in confinement.
4Predictive analysis methods and results
Predictive analysis by the proposed expert system is one of AI models and algorithms. It is used to analyze data and statistics in order to extract predictions or predictive models.
4.1Anaconda-based prediction model
Anaconda is an open source platform for Python and applied R programming languages dedicated to data science and ML such as large scale data processing and predictive analysis [48].
Predictive analysis by Anaconda requires the availability of data in which we can operate our algorithms such as DL to predict the current trends of certain parameters and future events of COVID-19. For example, by several parameters, a DL model can predict the probability that a citizen cannot be infected and preserving citizens’ health and work.
In this expert system, other parameters of COVID-19 can be predicted and analyzed by other algorithms adapted to the DL model, such as: risk of spread, rate of spread, rate of contamination in different regions, cities, and districts in a country. It will also predict the numbers of recoveries, numbers of infected people, etc.
Obtaining these predicted values requires the prior adoption of a more widely used analysis architecture that is based on Anaconda as follows:
• An Anaconda development environment.
• A Jupyter Notebook.
• Familiarity with ML (BD predictive analysis neural networks).
• Neural networks which is a part of ML with a sigmoid function to match inputs (e) to outputs (s) applied logistic function given by:
(1)
To obtain good analyzed and predicted output, it is necessary to go through these steps:
Table 1
| Step 1 | Data pre-processing |
| Step 2 | Separate training and test data |
| Step 3 | Transforming data |
| Step 4 | Building the artificial neural network |
| Step 5 | Executing test forecasting |
| Step 6 | Confusion matrix check |
| Step 7 | Making a unique prediction |
| Step 8 | Improve model accuracy |
| Step 9 | Added stall regularization to combat over-fitting |
| Step 10 | Setting the hyper parameters |
4.2Spark-ML and ML-library (ML-Lib) classification parameters
The predictive model developed by this research team for this expert system to be applied to GG application data. This will be based on the implementation of these three algorithms: logistic regression, decision tree, and neural networks.
So, to define the problem and data, we need to apply these three algorithms to this data to be able to analyze the problem. We will also conduct all the classifier experiments using the Spark-ML and ML- Lib. Thus, to evaluate the classification results, we will identify several prediction parameters as follows:
4.2.1Evaluation of models
The performance measure is how we want to evaluate a solution to the problem of COVID-19. This is the measure we will predict by a model driven by the test dataset.
4.2.2Training and test data
In order to examine the performance of a prediction algorithm, we must have a test data. The idea is to divide our dataset into two parts: a first training trial, and a second test trial. In addition, the model will be trained to perform the classification task from the training data. The data test will intervene to calculate the accuracy of the model. In this case, we have a set of data extracted from the GG application database. Finally, we can randomly use 70% of the data for the trial part and 30% for the test trial.
4.2.3The confusion matrix
The confusion matrix or contingency table is a tool for measuring the performance of a ML model by checking how often its predictions are accurate in relation to the reality of classification problems. It reflects the effectiveness of the classification by grouping: the true positive and the false positive (respectively true negative and false negative) [49].
• A true positive (TP) is a result where the model correctly predicts the positive class.
• A true negative (TN) is a result where the model correctly predicts the negative class.
• A false positive (FP) is a result where the model incorrectly predicts the positive class.
• A false negative (FN) is a result where the model incorrectly predicts the negative class.
Each column of the matrix represents the number of occurrences of an estimated class, while each row represents the number of occurrences of an actual class. When these classes are not balanced, the confusion matrix and the error rate often give a false idea of the quality of learning. The horizontal axis represents the predicted variables while the vertical axis represents the real variables.
In this work, this research team describes the predicted values of our dataset as positive and negative and the actual values as True and False. For classification problems with three or more classes, it is also possible to use a Matrix Confusion by adding rows and columns.
4.2.4Performance evaluation
This performance will be evaluated by taking into consideration some of the evaluation parameters that are used to predict whether or not an individual is positive for COVID-19 with respect to the measurement of sensitivity, accuracy, specificity and error rate. Here, the term “accuracy” is measured by the ratio of correctly predicted cases to the total number of cases which is mathematically written as:
(2)
We also define three other parameters that will allow us to describe the efficiency of COVID-19 parameters.
Precision: This refers to the exact proportion of predicted or classified data. It measures the ability of the system to reject incorrect measures.
(3)
Recall: This measurement determines from all the positive examples, how much the classifier to qualify as correct fractions. It measures the ability of the system to give relevant solutions
(4)
FScore: It reports the quality of a classification according to the classes, but does not take into account the possible imbalance between the classes (does not take into account the false negatives)
(5)
Receiver Operating Characteristic (ROC) curve: It is a graph representing the performance of a classification and prediction model of COVID-19 for all classification thresholds. This curve plots these two items:
• Rate of true positives
• Rate of false positive
True Positive Rate (TPR) is the equivalent of the recall. It is therefore defined as follows:
(6)
The false positive rate (TFP) is defined as follows:
(7)
4.3Future work for Spark ML-lib analysis of collected data in the GG application
The next step will be devoted to the collection application of COVID-19 data provided by the users of the GG application from the online consultation. This dataset will improve the accuracy of the applied ML algorithms. In this contribution, we explore, from a computational perspective, the expanding body of Spark ML-lib Apache as an open source, distributed, scalable, and platform-independent ML library. Specifically, processing COVID-19 collected data using in real-time the BD and the ML algorithms. The goal is to predict the evolution of people likely to be infected by contact with COVID-19 carriers in this pandemic.
This data set contains the Personal Information Input (First name, last name, sex, date of birth, national identity, nationality, email address, phone number, address, type of work, employer, workplace.), the Symptom Identification Input (Fever, cough, respiratory problems, sore throat, runny nose, headache, diarrhea, loss of smell or tasting, no symptoms) and the feedback about the Risk Factors (contaminated person, if any COVID-19 test was completed, traveling means), as was mentioned in section 3.
4.4Test of prediction using machine learning models
To show the efficiency of this work on COVID-19 as it was mentioned in the method’s section, the predictive analysis by ML models will be applied to collect data. The GG application data includes (35 columns). Meanwhile, we will present a test with results on a COVID-19 in Morocco database (6 columns) considered as an example test (Fig. 15). The database COVID-19 tests in Morocco contains the information on the number of total confirmed cases, number of infected cases, number of deaths in Morocco between the period of March 2, 2020 and May 31, 2020.
The methodology of prediction and analysis by modelled ML, proposed for COVID-19 in Morocco is the same as the one that will be applied on the data that will be collected via GG application. At the end, we compared the prediction results obtained by different models to get the optimal results in terms of efficiency and accuracy. The experiments will be carried out on the test machine configuring the Intel (R) Core (TM) i7 processor with 8GB of RAM running under the Windows 64-10 bit operating system as well as ML libraries based on Python programming.
This section presents some models that this research team has proposed to predict certain parameters linked to the COVID-19 test database concerning its evolution in the regions of Morocco between March 3, 2020 and May 31, 2020. Table 3 therefore recapitalizes the prediction results provided by the 5 models mentioned in this table. This is for example the prediction of the number of people infected by this virus five days following the day of May 31, 2020. Other results concerning the error rates of these models are presented in Table 2, it indicates the efficiency and the precision of these 5 models (Tables 2 and 3).
Table 2
Predicted confirmed cases using six prediction models in Morocco
| Date | Linear regression prediction | Polynomial regression prediction | SVM prediction | Holt’s linear model prediction | Holt-Winters model prediction | AR model prediction |
| June 1, 2020 | 7843,3 | 7148 | 15701,6 | 7942.9 | 8028,4 | 7955,6 |
| June 2, 2020 | 7947,3 | 6947,7 | 16537,1 | 8029.3 | 8082,2 | 8020,9 |
| June 3, 2020 | 8051,4 | 6691,8 | 17409,7 | 8115.8 | 8135,9 | 8086,8 |
| June 4, 2020 | 8155,5 | 6372 | 18320,7 | 8202.3 | 8231,5 | 8153,5 |
| June 5, 2020 | 8259,5 | 5979,3 | 19271,3 | 8288.8 | 8293,5 | 8220,9 |
| June 6, 2020 | 8363,6 | 5503,5 | 20262,8 | 7942.9 | 8396,1 | 8289,1 |
Table 3
Mean squared error for many prediction models in Morocco
| Model name | Root mean squared error |
| Holt-Winters model | 52.5 |
| Auto Regressive Model (AR) | 90.3 |
| Linear regression | 191.3 |
| Polynomial regression | 304.7 |
| Support vector machine regressor | 5805.1 |
| Holt’s linear model | 5805.1 |
Initially we noted from this seasonal data from COVID-19, that the problem of this pandemic is practically a non-linear problem, which requires testing several prediction models. Based on the analysis and comparison of the results provided by these models, we can observe that the Auto Regressive Model (Fig. 18) and the Holt’s Linear Model Prediction (Fig. 17) are the most efficient model that could be used in the prediction of certain parameters for a database similar to what we have exploited in this research.
Selecting these two models, particularly the Auto Regressive Model is justified by the correct prediction of the number of infected persons during the days of June 5, 2020 that is 8289 cases (Table 2) with an error rate of 53.02 (Table 3). This confirms of what is actually is happening in Morocco. Moreover, we did not use the neural network model in this study because the neural networks will be used in the analysis of the next GG application databases that includes 35 columns or characteristics. This will allow us to predict the areas and that will face a widespread of the virus and its speed rates based on the GG application parameters.
5Putting everything into perspective
Countries around the world are doing everything in their power to tackle COVID-19 since there is no vaccine nor a specific medication for it. However, to tackle COVID-19 effectively, countries must use science and scientific data. The WHO stated that COVID-19 would stay with us for at least 2 years [48]. Countries are bracing themselves for a second wave of COVID-19 in the fall of 2020. CDC Director Robert Redfield told the Washington Post last April in an interview, “There’s a possibility that the assault of the virus on our nation next winter will actually be even more difficult than the one we just went through” [50].
The world still remembers what happened during the 1918 influenza pandemic and no one wants to relive that experience. The world witnessed 3 waves of that deadly influenza within one year. The first wave was in the spring of 1918, the second wave was in the fall of 1918, and the third one was in the winter of 1918. This resulted in at least 50 million deaths worldwide, which was more than the World War 1 deaths of civilians and military deaths [51].
6Conclusion
This developed expert system using BD and AI will effectively in a preventative way assist in combating the spread of COVID-19 and similar contagious diseases. The GG application is an adapted simplified model, which allows easy access to various information about COVID-19. It also permits citizens to do an online checkup, which will display their infection risks. Checkup database information will be collected to allow governments to have a precise vision on the pandemic situation and the state of the spread of COVID-19 using predictive analysis adapted model. This allows concluding indicators to apply preventative confinement in high risk areas of infection and to keep open low risk areas. This can be applied with other solutions, such as people and vehicles sanitizing system, multi-purpose drones, and other solutions that can be added to this expert system. This integrated expert system will facilitate keeping the pandemic situation under control and optimizing the governments’ resources. It will also minimize the impact on the economy by allowing people to continue working safely or go back to work in a safe and faster manner utilizing the flag color indicators for people and areas.
Our expert system is a preventative measure applied on people who are suspected to be infected while the contact tracing applications are used on confirmed infected people. In addition, our expert system is more accurate even with a small percentage of applicants compared to contact tracing applications.
The concept of this expert system can also be applied to other contagious diseases in the future.
Conflict of interest
None to report.
Acknowledgments
We would like to thank Prof. Najat Rafalia, Prof. Outman Abdoun, Prof. Mohamed Amnai, Prof. Youssef Fakhri, Prof. Ilyas Zouheir, Dr. Mohammed Sebati, Dr. Jihane Laafi, Mr. Marcello Galvan, Mrs. Jihane Chaibat, Mr. Youssef Azizi and all the members of the Big Data, Robotic, AI & BI Club of the Ibn Tofail University, Kenitra, Morocco for their support. We would furthermore like to thank Kimberly Putnam an OT student at American International College, USA for assisting in the literature review.
References
[1] | Ren SY , Gao R , Chen YL . Fear can be more harmful than the severe acute respiratory syndrome coronavirus 2 in controlling the corona virus disease 2019 epidemic. World Journal of Clinical Cases. (2020) ;8: (4):652–7. |
[2] | Usher K , Durkin J . The COVID-19 pandemic and mental health impacts. International Journal of Mental Health Nursing. (2020) ;29: :315–8. |
[3] | Guo YR , Cao QD , Hong ZS , Tan YY , Chen SD , Jin HJ , Tan KS , et al. The origin, transmission and clinical therapies on coronavirus disease (COVID-19) outbreak-an update on the status. Military Medical Research. (2020) ;7: (1):11. |
[4] | International Labor Organization. ILO Monitor. Covid-19 and the world of work. Fourth edition updated estimates and analysis 2020. [Online]. Available from: https://www.ilo.org/wcmsp5/groups/public/—dgreports/—dcomm/documents/briefingnote/wcms_745963.pdf |
[5] | U.S. Bureau of Labor Statistics. Unemployment rate rises to record high 14.7 percent in April 2020. [Online]. Available from: https://www.bls.gov/opub/ted/2020/unemployment-rate-rises-to-record-high-14-point-7-percent-in-april-2020.htm. |
[6] | Kretchmer H . How coronavirus has hit employment in G7 economies.World Economic Forum. 2020. [Online]. Available from: https://www.weforum.org/agenda/2020/05/coronavirus-unemployment-jobs-work-impact-g7-pandemic/. |
[7] | He L , Gan N . 80 million Chinese may already be out of work. 9 million more will soon be competing for jobs, too. CNN Business. 2020. [Online]. Available from: https://www.cnn.com/2020/05/08/economy/china-unemployment-intl-hnk/index.html. |
[8] | Eurostat. Unemployment statistics. 2020. [Online]. Available from: https://ec.europa.eu/eurostat/statisticsexplained/index.php/Unemployment_statistics#Unemployment_in_the_EU_and_the_euro_area |
[9] | Work-related musculoskeletal disorders & ergonomics. 2016. [Online]. Available from: https://www.cdc.gov/workplace. |
[10] | Moyers PA , Dale LM . Challenges and opportunities for the older worker. Work: Journal of Prevention, Assessment & Rehabilitation. (2004) ;22: (2):69. |
[11] | Prevent worker exposure to coronavirus (COVID-19) United States Department of Labor. 2014. [Online]. Available from: https://www.osha.gov/Publications/OSHA3989.pdf |
[12] | Centers for Disease Control and Prevention [CDC]. Work-related musculoskeletal disorders & ergonomics. 2016. [Online]. Available from: https://www.cdc.gov/workplacehealthpromotion/health-strategies/musculoskeletal-disorders/index.html. |
[13] | Sousa-Uva A . Hospital nurses tasks and work-related musculo skeletal disorders symptoms: A detailed analysis. Work. (2015) ;51: (3):401. |
[14] | Passali C , Maniopoulou D , Apostolakis I , Varlamis I . Work-related musculoskeletal disorders among greek hospital nursing professionals: A cross-sectional observational study. Work. 2018:1-10. |
[15] | Tariah HA , Nafai S , Alajmi M , Almutairi F , Alanazi B . Work-related musculoskeletal disorders in nurses working in the Kingdom of Saudi Arabia. Work. 2020:421-8. |
[16] | Occupational Safety and Health Administration [OSHA]. COVID-19 - Control and Prevention /Healthcare Workers and Employers 2020. [Online]. Available from: https://www.osha.gov/SL TC/covid-19/healthcare-workers.html. |
[17] | Public Health England. Guidance on infection prevention and control for COVID-19. Sustained community transmission is occurring across the UK. 2020. [Online]. Available from: https://www.gov.uk/government/publications/wuhan-novel-coronavirus-infection-prevention-and-control. |
[18] | Cheng C , Cheung MW . Psychological responses to outbreak of severe acute respiratory syndrome: A prospective, multiple time-point study. Journal of Personality. (2005) ;73: (1):261–85. |
[19] | Bernard M . Coronavirus: how artificial intelligence, data science and technology is used to fight the pandemic. April 2000. [Online]. Available from: https://www.forbes.com/sites/bernardmarr/2020/03/13/coronavirus-how-artificial-intelligence-data-science-and-technology-is used-to-fight-the-pandemic/ |
[20] | Park SE . Epidemiology, virology, and clinical features of severe acute respiratory syndrome -coronavirus-2 (SARS-CoV-2; Coronavirus Disease-19). Clin Exp Pediatr. (2020) ; 63: (4):119–24. doi:10.3345/cep.2020.00493 |
[21] | Kadhim MA , Alam AM , Kaur H . Design and implementation of intelligent agent and diagnosis domain tool for rule-based expert system. International Conference on Machine Intelligence and Research Advancement. 2013; DOI: 10.1109/ICMIRA.2013.129 |
[22] | Dragulescu D , Albu A . Expert system for medical predictions. 4th International Symposiumon Applied Computational Intelligence and Informatics. 2007;DOI: 10.1109/SACI.2007.375496. |
[23] | Tkatek S , Abdoun O , Abouchabaka J . An expert system for a constrained mobility management of human resources. International Colloquium on Logistics and Supply Chain Management (LOGISTIQUA) Rabat; 2017 :pp 53-58. [Online]. Available from : https://ieeexplore.ieee.org/document/7962873 |
[24] | Singh D , Reddy CK . A survey on platform for big data analytics. Journal of Big Data. (2015) ;2: (1):1–20. |
[25] | Almeida PDC , Bernardino J . Big data open source platforms in Proc. IEEE International Congress on Big data. 2015: 268-75. |
[26] | Sivarajah U , Kamal MM , Irani Z , Weerakkody V . Critical analysis of Big data challenges and analytical methods. Journal of Business Research. (2017) ;70: :263–86. |
[27] | Turning Big Data Into Big Knowledge, Predictive Analysis, 2013. https://markmanforever.wordpress.com/2013/10/29/turning-big-data-into-big-knowledge-pt-2/ |
[28] | Yanwen X , Chetwyn CH , Karen HY , Dan T . Prediction model for the return to work of workers with injuries in Hong Kong. Work. (2008) ;30: (1):77–84. |
[29] | Ratner B , Day S , Davies C . Statistical and machine-learning data mining: techniques for better predictive modeling and analysis of big data. DOI: https://doi.org/10.1201/b11508 |
[30] | Barga R , Fontama V , Tok W . Cortana analytics: in: predictive analytics with microsoft azure machine learning. Apress, Berkeley, (2015) CA. |
[31] | Justin C . Advanced next best offer marketing using predictive analytics. Applied Marketing Analytics. AUTUMN/FALL. (2015) ;1: (4):363–376(14). |
[32] | Shaw R , KDnuggets. The 10 machine learning algorithms to master for beginners. [Online]. Available from: https://ecmapping.com/2018/02/21/the-10-machine-learning-algorithms-to-master-for-beginners/ |
[33] | Chotchaung V , Bamrungsi E , Rodcheewit T . Big data, predictive analytics and machine learning. 6th International Conference on ICT and Knowledge Engineering (ICT&KE), Nov 2018; DOI: 10.1109/ICTKE.2018.8612393 |
[34] | Musumeci F , Rottondi C , Nag A , Macalusa I , Zibar D , Ruffini M , et al. An Overview on application of machine learning techniques in optical networks. IEEE Communications Surveys & Tutorials. 21: (2):1383–1408, Secondquarter 2019, doi: 10.1109/COMST.2018.2880039 |
[35] | Marsland S . Machine learning: an algorithmic perspective. 2014, DOI:10.1201/b17476 Corpus ID: 64009374. |
[36] | Lu X , Zhao M , Qiao L , Chi N . Non-linear compensation of multi-CAP VLC system employing pre distortion base on clustering of machine learning in optical. Mar, 2018, Fiber Communications Conference (OFC). |
[37] | Rashmi YL , Metkewar PS . Bibliometric survey on clustering Algorithm of ML and its application. 20 International Journal Of Scientific & Technology Research. volume 9, issue April 2020, ISSN 2277-8616, 2671. |
[38] | Borga K , Hensingb G , Alexandersonc K . Prediction of future low levels of sickness absence among young person’s sick listed with back, neck, or shoulder diagnoses. Work. (2004) ;23: :159–167 159. |
[39] | Teresa C , Gabriel S , Paula F , Raquel B , Júlia T , Nuno P . Measuring psychosocial factors and predicting work ability among cemetery workers (2020). DOI: 10.3233/WOR-193063 Citation: Work. 65: (1):111–119. |
[40] | Vela AP , Shariati B , Ruiz F . Cugini, F. Castro A, Lu H, et al. Soft failure localization during commissioning testing and lightpath operation IEEE/OSA Journal of Optical Communications and Networking. (2018) ;10: (1):A27–A36. |
[41] | Wen Z , Shi J , He B , Chen J , Ramamohanarao K , Li Q . Exploiting GPUs for efficient gradient boosting decision tree training. Journal IEEE Transactions on Parallel and Distributed Systems Dec. (2019) ;30: (12):2706–17. |
[42] | Bengio Y , Courville A , and Vincent P . Representation learning: A review and new perspectives. IEEE Trans Pattern Anal Mach Intell. (2013) ;35: (8):1798–828. |
[43] | Adams C , Alrashed M , Anthony J , Asaadi J , Ashkenazi A , Zhang C . Deep neural network for pixellevel electromagnetic particle identification in the MicroBooNE liquid argon time projection chamber. Physical Review D. (2019) ;99: (9). DOI: 10.1103/PhysRevD.99.092001 |
[44] | Saporito G . How does a neural network make predictions? 2019. [Online]. Available from: https://towardsdatascience.com/how-does-a-neural-network-make-predictions. |
[45] | Hyndman RJ , Athanasopoulos G . Forecasting: principles and practice (2018), 2nd edition. [Online]. Available from: OTexts.com/fpp2. |
[46] | Tkatek S , Abdoun O , Abouchabaka J , Rafalia N . A hybrid genetic algorithms and sequential simulated annealing for a constrained personal reassignment problem to preferred posts. International Journal of Advanced Trends in Computer Science and Engineering. (2020) ;9: (1). |
[47] | Tkatek S , Abdoun O , Abouchabaka J , Rafalia N . An optimizing approach for multi constraints reassignment problem of human resources. International Journal of Electrical and Computer Engineering. (2016) ;6: (4). |
[48] | Assefi M , Behravesh E , Liu G . Big data machine learning using apache spark MLlib. December 2017; DOI: 10.1109/Big Data.2017.8258338 |
[49] | William W , Carolyn YJ . Coronavirus may never go away, even with a vaccine. TheWashington Post [Internet]; Coronavirus :[about 9 p]. Available from: http://www.washingtonpost.com/health/2020/05/27/coronavirs-endemic/?outputType=amp. |
[50] | Sun LH . CDC director warns second wave of coronavirus is likely to be even more devastating. The Washington Post [Internet]. 2020 April 2; [cited 2020 June 5] Health: [about 2 p.]. Available from: https://www.washingtonpost.com/health/2020/04/21/ |
[51] | Centers for Disease Control and Prevention [CDC]. 1918 pandemic Influenza: ThreeWaves 2018.[Online]. Available from: https://www.cdc.gov/flu/pandemic-resources/1918-commemoration/three-waves.htm. |


