
The importance of including position and viewing direction when measuring and assessing the lighting conditions of office workers
Abstract
BACKGROUND:
Light and alertness studies have applied different measurement methodologies to determine lighting conditions. However, it has been demonstrated that researchers rarely measure or describe the lighting conditions of their studies in sufficient detail to generalize conclusions or derive universal guidelines.
OBJECTIVE:
Part I of this paper summarizes the current measurement methodologies used in light and alertness studies to potentially identify methodological issues. Part II determines the differences in lighting conditions for different viewing directions within an office environment.
METHODS:
A literature review (part I) and both experimental studies and an observational study (part II) were undertaken in this study.
RESULTS:
Part I demonstrates that most light and alertness studies include photometric quantities; however, it is recommended that one should measure radiometric quantities as well. Further, the light measurements should be performed at the individual level. Part II demonstrates large differences in lighting conditions between viewing directions. For example, when looking toward the window, vertical illuminances were at least 12 times higher when compared to looking in the opposite direction.
CONCLUSIONS:
Our findings suggest that when analysing or designing an office environment, office workers’ positions and viewing direction should be included in the determination of personal lighting conditions.
1Introduction
From prior research, we know that levels of alertness correspond to the health and performance of office workers [1]. Alertness can be influenced by many factors, including office lighting, which can impact one’s visual comfort [2], work performance [3], and health [4]. The relevance of this research concerns the effect that office lighting has on the alertness of office workers.
There is research that discusses the importance of performing light and health studies using teams of researchers drawn from different fields [5]. Since light effect studies are often utilized by researchers approaching the subject from different perspectives, it is important that investigators provide sufficient detail in their papers to further the research [5–8], specifically so that studies can be repeated and compared. In addition to describing each study in sufficient detail, it is also recommended that researchers measure exact lighting conditions as comprehensively and precisely as possible to assure valid outcomes [9]. Yet, this is not always done properly: lighting conditions are often not measured continuously, and they are frequently reported as average values (i.e., averaged over time or over locations) [10]. Since all effects of light influence individuals in a particular space, the lit environment needs to be analysed at the individual level as well. Thus, lighting conditions should be measured continuously, and from the exact location of the eyes of the individual.
In this paper, light at the individual level is termed personal lighting conditions. Personal lighting conditions, defined as the light entering an individual’s eye [11], can be determined using simulations, measurements, or estimations. The most common method to determine personal lighting conditions is done by performing light measurements, either using person-bound measurements (PBM) or location-bound measurements (LBM). The various advantages and disadvantages of the PBM and LBM methods are provided in Table 1. In addition, Van Duijnhoven et al. have proposed a new practical method for determining personal lighting conditions [11, 12], using what they call a location-bound-estimations (LBE) method. LBE consists of reference measurements performed at certain reference locations (i.e., LBM), and utilizes predictive models between these reference locations and all other locations in a room for which the lighting conditions need to be determined; from this work, personal lighting conditions in all other locations in the room can be estimated. In comparison to either the PBM or the LBM method, one considerable advantage of the LBE method is its unobtrusiveness. For example, office workers are likely not to be significantly bothered by wearing a wearable measurement device [13] or by having a measurement device placed in their workstation. However, one drawback of LBE is that the approach still assumes that an office worker will always remain in the location where the lighting conditions were estimated. Thus, the actual (varying) positions and viewing directions of the individual are not included in the current LBE method. It is expected that the validity of the LBE method will increase when personal factors, such as the position and viewing direction of the individual, are included. As it pertains to lighting conditions within buildings, researchers have investigated the influence of the precise positions of workers inside office environments [14, 15]. In two such investigations, lighting conditions correlated significantly with the distance from one’s workstation to a window [14, 15], implying that variability in lighting conditions throughout an office environment would be greater for larger office landscapes. However, the influence of viewing direction on personal lighting conditions remains unknown.
Table 1
Advantages and disadvantages of person-bound measurements (PBM) and location-bound measurements (LBM), two methods used to measure personal lighting conditions, after Van Duijnhoven et al. [11]
| Advantages | Disadvantages | |
| PBM | •Continuous collection of data | •High performance errors |
| •Location of office worker included in measurements | •High cost | |
| •Burden for office workers | ||
| LBM | •Lighting conditions for all locations, all heights, and all possible viewing directions | •Office workers cannot work at those locations where the measurement instruments are placed |
The present paper provides insights for practitioners (e.g., ergonomists, facility managers, etc.) for determining, analysing, or designing the lit environment of an office worker. The paper consists of two parts: the first part provides a literature review of currently used measurement methodologies for light in light and alertness studies, and the second part discusses our research on lighting regarding the positions and viewing directions of office workers. Then, to investigate the applicability of the results of our experimental studies, we also performed an observational study. This observational study was used to determine the proportion of time a typical office worker remains at her or his workstation, as well as the direction to which she or he commonly looks.
2Part I - Literature review
This section provides a review of the literature, which was performed to obtain greater insight into current measurement methodologies in light and alertness studies. First, we discuss the methodology used for this literature review and then provide our findings.
2.1Rationale
Generally speaking, light effect studies are often investigations performed by researchers from within a single field of study (e.g., lighting researchers or occupational health researchers). It is critical, then, that the lighting conditions of these investigations are measured and described as extensively as possible so that experts outside of a particular field can utilize the research for their own work [5, 8]. In the last decade, some researchers have suggested that measuring only photometric quantities (e.g., luminous intensity, illuminance) while investigating the non-image-forming (NIF) effects of light (e.g., health, alertness, mood) is insufficient [16]. While photometric quantities are weighted to the spectral sensitivity of rods and cones to describe image-forming effects, radiometric quantities, for example, are not yet weighted; thus, they can still be weighted to other spectral sensitivities, for instance, to the spectral sensitivity function of the intrinsically photosensitive retinal ganglion cells (ipRGCs), responsible for initiating the NIF effects of light. With these types of discussions underway, the overall purpose of this literature review is to gain greater insight into the measurement methodologies in light and alertness studies currently in use. As some work here has already been done, we present this review of the literature as an extension of an earlier published review [10].
2.2Methodology
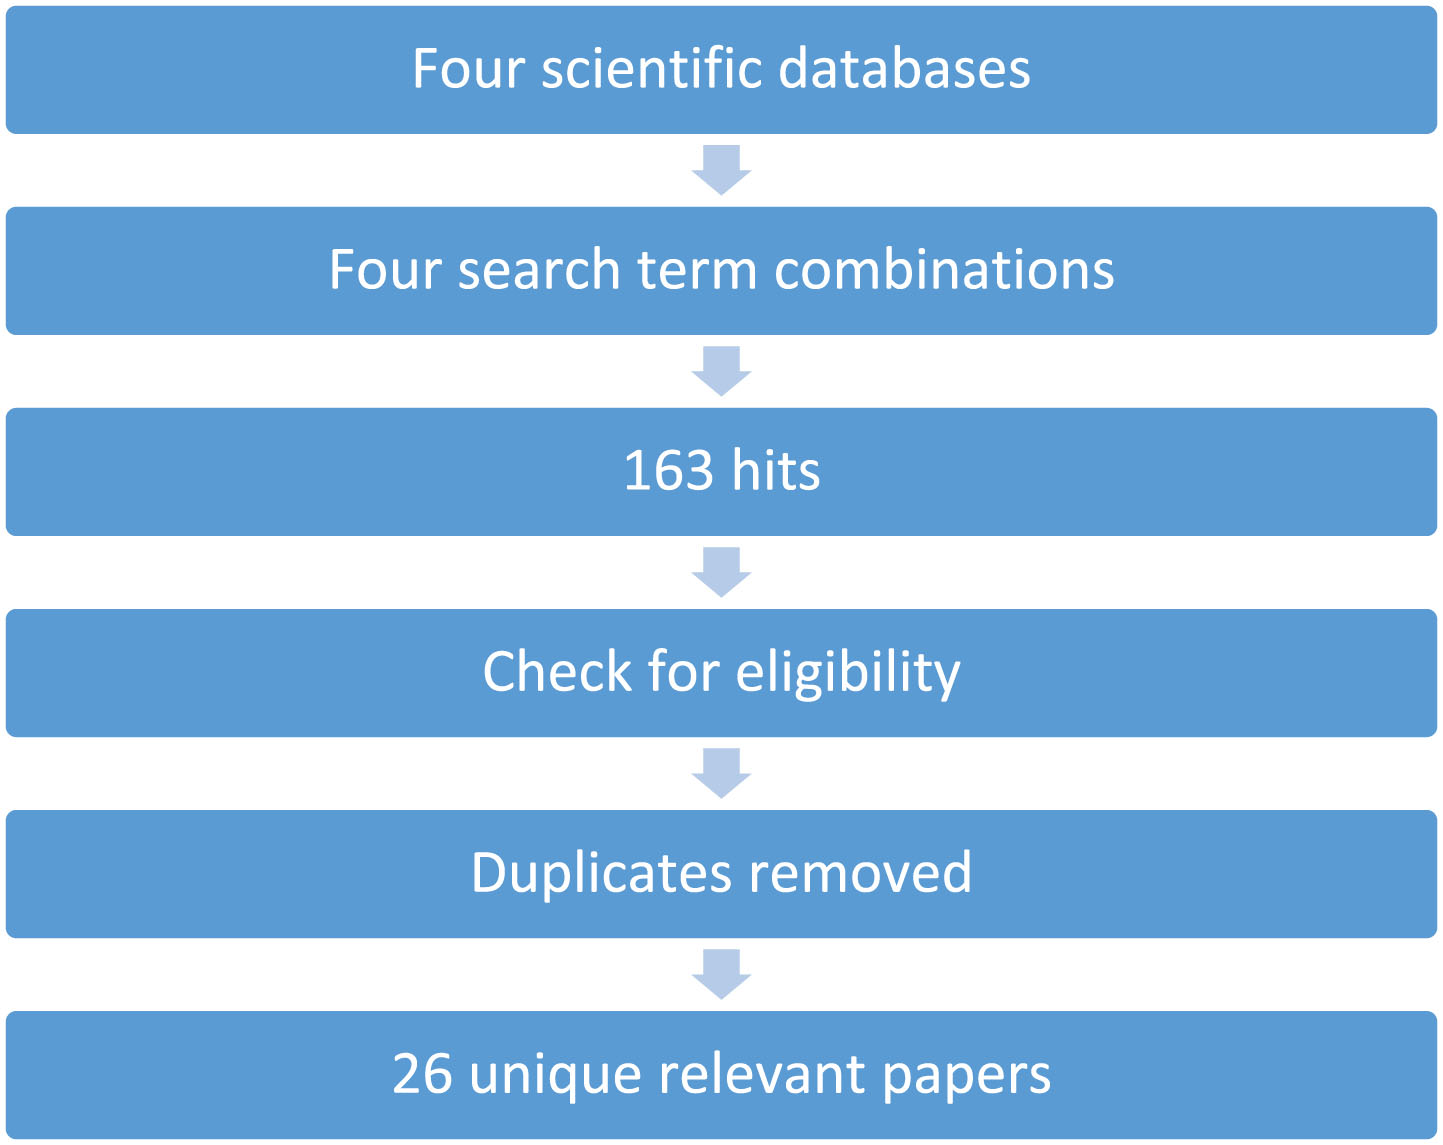
In conducting this review, we performed a literature search using the following: (1) ‘alertness’, (2) a lighting parameter (i.e., ‘lighting’, ‘daylight’, ‘light exposure’, or ‘light’), and (3) ‘office’. No restrictions were placed on the publication year. All three search terms had to be present in potentially eligible articles. These three search terms led to four possible combinations: (1) alertness – lighting – office, (2) alertness – daylight – office, (3) alertness – light exposure – office, and (4) alertness – light - office. Inputting these four search combinations into the databases ScienceDirect, Google Scholar, PubMed, and Web of Science resulted in 163 hits. Of these 163 hits, 141 were determined to be eligible articles. There were three fundamental reasons for removing the 22 articles from the eligible-articles list: the main topic deviated too far from subject of light and human performance, it was a review paper, or the full text was unavailable. Next, we removed duplicates papers from the 141 eligible articles. This resulted in a final tally of 26 relevant papers to be included in the literature review. (Fig. 1 provides an illustration of this entire process.) The final literature search was performed in October 2018.
Fig.1
Literature review: search process.
The 26 relevant papers were analysed pertaining to the following four aspects:
1. Which light aspects were measured?
2. How were the light measurements performed? I.e., what measurement instruments and which measurement method (e.g., PBM, LBM)?
3. When were the light measurements performed? I.e., what measurement interval?
4. Where were the light measurements performed? I.e., what was the type of study— field or lab? And where was the measurement location?
Our analysis of the literature recorded whether a particular light aspect was included in the research (yes or no). The results based on this data extraction are discussed below in sections 2.3.1 and 2.3.2.
2.3Results
2.3.1Which light aspects were measured?
Table 2 summarizes the particular light aspects per paper. We have chosen to present the papers in the table in chronological order, since the publication year may explain the inclusion or exclusion of certain light aspects [17]. The table also shows the extent to which various light aspects were included in the papers. The reported light quantities were categorized as radiometric quantities, photon quantities, colourimetric quantities, photometric quantities, material characteristics, psychological quantities, and other aspects. These categories included spectral power distribution (SPD), photon flux density (PFD), correlated colour temperature (CCT), colour rendering index (CRI), horizontal illuminance, vertical illuminance, luminance, daylight factor (DF), uniformity, reflectance, brightness, subjective glare, presence of daylight, and flicker. The International Commission on Illumination (CIE) has defines most of these light aspects in their lighting vocabulary [18].
Table 2
Overview of the light aspects incorporated into light effect studies, as based on the literature review
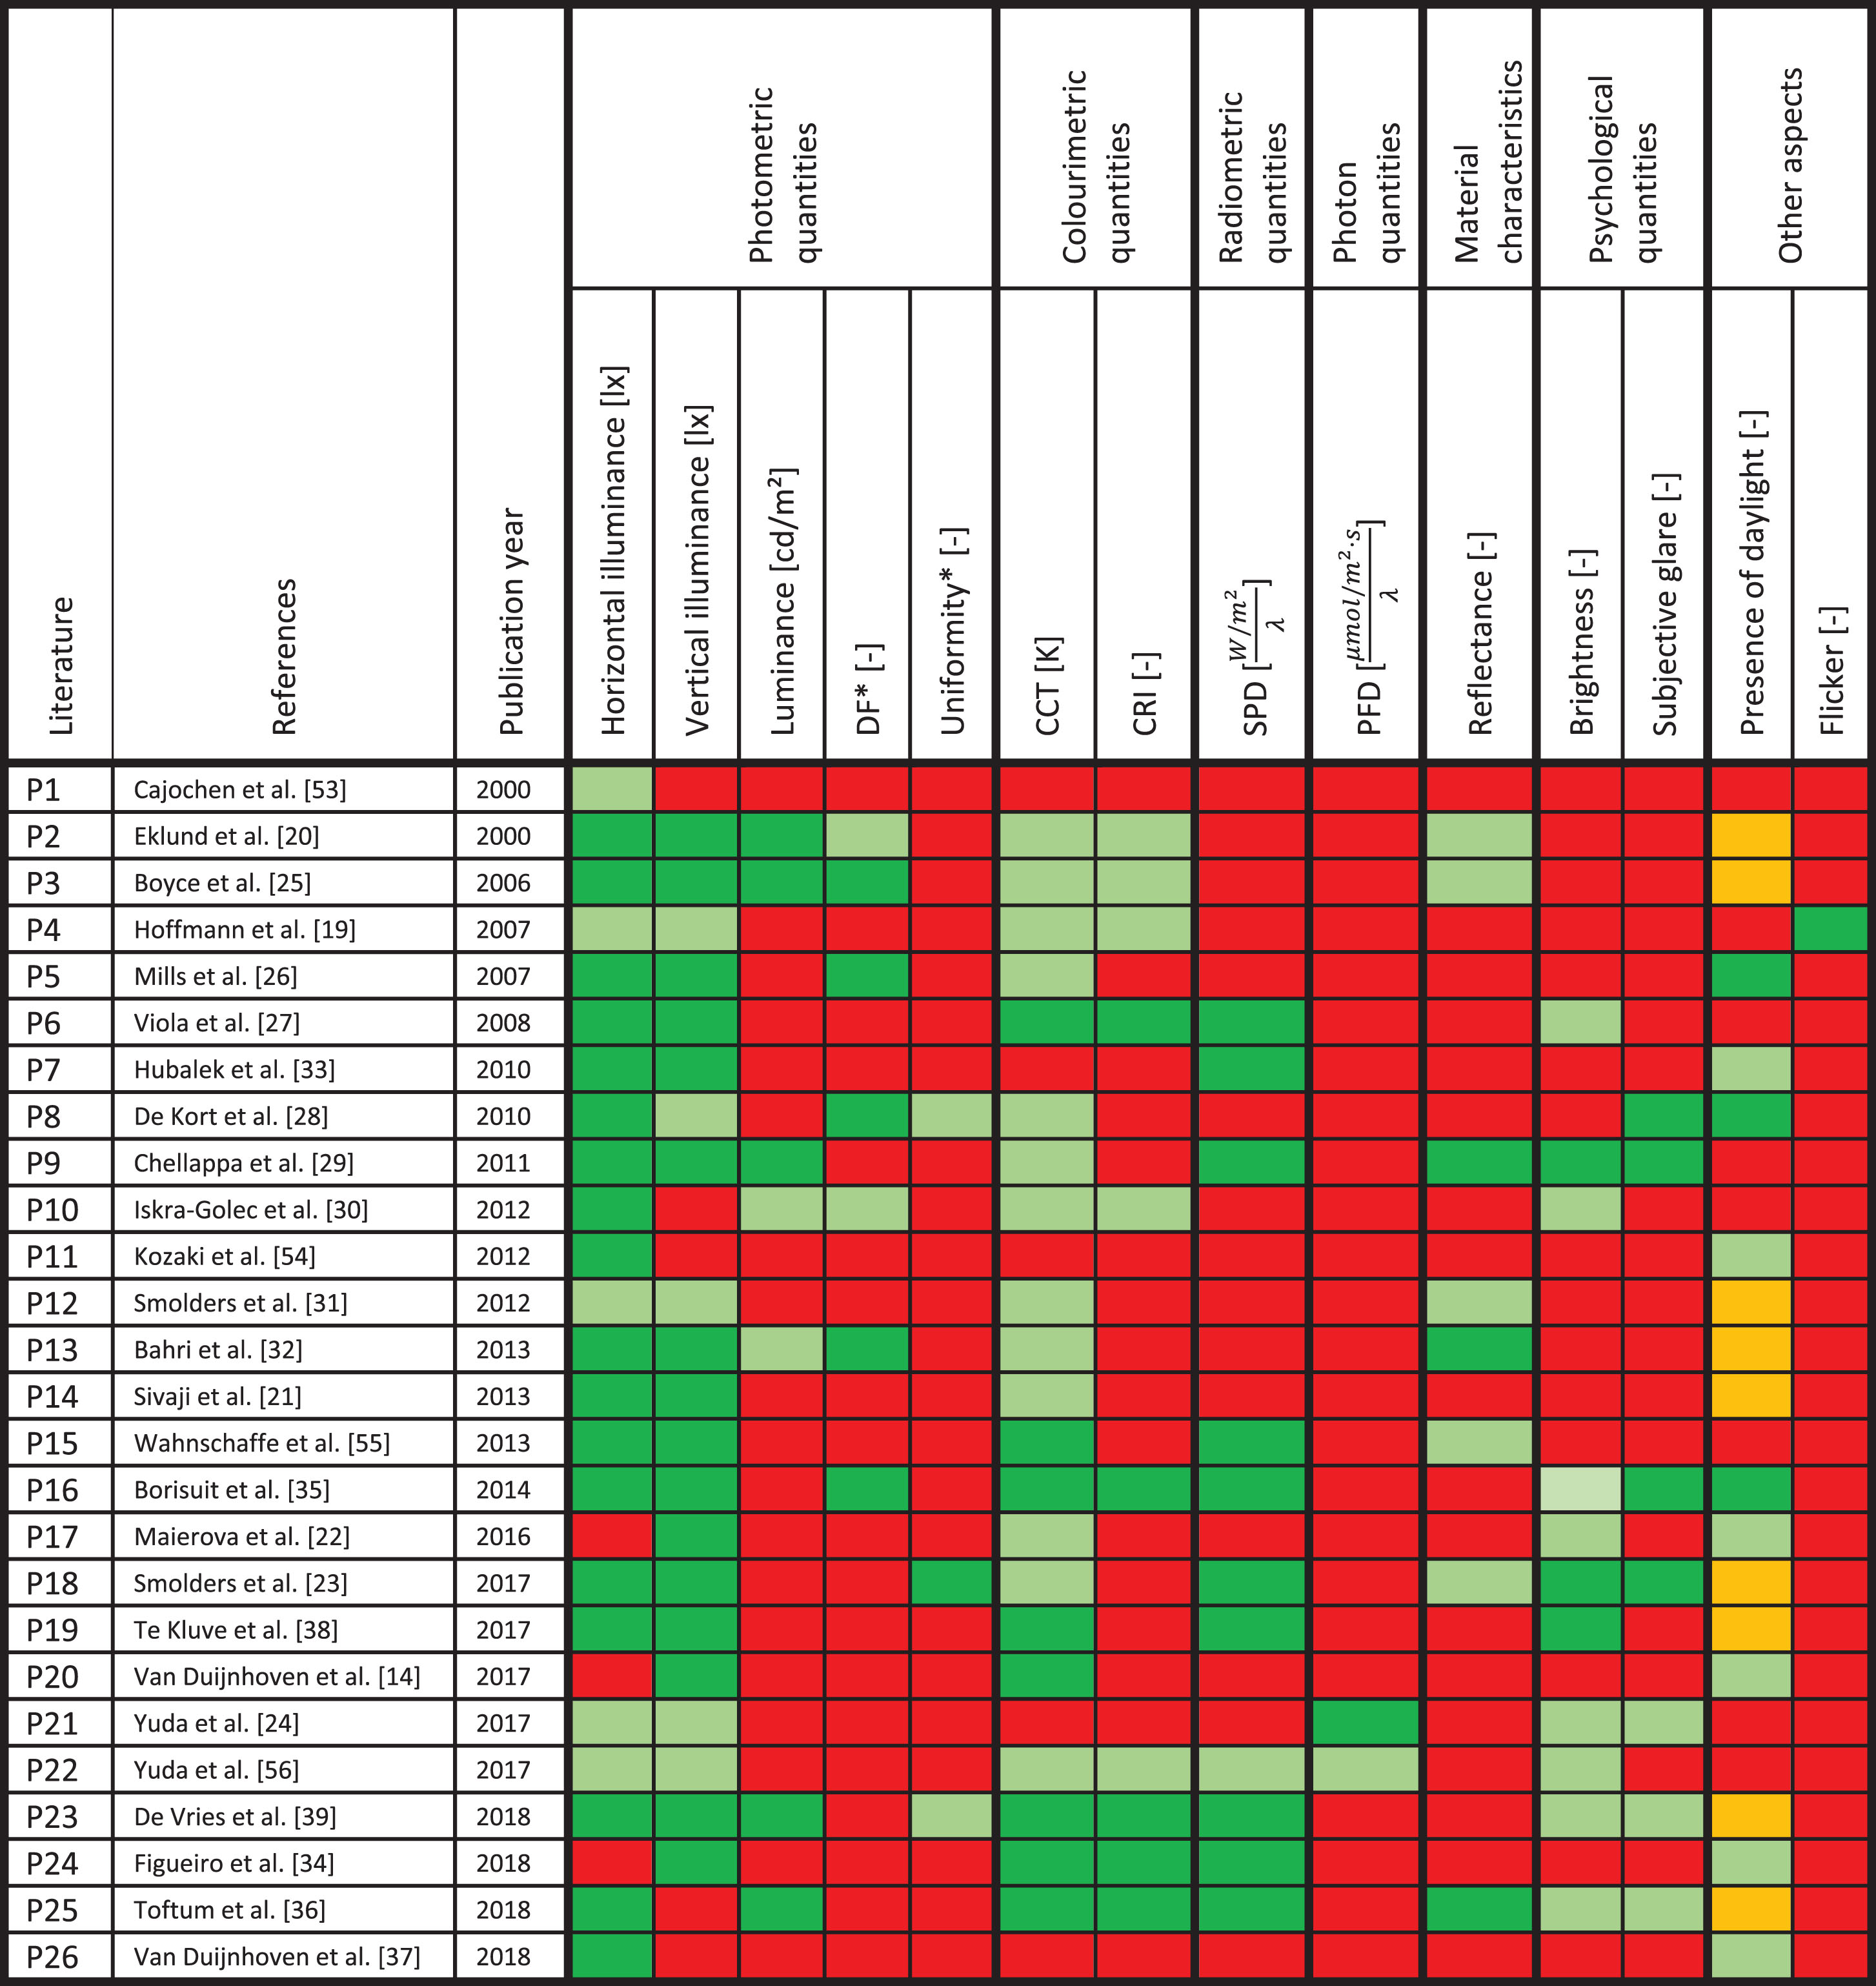 |
Dark green signifies included and measured; light green signifies included but not measured; orange signifies not included; and red signifies not reported. Asterisks for particular light aspects indicate that the light aspect was calculated based on the measurements of other light aspects. Computations for the light aspects are provided within brackets []. The papers are ordered by publication year. Notes: DF: daylight factor; CCT: correlated colour temperature; CRI: colour rendering index; SPD: spectral power distribution; PFD: photon flux density.
In the final group of 26 papers, horizontal illuminance was included and measured the most frequently— in 18 of the 26 papers (see the dark green squares in Table 2), followed by vertical illuminance in 16 papers. CCT was a light aspect that was often included in the papers but not measured (light green squares). For example, this was the case in an intervention study that compared the effects in two different light scenarios (i.e., CCTs of 4000 K and 6500 K) [19]. The aspect concerning either the presence or absence of daylight was the only element that was reported to be not included (orange squares). Lastly, light flicker was the aspect that was the least frequently reported (red squares).
Table 2 shows that throughout all publication years (2000–2018), photometric quantities were both included and measured in the studies. Additionally, radiometric quantities were included and measured more frequently in the later publication years of the sample.
2.3.2How, when, and where were light measurements performed?
Table 3 summarizes how, when, and where the light measurements were performed for the 26 papers in the literature review.
Table 3
Overview of methodological aspects (i.e., how, when, and where light measurements were performed) of the light effect studies included in the literature review. An asterisk indicates that the paper did not include objective light measurements
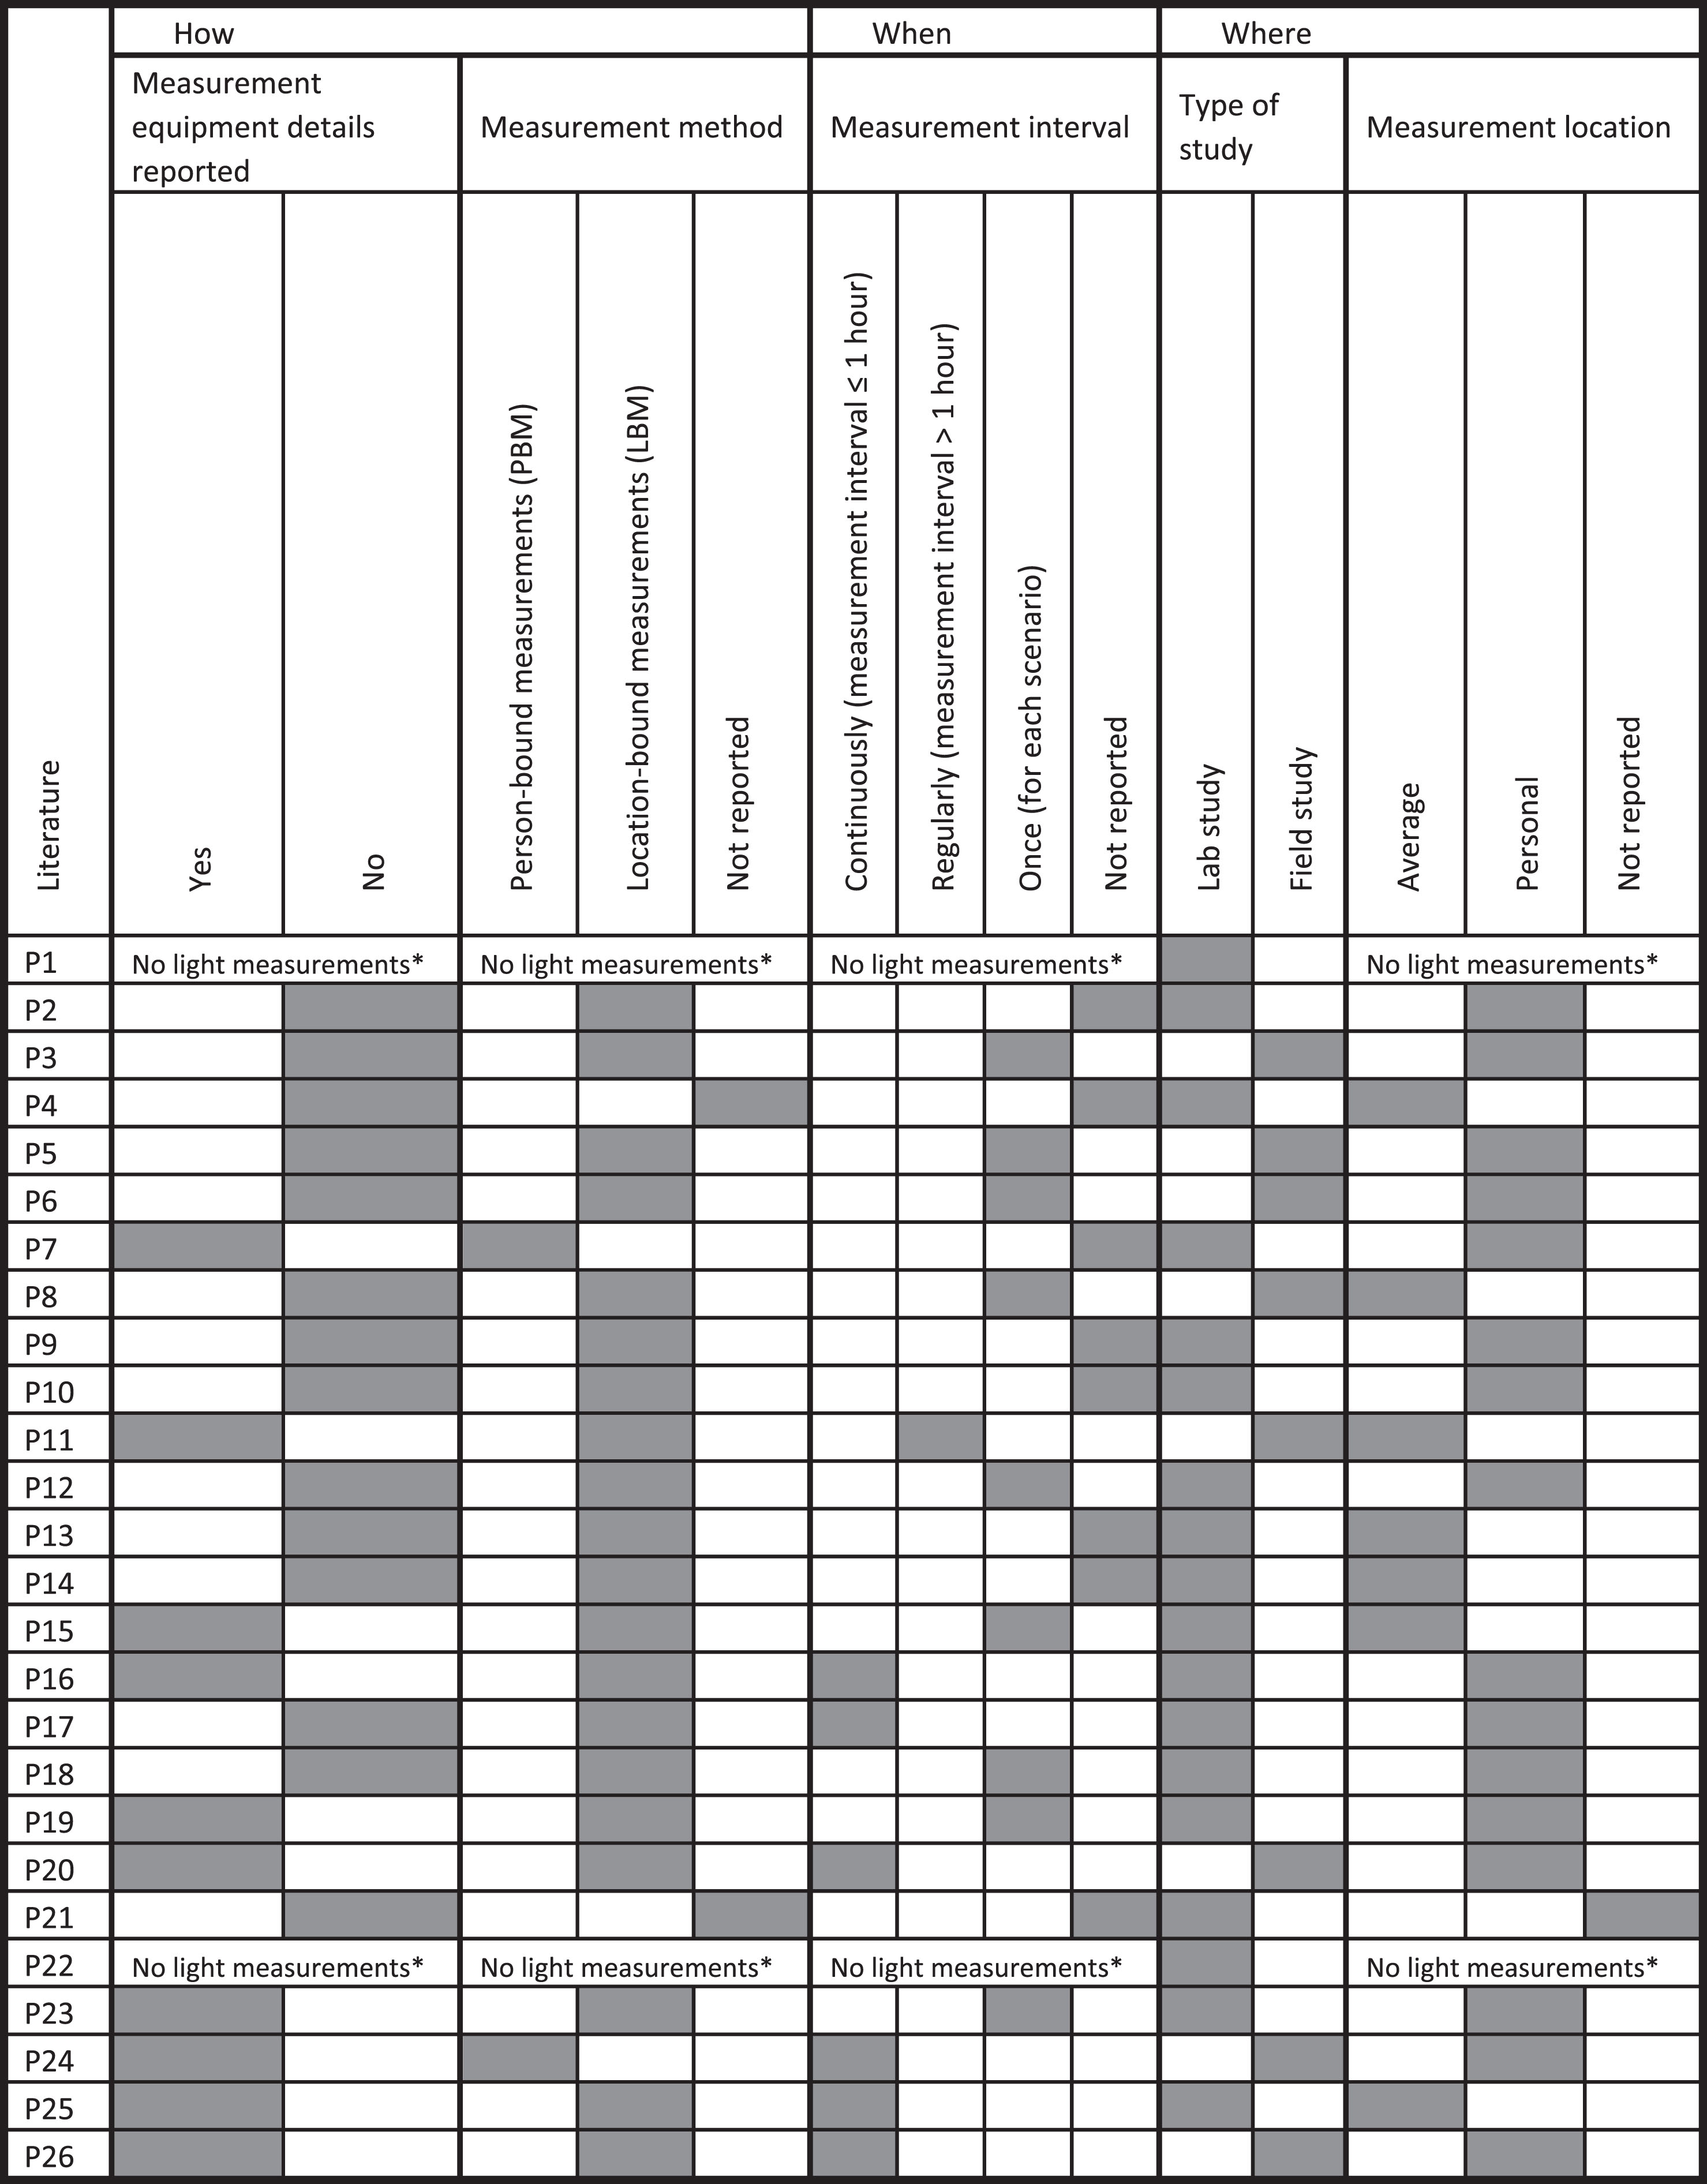 |
How the light measurements were performed was rarely reported in detail: in 14 of the 24 papers that included objective light measurements, no measurement instrument details were provided [19–32]. However, in only two instances was the measurement method— i.e., either PBM or LBM— not reported. The literature search revealed only two studies that used PBM [33, 34]. In these two studies, the wearables ‘LuxBlick’ and ‘Daysimeter’ were used to measure personal lighting conditions. Of these two studies, one did not report the accuracy of the measurement device, nor the corresponding advantages or disadvantages of the method [33].
Exactly when the measurements were performed— the measurement interval— differed between the papers. Only six studies mentioned that they measured lighting conditions with a measurement interval of less than or equal to one hour [14, 22, 34–37].
The light effects studies were carried out in either laboratory environments (n = 18) or as field studies (n = 8). Among these studies, the light measurements were either recorded at a number of locations and then averaged over the entire study environment or performed at the specific locations of the occupants. Sixteen studies performed measurements at the personal level [14, 20, 22, 23, 25–27, 29–31, 33–35, 37–39].
3Part II – Occupant’s position and viewing direction
3.1Rationale
Our findings from the above literature review demonstrate that:
- The entire lit environment, as proposed by the CIE [9], was not included and measured in any of the papers reviewed;
- In the majority of the papers, LBM were applied;
- In seven papers, average lighting conditions were applied.
As stated in the introduction, LBE— a new, practical, unobtrusive method based on LBM— has been developed to determine personal lighting conditions. The aims of the experimental studies were (1) to determine the differences in lighting conditions between the distinct viewing directions and (2) to examine the importance of including the exact position and viewing direction of the office worker when applying the LBE method. We included photometric quantities— specifically, vertical illuminance and correlated colour temperature— to show two examples of light aspects and their differences among the various viewing directions. For the different viewing directions, α-opic irradiances [16], calculated using the CIE Irradiance Toolbox [40], were analysed as well, but they showed similar results as the photopic illuminances. Therefore, we chose just the two photometric quantities, as these two quantities were the primary ones used to express the lighting conditions in light effect studies [5]. In this paper, the differences between the viewing directions are expressed as multiplication factors for the ease of interpreting the results.
3.2Methodology
We executed two experimental studies to investigate the differences in lighting conditions for the various viewing directions. In addition, both the position and viewing direction of the office workers were analysed by performing an exploratory observational study; this last study will be discussed in greater detail in a later section.
3.2.1Experimental studies: Occupant’s viewing direction
The first experiment was conducted in a controlled environment with an artificial window (AW), and the second experiment was performed in a controlled environment with real daylight (RD). Both experiments were carried out at Eindhoven University of Technology in the Netherlands in spring 2018.
A summary of the room characteristics of both experimental setups is provided in Table 4. In addition, the measurement instrument details are described in Table 5. There was a significant difference in the maximum luminances measured (i.e., the ‘spot measurements’, using a Konica Minolta LS-100 Luminance meter) at the simulated viewing point in the direction of the centre of the (virtual) daylight source: 770 cd/m2 for the AW setup, and 9520 cd/m2 for the RD setup.
Table 4
Room characteristics of setups of the experimental study environments
| Room characteristics | Artificial window (AW) | Real daylight (RD) |
| Room length (m) | 6.3 | 5.5 |
| Room width (m) | 4.2 | 3.5 |
| Room height (m) | 6 | 2.7 |
| Reflection factors | ||
| Walls | 74.3%, 12.3%, 54.1%, 80.4% | 34.4%, 2.0%, 62.2% and 85.7% |
| Floor | 15.1% | 12.2% |
| Ceiling | 35.0% | 75.4% |
Table 5
Details of measurement instruments for the artificial window (AW) setup and the real daylight (RD) setup
| Measurement device | Measured units | Type/Serial number | Manufacturer | Number of devices | Software | Used in setup |
| Spectroradiometer | Vertical illuminance, CCT | CL-500A (10002710 and 10002711) | Konica Minolta | 2 | Data Management Software CL-S10w | AW and RD |
| Luminance meter | Luminance | LS-100 | Konica Minolta | 1 | N/A | AW and RD |
| Photometer | Horizontal illuminance | Hagner E4X | Hagner (SE) | 1 | SquirrelView | AW and RD |
| AW and RD | ||||||
| Spectrometer (with cosine corrector) | Vertical illuminance, CCT, spectral data | USB4000 (USBH07057 USBU05695 USBH06965 USBU05696) | Ocean Optics | 4 | Ocean View | RD |
| Luminance distribution meter | Luminance distribution | 1 (v2) | Eindhoven University of Technology | 1 | Luminance Analysis Software System (LASS) | RD |
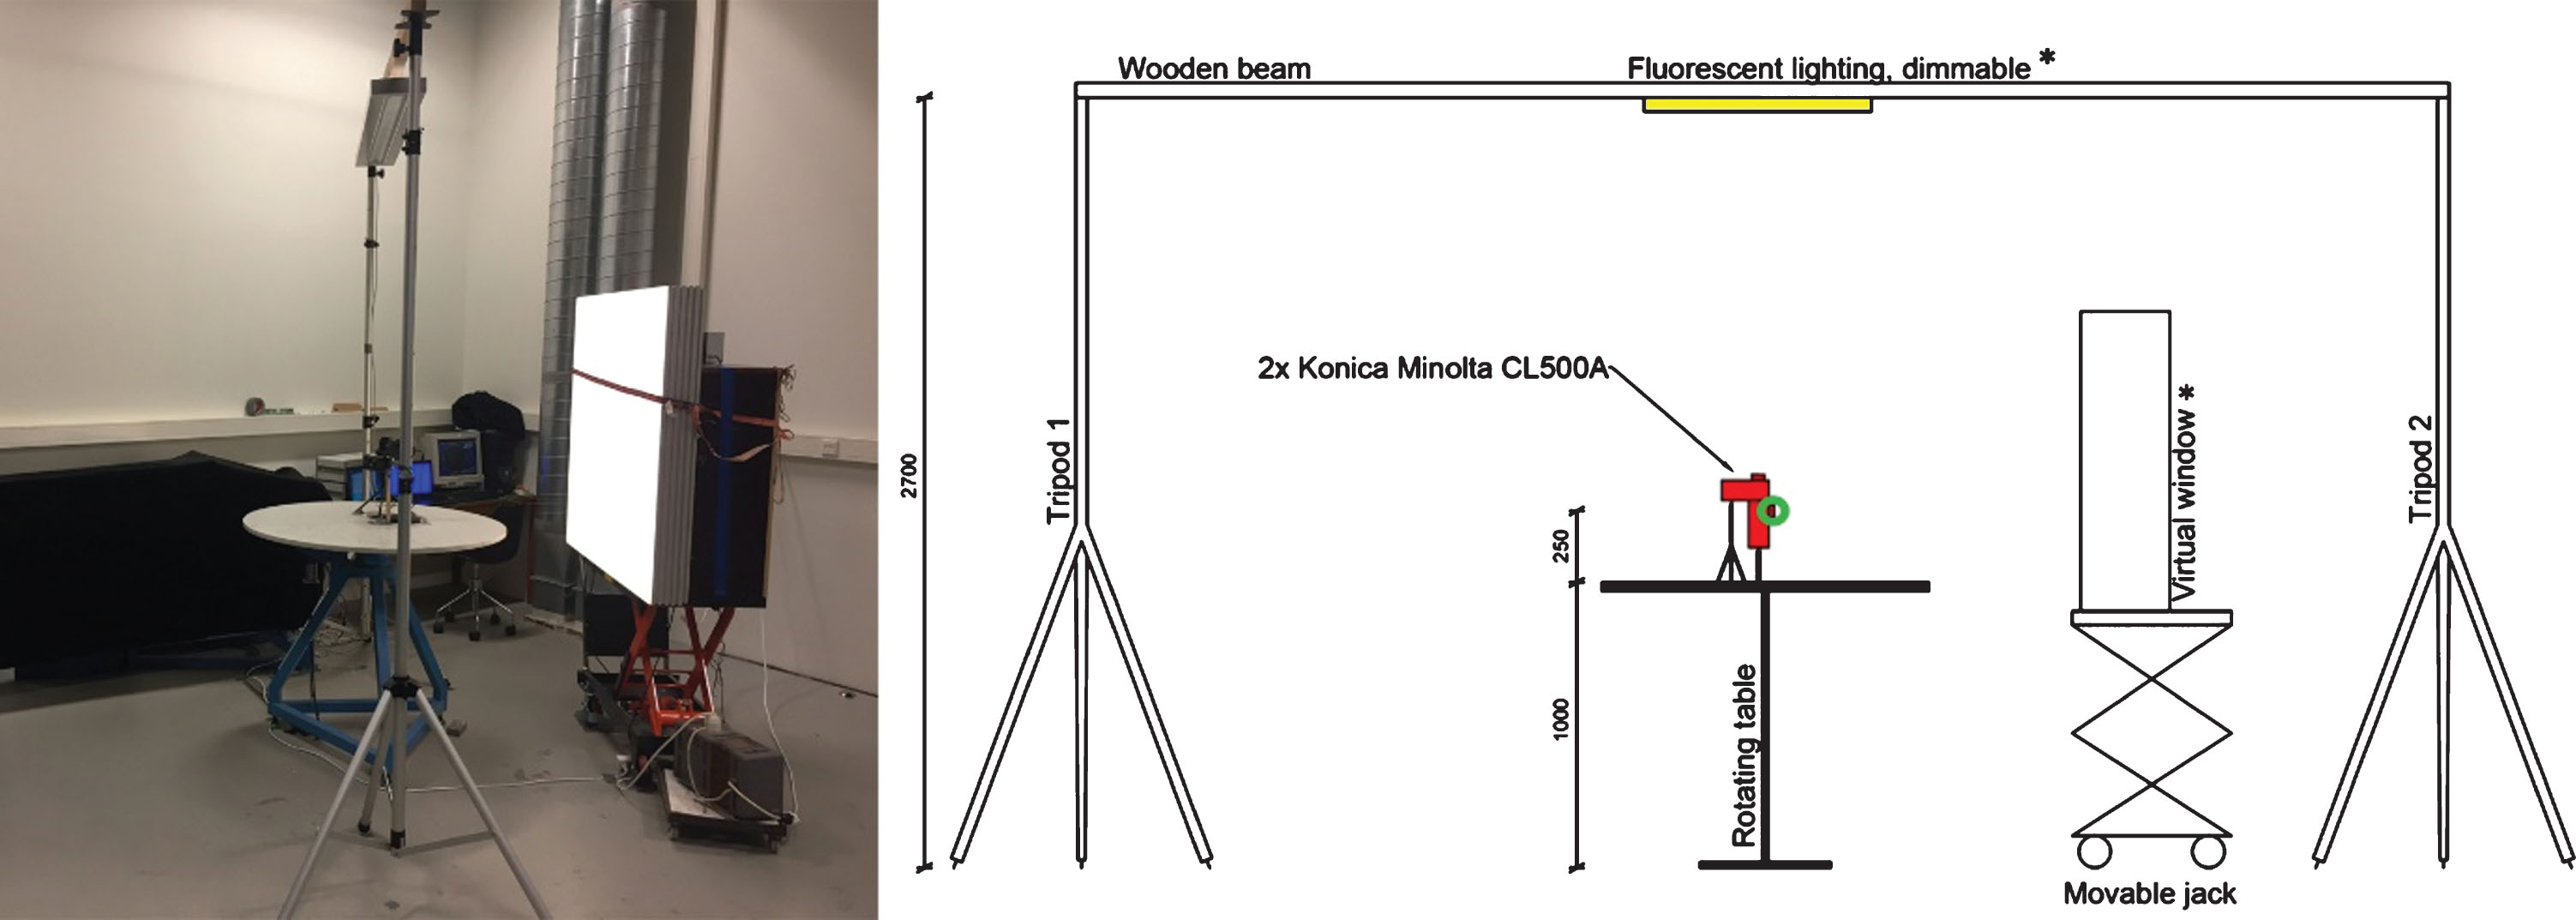
In AW experimental study, differences in lighting conditions between various viewing directions were analysed for 60 unique office configurations (see Fig. 2 for the measurement setup). Since we chose not to include a real daylight source, the lighting conditions remained constant throughout the study period, and there was no need to measure lighting conditions for multiple viewing directions simultaneously. However, two calibrated spectroradiometers (Konica Minolta type CL-500A) were used to measure the horizontal illuminance and the vertical illuminance (in any viewing direction) simultaneously. The horizontal illuminance measurements were performed to validate whether the illuminance caused by the light sources remained constant. The spectroradiometer measuring the vertical lighting conditions was placed in the centre of a rotating table at the estimated eye height of a seated worker (1.25 m).
Fig.2
Experimental study AW: measurement setup. Light sources, indicated by asterisks, were connected to a computer controlling the light output. Simulated viewing point of an office worker is demonstrated by the green circle.
The simulated occupant’s eye (i.e., the measurement position in the vertical direction) was placed in the middle of the rotating table to enable easy and precise adjustments for the various viewing directions. The two light sources in the measurement setup included an AW (four Philips Master TL5 HO – ActiViva Active 54W, and four Philips TL5 HE 28W/827 covered by a 1.15 x 1.15 m2 diffuse surface) and a fluorescent light source (one Philips Master TL5 HO 80W/830) controlled by a computer. Four variables of the measurement setup were adjustable— thus providing multiple options— to create the different office configurations.
In order to investigate the differences in light per viewing direction for the office configurations, a standard arrangement was used, in which all variables but one were kept constant (see the list of variables below). The standard arrangement was the arrangement for which the AW setup was compared with the RD setup. The following variables were adjustable:
1. Artificial window (AW): CCT (options: 6000 K, 6500 K, 7500 K, 8500 K, and 9000 K). Daylight measurement data from a study by Khademagha et al. [41], combined with weather data [42], were used to calculate the CCT levels for different days across the year to identify the corresponding CCT levels for different weather conditions. These CCT levels were then recreated using the AW controlled by the computer. The standard arrangement applied a CCT of 6500 K.
2. Artificial window (AW): distance to viewing point (options: 1.0 m or 2.4 m). These two distances were the maximum possible distances determined by the test room. In the standard arrangement, the distance was set at 1.0 m.
3. Fluorescent light source: dimming level to cause a particular horizontal illuminance at the simulated viewing point (options for horizontal illuminance: 300 lx or 500 lx). These two illuminances were chosen according to European recommendations [43]. The choice of 500 lx was used in the standard arrangement.
4. Fluorescent light source: position (options: 0 m,+1.5 m, – 1.5 m, where a negative distance signifies a location in between the viewing point and the AW, and where 0 signifies that the light source is directly above the viewing point). These distances were the maximum possible distances in the measurement room. The position of 0 m— the fluorescent light source directly above the simulated viewpoint— was the chosen option for the standard arrangement.
As indicated above, these four variables resulted in 60 unique office configurations with which we could investigate the influence of viewing direction on light aspects. At the position of the simulated viewing point, horizontal illuminance, vertical illuminance, CCT, general CRI, and light spectrum were measured. As mentioned in the rationale section, we only discuss the photometric quantities— vertical illuminance and correlated colour temperature— measurements in this paper. The light aspects were measured in five directions for each variant: four vertical, and one horizontal. The vertical measurements were conducted by rotating the table before each measurement. The direction toward the AW was assumed to be 0°.
Since the absolute measured values for both vertical illuminance and CCT fluctuated according to office configuration, the differences between the four viewing directions were demonstrated as multiplication factors. The lowest measured light aspect per office configuration over all viewing directions was assumed as the reference (multiplication factor = 1), and this was taken as the base for the relative multiplication factors used for the other viewing directions. The multiplication factors for the viewing directions were calculated according to Equation 1, found below. Besides illuminances or CCTs, light aspects, such as luminous exposures or irradiances (e.g., α-opic irradiances [16, 40]), could be inserted into Equation 1 to derive multiplication factors for these light aspects. Figure 3 illustrates a sample interpretation for Equation 1.
Fig.3
Sample interpretation of Equation 1 to calculate multiplication factors. The yellow arrows indicate the direction of the light before hitting the surface of the simulated viewing point (i.e., red spot). To receive the light that originates at the artificial window and terminates at the simulated viewing point, an individual would need to look toward the window. The sample interpretation uses simple fictive values for the vertical illuminances to ensure straightforward interpretation.
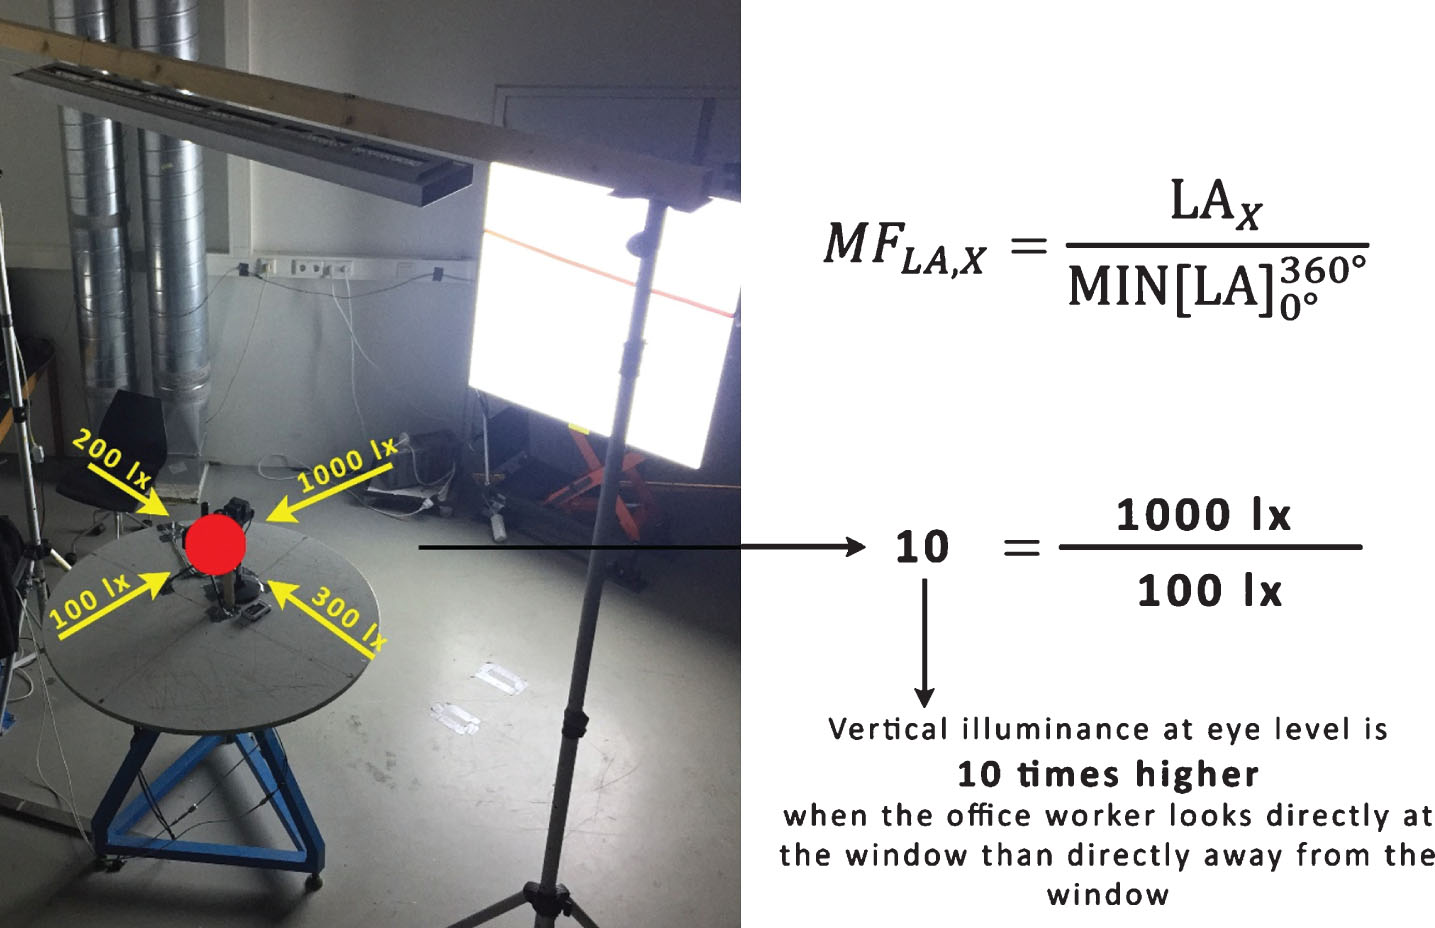
Equation 1: Calculation of multiplication factors per viewing direction
In which:
• MFLA,X= The multiplication factor for light aspect LA (e.g., vertical illuminance or CCT) for viewing direction X;
• LAX= Measured light aspect LA in viewing direction X;
•
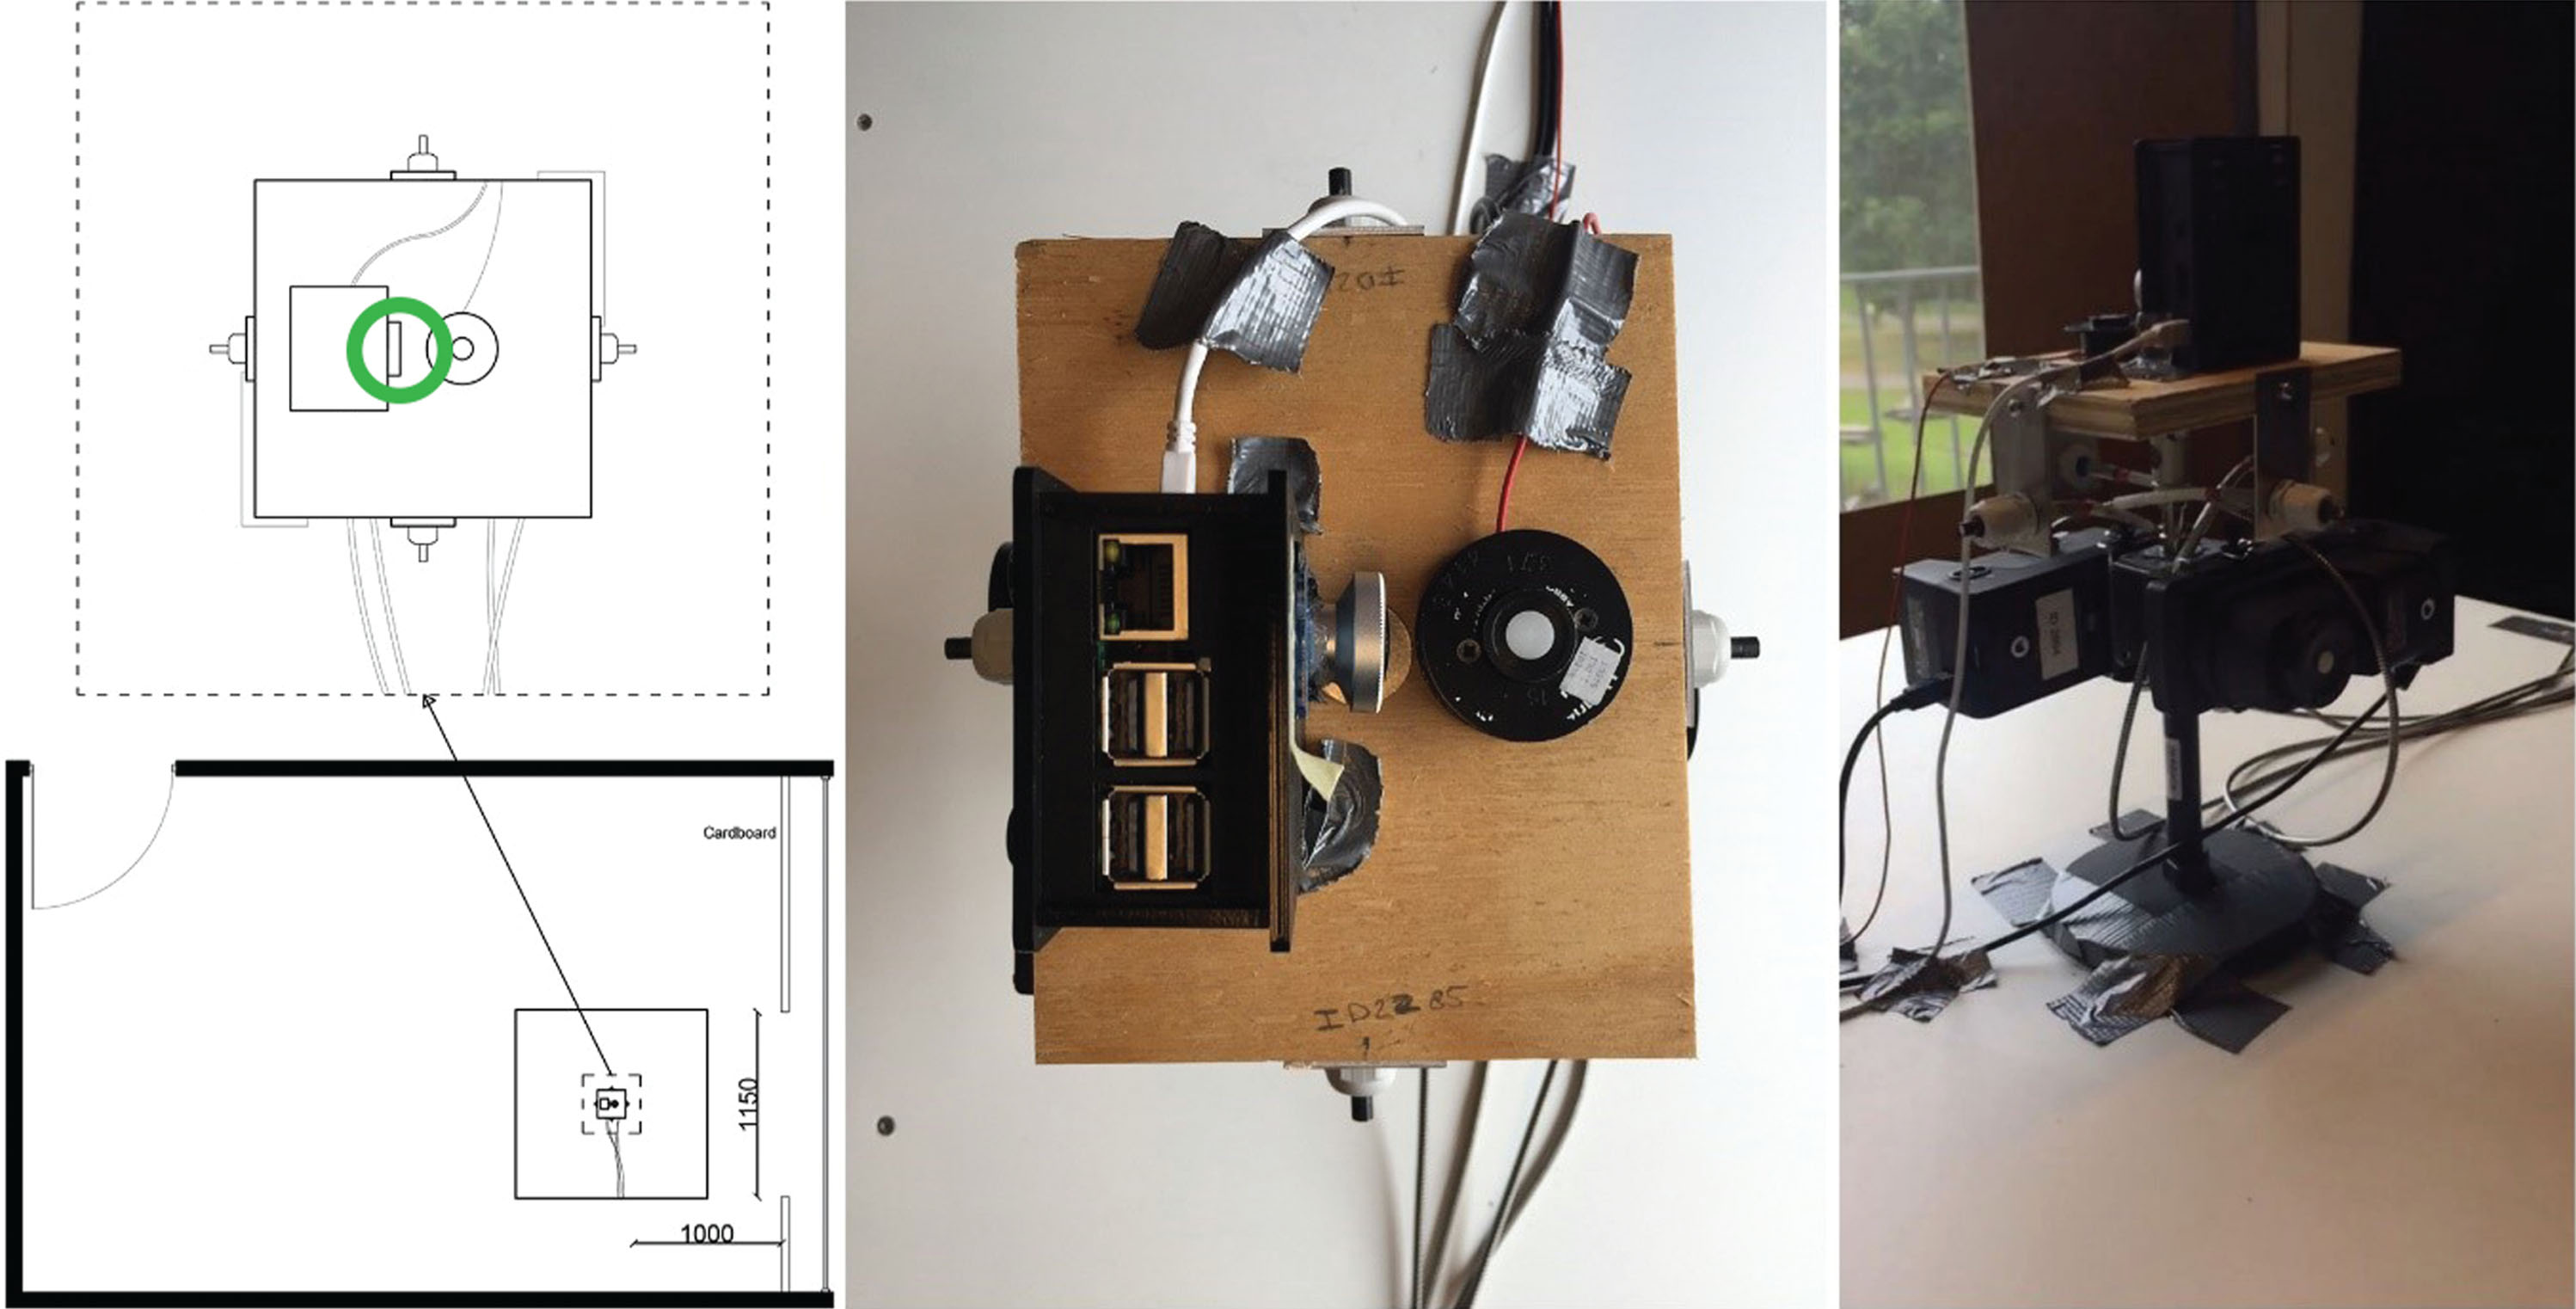
In addition to the investigation discussed above using an AW, a second set of measurements were performed in a room with actual daylight. In this investigation, only one office configuration was used for these measurements— the standard arrangement described in section 3.2.1.1. In this study, the fluorescent light source was attached to the ceiling at 2.7 m, and the window dimensions were adjusted to the dimensions of the setup with the AW. Since daylight changes over time, all four viewing directions— window side, parallel to the window (both sides), and window-opposite side— had to be measured simultaneously. Here, four calibrated USB4000 spectrometers with a cosine corrector and transmission probes were used. These were placed on a swivel that was attached to a small wooden plate (see Fig. 4) Additionally, two calibrated spectroradiometers were placed slightly beneath the four spectrometers, and a calibrated photometer was placed on top of the wooden plate to measure horizontal illuminance. Furthermore, a luminance distribution measurement device was placed behind a Hagner cell to measure the luminance distribution [44]. All devices were measured in 30-second measurement intervals except the photometer, which measured every 10 seconds, and the luminance distribution measurement device, which measured every 30 minutes. The total measurement period for this study was seven days.
Fig.4
Experimental study RD: measurement setup. Simulated viewing point of an office worker is demonstrated by the green circle.
The data from this RD setup were analysed similar to the analyses of the AW setup, using multiplication factors to demonstrate the differences in lighting conditions between the four viewing directions.
3.2.2Observational study: Occupant’s position and viewing direction
Besides the experiments above, we also validated our inclusion of viewing direction when determining personal lighting conditions in offices by observational study.
During the observational study, six office workers (mean age: 30; standard deviation: 4.8 years) at Eindhoven University of Technology were watched by an observer to determine their location (present/absent at their workstation) and their viewing directions. Five of the office workers were researchers, and one was an administrative worker. The study period lasted one full working day (9 a.m. – 5 p.m.) in spring 2018. During this time, three observations were performed, always including two office workers per observation. Two identical stopwatches (one per observed person) were used to measure certain times. The time that the office workers were present and looking toward their computer screen was assumed to be the standard. All other movements were timed and reported. The various computed viewing directions were as follows: window (0°), computer screen (90° or 270°), computer screen opposite (90° or 270°), window opposite (180°), or desk or phone (looking downward).
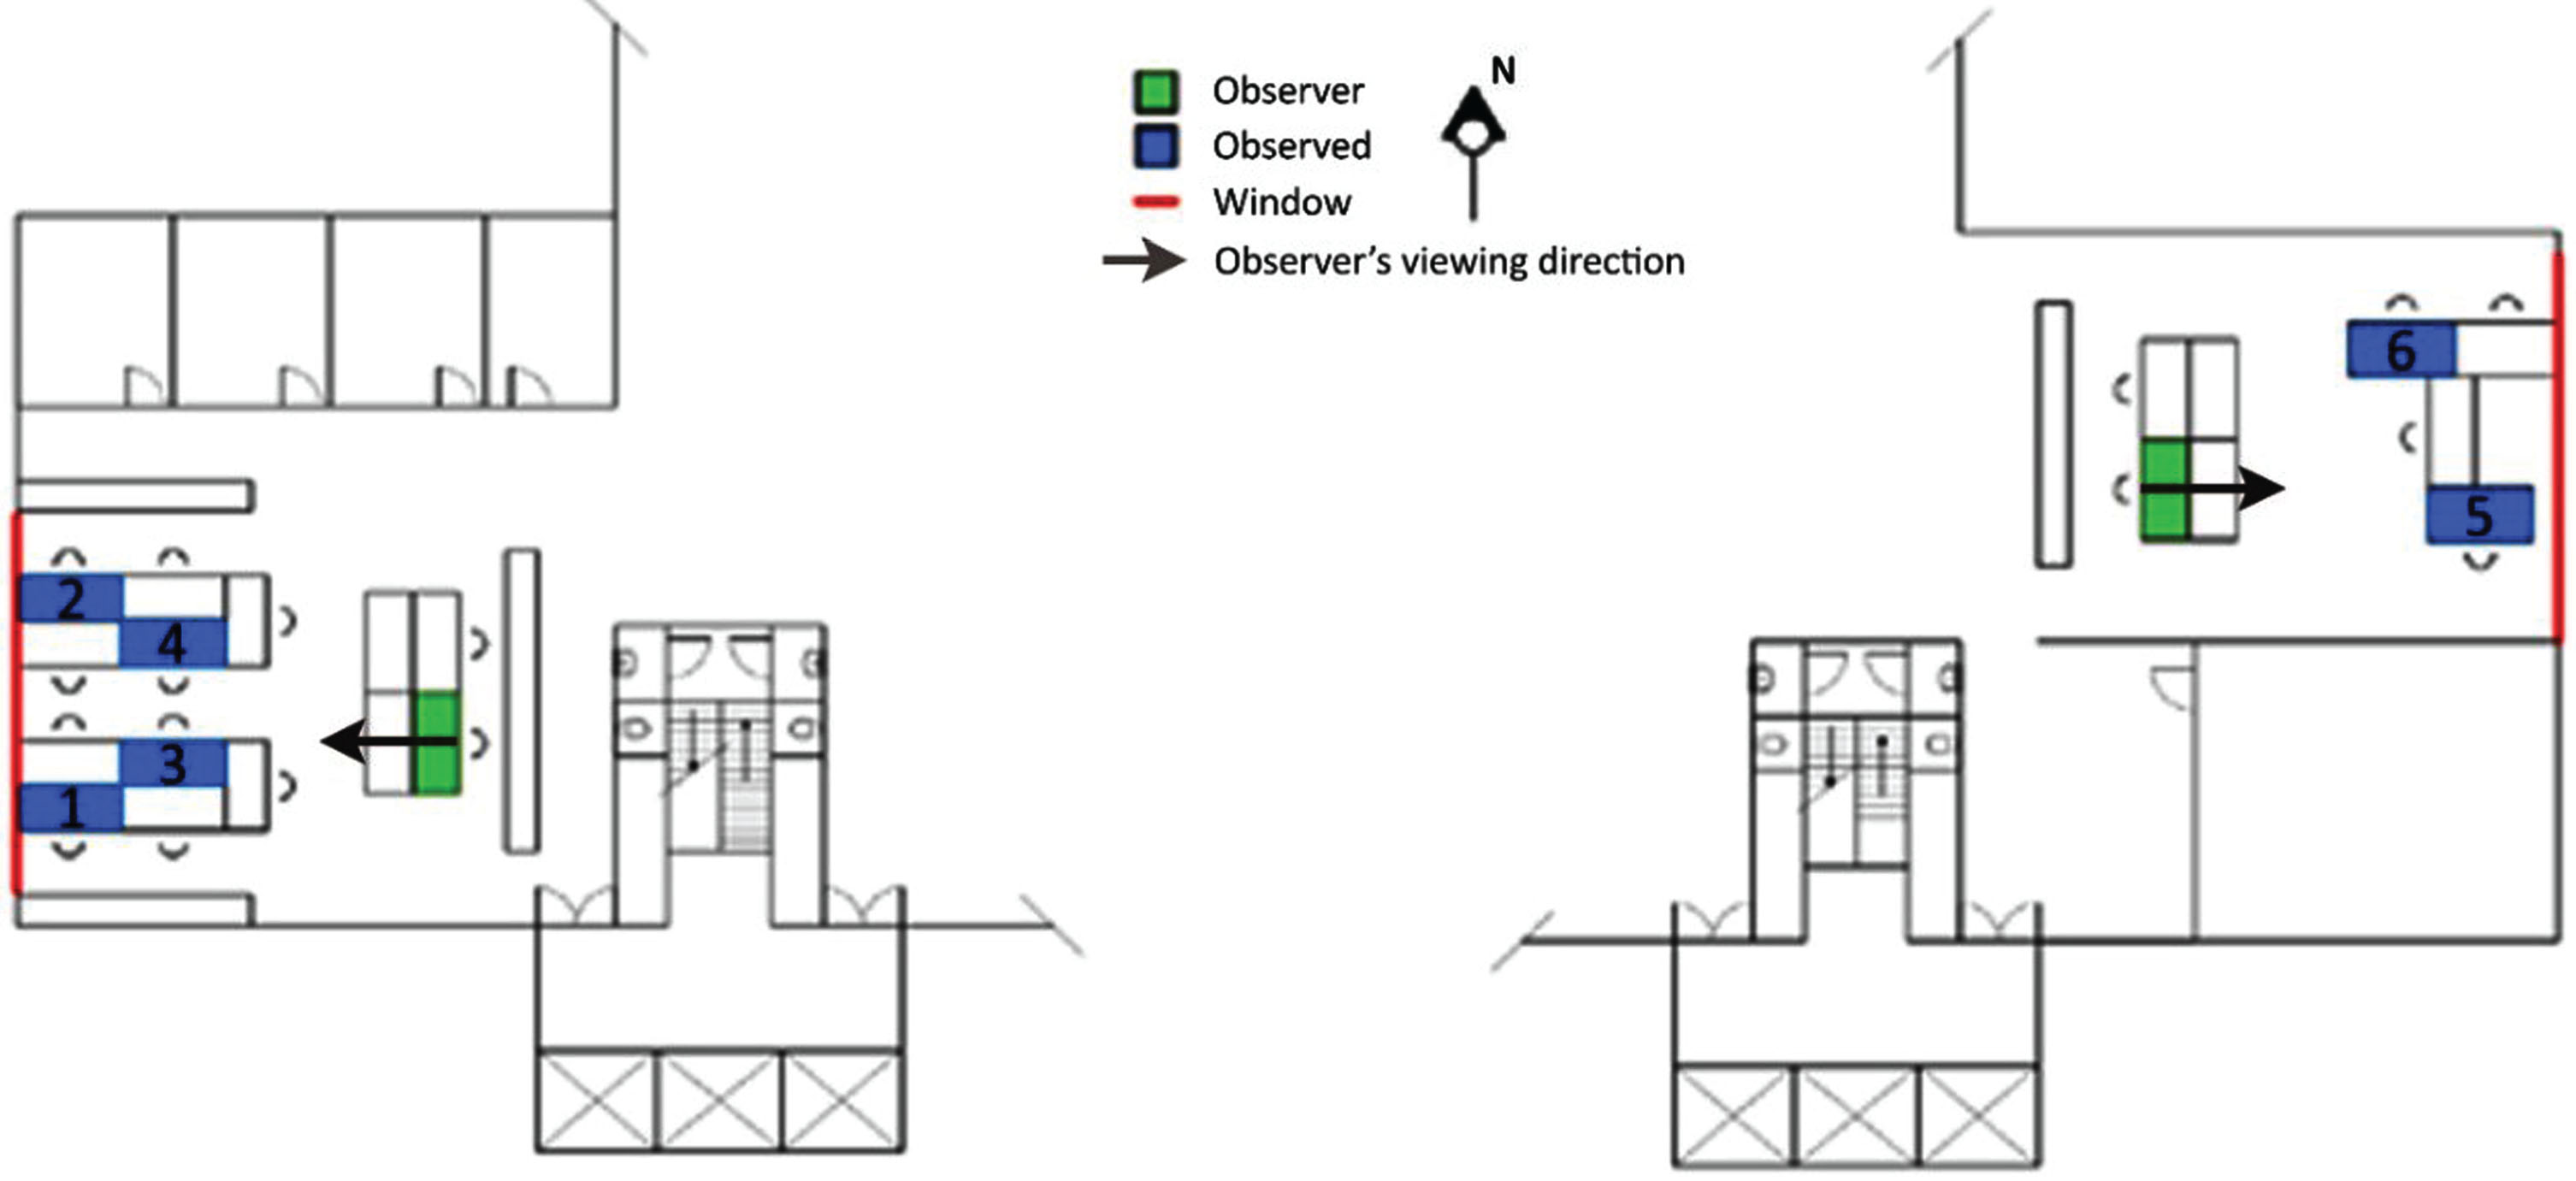
The observations were executed at three locations within a university building having different orientations and positions toward a window (see Fig. 5) Those observed were selected based on the positions of their workstations, which differed in both viewing direction and orientation. Since this study complied with Dutch law regarding medical research on humans [45], we executed this study without prior ethical approval. The observations were performed in a public space; there were no interventions or interactions between the observer and those observed; and the data presented in this paper cannot be traced back to the individuals. After the observation period concluded, the participants were asked their permission so that the data could be used. They were given sufficient time to respond, and they were free not to give permission. The participants were not notified during or in advance of the observations, as this could have changed their behaviour, possibly influencing the results. Instead, the observer watched the subjects surreptitiously.
Fig.5
Observational study: Floor plans and pictures of the environment.
All measured data were entered into Microsoft Excel (2013) during the course of the observation, after which it was analysed using MATLAB (R2018a). The location results (i.e., present or absent at workstation) are presented in this paper as percentages: present/absent divided by the total time on that workday (Equation 2). The viewing direction results are also presented as percentages of time (POT): looking in one direction divided by the total time the office worker was present at her or his workstation (Equation 3).
Equation 2: Calculation of time the office worker was present/absent at her or his workstation
• X = Location; in this formula, location indicates either being present or absent at the worker’s workstation;
• POTX= Calculated percentage of time the office worker is at location X, expressed in %;
• tX= Time that the office worker was at location X, measured in seconds;
• ttotal= Time between 9 a.m. and 5 p.m. (i.e., one entire workday), equalling 28,800 seconds.
Equation 3: Calculation of time the office worker was looking in a particular viewing direction
In which:
• X = Viewing direction, expressed in °;
• POTX= Calculated percentage of time the office worker was looking in viewing direction X, expressed in %. X could be toward the window (0°), the computer screen (90° or 270°), the computer screen opposite (90° or 270°), or the window opposite (180°);
• tX= Time that the office worker was looking in viewing direction X, measured in seconds;
• tpresent= Time the office worker was present at her or his workstation.
3.2.3Sample calculation
The results of the experimental studies (e.g., the multiplication factors for vertical illuminances) and the observational study (i.e., the POT the office workers were looking in a certain viewing direction) were combined in a sample calculation of the daily office luminous exposure. Two variants of calculating the daily office luminous exposure of the office worker were compared:
1. 100% viewing direction toward the worker’s computer monitor.
2. Viewing directions according to the findings of the observational study (see Table 6).
Table 6
Observational study. Percentages of worker time in each location and for each viewing direction, averaged over all six participants. Note: Location signifies the location of the office worker’s workstation
| Average | Minimum | Maximum | |
| Location | |||
| Presence | 81% | 78.1% | 84.8% |
| Absence | 19% | 15.2% | 21.9% |
| Viewing direction | |||
| Window (0°) | 0.7% | 0.4% | 1.3% |
| Computer screen (90° or 270°) | 92.5% | 84.6% | 97.1% |
| Computer screen opposite (90° or 270°) | 0.1% | 0.0% | 0.3% |
| Window opposite (180°) | 2.0% | 0.2% | 4.9% |
| Desk or phone (downward) | 4.7% | 1.8% | 12.6% |
The viewing direction toward the worker’s desk or phone was assumed to be the same as looking at the worker’s computer screen since we did not take measurements for this specific angle. Equation 4 was used to calculate the daily office luminousexposure.
Equation 4: Calculation of daily office luminous exposure based on experimental results and observational study
• Hwork= Daily office luminous exposure, expressed in lxh;
• X = Viewing direction, expressed in °;
• POTX= Calculated percentage of time the office worker was looking in viewing direction X, expressed in %. X values were 0°, 90°, 180°, and 270°;
• ttotal= Total time at workstation; in the sample calculation, this was assumed to be eight hours;
• Emin= Minimum vertical illuminance of all four viewing directions; in the sample calculation, this was assumed to be 500 lx in the window-opposite viewing direction (180°);
• MFE,X= The multiplication factor for vertical illuminance for viewing direction X.
For the experimental studies, the multiplication factors of all five CCTs for the RD setup were averaged and used in Equation 4. In addition, the multiplication factors of both sides (90° and 270°) were averaged in order to eliminate deviations due to the experimental setup. The average POT that an office worker was looking in a certain direction (POTX) were used in this formula (see Table 6). In the sample calculation, the photometric quantity vertical illuminance was used to calculate the daily luminous exposure in the office. The total time the office worker spent at her or his workstation (ttotal) was assumed to be eight hours, and the minimum assumed vertical illuminance (LAMIN) was 500 lx.
3.3Results
3.3.1Experimental studies: Occupant’s viewing direction
The differences in the lighting conditions between the four viewing directions were investigated as they pertained to the different office configuration variables (i.e., the CCT of the AW, the distance between the AW and the simulated viewpoint, the horizontal illuminance emitted by the fluorescent light source, and the position of the fluorescent light source). The different lighting conditions— vertical illuminance and correlated colour temperature— of the four viewing directions are presented in Figs. 6 and 7.
Fig.6
Experimental studies: Differences in multiplication factors of vertical illuminances among the four viewing directions, expressed in multiplication factors. Notes: RD: Real daylight; AW: Artificial window; CCT: Outdoor CCT in the RD setup, or CCT of the artificial window in the AW setup.
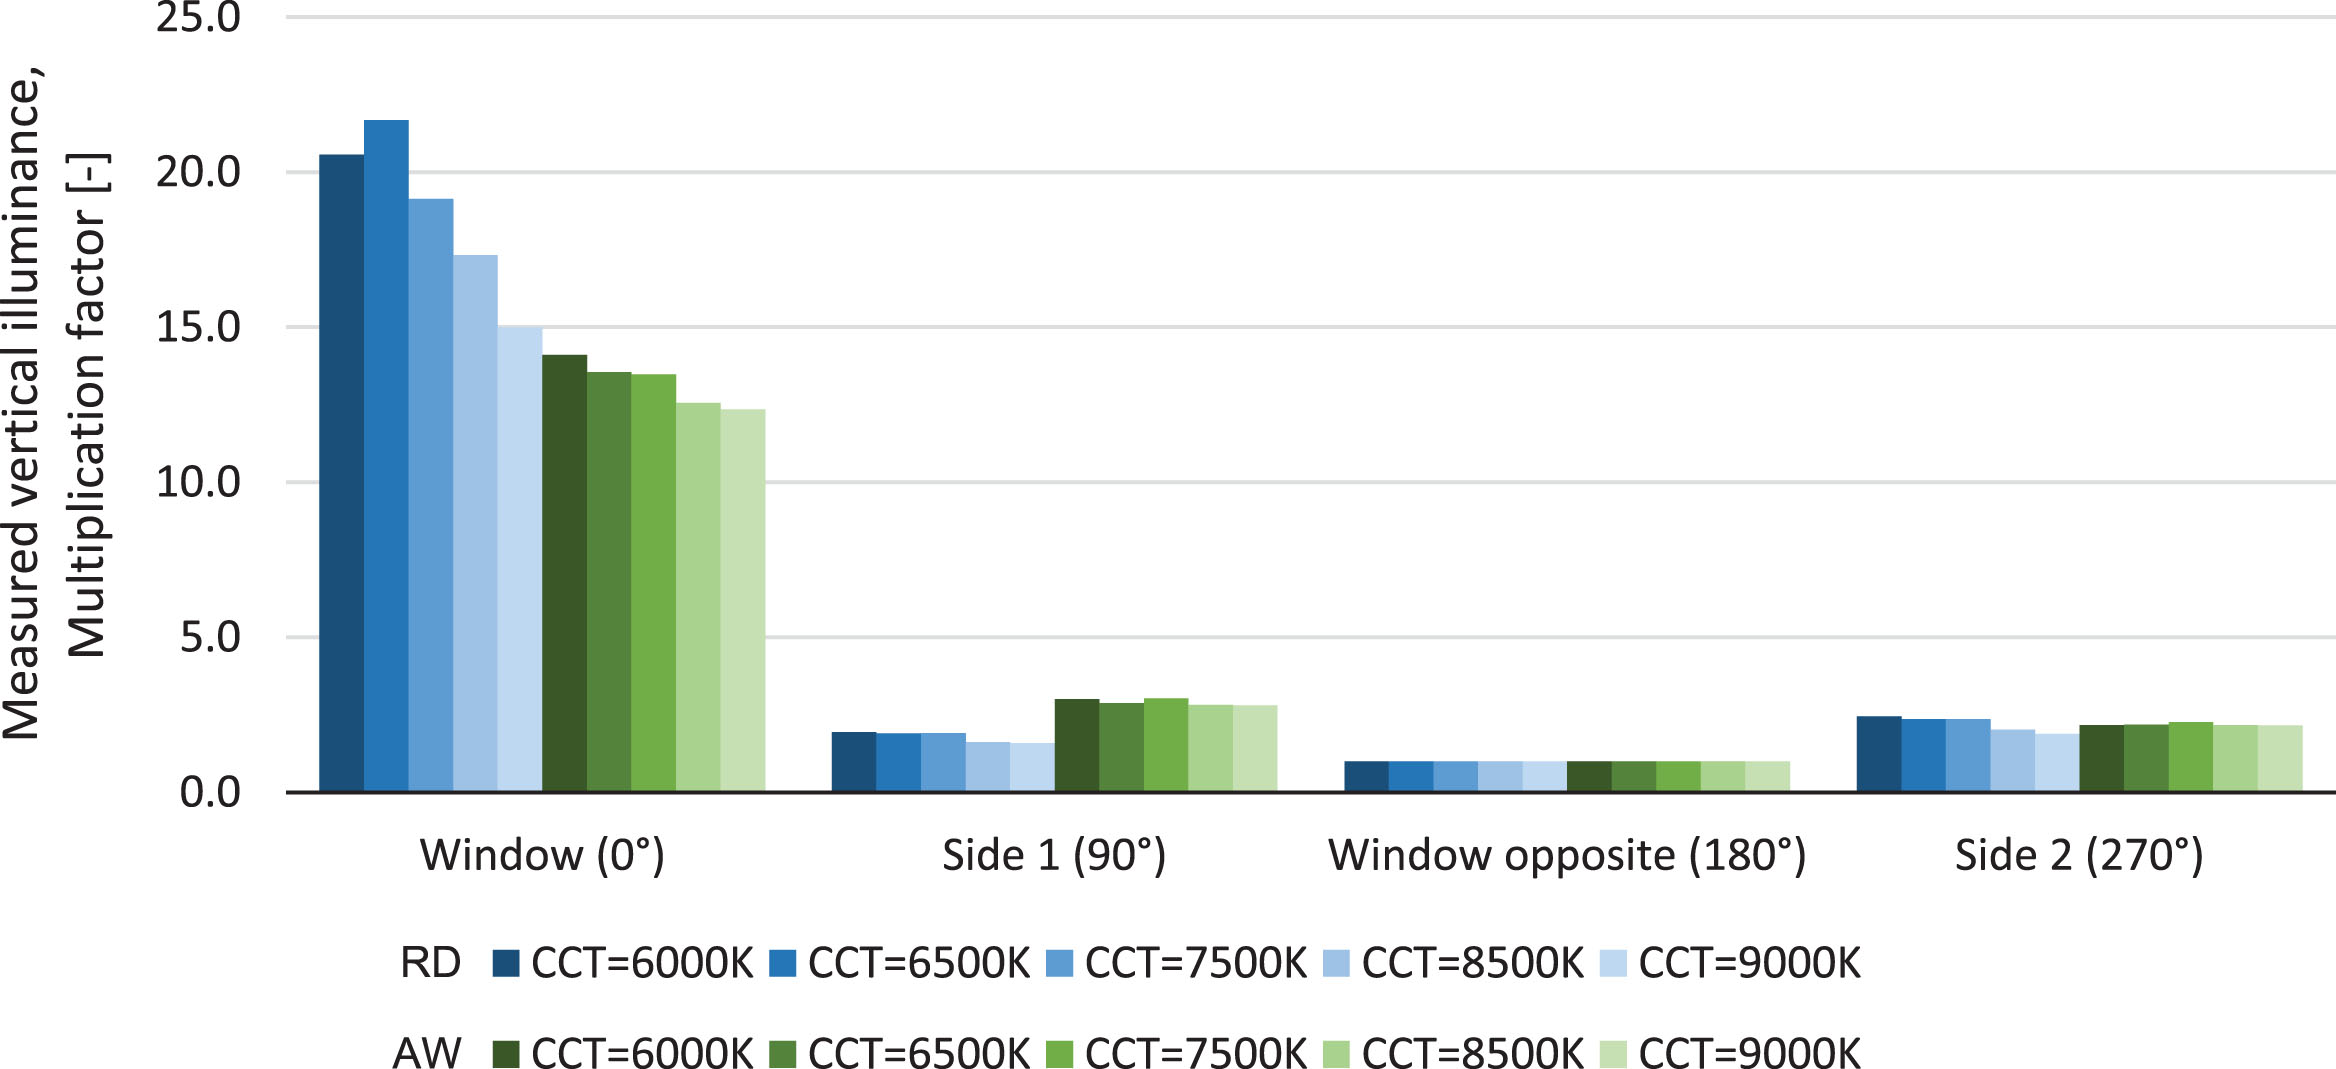
Fig.7
Experimental studies: Differences in multiplication factors of correlated colour temperatures among the four viewing directions, expressed in multiplication factors. Notes: RD: Real daylight; AW: Artificial window; CCT: Outdoor CCT in the RD setup, or CCT of the artificial window in the AW setup.
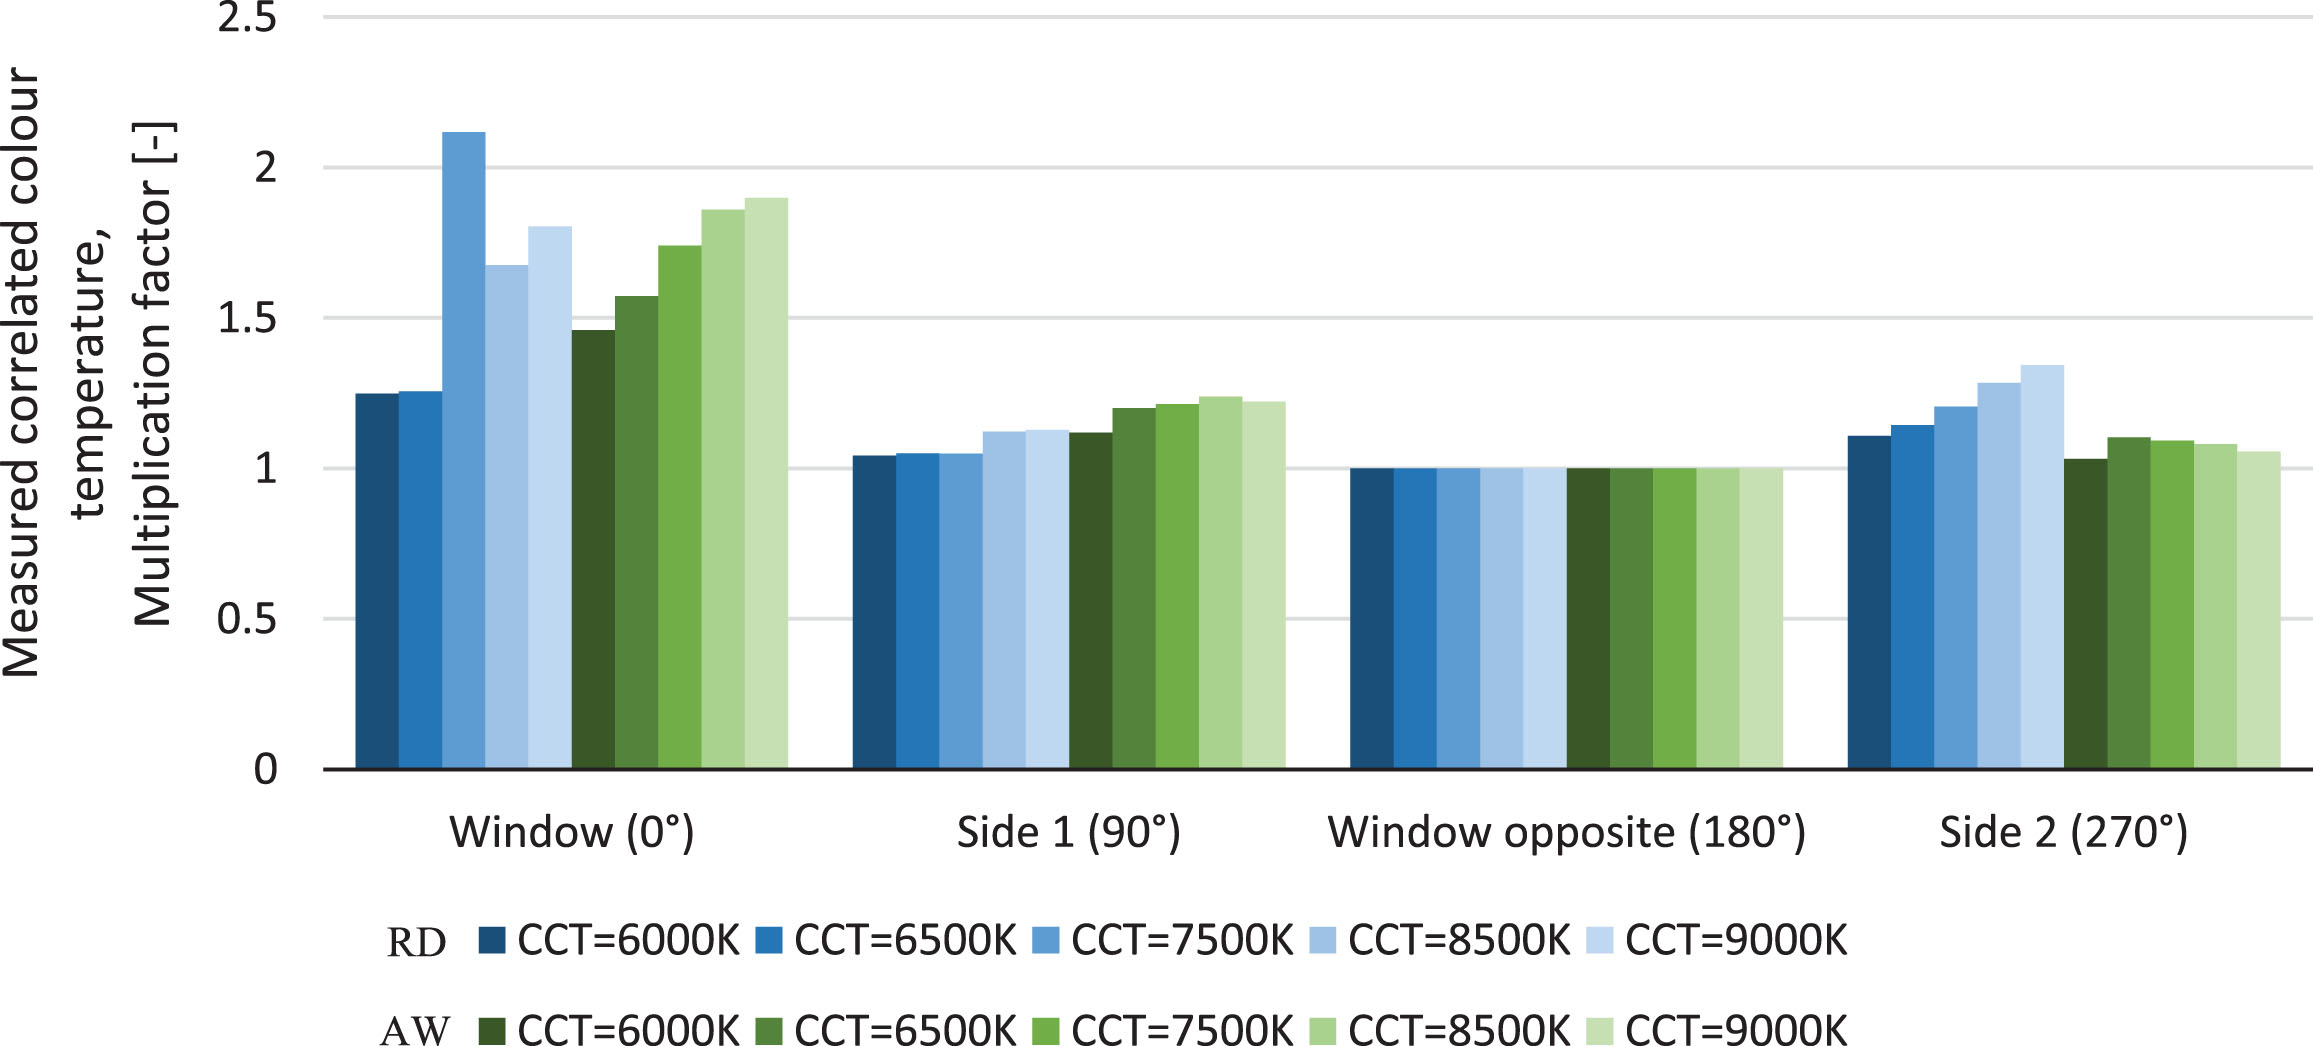
In Fig. 6, we find that for both the RD study and the AW study, the lowest measured vertical illuminance was always measured at 180° (the window opposite) and that the multiplication factor for 0° (the window side) was at least 15 for the RD setup and at least 12.3 for the AW setup. Figure 7 shows that the multiplication factor for the CCT was less varied than for the vertical illuminances. The lowest measured CCT was often, but not always, measured at the 180° viewing direction. The largest multiplication factor for the RD setup was found for the condition in which the outdoor CCT was 7500 K (i.e., 2.1), and the largest multiplication factor for the AW setup was the arrangement in which the CCT of the AW was 9000 K (i.e., 1.9). Overall, the CCT was nearly the same among the different viewing directions, whereas the levels of vertical illuminance differed.
As described in section 3.2.1.1, 60 different office configurations were investigated. As previously discussed, the standard arrangement consisted of a CCT of the AW of 6500 K, a distance between the AW and the simulated viewpoint of 1.0 m, a horizontal illuminance emitted by the fluorescent light source of 500 lx, and the position of the fluorescent light source directly above the simulated viewpoint (i.e., 0 m).
Figure 8 shows the differences in the multiplication factors for the vertical illuminances in the different office configuration variables (i.e., the distance between the AW and the simulated viewpoint, the horizontal illuminance emitted by the fluorescent light source, and the position of the fluorescent light source). Figure 9 shows these differences in multiplication factors for the CCTs.
Fig.8
Experimental studies: Multiplication factors for the vertical illuminances of the three variables for the different office configurations.
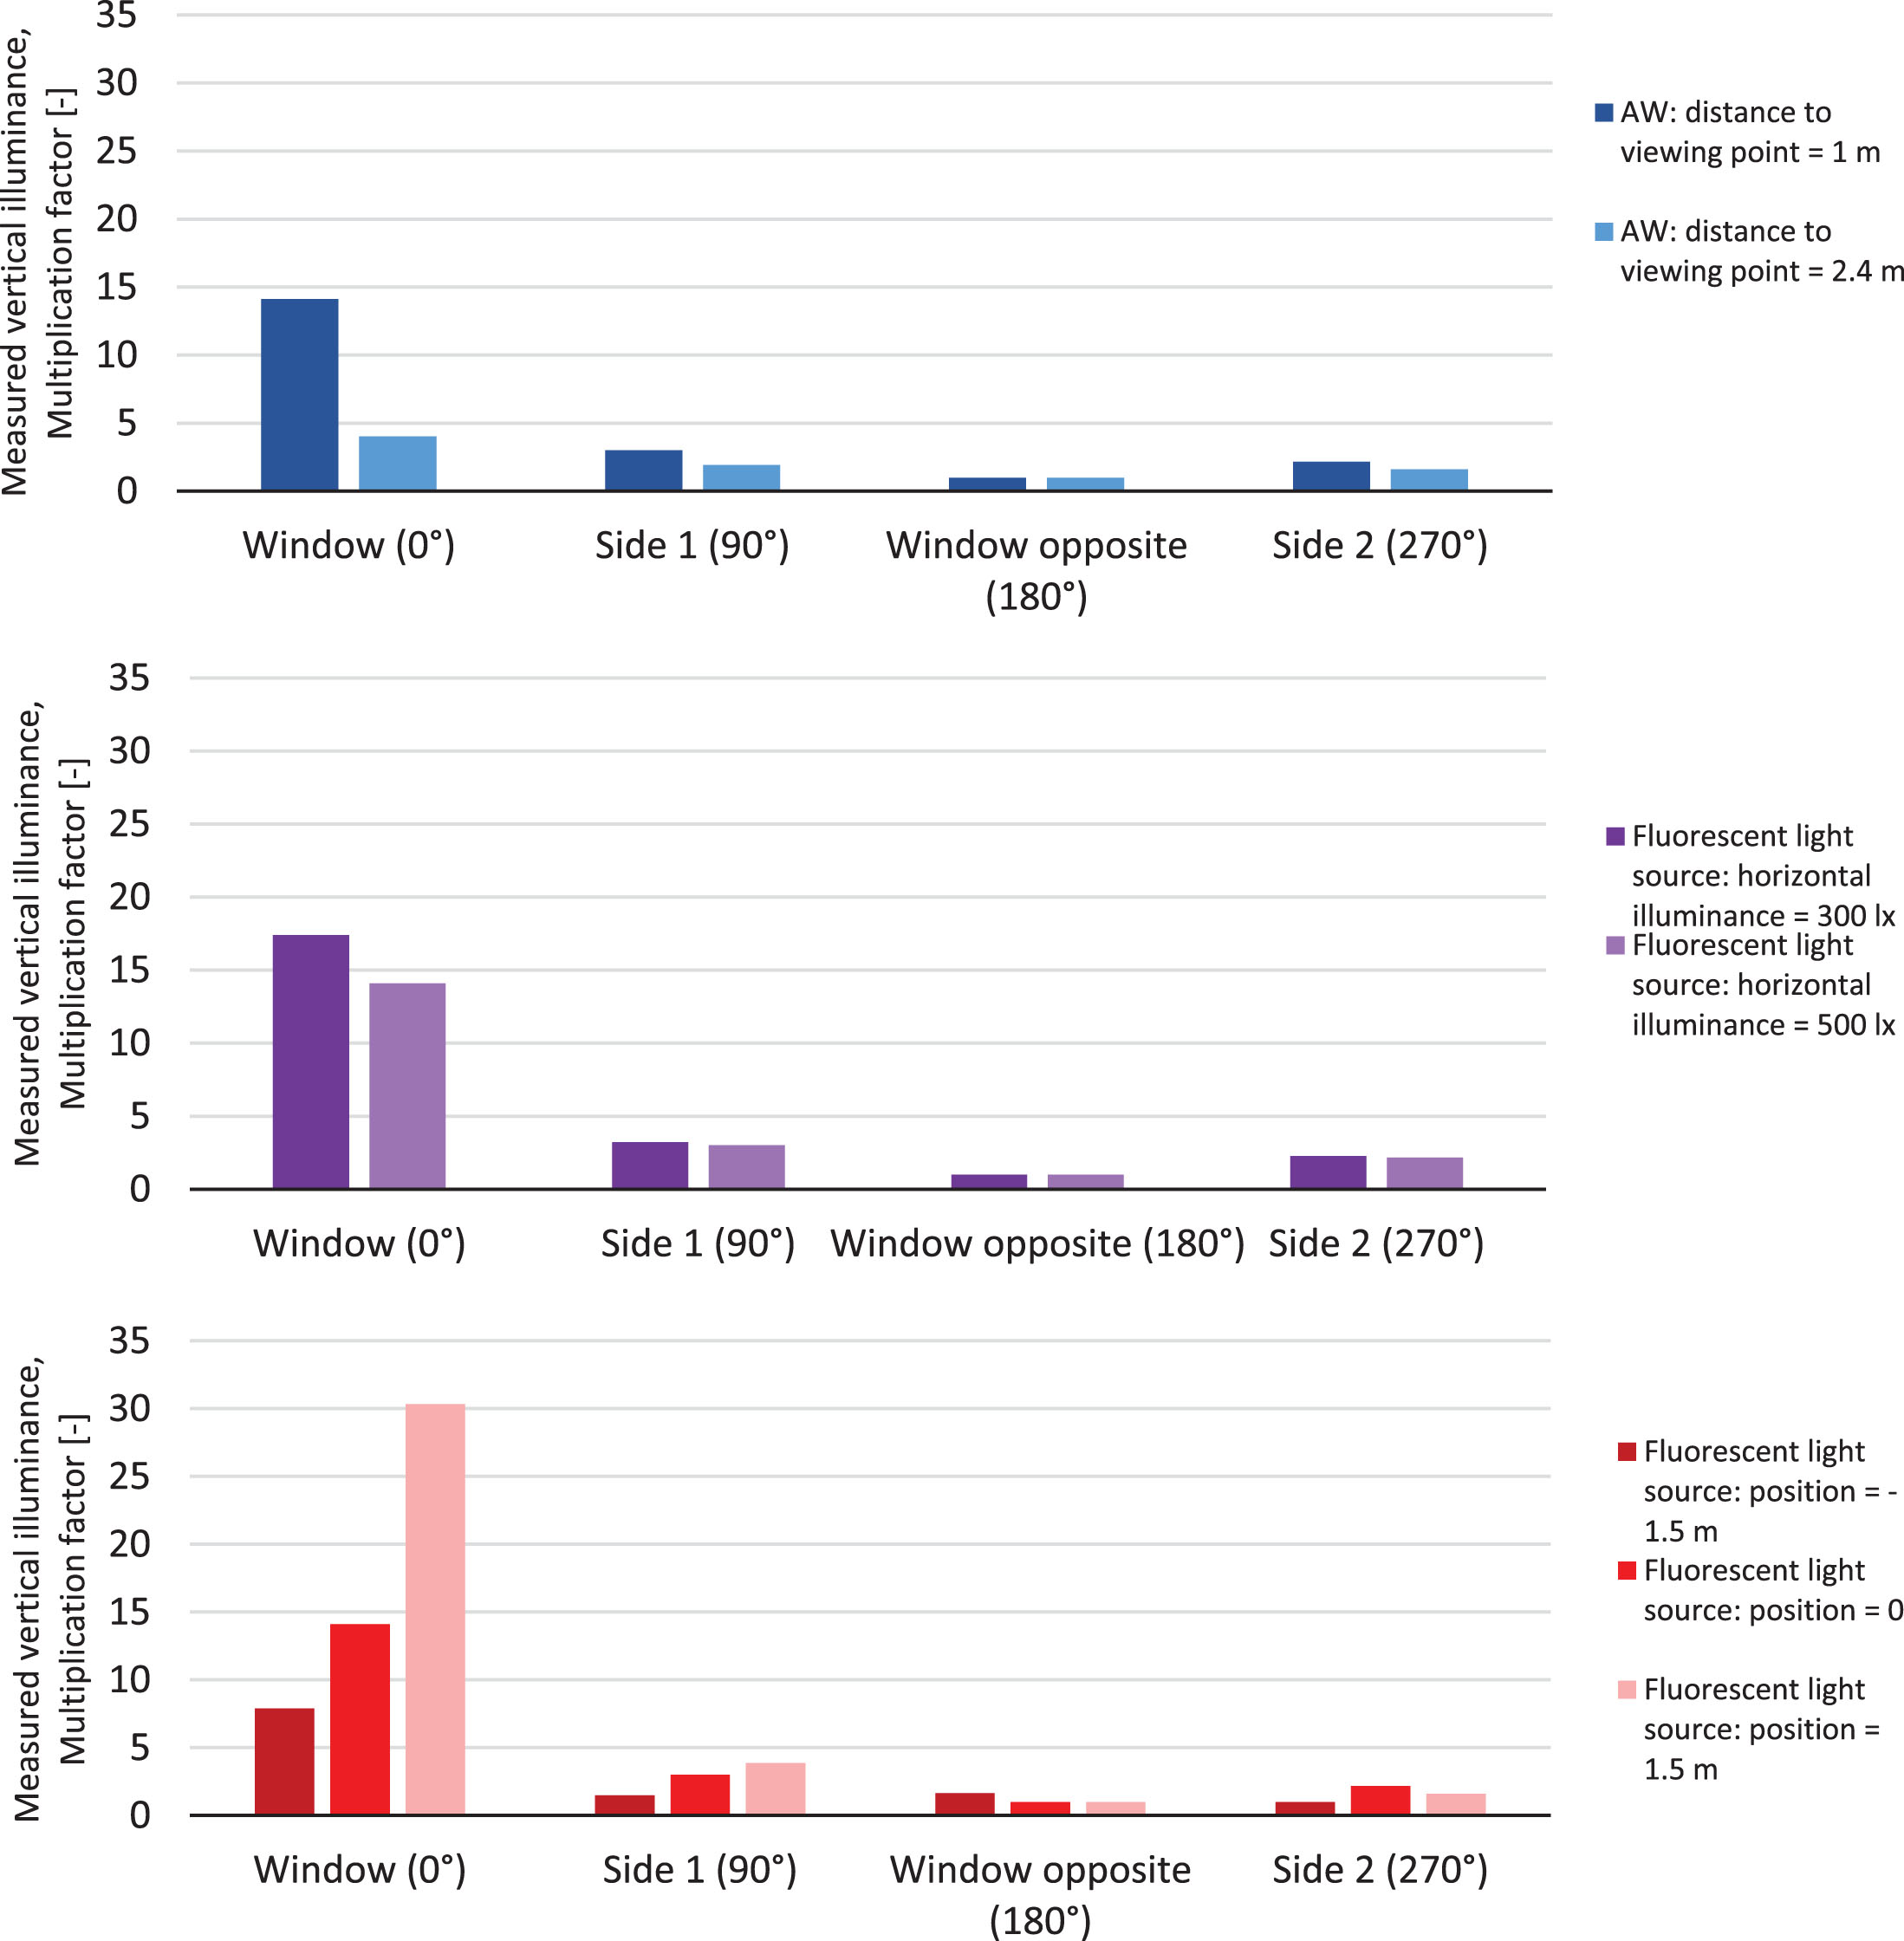
Fig.9
Experimental studies: Multiplication factors for correlated colour temperatures of the three variables for the different office configurations.
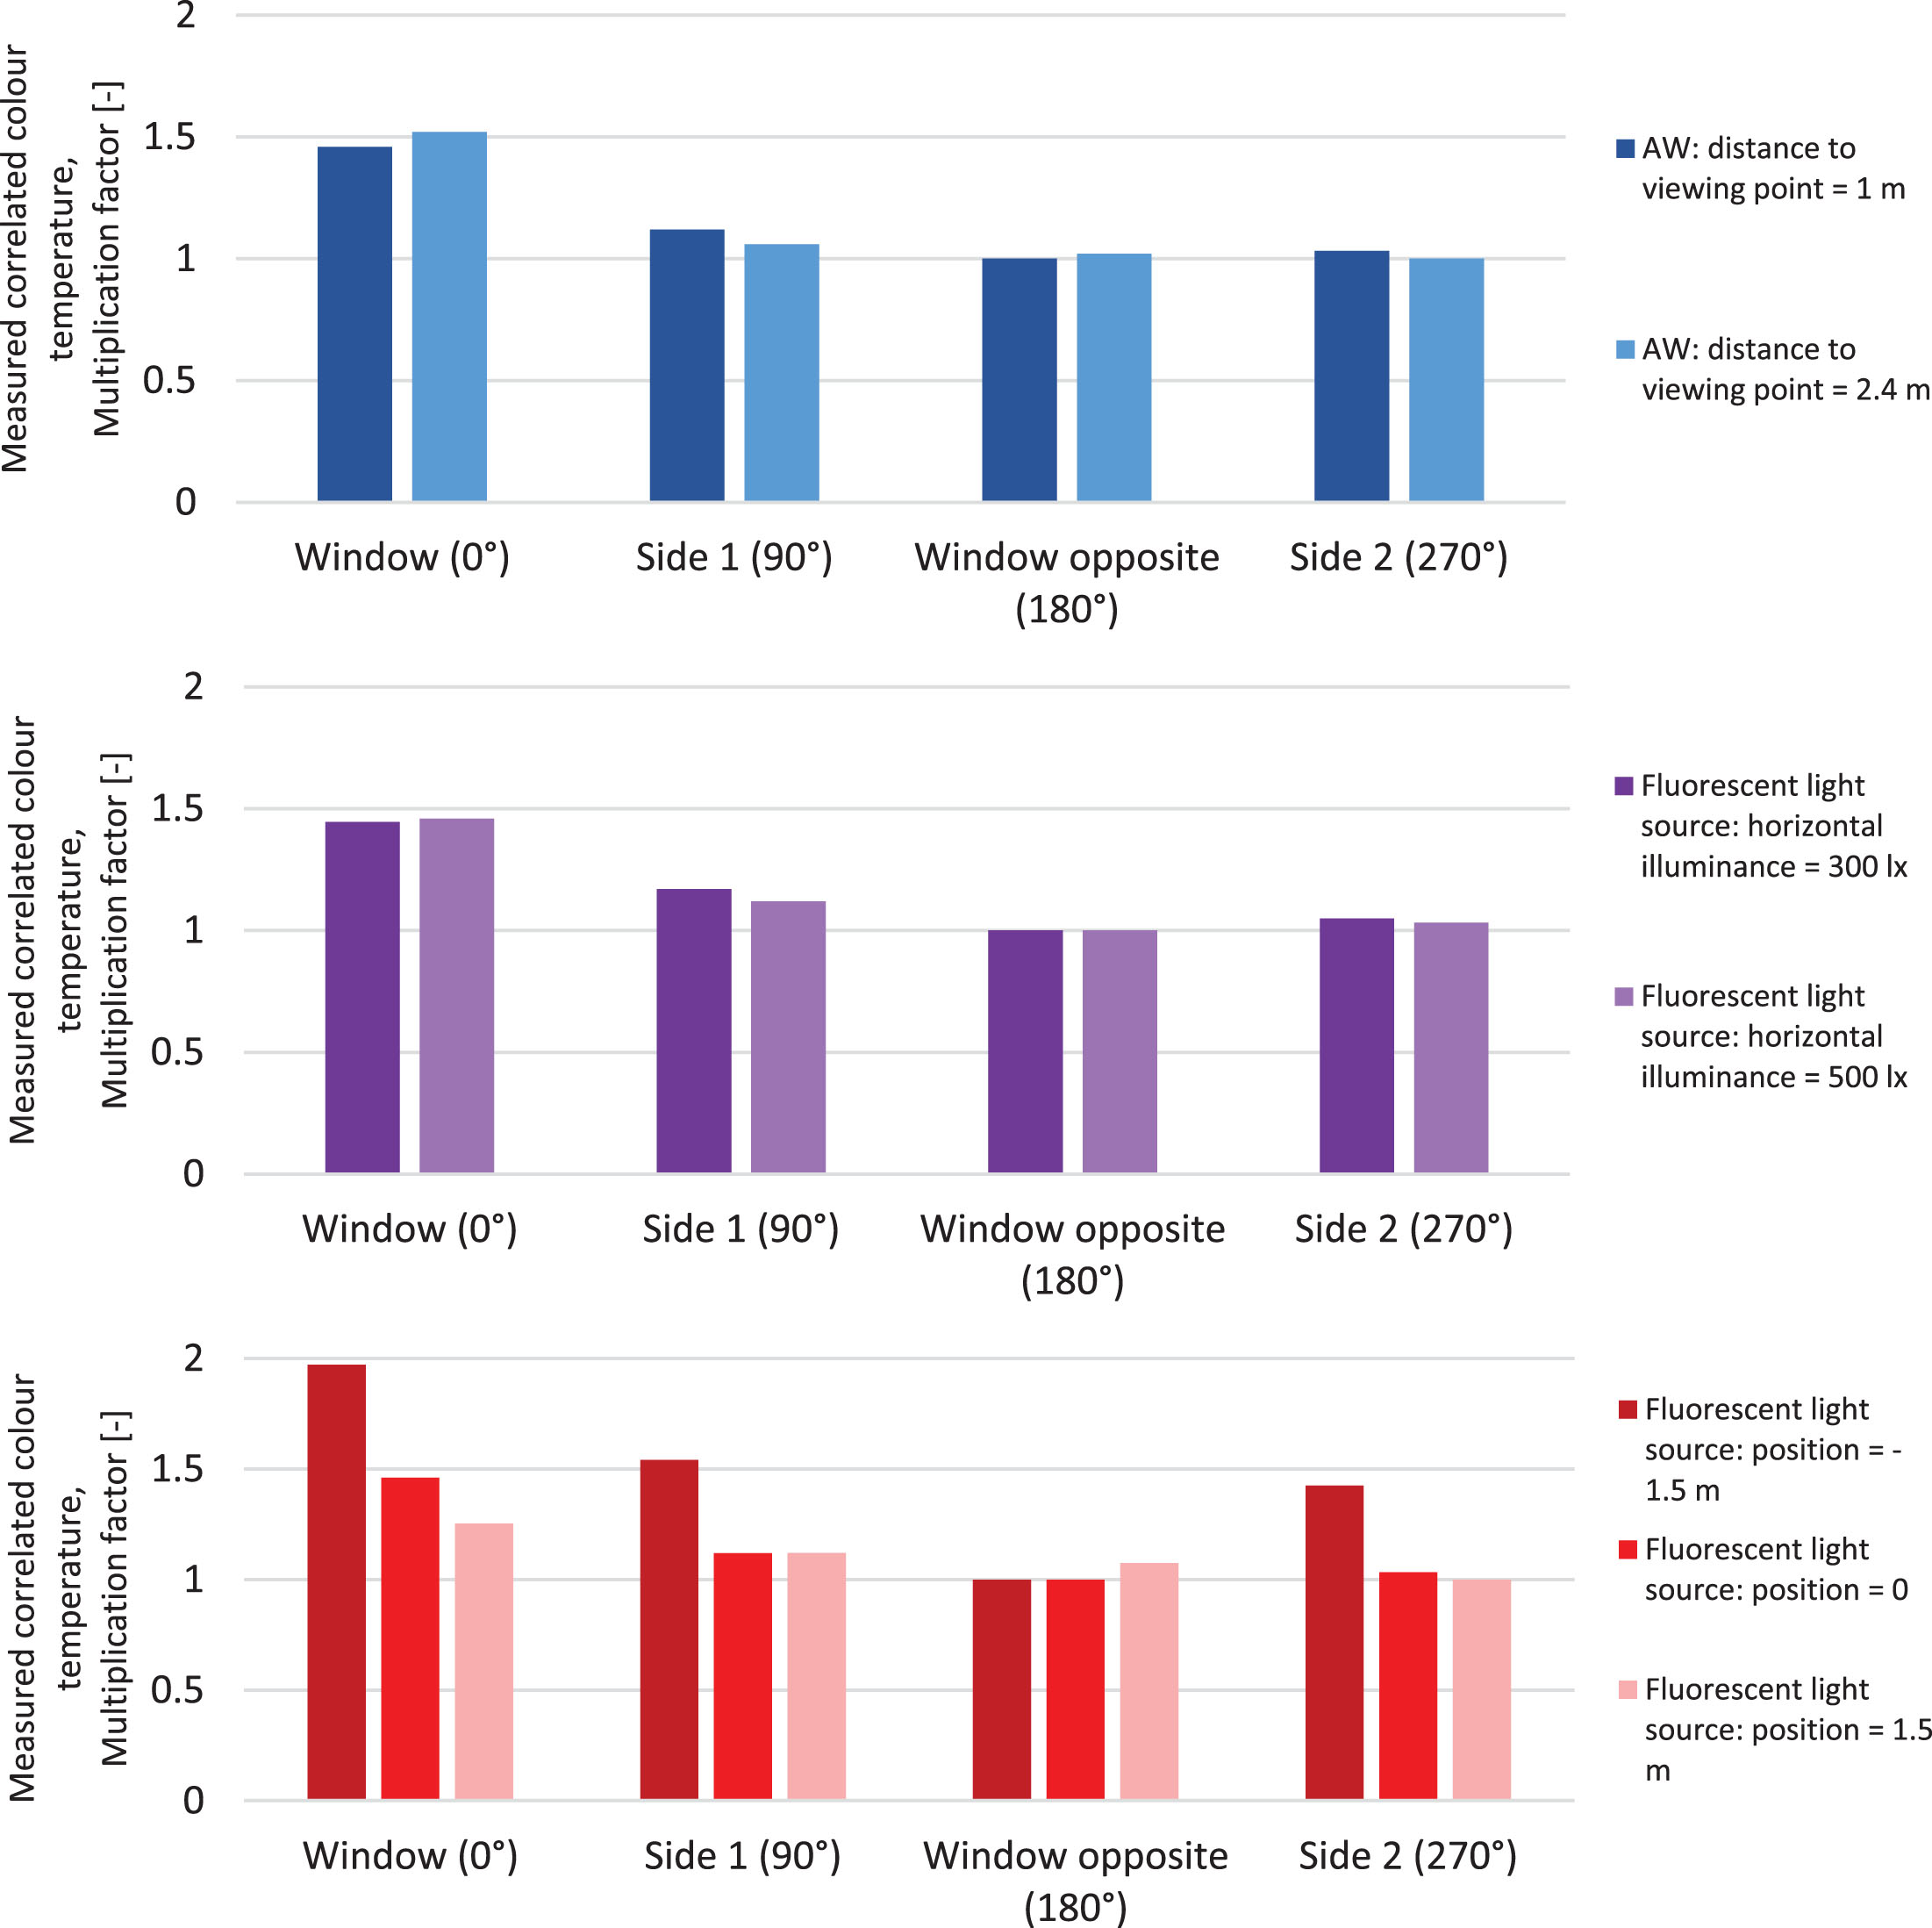
Figure 8 shows that the highest multiplication factors for illuminance were found for the window side (0° viewing direction). The three variables showed differences in their multiplication factors. First, the multiplication factors were higher when the AW was placed closer to the simulated viewing point than when it was further away. Second, the arrangement of 300 lx emitted by the fluorescent light source resulted in higher multiplication factors compared to the 500 lx arrangement. Third, the arrangement in which the fluorescent light source was positioned in between the AW and the simulated viewing point (i.e., position =– 1.5) resulted in the highest multiplication factors for this aspect. Comparing the three variables demonstrates that the differences between the options were the largest for the position of the fluorescent light source.
For their part, the differences in the multiplication factors for the CCTs did not vary much (Fig. 9) The position of the fluorescent light source provided the largest differences between the different options. However, the differences in multiplication factors for different office configurations were far more notable for the vertical illuminance measurements compared to the CCTs.
3.3.2Observational study: Occupant’s position and viewing direction
Table 6 provides the POT that the office workers were present or absent at their workstations, and when present, which viewing direction they were looking. As shown in Table 6, in terms of their POT, the workers differed the most when looking at their computer screen, between 84.6% and 97.1%.
3.3.3Sample calculation
Equation 4 was populated with the results from the experimental studies, the indications from the observational study, and the two assumptions regarding the total time at the workstations (i.e., 8 hours) and the minimum light aspect (i.e., Evert = 500 lx in viewing direction 180°). Two variants were computed in this sample calculation. Variant 1, in which the office worker was looking toward the computer monitor 100% of the working time, resulted in a daily office luminous exposure of 8040 lxh (see Equation 5). Variant 2, in which the POT the office worker was looking in a certain direction were based on the observational study, resulted in a daily office luminous exposure of 8428 lxh (see Equation 6). Although the POT looking toward the window were extremely small— the POT looking toward the window was 0.7%, compared to the POT looking toward the computer screen at 97.2% — the comparison still demonstrated an increase of 4.6% in daily office luminous exposure in variant 2 compared to variant 1.
Equation 5: Calculation of the daily office luminous exposure for variant 1. The calculation includes lighting conditions from four viewing directions: toward the window (0°), toward the computer screen or the computer screen opposite (90° or 270°), or toward the window opposite (180°). The multiplication factors for the four viewing directions (0°, 90°, 180°, and 270°) are, respectively, 18.74, 2.01, 1, and 2.01. In variant 1, the office worker was assumed to be looking toward the computer (90°) for the entire time (100% = 1.0).
Equation 6: Calculation of the daily office luminous exposure for variant 2. The calculation includes lighting conditions from four viewing directions: toward the window (0°), toward the computer screen or the computer screen opposite (90° or 270°), or toward the window opposite (180°). The multiplication factors for the four viewing directions (0°, 90°, 180°, and 270°) are, respectively, 18.74, 2.01, 1, and 2.01. In variant 2, the percentages of time for the four viewing directions were assumed to be those found in the observational study (see Table 6). The results showed that for 0.7% (0.007) of the time, the office worker was looking in direction 0°; for 97.2% (0.972) of the time, in direction 90°; for 2% (0.02) of the time, in direction 180°; and for 0.1% (0.001) of the time, in direction 270°.
4Discussion
The purpose of the literature review was to summarize the current measurement methodologies used in light and alertness studies and to identify any potential methodological issues. The aim of the investigations regarding office workers’ positions and viewing directions was to determine the differences in lighting conditions for different viewing directions and to analyse these differences in 60 unique office configurations.
The literature review discussed four methodological aspects— which light aspects were investigated, and how, when, and where were the light measurements were performed— as they pertained to light and alertness studies. We found that photometric light quantities were included and measured the most in the literature. This can be explained by the fact that current standards continue to focus on photometric quantities (e.g., for offices, recommending a horizontal illuminance of 500 lx at desk level). However, measuring only photometric quantities while investigating the NIF effects of light is insufficient. While photometric quantities relate to the spectral sensitivity of the rods and cones, a third photoreceptor— ipRGC [17]— is a strong contributor to the NIF effects. Since the spectral sensitivity of ipRGCs differs from the spectral sensitivity of rods and cones, radiometric quantities (i.e., quantities not having spectral sensitivities already included, so that the measurements can be converted to any desired α-opic [16]) need to be included when investigating the NIF effects of light. In our review, we found that the number of papers including more than just photometric quantities (e.g., radiometric quantities, such as SPDs) has increased over the years (see Table 2). The discovery of ipRGCs and the many papers suggesting both the importance of including more than just photometric quantities [16] and the value of describing the total lit environment, rather than just individual aspects within it [9], is likely to have contributed to this growing body of work. Additionally, the expanding number of light aspects included and measured in each paper also strongly contributes to researchers being able to replicate studies and compare results. Furthermore, numerous authors— especially those working in fields of multidisciplinary research— have recommended that investigators measure and describe the lighting conditions of their respective studies as comprehensively as possible [5–9].
In addition to adequately and accurately measuring and describing the lit environment, some researchers have also highly recommended that researchers describe how, when, and where their light measurements were performed [7]. That said, the majority of the papers (i.e., 14 out of 24 that included objective light measurements) did not provide sufficient details regarding their measurement instruments. As the level of accuracy and practical issues per measurement device differ, we believe it is essential for all researchers to provide the specifications of their measurement instruments. Wearables instruments used for PBM studies are often cheaper and less-developed than instruments used for LBM studies and, therefore, the former may cause a higher number of performance errors [46].
It is also important to note that while one of the two papers utilizing PBM used a measurement interval of less than one hour, only five of the 21 studies utilizing LBM were measured at this same interval. Wearables (PBM) are often used in studies to monitor daily luminous exposure continuously and, therefore, it is more common to measure these lighting conditions at shorter intervals. Additionally, the measurement interval also depends on the range of lighting conditions: a broad range of lighting conditions necessitates measuring those conditions more frequently. Under laboratory conditions, lighting conditions are often more controlled— especially when daylight is excluded— which makes it easier to investigate one single element. However, the significant advantage of performing field studies is that these types of investigations are conducted in realistic work environments; thus, there is no need to doubt the possibility of extending the results to real-world environments. Yet, we found that of the 26 investigations, only eight were performed in the field.
Furthermore, from the literature review, only seven papers described average lighting conditions. Lighting conditions measured at the personal level (as categorized in Table 3) means that the light measurements were performed at the exact position of the office worker. However, our observational study showed that the participants were at their workstations for an average of 81% of their time. Thus, it is recommended that investigators ‘follow’ office workers to determine their personal lighting conditions. Moreover, based on our experimental studies, we recommend including the viewing directions of the office workers, as well. We found that the measured vertical illuminances at the window side were 12 to 15 times higher compared to the side opposite the window. The differences in multiplication factors for different office configurations also demonstrate the importance of specific office layouts in order to optimize the lighting conditions for office workers. Since light emitted from the fluorescent light source came from above, and the light emitted from the AW came from the side (see Fig. 2), the two light sources likely caused different light distribution within the space, thereby producing the differences in the multiplication factors.
In comparison, the multiplication factors for the CCT were much lower. This may be explained by the smaller range of occurring CCTs. Despite the fact that the office workers were looking in the direction of their computers practically the entire time— 92.5%, on average— the individual differences (provided in Table 6), in combination with the sample calculation in section 3.3.3, indicate that, besides worker position, companies and researchers should take the viewing direction of the employees into account when determining personal lighting conditions. Ultimately, we believe that implementing the proposed multiplication factors for vertical illuminance and the CCTs for different viewing directions under the newly developed, practical, unobtrusive LBE method may increase accuracy overall [11].
4.1Limitations of the studies
The time that an office worker is present at her or his workstation or looking in a particular direction depends on many factors: the job type of that worker (e.g., work schedule and tasks [47]); the workstation itself (e.g., computer monitor setting [48], availability of a task light [49], or the utilization of a sit-stand workstation [50]); the orientation of the workstation (e.g., the position of the desk, the position of doors and colleagues); and the office worker’s eye functionality (e.g., using optical lenses or suffering from dry eyes or eye fatigue [51]). As discussed, the office workers in this observational study were selected based on their workstations— specifically, the workers’ orientation toward the window and the distance to the window— but any of the factors above could produce different results. Thus, it is important that our findings are not overly generalized.
Moreover, as it pertains to lit office environments, the multiplication factors for the differences in the lighting conditions between the different viewing directions may guide one toward an optimal office configuration. However, light is, of course, just one important aspect of the whole work environment, and any particular office configuration should be established based on multiple aspects (e.g., the policy of a company to cluster certain departments within a particular space). Furthermore, not every office worker is going to prefer the highest lighting conditions as the ‘optimal’ situation, so the multiplication factors should be considered along with individual preferences [52], not to mention potential glare caused by the lighting conditions. Although individual preferences and glare are outside of the scope of this paper, these are ripe avenues for future research.
4.2Opportunities for practitioners
The literature review demonstrated that in nearly all the studies, light measurements were performed using LBM instruments and that these measurements were sometimes averaged over the entire environment. Averaging light measurements in this way precludes providing information about the specific locations (e.g., the distance to a window) of the occupants. Since all individuals differ, the light effect on each person (e.g., their health or alertness) will be unique. This fact increases the importance of measuring lighting conditions at the individual level, as we discussed above.
Measuring personal lighting conditions is not only about the position of the individual, as one’s viewing direction also influences the magnitude of the lighting conditions to which she or he is exposed. These differences— expressed in multiplication factors— highlight the importance of office configurations, raise awareness about potential differences of lighting conditions within office spaces, and provide practical opportunities for light ergonomics in various work environments.
5Conclusion
Our literature review showed that researchers were not fully mapping the lit environment during their light effect studies, as was also suggested by the CIE [7, 9]. We found that photometric quantities were included and measured the most in light effect studies, which makes sense, as this is aligned with existing knowledge regarding light aspects and the effects on vision. However, it is currently recommended that one include radiometric quantities as well, particularly when investigating the NIF effects of light. Furthermore, we found that the light aspects in the research were often averaged over time or over location, whereas accurate light effect studies should investigate the potential effects of light, usually per individual. As touched on above, every individual responds differently to light. Therefore, lighting conditions need to be measured at the individual level as well across spaces. Personal lighting conditions provide essential information, allowing researchers to draw firm conclusions in their light effect studies.
In the second part of this paper, we described the experiments we conducted that demonstrated significant differences in lighting conditions among four viewing directions, finding those vertical illuminances measured in the direction toward the window were 12 to 15 times higher compared to the opposite viewing direction. It was demonstrated that the differences in lighting conditions between viewing directions were more significant when the desk was located closer to the window. Furthermore, our sample calculation, which included the POT that an office worker was looking in certain directions, showed that a deviation of 4.6% in daily office luminous exposure could be avoided when viewing direction is accurately included. Therefore, the viewing direction of an individual also needs to be incorporated in the determination of personal lighting conditions.
Conflict of interest
The authors declare no conflicts of interests.
Acknowledgments
This research was performed within the framework of the strategic joint research program on Intelligent Lighting between TU/e and Koninklijke Philips N.V. and the Impuls II SPARK programme. Ir. Mats Burgmans is recognized and thanked for the data collection. The authors also wish to thank Dr. Kelly A. Mulder for her contributions as they pertain to the language review.
References
[1] | Souman JL, Tinga AM, te Pas SF, van Ee R, Vlaskamp BNS. Acute alerting effects of light: A systematic literature review. Behav Brain Res. (2018) ;337: :228–39. |
[2] | Hirning MB, Isoardi GL, Coyne S, Garcia Hansen VR, Cowling I. Post occupancy evaluations relating to discomfort glare: A study of green buildings in Brisbane. Build Environ. (2013) ;59: :349–57. |
[3] | Rowbottom I. Improving Productivity with Light Controls: Technical white paper, (2009) . |
[4] | Boyce PR. Human Factors in Lighting, 3. CRC Press; (2014) . |
[5] | van Duijnhoven J, Aarts MPJ, Aries MBC, Rosemann ALP, Kort HSM. Systematic review on the interaction between office light conditions and occupational health: Elucidating gaps and methodological issues. Indoor Built Environ. (2019) ;28: (2):152–74. |
[6] | van Hoof J, Westerlaken AC, Aarts MPJ, Wouters EJM, Schoutens AMC, Sinoo MM, et al. Light therapy: Methodological issues from an engineering perspective. Technol Heal Care. (2012) ;20: (1):11–23. |
[7] | CIE. CIE 213:2014: Guide to protocols for describing lighting [Internet]. CIE Central Bureau; (2014) . Available from: http://www.cie.co.at/publications/guide-protocols-describing-lighting. |
[8] | Aarts MPJ, Aries MBC, Diakoumis A, van Hoof J. Shedding a light on phototherapy studies with people having dementia: A critical review of the methodology from a light perspective. Am J Alzheimers Dis Other Demen [Internet]. (2016) ;31: (7):551–63. |
[9] | CIE. CIE 218:2016: Research Roadmap for Healthful Interior Lighting Applications. (2016) . |
[10] | van Duijnhoven J, Burgmans MJH, Aarts MPJ, Rosemann ALP, Kort HSM. Personal Lighting Conditions to Obtain More Evidence in Light Effect Studies. In: Proceedings of the 20th Congress of the International Ergonomics Association (IEA 2018). Springer; (2018) , pp. 110-21. |
[11] | van Duijnhoven J, Aarts MPJ, Kort HSM, Rosemann ALP. External validations of a non-obtrusive practical method to measure personal lighting conditions in offices. Build Environ. (2018) ;134: :74–86. |
[12] | van Duijnhoven J, de Bakker C, Aarts MPJ, Rosemann ALP, Kort HSM. An unobtrusive practical method to derive individual’s lighting conditions in office environments. In: Proceedings of the 2017 IEEE 14th International Conference on Networking, Sensing and Control, ICNSC 2017. Calabria, Italy; (2017) , pp. 471-5. |
[13] | van Duijnhoven J, Aarts MPJ, Aries MBC, Böhmer MN, Rosemann ALP. Recommendations for measuring non-image-forming effects of light: A practical method to apply on cognitive impaired and unaffected participants. Technol Heal Care. (2017) ;25: (2):171–86. |
[14] | van Duijnhoven J, Aarts MPJ, Rosemann ALP, Kort HSM. Office light: Window distance and lighting conditions influencing occupational health. In: Proceedings of Healthy Buildings Europe, Lublin, Poland, (2017) , pp. 1-2 (0083). |
[15] | Vera F, Rivera R, Ortíz M. A simple experiment to measure the inverse square law of light in daylight conditions. Eur J Phys. (2014) ;35: (1). |
[16] | Lucas RJ, Peirson SN, Berson DM, Brown TM, Cooper HM, Czeisler CA, et al. Measuring and using light in the melanopsin age. Trends Neurosci. (2014) ;37: (1):1–9. |
[17] | Berson DM, Dunn FA, Takao M. Phototransduction by retinal ganglion cells that set the circadian clock. Science. (2002) ;295: (5557):1070–3. |
[18] | CIE. CIE S 017/E:2011: ILV: International Lighting Vocabulary. (2011) . |
[19] | Hoffmann G, Gufler V, Griesmacher A, Bartenbach C, Canazei M, Staggl S, et al. Effects of variable lighting intensities and colour temperatures on sulphatoxymelatonin and subjective mood in an experimental office workplace. Appl Ergon. (2008) ;39: (6):719–28. |
[20] | Eklund NH, Boyce PR, Simpson SN. Lighting and sustained performance. J Illum Eng Soc. (2000) ;29: (1):116–30. |
[21] | Sivaji A, Shopian S, Nor ZM, Chuan N-K, Bahri S. Lighting does matter: Preliminary assessment on office workers. Procedia - Soc Behav Sci. (2013) ;97: :638–47. |
[22] | Maierova L, Borisuit A, Scartezzini J-L, Jaeggi SM, Schmidt C, Münch M. Diurnal variations of hormonal secretion, alertness and cognition in extreme chronotypes under different lighting conditions. Sci Rep. (2016) ;6: (33591). |
[23] | Smolders KCHJ, de Kort YAW. Investigating daytime effects of correlated colour temperature on experiences, performance, and arousal. J Environ Psychol. (2017) ;50: :80-93. |
[24] | Yuda E, Ogasawara H, Yoshida Y, Hayano J. Enhancement of autonomic and psychomotor arousal by exposures to blue wavelength light: Importance of both absolute and relative contents of melanopic component. J Physiol Anthropol. (2017) ;1-8. |
[25] | Boyce PR, Veitch JA, Newsham GR, Jones CC, Heerwagen J, Myer M, et al. Lighting quality and office work: Two field simulation experiments. Light Res Technol. (2006) ;38: (3):191–223. |
[26] | Mills PR, Tomkins SC, Schlangen LJM. The effect of high correlated colour temperature office lighting on employee wellbeing and work performance. J Circadian Rhythms. (2007) ;5: :2. |
[27] | Viola AU, James LM, Schlangen LJM, Dijk D-J. Blue-enriched white light in the workplace improves self-reported alertness, performance and sleep quality. Scand J Work Environ Health. (2008) ;34: (4):297–306. |
[28] | de Kort YAW, Smolders KCHJ. Effects of dynamic lighting on office workers: First results of a field study with monthly alternating settings. Light Res Technol. (2010) ;42: (3):345–60. |
[29] | Chellappa SL, Steiner R, Blattner P, Oelhafen P, Go T. Non-visual effects of light on melatonin, alertness and cognitive performance: Can blue-enriched light keep us alert? PLoS One. (2011) ;6: (1). |
[30] | Iskra-Golec IM, Wazna AMA, Smith L. Effects of blue-enriched light on the daily course of mood, sleepiness and light perception: A field experiment. Light Res Technol. (2012) ;44: :506–13. |
[31] | Smolders KCHJ, de Kort YAW, Cluitmans PJM. A higher illuminance induces alertness even during office hours: Findings on subjective measures, task performance and heart rate measures. Physiol Behav. (2012) ;107: (1):7–16. |
[32] | Bahri S, Nur Sajidah S, Sivaji A. Alertness, visual comfort, subjective preference and task performance assessment under three different light’s colour temperature among office workers. Adv Eng Forum. (2013) ;10: :77–82. |
[33] | Hubalek S, Brink M, Schierz C. Office workers’ daily exposure to light and its influence on sleep quality and mood. Light Res Technol. (2010) ;42: (1):33–50. |
[34] | Figueiro MG, Kalsher M, Steverson BC, Heerwagen J, Kampschroer K, Rea MS. Circadian-effective light and its impact on alertness in office workers. Light Res Technol. (2018) ;51: (2):171–83. |
[35] | Borisuit A, Linhart F, Scartezzini J-L, Munch M. Effects of realistic office daylighting and electric lighting conditions on visual comfort, alertness and mood. Light Res Technol. (2014) ;47: (2):192–209. |
[36] | Toftum J, Thorseth A, Markvart J, Logadóttir Á. Occupant response to different correlated colour temperatures of white LED lighting. Build Environ. (2018) ;143: :258–68. |
[37] | van Duijnhoven J, Aarts MPJ, Rosemann ALP, Kort HSM. Ambiguities regarding the relationship between office lighting and subjective alertness: An exploratory field study in a Dutch office landscape. Build Environ. (2018) ;142: :130-8. |
[38] | te Kulve M, Schlangen LJM, Schellen L, Frijns AJH, van Marken Lichtenbelt W. The impact of morning light intensity and environmental temperature on body temperatures and alertness. Physiology. (2017) ;175: :72–81. |
[39] | de Vries A, Souman JL, de Ruyter B, Heynderickx I, de Kort YAW. Lighting up the office: The effect of wall luminance on room appraisal, office workers’ performance, and subjective alertness. Build Environ. (2018) ;142: :534–43. |
[40] | CIE. CIE S 026/E:2018: CIE System for Metrology of Optical Radiation for ipRGC-Influenced Responses to Light. (2018) . |
[41] | Khademagha P, Aries MBC, Rosemann ALP, van Loenen EJ. A multidirectional spectral measurement method and instrument to investigate non-image-forming effects of light. Meas Sci Technol. (2018) ;29: (8):085902. |
[42] | The Royal Netherlands Meteorological Institute (KNMI). Daggegevens van het weer in Nederland [Internet]. (2019) [cited 2018 Jan 18]. Available from: https://www.knmi.nl/nederland-nu/klimatologie/daggegevens. |
[43] | NEN. NEN-EN 12464-1:2011 en - NEN. (2011) . |
[44] | Kruisselbrink TW, Aries MBC, Rosemann ALP. A practical device for measuring the luminance distribution. Int J Sustain Light. (2017) ;36: :75–90. |
[45] | CCMO (Centrale Commissie Mensgebonden Onderzoek). Your research: Is it subject to the WMO or not? [Internet]. (2019) . Available from: https://english.ccmo.nl/investigators/legal-framework-for-medical-scientific-research/your-research-is-it-subject-to-the-wmo-or-not. |
[46] | Aarts MPJ, van Duijnhoven J, Aries MBC, Rosemann ALP. Performance of personally worn dosimeters to study non-image forming effects of light: Assessment methods. Build Environ. (2017) ;117: :60–72. |
[47] | De Bakker C, Van De Voort T, Rosemann ALP. The energy saving potential of occupancy-based lighting control strategies in open-plan offices: The influence of occupancy patterns. Energies. (2018) ;11: (2). |
[48] | Kothiyal K, Bjørnerem AM. Effects of computer monitor setting on muscular activity, user comfort and acceptability in office work. Work. (2009) ;32: (2):155–63. |
[49] | Joines S, James T, Liu S, Wang W, Dunn R, Cohen S. Adjustable task lighting: Field study assesses the benefits in an office environment. Work. (2015) ;51: (3):471–81. |
[50] | Mula A. Ergonomics and the standing desk. Work. (2018) ;60: (2):171–4. |
[51] | Tebboune CE-B, Mebarki B. VDU workstations and vision in post office and bank operators. Work. (2012) ;41: (Suppl 1):3563-7. |
[52] | Veitch JA, Newsham GR. Preferred luminous conditions in open-plan offices: Research and practice recommendations. Light Res Technol. (2000) ;32: (4):199–212. |
[53] | Cajochen C, Zeitzer JM, Czeisler CA, Dijk DJ. Dose-response relationship for light intensity and ocular and electroencephalographic correlates of human alertness. Behav Brain Res. (2000) ;115: (1):75–83. |
[54] | Kozaki T, Miura N, Takahashi M, Yasukouchi A. Effect of reduced illumination on insomnia in office workers. J Occup Health. (2012) ;54: (4):331–5. |
[55] | Wahnschaffe A, Haedel S, Rodenbeck A, Stoll C, Rudolph H. Out of the lab and into the bathroom: Evening short-term exposure to conventional light suppresses melatonin and increases alertness perception. Int J Mol Sci. (2013) ;14: (2):2573–89. |
[56] | Yuda E, Ogasawara H, Yoshida Y, Hayano J. Exposure to blue light during lunch break: Effects on autonomic arousal and behavioral alertness. J Physiol An. (2017) ;36: (30):4–7. |


