
Prognostic value of tumor markers ProGRP, NSE and CYFRA 21-1 in patients with small cell lung cancer and chemotherapy-induced remission
Abstract
BACKGROUND:
Despite successful response to first line therapy, patients with small-cell lung cancer (SCLC) often suffer from early relapses and disease progression.
OBJECTIVE:
To investigate the relevance of serum tumor markers for estimation of prognosis at several time points during the course of disease.
METHODS:
In a prospective, single-center study, serial assessments of progastrin-releasing peptide (ProGRP), neuron-specific enolase (NSE), cytokeratin-19 fragments (CYFRA 21-1) and carcino-embryogenic antigen (CEA) were performed during and after chemotherapy in 232 SCLC patients, and correlated with therapy response and overall survival (OS).
RESULTS:
ProGRP, NSE and CYFRA 21-1 levels decreased quickly after the first chemotherapy cycle and correlated well with the radiological response. Either as single markers or in combination they provided valuable prognostic information regarding OS at all timepoints investigated: prior to first-line therapy, after two treatment cycles in patients with successful response to first-line therapy, and prior to the start of second-line therapy. Furthermore, they were useful for continuous monitoring during and after therapy and often indicated progressive disease several months ahead of radiological changes.
CONCLUSIONS:
The results indicate the great potential of ProGRP, NSE and CYFRA 21-1 for estimating prognosis and monitoring of SCLC patients throughout the course of the disease.
1Introduction
Lung cancer is the second most common malignancy and one of the most lethal solid cancers, with approximately 2.2 million new cases and nearly 1.8 million deaths reported worldwide in 2020 [1]. In the early stages, lung cancer is largely asymptomatic, and therefore most cases are diagnosed at a late stage [2].
Although less prevalent than non-small cell lung cancer (NSCLC), small cell lung cancer (SCLC) is characterized by a multilocular and aggressive growth pattern [3]. Despite the initial high sensitivity to chemo- and radiotherapies, treatment responses are often of short duration and recurrences, or progression of existing disease frequently occur after an initially successful first-line treatment [3]. Recently, new therapeutic approaches, including targeted or immune therapies, have demonstrated effectiveness even in advanced disease [3]. However, biomarkers are still required to identify patients who may benefit the most from specific therapies and those at risk of early disease progression [4]. Although radiological approaches can readily detect the initial response to therapy and quantify the shrinkage of neoplastic lesions, the early detection of persistent aggressiveness and increased regrowth capacity of the tumor can be determined with greater sensitivity through serial measurements of blood biomarkers [5].
To date, several biomarkers have demonstrated utility in the differential diagnosis and disease monitoring of both NSCLC and SCLC. These biomarkers include biomarkers carcinoembryonic antigen (CEA) and cytokeratin-19 fragments (CYFRA 21-1), which are useful for various histological subtypes of lung cancer [6, 7]. Additionally, there are biomarkers that specifically reflect the endocrine activity of SCLC, such as neuron-specific enolase (NSE) and progastrin-releasing peptide (ProGRP) [6, 8]. There is evidence that the combination of these serum biomarkers can support the histological subtyping of lung cancer [9, 10]. This is particularly important when dealing with multiple lesions or when biopsy material cannot be taken due to technical constraints, unfavorable tumor localization, or poor patient performance status.
In addition, these markers have shown great potential for monitoring of the disease course, especially in advanced stages during systemic therapies and post-treatment surveillance [10–12, 18–25]. In SCLC, the dynamics of ProGRP and NSE levels have been observed to reflect the response to treatment, with early and rapid decreases being associated with greater effectiveness and the achievement of partial remission upon radiological imaging [5, 11–16]. Unfortunately, computed tomography (CT) results can be ambiguous, with uncertain quantification of non-measurable lesions, interobserver variability, and different dynamics of tumor progression making it difficult to follow the patient’s status in every case. Additional information provided by biomarker dynamics may be helpful in providing a more comprehensive picture of patient response and prognosis.
In addition, the optimal frequency of patient monitoring after the completion of primary therapy and the initiation of novel treatments in case of disease progression remains to be established, as new drugs and combinations become available. Blood-based biomarkers could help to assess the risk of progression after the completion of primary therapy and to sensitively monitor and detect the resurgence of disease during the surveillance phase [17, 18].
The objective of the present study was to evaluate the dynamics of the biomarkers ProGRP, NSE, CYFRA 21-1 and CEA during treatment in a large cohort of patients with SCLC. The prognostic utility of these biomarkers when measured at different timepoints, either individually or combined was also determined. In particular, their ability to determine prognosis in patients who achieved partial remission during first-line therapy was evaluated. The results of this study are clinically meaningful, and may help establish optimal follow-up schedules for individual patients as well as early identification of those who will require timely initiation of second- or third-line treatments.
2Patients and methods
2.1Study population and design
This prospective single-centre study enrolled patients from Thoraxklinik, University Hospital Heidelberg, a specialized lung cancer center. Eligible patients had pathologically confirmed small cell lung cancer at any Union for International Cancer Control (UICC) stage, an Eastern Cooperative Oncology Group Performance Status score of 0-2, a and planned treatment with at least four cycles of chemotherapy. Patients with unobtainable blood samples, a history of secondary malignancy, or were pregnant or breastfeeding were excluded. Patients received either platinum-based doublet chemotherapy as first-line treatment or an appropriate single-agent cytotoxic treatment for any subsequent lines of therapy, as directed by their physician. Blood samples were collected from each patient before treatment and after each treatment cycle for the analysis of biomarkers. Radiological assessment of treatment response was performed by CT after every two cycles of chemotherapy, with tumor response categorized as partial response (PR), stable disease (SD), progressive disease (PD), or ‘other’ based on the response evaluation criteria in solid tumors (RECIST v1.1 [19]). Follow-up visits after therapy occurred every 4-6 weeks, and OS or censoring of data was documented at the last known date available.
The study was approved by the ethics committee of the University of Heidelberg (MZmu-446/2012 and MZmu 067/2013) and was performed in accordance with the Declaration of Helsinki and Good Clinical Practice. All patients provided written informed consent prior to any study-related procedures.
2.2Blood samples and biomarker analyses
Venous blood samples were collected into serum-gel monovettes (7.5 ml, Sarstedt, Nürmbrecht, Germany) and allowed to clot for at least 30 minutes at room temperature. Samples were then centrifuged at 2000 x g at 10°C within 1 to 2 hours of venepuncture. The resulting serum was divided into 500μL aliquots and stored below –70°C until analysis. The samples were shipped on dry ice to the Institute of Laboratory Medicine at the German Heart Centre Munich for analysis. Samples were thawed and processed in batches. Measurements were performed using a panel of electrochemiluminescence immunoassays (ECLIA) for in vitro diagnostics biomarkers (ProGRP, NSE, CYFRA 21-1, CEA) on a cobas® e 411 analyzer (Roche Diagnostic Solutions, Mannheim, Germany). All analyses were performed in a certified laboratory in accordance with the quality criteria outlined in the Guidelines of the German Federal Association. Laboratory data for patient samples and quality controls were electronically transferred for statistical evaluation. Clinical data were extracted from the patients’ medical records and recorded in electronic case report forms.
2.3Statistical analyses
All statistical analyses were performed using R (version 3.6.3; www.r-project.org). Patient demographics, disease characteristics and biomarker data were summarized for all patients using descriptive statistics. Biomarker dynamics were measured for all patients, while the correlation between OS and biomarker values was limited to the cohort of patients with advanced disease (UICC stages III and IV). The prognostic utility of the biomarkers was evaluated at three timepoints: (1) prior to first-line treatment in all patients with advanced disease, (2) after two cycles of treatment in patients who achieved a PR during first-line therapy, and (3) prior to second-line treatment in patients who either did not respond to first-line treatment or initially responded but subsequently experienced disease progression. Overall survival (OS) was defined as the time from the three timepoints described above to death from any cause.
The Kaplan-Meier method was used to estimate OS in subgroups defined by biomarker levels, with 95% confidence intervals (CIs) calculated for the median OS. Hazard ratios (HR) were calculated using Cox regression models. Biomarker cut-offs were optimized separately at each time point to obtain maximum risk differences (maximum HR between responder (defined as PR) and non-responder groups (defined as SD or PD), with all quantiles from 0.2 to 0.8 by steps of 0.05 tested to split the patients into two groups. These values were selected to avoid any group being inappropriately small, which could result in overfitting of the cut-off and the Cox regression models. The log-rank p-value was calculated for all possible cut-offs, and the quantile with the lowest value was chosen as the optimized cut-off. For analyses that involved combinations of biomarkers, the cutoffs determined for the individual biomarkers were used.
To determine whether the ProGRP pre-treatment values or the decrease from baseline to after the second treatment cycle were more relevant for OS, both categories were included in a single graph, and survival time was partitioned into quartiles. Individual cases with a very good prognosis (defined as OS above Q3), a medium prognosis (OS in Q1 to Q3) and a poor prognosis (OS below Q1) were depicted individually.
3Results
3.1Patient characteristics
In total, 232 patients were enrolled, including 12 patients with early-stage disease, 25 with stage IIIA, 48 with stage IIIB and 147 with stage IV disease. Detail baseline characteristics for the patients with advanced (stage III/IV) disease (n = 220) are displayed in Table 1. The majority of the patients with advanced disease received platinum-based or other doublet first-line chemotherapy and 12 received radiotherapy. At staging exams, 146 patients achieved PR (66.4%), 22 had SD (10.0%) and 19 had PD (8.6%). Twenty-seven patients discontinued the study before staging, five did not receive chemotherapy (best supportive care only) and one patient could not be evaluated. Ninety-five patients initiated a second-line therapy. Most patients with response to therapy received six cycles of chemotherapy while non-responsive patients switched to a second-line treatment early in their care.
3.2Biomarker dynamics
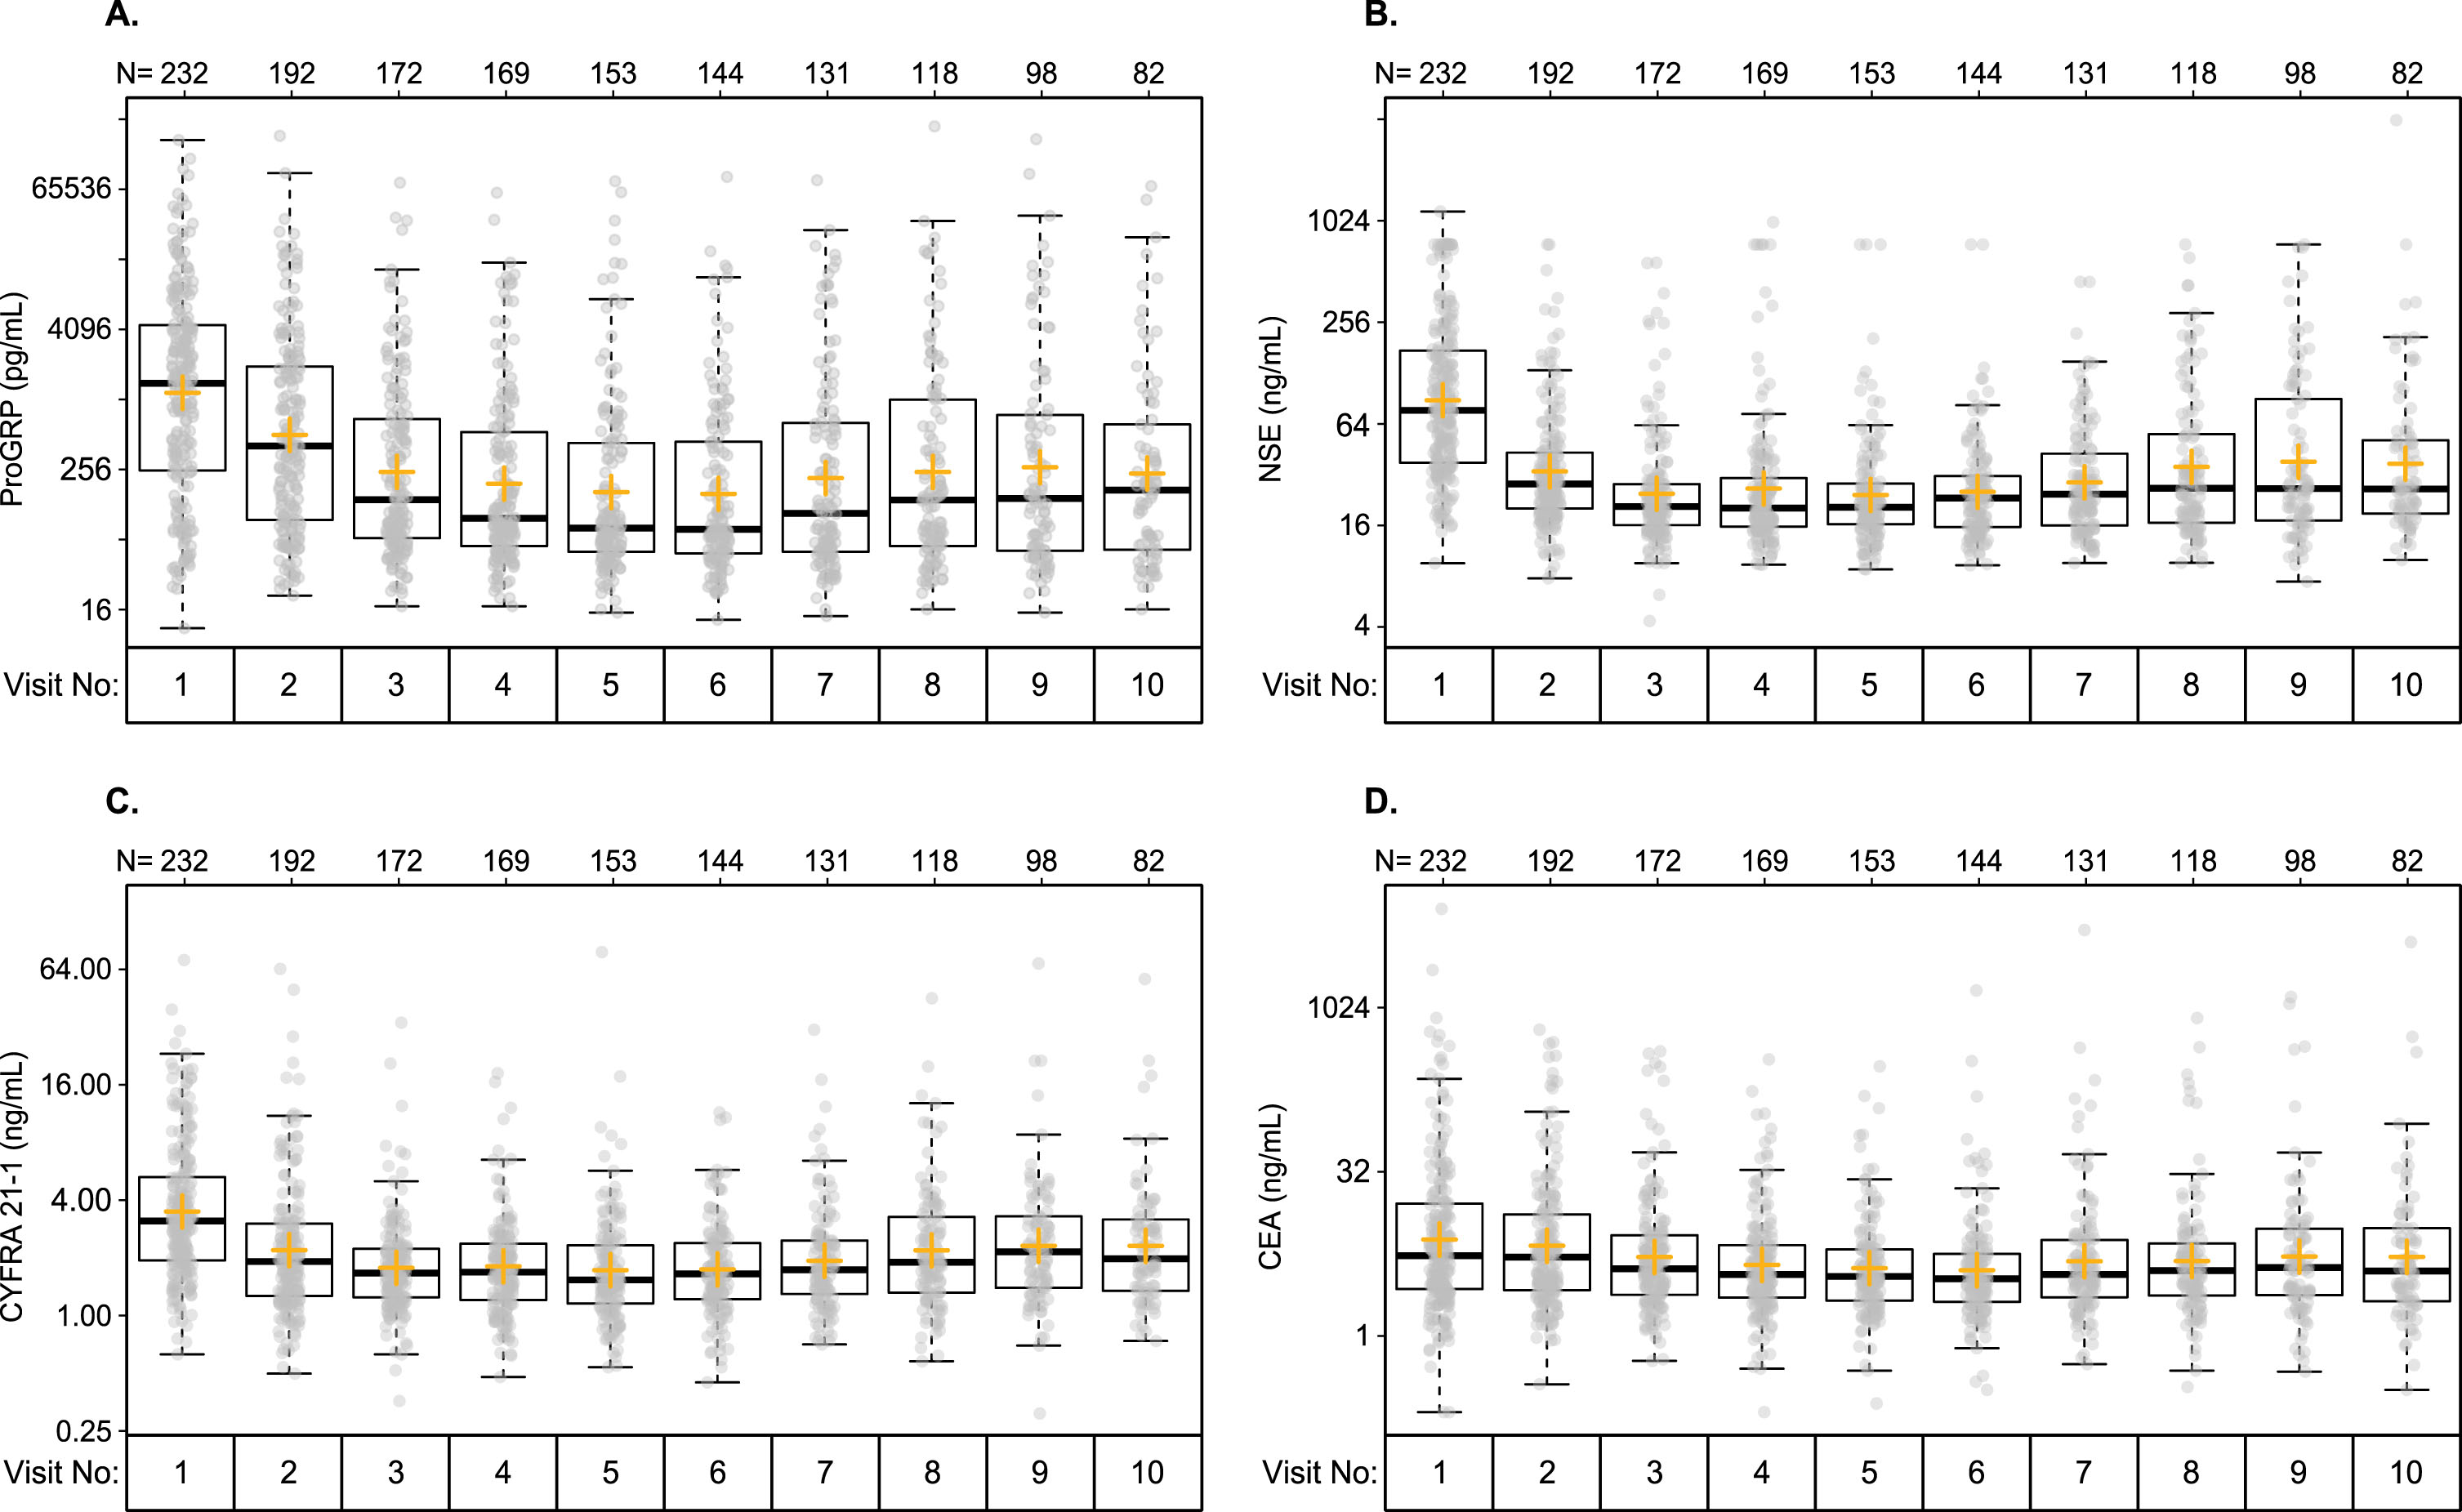
Biomarker levels were highly variable prior to first-line treatment as well as during and after treatment (Fig. 1). Pre-treatment (visit 1) levels ranged from 11 to 174,000 pg/mL for ProGRP, from 9.5 to 1160.4 ng/mL for NSE, from 0.6 to 71.5 ng/mL for CYFRA 21-1, and from 0.2 to 8134 ng/mL for CEA (Table 2). During treatment, median values of ProGRP decreased rapidly from 1405 pg/mL pre-treatment to 411 pg/mL after the first treatment cycle and 142 pg/ml after the second treatment cycle (first CT imaging) (Fig. 1 and Table 2). Subsequently, median levels remained stable until after completion of the first-line therapy, when they began to increase again. Similar dynamics were observed for NSE, for which median levels decreased from 76.9 ng/ml (visit 1) to 28.7 ng/ml (visit 2) and to 20.7 ng/ml (visit 3), remained stable and increased again from visit 7. Although at a lower level, similar dynamics were also seen for CYFRA 21-1, for which median levels decreased from 3.1 ng/ml (visit 1) to 1.9 ng/ml (visit 2) and to 1.7 ng/ml (visit 3), remained stable and increased slightly again starting from visit 7. Changes in CEA were similar but less pronounced (Fig. 1 and Table 2). From pre-treatment to after the first treatment cycle, the median percentage decrease in biomarker levels was ∼45% for ProGRP, ∼60% for NSE and ∼30% for CYFRA 21-1. Levels of CEA remained relatively stable from pre-treatment to after the first treatment cycle (Fig. 2A). After the second treatment cycle, median levels of ProGRP decreased further by ∼40%, while decreases in NSE were only around 20%, and both CEA and CYFRA 21-1 remained relatively stable (Fig. 2B).
Table 1
Baseline characteristics of patients with advanced-stage SCLC
| Characteristics | Patients with advanced-stage SCLC (N = 220) |
| Age, years | |
| Mean | 64.1 |
| SD | 9.1 |
| Median | 63 |
| Minimum – Maximum | 36–84 |
| Sex | |
| Male | 132 (60.0) |
| Female | 88 (40.0) |
| Race | |
| White | 218 (99.1) |
| Other | 2 (0.9) |
| Smoking history | |
| Smoker | 132 (60.0) |
| Ex-smoker | 83 (37.7) |
| Never smoked | 5 (2.3) |
| UICC stage | |
| IIIA | 25 (11.4) |
| IIIB | 48 (21.8) |
| IV | 147 (66.8) |
| First-line therapy | |
| No therapy (best supportive care) | 5 (2.3) |
| Carboplatin/Etoposide | 126 (57.3) |
| Carboplatin/Etoposide+mAB | 4 (1.8) |
| Cisplatin/Etoposide | 39 (17.7) |
| Cisplatin->Carboplatin/Etoposide | 14 (6.4) |
| Vincristine/Etoposide | 32 (14.5) |
| Radiotherapy | |
| Yes | 12 (5.5) |
| No | 208 (94.5) |
| First-line therapy outcome | |
| PR | 146 (66.4) |
| SD | 22 (10.0) |
| PD | 19 (8.6) |
| Discontinued study before staging | 27 (12.3) |
| No therapy (best supportive care) | 5 (2.3) |
| Could not be evaluated | 1 (0.5) |
Data are n (%) unless otherwise stated. An additional 12 patients had early stage SCLC and are not included in this table. mAB: monoclonal antibody.
Fig. 1
Distribution of tumor biomarker levels at pre-treatment (visit 1) and after each treatment cycle (visits 2-10) for (A) ProGRP, (B) NSE, (C) CYFRA 21-1 and (D) CEA. Plots show the median, interquartile range, minimum and maximum. Outlier points are defined as values 1.5 times the interquartile range.
3.3Correlation of single biomarkers with overall survival
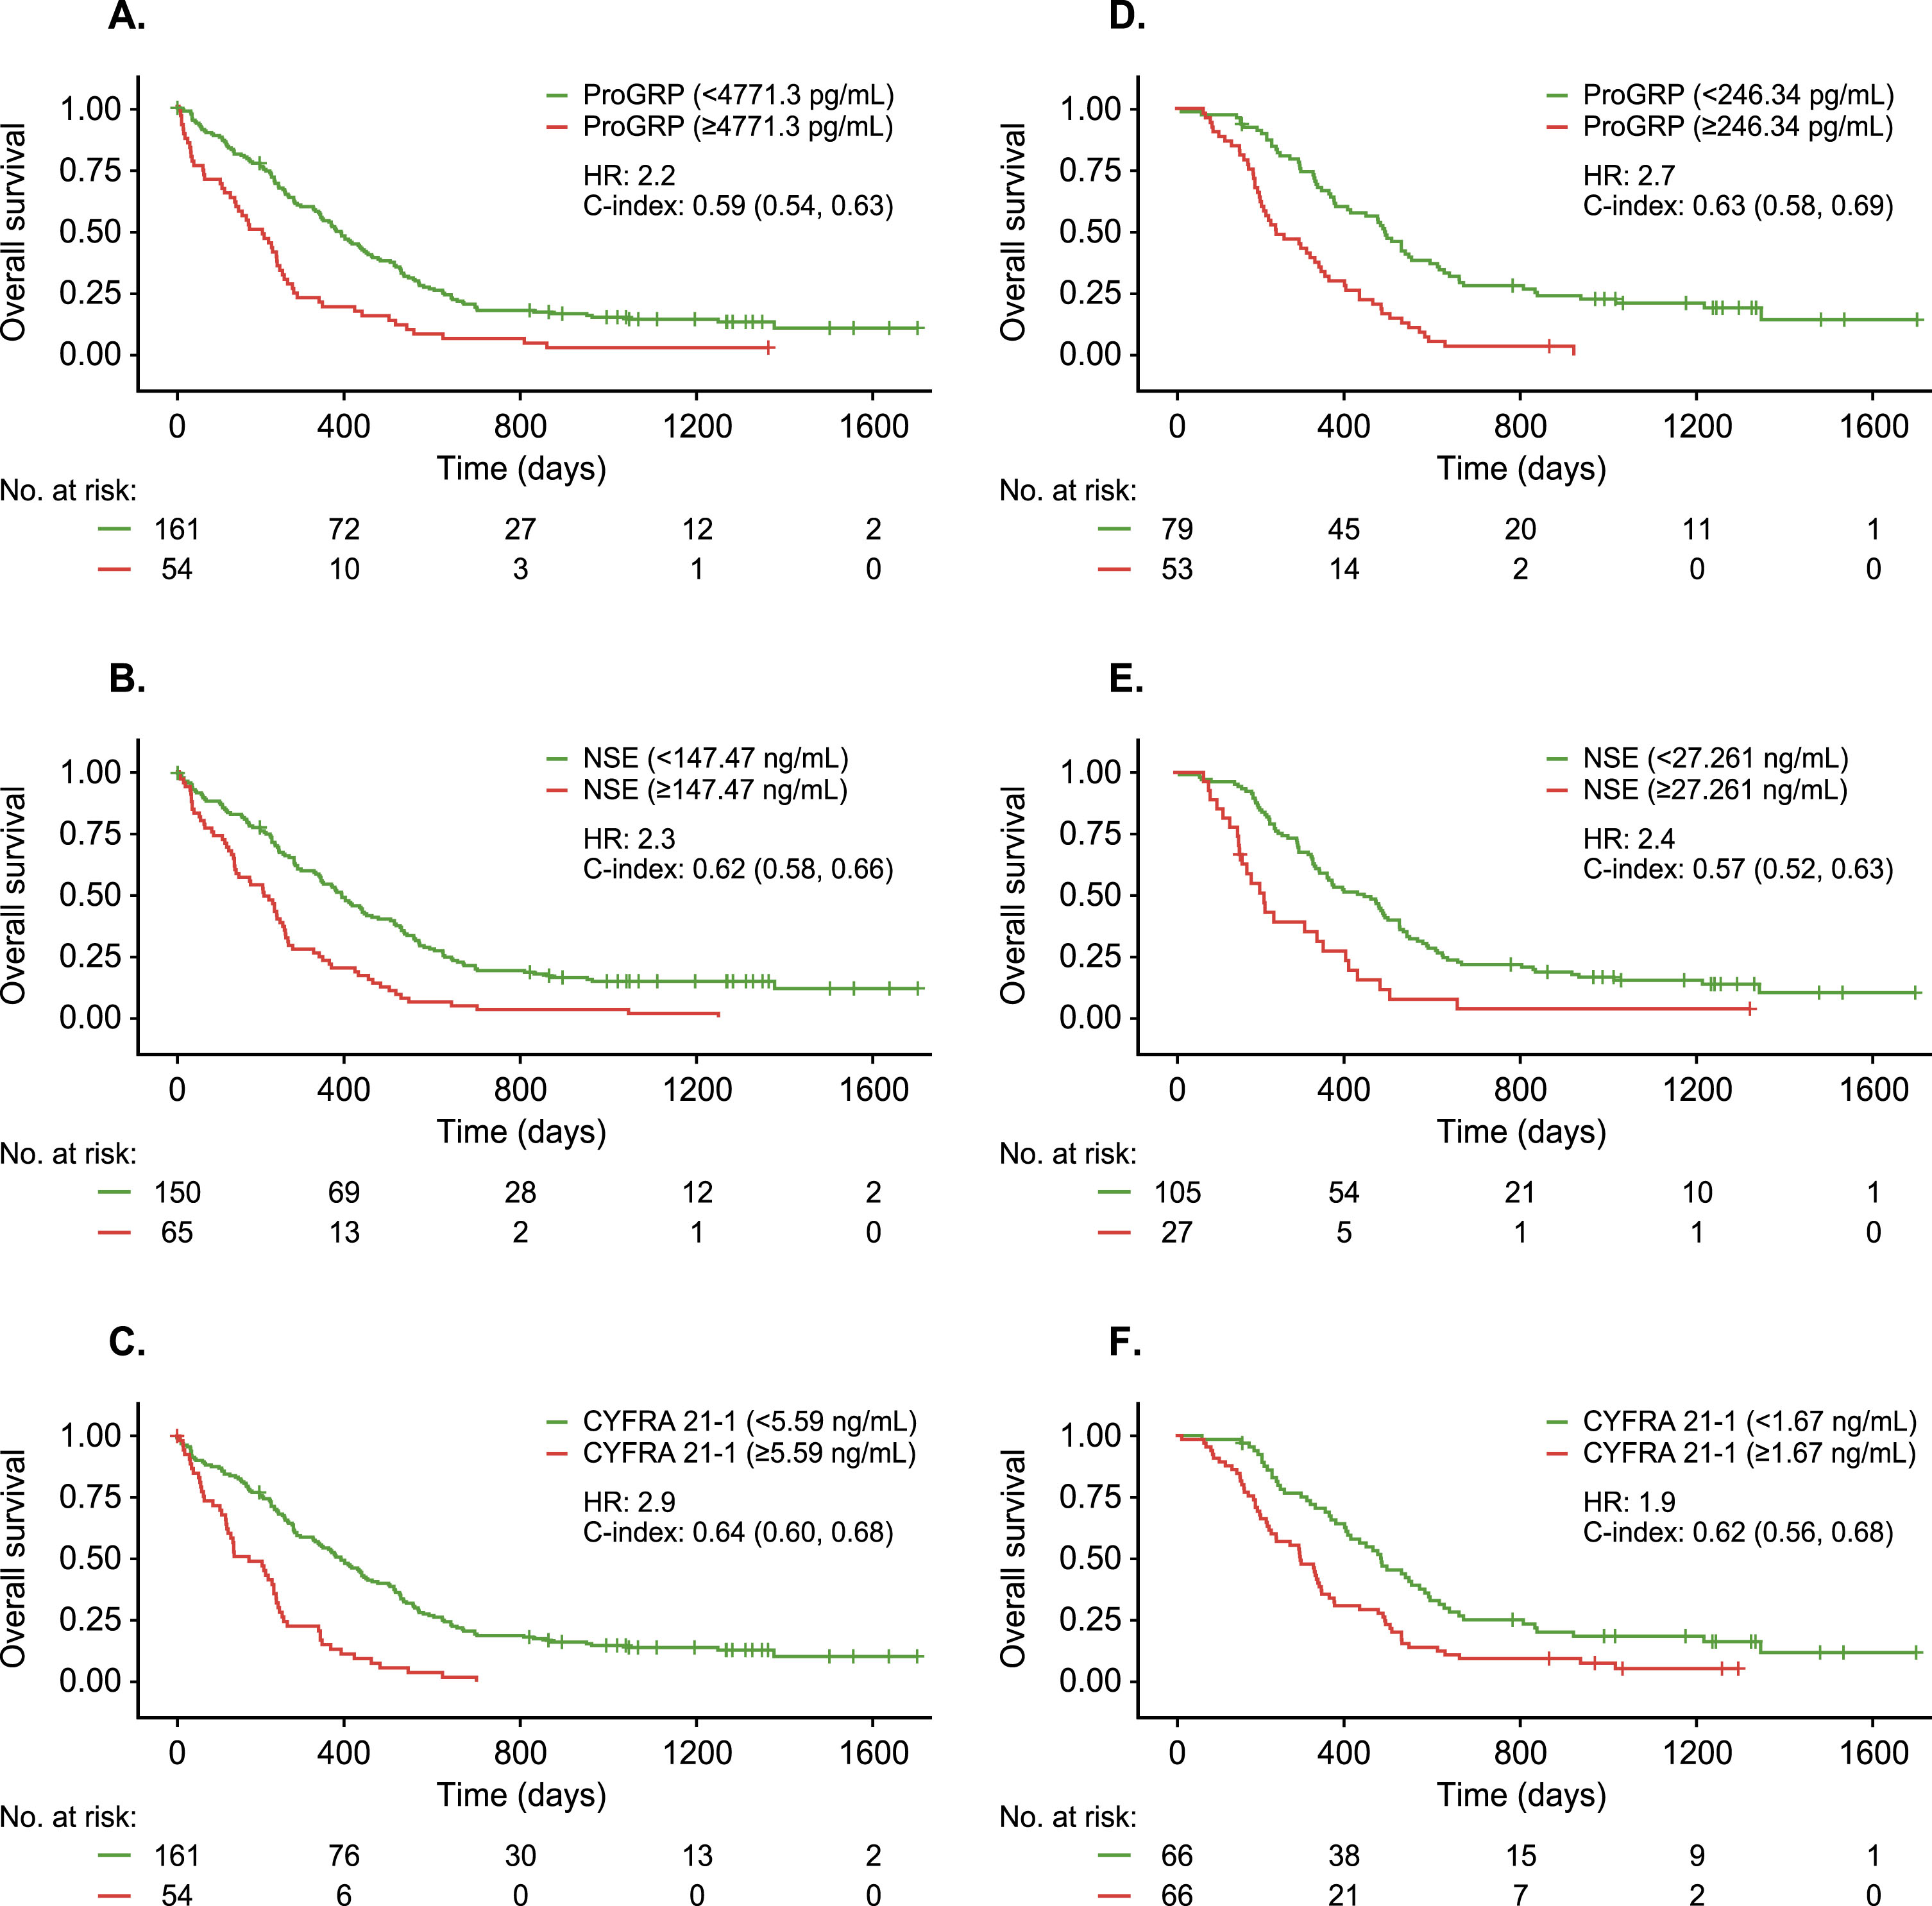
Higher pre-treatment levels of ProGRP, NSE, and CYFRA 21-1 were associated with significantly worse OS, with hazard ratios ranging from 2.2 to 2.9 for median survival times. However, these analyses also included patients who had no or only limited response (PD and SD) to first-line therapy and thus were biased towards a more unfavourable prognosis (Fig. 3A-C). In a cohort limited to patients who achieved at least a PR during first-line therapy, high absolute biomarker levels measured at the time of the first CT imaging (after two treatment cycles) were also associated with significantly worse OS, with hazard ratios ranging from 1.9 for CYFRA 21-1 to 2.7 for ProGRP (Fig. 3D-F). For patients receiving second-line therapy after recurrence or disease progression after first-line therapy, absolute biomarker values measured at the visit prior to initiation of second-line therapy were also prognostic for OS (data not shown). Biomarkers were ranked at each timepoint based on the C-index and HR for median OS. The top-ranking biomarkers at each timepoint were as follows: CYFRA 21-1 (C-index 0.64 [95% CI, 0.60–0.68]; HR 2.9 [95% CI, 2.06–4.01) had the highest prognostic value when measured prior to first-line treatment, ProGRP (C-index 0.63 95% CI, 0.60–0.68]; HR 2.7 [95% CI, 1.84–3.98]) had the highest prognostic value after two treatment cycles in patients with PR after first-line therapy, and NSE (C-index 0.70 [95% CI, 0.64–0.75]; HR 3.6 [95% CI, 2.23–5.87]) had the highest prognostic value when measured prior to initiation of second-line therapy in patients with recurrence or progression after first-line therapy.
Table 2
ProGRP, NSE, CYFRA 21-1 and CEA values at pre-treatment (visit 1), after one treatment cycle (visit 2) and after two treatment cycles (visit 3)
| ProGRP (pg/mL) | NSE (ng/mL) | |||||
| Visit 1 | Visit 2 | Visit 3 | Visit 1 | Visit 2 | Visit 3 | |
| N | 232 | 192 | 172 | 232 | 192 | 172 |
| Mean | 6914.2 | 3959.9 | 1871.7 | 160.5 | 53.9 | 40.3 |
| SD | 18242.0 | 15830.2 | 7354.1 | 206.2 | 93.0 | 76.4 |
| Median | 1405 | 411 | 142 | 76.9 | 28.7 | 20.7 |
| Minimum | 11 | 21 | 17 | 9.5 | 7.8 | 4.3 |
| Maximum | 174,000 | 189,040 | 74,760 | 1160 | 740 | 577 |
| CYFRA 21-2 (ng/mL) | CEA (ng/mL) | |||||
| Visit 1 | Visit 2 | Visit 3 | Visit 1 | Visit 2 | Visit 3 | |
| N | 232 | 192 | 172 | 232 | 192 | 172 |
| Mean | 5.2 | 3.6 | 2.3 | 76.8 | 28.8 | 19.5 |
| SD | 6.9 | 6.6 | 3.1 | 559.1 | 84.4 | 59.5 |
| Median | 3.1 | 1.9 | 1.7 | 5.4 | 5.3 | 4.1 |
| Minimum | 0.6 | 0.5 | 0.4 | 0.2 | 0.4 | 0.6 |
| Maximum | 71.5 | 64.4 | 33.8 | 8134.0 | 636.1 | 403.3 |
Fig. 2
Relative changes in tumor biomarker levels. Percent change in ProGRP, NSE, CYFRA 21-1 and CEA from (A) pre-treatment (visit 1) to after the first treatment cycle (visit 2) and (B) from after the first treatment cycle to after the second treatment cycle (visits 2 to 3).
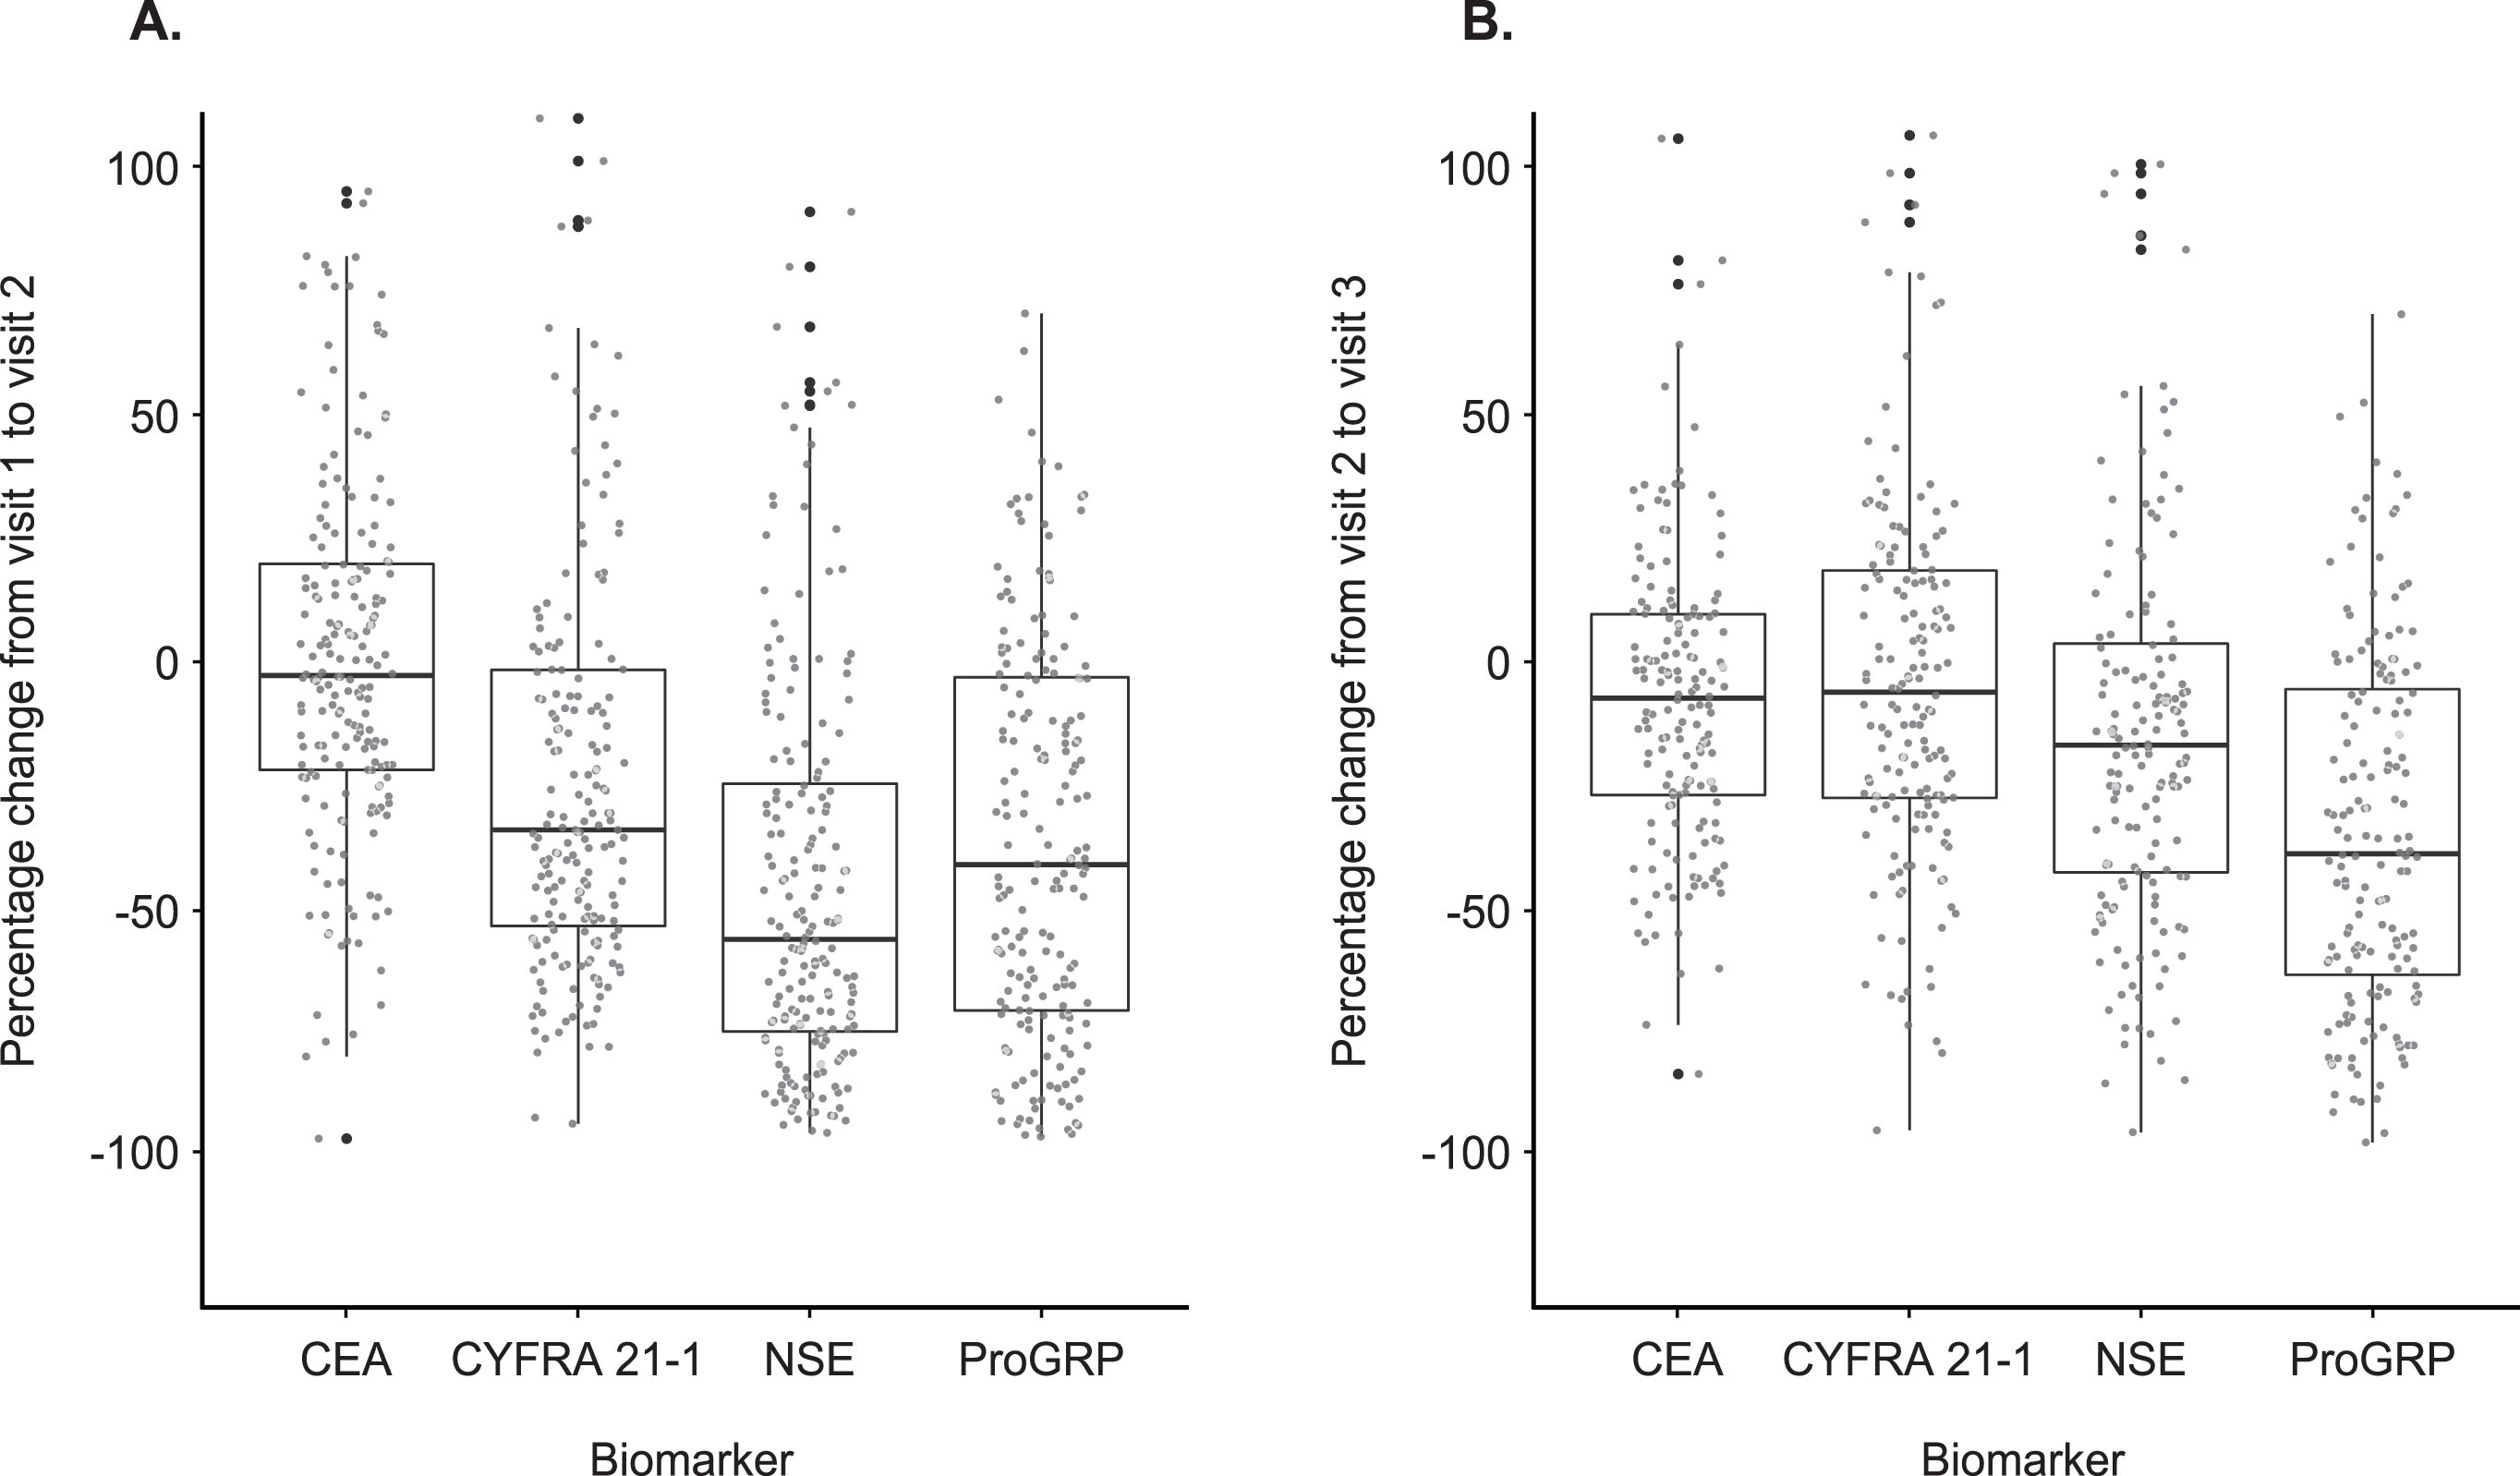
Fig. 3
Correlation between tumor biomarker level and overall survival. Kaplan-Meier survival curves for patients in high-risk (red) and low-risk (green) subgroups defined by ProGRP, NSE and CYFRA 21-1 levels measured either pre-treatment (A-C) or after two treatment cycles (D-F) using optimized cutoffs.
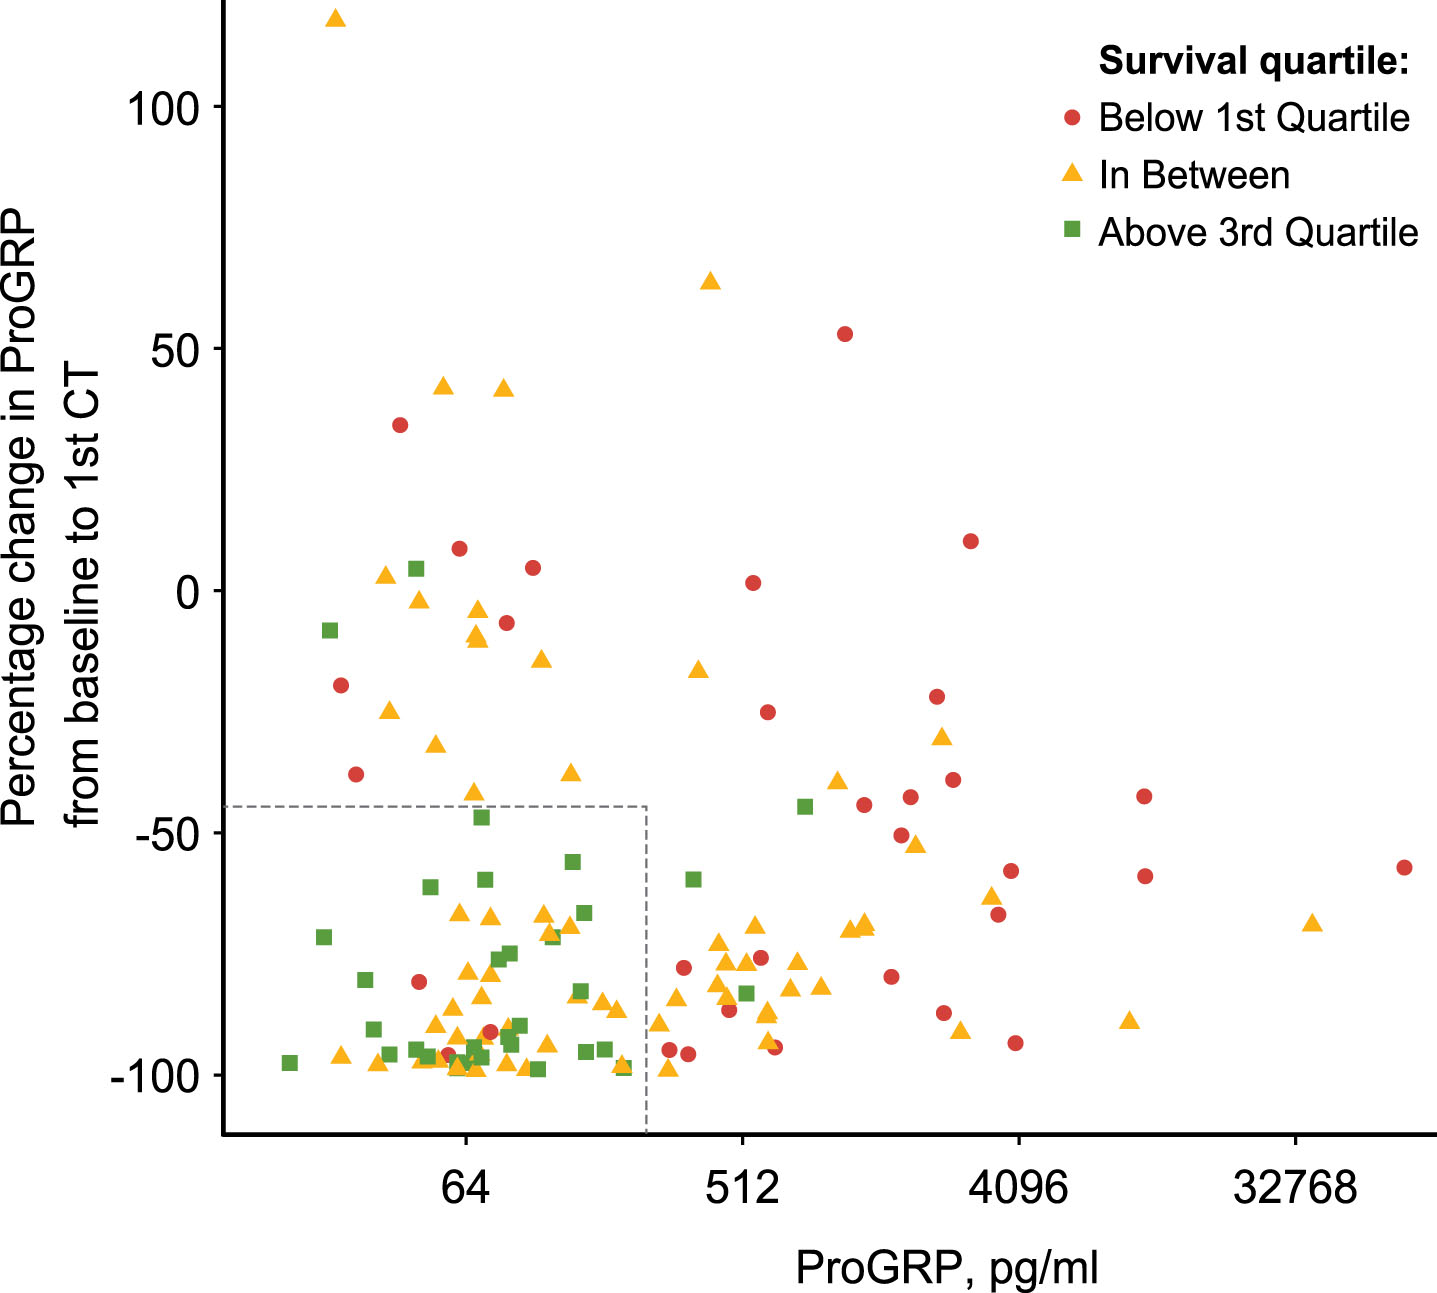
The prognostic value of absolute baseline biomarker values versus relative change from pre-treatment to after the second treatment cycle for OS were also evaluated. The majority of patients classified as having a very good prognosis (OS above quartile 3) had low pre-treatment ProGRP levels (<200 pg/ml) and a large decrease after two treatment cycles (>50%) (Fig. 4). In contrast, most patients with a poor prognosis (OS below quartile 1) had high pre-treatment ProGRP levels (>200 pg/ml) or a less pronounced decrease after two treatment cycles (<50%). For patients with medium prognosis (Q1 to Q3) there was no clear pattern in ProGRP levels, either pre- or post-treatment.
Fig. 4
Scatter plot for overall survival in relation to pre-treatment ProGRP values and change over time. Overall survival times are partitioned in quartiles and patients with very good prognosis (above Q3, green dots), medium prognosis (between Q1 and Q3, yellow dots) and poor prognosis (below Q1, red dots) are shown. X-axis indicates ProGRP values pre-treatment. Y-axis indicates percent change in ProGRP from pre-treatment to after two treatment cycles.
3.4Correlation of a triple biomarker combination with overall survival
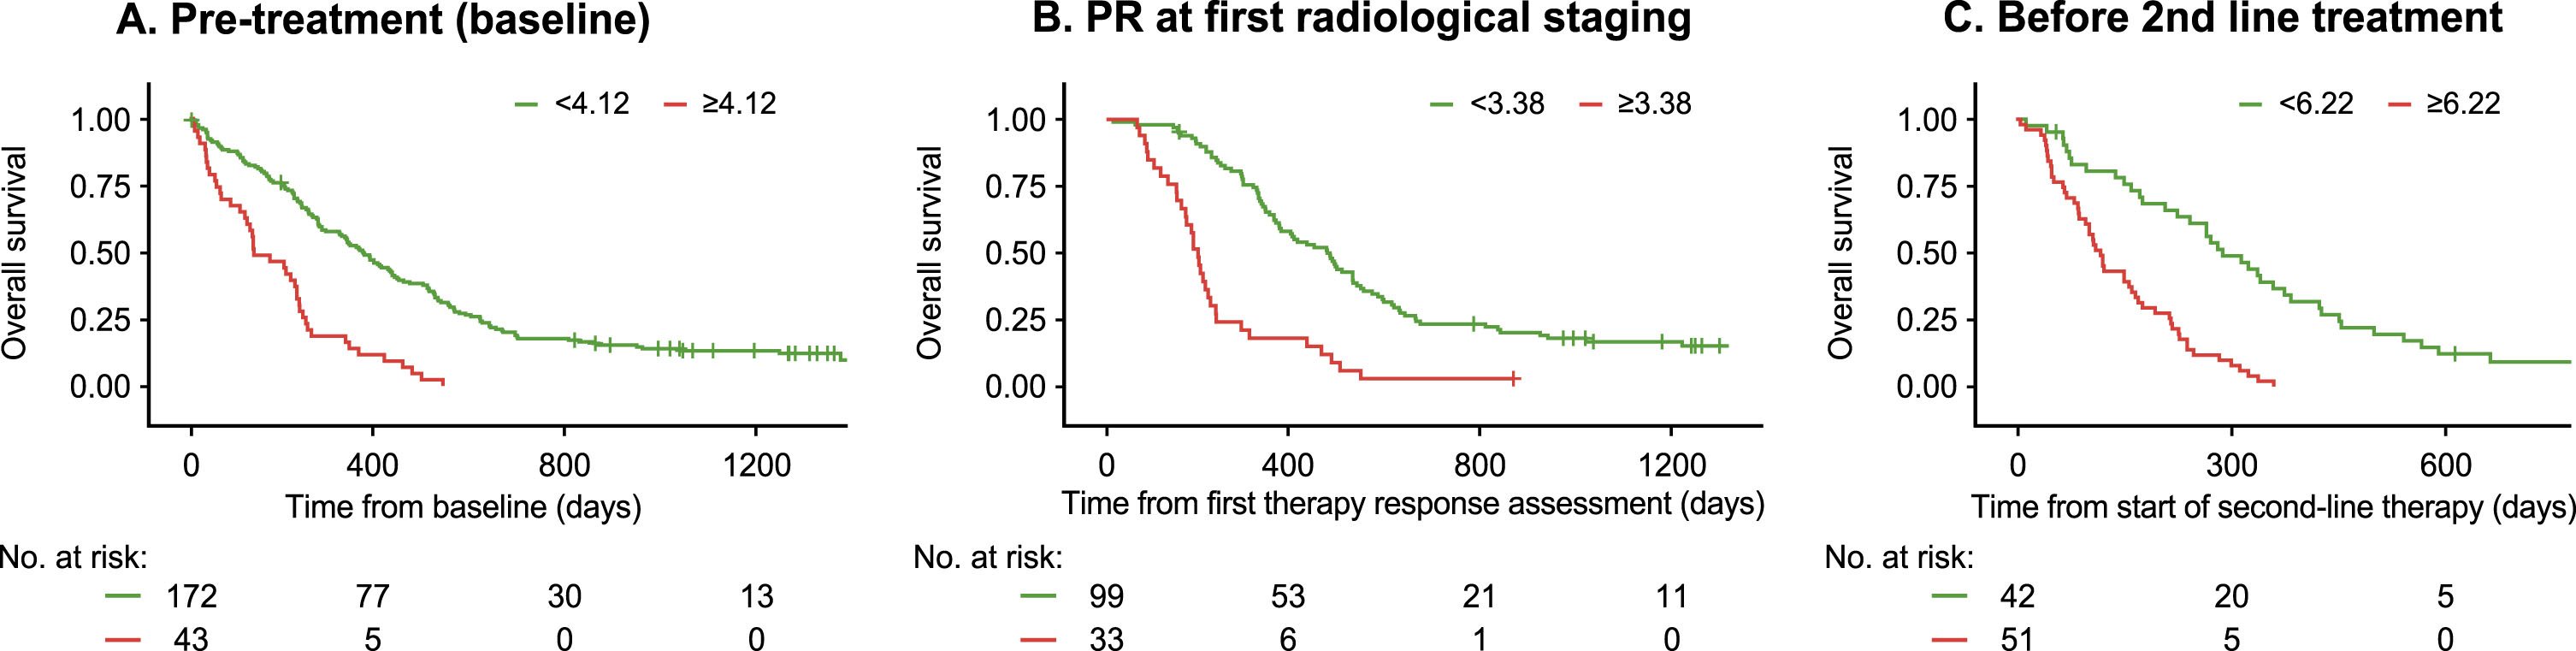
As ProGRP, NSE and CYFRA 21-1 all showed prognostic relevance, the combination of the three biomarkers was compared with the individual markers (Fig. 5). For the values obtained before treatment, the triple biomarker combination exhibited a higher prognostic value than the best single marker CYFRA 21-1 (C-index: 0.65 vs 0.64; HR: 3.2 vs 2.9). Similarly, when measured after two treatment cycles, the triple biomarker combination outperformed the best single marker ProGRP (C-index: 0.66 vs 0.63; HR: 3.7 vs 2.7). Finally, for the values obtained prior to initiation of second-line therapy, the triple biomarker combination was equivalent to the best single marker NSE (C-index: 0.70 vs 0.70; HR: 3.6 vs 3.8).
Fig. 5
Three-marker combination of ProGRP, NSE and CYFRA 21-1 for the estimation of overall survival at three timepoints. Kaplan-Meier survival curves for patients in high-risk (red) and low-risk (green) subgroups defined by a combination of ProGRP, NSE and CYFRA 21-1 levels using optimized cutoffs. Tumor biomarkers were measured (A) pre-treatment in all patients, (B) after two treatment cycles in patients with a PR to first-line treatment, and (C) prior to second line treatment. For each graph, the starting timepoint reflects the time of blood drawing. Figure legend indicates the optimized cutoffs used for each timepoint.
3.5Monitoring progressive disease during surveillance
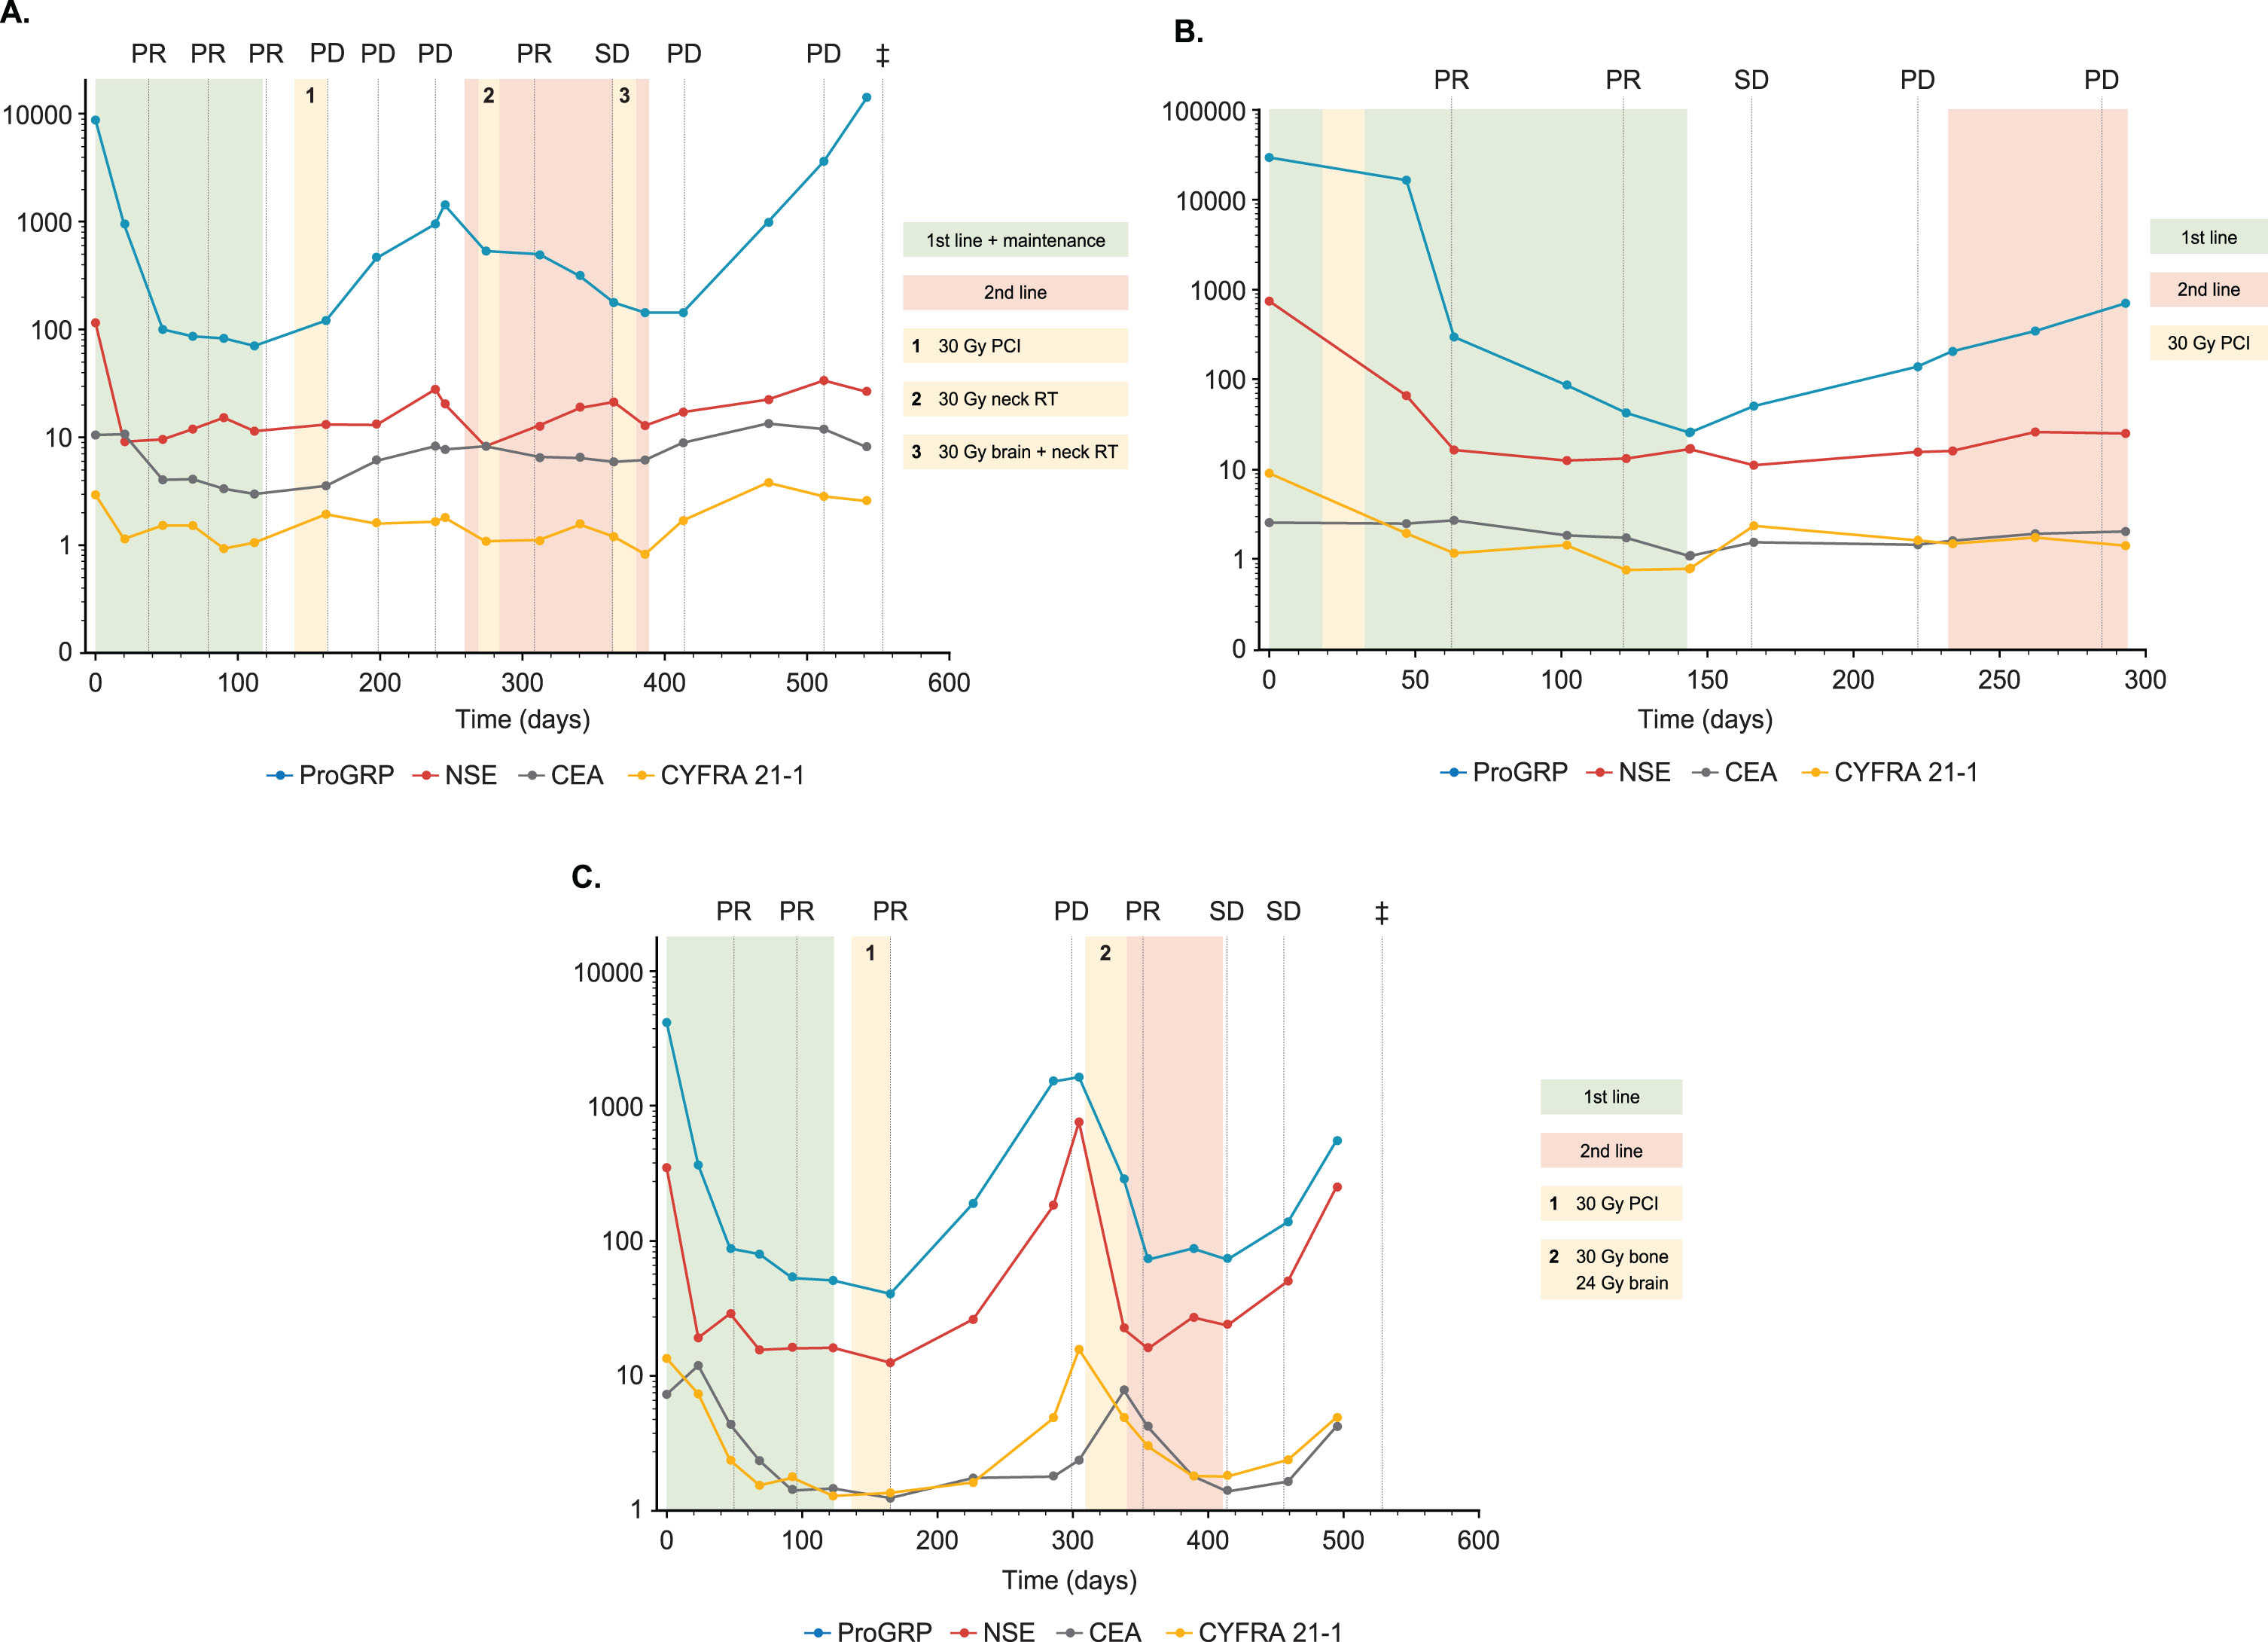
The utility of biomarkers to detect recurrence or progressive disease after successful first-line therapy was illustrated by evaluating biomarker dynamics in relation to the appearance of clinical events in individual cases. As shown in the following examples (Fig. 6A-C), ProGRP, NSE and CYFRA 21-1 values all indicated a clear biochemical response during therapy and sensitively and promptly detected new clinical events during the surveillance phase.
Fig. 6
Longitudinal tumor biomarker courses for individual patients. (A) 67-year-old male smoker with stage IV SCLC treated with four cycles of a combination of carboplatin, etoposide and ipilimumab followed by two cycles of maintenance ipilimumab plus radiation therapy of the brain 30 Gy (1). After disease progression, second-line therapy included six cycles of topotecan combined with 30 Gy radiation of neck vertebra (2) and a further irradiation of the brain (28 Gy) and neck vertebra (24 Gy) (3). The patient showed further tumor progression and died 547 days after treatment start. ProGRP, NSE and CYFRA 21-1 decreased dramatically at the beginning of first-line therapy but increased at the time of tumor progression. During second-line treatment temporary tumor control was mirrored by a moderate decrease in ProGRP. At the time of further progression, all biomarkers and particularly ProGRP increased again. (B) 57-year-old female smoker with stage IV SCLC treated with six cycles of first-line carboplatin and etoposide with an additional PCI of 30 Gy between days 18 to 31. Along with radiological response to therapy, levels of ProGRP, NSE and CYFRA 21-1 reduced considerably and continuously. Subsequent early increases in ProGRP indicated progressive disease with a lead time of about 60 days. Second-line treatment with topotecan was only applied for two cycles as the patient further progressed paralleled by a further increase of ProGRP. (C) 58-year-old female smoker SCLC stage IV treated with six cycles of a first-line combination of cisplatin and etoposide followed by 30 Gy PCI (1). All biomarkers were strongly elevated pre-treatment, particularly ProGRP and NSE, and reduced quickly and completely during successful therapy when radiological examinations showed partial remission. After completion of primary therapy all markers rapidly increased again and anticipated the later radiological progression by around 60 days. Second-line therapy consisted of two cycles of carboplatin and etoposide, complemented by simultaneous irradiations of the brain (24 Gy) and the bones (30 Gy; 2). Thereafter chemotherapy was changed to three cycles of vincristine and etoposide. Effective tumor control was accompanied by decreasing and stable biomarker levels during the treatment. Shortly after completion of treatment, biomarker values increased again. While radiological examinations still indicated stable disease, the patient deteriorated and died 535 days after treatment initiation.
4Discussion
In the present study, we examined the role of well-established tumor biomarkers in lung cancer diagnostics. Our aim was to assess their potential for predicting and monitoring therapeutic responses and identifying early poor prognosis in SCLC patients. Some studies have already shown the potential of pre-treatment NSE and CEA as prognostic markers in SCLC [13, 14, 16], while others have reported the utility of serial measurements of ProGRP and NSE for therapy monitoring in SCLC at defined time points [5, 6, 8, 11, 15, 17]. These earlier results have now been confirmed by our present study, in which we show a decrease in levels of the biomarkers ProGRP, NSE and CYFRA 21-1 in response to chemotherapy and a correlation between these decreasing biomarker levels and tumor responses determined by CT imaging. Moreover, we observed considerable variability in pre-treatment biomarker values, particularly for ProGRP and NSE. The rapid decrease in biomarker levels after just one cycle of chemotherapy was also noteworthy. While other markers remained relatively stable, ProGRP continued to decrease after a second treatment cycle. This highlights the high dynamic range of this biomarker, despite its release in small quantities (pg/mL range) into the blood.
In line with other studies [11, 13–15, 18], we demonstrated that high levels of ProGRP, NSE and CYFRA 21-1 measured either before treatment, after two treatment cycles, or prior to second-line therapy were associated with poor OS. Of note, although the biomarker cutoffs were different at each timepoint, their prognostic utility remained consistent. Interestingly, the best single prognostic markers differed across the various time points. Before treatment, the highest HR was seen for CYFRA 21-1, but in patients with a PR after two cycles of chemotherapy, ProGRP was the best biomarker. Prior to the initiation of second-line therapy, NSE demonstrated the strongest prognostic performance. Combining all three markers increased the prognostic power compared to individual measurements at all time points investigated.
An analysis of the pre-treatment levels of ProGRP and the relative changes after two treatment cycles revealed a complex relationship with OS, with two distinct groups of patients identified. While the majority of patients with long OS had low pre-treatment ProGRP levels (<200 pg/mL) and a >50% decrease after two treatment cycles, most patients with poor OS had initially high ProGRP levels (>200 pg/mL) or a less pronounced decrease after two treatment cycles (<50%). These results indicate that both absolute and relative values of ProGRP are informative for the prognosis of patients even after they have achieved PR during first-line therapy. Notably, the cutoffs used here are different from the diagnostic cutoffs or established reference intervals, and need to be confirmed in additional independent prognostic studies.
The utility of biomarkers to detect disease recurrence after successful first-line therapy in a timely and accurate manner can be challenging to evaluate. This is because numerous individual factors play a role, including the time of disease progression, the dynamics of tumor growth, the frequency of blood draws, the biomarker levels before and after first-line therapy, and the use of clinical or specific radiological tools at routine visits. In addition, biomarker results may also indicate progressive disease before it becomes macroscopically apparent [11, 27]. In this study, the dramatic dynamics of the tumor markers during the course of disease and treatment was illustrated by individual patient cases. Typically, ProGRP and NSE values were very high prior to first-line treatment and then decreased by several orders of magnitude during the first cycles of chemotherapy, corresponding with excellent tumor response upon CT imaging. Albeit at a lower level, CYFRA 21-1 showed similar dynamics, while the CEA response was more inconsistent. After successful treatment, biomarker levels frequently increased again, even though radiological evaluations still indicated tumor control or stable disease. This increase often occurred several weeks or months prior to clinical or radiological progression. Second- and third-line therapies typically only achieved moderate and incomplete decreases in biomarkers, followed by further increases and subsequent clinical deterioration. The measurement of all three biomarkers was relevant in individual patients, as in some cases, changes in biomarkers indicated disease progression or metastatic disease, even if they were not the primary biomarkers during first-line treatment.
Despite a growing body of evidence, the use of tumor markers is not recommended by current guidelines [20], possibly because it often remains unclear as to how to effectively integrate them with imaging. This study further demonstrates the clinical utility of these biomarkers at various time points during the course of disease for monitoring treatment response and estimating overall prognosis. This may help to integrate these diagnostic tools into clinical practice guidelines for lung cancer management.
As limitations of this study, the single-center design and the lack of a validation cohort have to be acknowledged. However, this prospectively collected dataset of 232 patients is one of the largest SCLC cohorts in biomarker, with longitudinal sampling and an extensive follow-up period of more than two years in some cases. Sample collection was performed at defined time points and followed robust standard operating procedures for preanalytical sample handling, as well as quality-controlled assessments on well-established, automated immunoassay platforms. Therefore, these “state of the art” data can serve as a valuable foundation for informing clinical decision-making and guiding further prospective studies.
5Conclusions
ProGRP, NSE and CYFRA 21-1 are potentially valuable tools for patient monitoring and clinical decision-making during SCLC treatment. Whether used individually or in combination, these biomarkers provided valuable prognostic information regarding OS at all the investigated timepoints: prior to first-line therapy, after two treatment cycles in patients with a successful response to first-line therapy, and before the initiation second-line therapy. Their utility extended to continuous monitoring during and after therapy, often indicating progressive disease several weeks or months ahead of radiological changes. The results from this study indicate the great potential of ProGRP, NSE and CYFRA 21-1 for the monitoring of SCLC patients through out the course of the disease.
Acknowledgments
Blood samples were provided by the Lungbiobank Heidelberg, a member of the Biomaterial Bank Heidelberg (BMBH), and the biobank platform of the German Centre for Lung Research (DZL). We thank our expert study nurse team Christa Stolp, Andrea Kress, Karin Schnorr-Teichert and Ingrid Heinzmann-Groth for their excellent assistance in blood sampling, data processing and patient care. We also acknowledge editorial support from Steph Carter and Jade Drummond (inScience Communications, Chester), supported by Roche Diagnostics International Ltd (Rotkreuz, Switzerland). COBAS and COBAS E are trademarks of Roche. Last but not least, we thank our patients for the donation of their samples and clinical data for this study.
Author contributions
CONCEPTION: TM, FJH, BW.
DATA CURATION: TM, FJH, CPH, MK, MT, MM, MAS.
ANALYSIS OF DATA: AM, BW, TM.
PREPARATION OF THE MANUSCRIPT: TM, BW, SH.
REVISION FOR IMPORTANT INTELLECTUAL CONTENT: All.
SUPERVISION: TM, BW, SH.
Conflict of interest
Thomas Muley has received institutional funding or honoraria and is involved in patents from Roche Diagnostics (Penzberg, Germany). TM has also received institutional funding from OncoHost (Israel) and Cellzome (Germany).
Birgit Wehnl and Anika Mang are employees of Roche Diagnostics GmbH.
Stefan Holdenrieder has received research funding or honoraria from Roche Diagnostics, Bristol Myers Squibb, Merck KgaA, Sysmex Inostics and Volition SPRL. Moreover, he is a guest editor in the special issue of Tumor Biology on “Lung Cancer in Tumor Markers” but had no participation in the peer review process of this paper.
Claus Peter Heussel has received lecture fees from AstraZeneca and Boehringer Ingelheim, and owns stock in GlaxoSmithKline.
Marc Schneider has received institutional funding from ROCHE, OncoHost (Israel), and Cellzome (Germany).
Felix Herth has received institutional funding and honoraria (advisory board) and is involved in patents from Roche Diagnostics (Penzberg, Germany).
Michael Thomas has received honoraria from AstraZeneca, Beigene, Bristol Myers Squibb, Boehringer Ingelheim, Celgene, Chugai, Daiichi Sankyo, GlaxoSmithKline, Janssen Oncology, Lilly, Merck, MSD, Novartis, Pfizer, Roche, Sanofi and Takeda. MT has also received institutional funding from AstraZeneca, Bristol-Myers Squibb, Merck, Roche and Takeda. MT has also received travel costs from AstraZeneca, Bristol Myers Squibb, Boehringer Ingelheim, Daiichi Sankyo, Janssen Oncology, Lilly, Merck, MSD, Novartis, Pfizer, Roche, Sanofi and Takeda.
Mark Kriegsmann and Michael Meister have no conflicts of interest to report.
References
[1] | Sung H , Ferlay J , Siegel RL , Laversanne M , Soerjomataram I , Jemal A , et al. Global Cancer Statistics GLOBOCAN Estimates of Incidence and Mortality Worldwide for 36 Cancers in 185 Countries. CA Cancer J Clin. (2021) ;71: (3):209–49. doi: 10.3322/caac.21660. |
[2] | Blandin Knight S , Crosbie PA , Balata H , Chudziak J , Hussell T , Dive C Progress and prospects of early detection in lung cancer. Open Biol. (2017) );7: (9). doi: 10.1098/rsob.170070. |
[3] | Chauhan AF , Liu SV Small Cell Lung Cancer: Advances in Diagnosis and Management. Semin Respir Crit Care Med. (2020) ;41: (3):435–46. doi: 10.1055/s-0039-1700566. |
[4] | Taniguchi H , Sen T , Rudin CM Targeted Therapies and Biomarkers in Small Cell Lung Cancer. Front Oncol. (2020) ;10: :741. doi: 10.3389/fonc.2020.00741. |
[5] | de Kock R , Borne BVD , Soud MY , Belderbos H , Stege G , de Saegher M , et al. Circulating biomarkers for monitoring therapy response and detection of disease progression in lung cancer patients. Cancer Treat Res Commun. (2021) ;28: :100410. doi: 10.1016/j.ctarc.2021.100410. |
[6] | Bi H , Yin L , Fang W , Song S , Wu S , Shen J Association of CEA, NSE, CYFRA 21-1, SCC-Ag, and ProGRP with Clinicopathological Characteristics and Chemotherapeutic Outcomes of Lung Cancer. Lab Med (2022) . doi: 10.1093/labmed/lmac122. |
[7] | Grunnet M , Sorensen JB Carcinoembryonic antigen (CEA) as tumor marker in lung cancer. Lung Cancer. (2012) ;76: (2):138–43. doi: 10.1016/j.lungcan.2011.11.012. |
[8] | Wójcik E , Kulpa JK , Sas-Korczyńska B , Korzeniowski S , Jakubowicz J ProGRP and NSE in therapy monitoring in patients withsmall cell lung cancer. Anticancer Res (2008) ;28: (5b), 3027–33. |
[9] | Korkmaz ET , Koksal D , Aksu F , Dikmen ZG , Icen D , Maden E , et al. Triple test with tumor markers CYFRA 21.1, HE4, and ProGRP might contribute to diagnosis and subtyping of lung cancer. Clin Biochem. (2018) ;58: :15–9. doi: 10.1016/j.clinbiochem.2018.05.001. |
[10] | Molina R , Marrades RM , Augé JM , Escudero JM , Viñolas N , Reguart N , et al. Assessment of a Combined Panel ofSix Serum Tumor Markers for Lung Cancer. Am J Respir Crit Care Med. (2016) ;193: (4):427–37. doi: 10.1164/rccm.201404-0603OC. |
[11] | Nisman B , Nechushtan H , Biran H , Peled N , Gantz-Sorotsky H , Doviner V , et al. New ARCHITECT plasma pro-gastrin-releasing peptide assay for diagnosing and monitoring small-cell lung cancer. Br J Cancer. (2016) ;114: (4):469–76. doi: 10.1038/bjc.2016.7. |
[12] | Holdenrieder S , von Pawel J , Dankelmann E , Duell T , Faderl B , Markus A , et al. Nucleosomes, ProGRP, NSE, CYFRA 21-1, and CEA in monitoring first-line chemotherapy of small cell lung cancer. Clin Cancer Res. (2008) ;14: (23):7813–21. doi: 10.1158/1078-0432.Ccr-08-0678. |
[13] | Liu X , Zhang W , Yin W , Xiao Y , Zhou C , Hu Y , et al. The prognostic value of the serum neuron specific enolase and lactate dehydrogenase in small cell lung cancer patients receiving first-line platinum-based chemotherapy. Medicine (Baltimore) (2017) ;96: (46):e8258. doi: 10.1097/md.0000000000008258. |
[14] | Shibayama T , Ueoka H , Nishii K , Kiura K , Tabata M , Miyatake K , et al. Complementary roles of pro-gastrin-releasing peptide (ProGRP) and neuron specific enolase (NSE) in diagnosis and prognosis of small-cell lung cancer (SCLC). Lung Cancer. (2001) ;32: (1):61–9. doi: 10.1016/s0169-5002(00)00205-1. |
[15] | Ono A , Naito T , Ito I , Watanabe R , Shukuya T , Kenmotsu H , et al. Correlations between serial pro-gastrin-releasing peptide and neuron-specific enolase levels, and the radiological response to treatment and survival of patients with small-cell lung cancer. Lung Cancer. (2012) ;76: (3):439–44. doi: 10.1016/j.lungcan.2011.12.012. |
[16] | Wang L , Cao L , Jiang R , Huang D Prognostic Significance of Combined Biomarkers in Small Cell Lung Cancer. Clin Lab. (2020) ;66: (9). 10.7754/Clin.Lab.2020.191002. |
[17] | Schneider J , Philipp M , Salewski L , Velcovsky HG Pro-gastrin-releasing peptide (ProGRP) and neuron specific enolase (NSE) in therapy control of patients with small-cell lung cancer. Clin Lab (2003) ;49: (1-2):35–42. |
[18] | Sunaga N , Tsuchiya S , Minato K , Watanabe S , Fueki N , Hoshino H , et al. Serum pro-gastrin-releasing peptide is a useful marker for treatment monitoring and survival in small-cell lung cancer. Oncology. (1999) ;57: (2):143–8 . doi: 10.1159/000012022. |
[19] | Eisenhauer EA , Therasse P , Bogaerts J , Schwartz LH , Sargent D , Ford R , et al. New response evaluation criteria in solid tumours: revised RECIST guideline (version 1.1).. Eur J Cancer. (2009) ;45: (2):228–47. doi: 10.1016/j.ejca.2008.10.026. |
[20] | Postmus PE , Kerr KM , Oudkerk M , Senan S , Waller DA , Vansteenkiste J , et al. Early and locally advanced non-small-cell lung cancer (NSCLC): ESMO Clinical Practice Guidelines for diagnosis, treatment and follow-up. Ann Oncol. (2017) ;28: (suppl_4):iv1–iv21. doi: 10.1093/annonc/mdx222. |


