
Missing prognostic value of soluble PD-1, PD-L1 and PD-L2 in lung cancer patients undergoing chemotherapy – A CEPAC-TDM biomarker substudy
Abstract
BACKGROUND:
Programmed cell death receptors and ligands in cancer tissue samples are established companion diagnostics for immune checkpoint inhibitor (ICI) therapies.
OBJECTIVE:
To investigate the relevance of soluble PD-1, PD-L1 and PD-L2 for estimating therapy response and prognosis in non-small cell lung cancer patients (NSCLC) undergoing platin-based combination chemotherapies.
METHODS:
In a biomarker substudy of a prospective, multicentric clinical trial (CEPAC-TDM) on advanced NSCLC patients, soluble PD-1, PD-L1 and PD-L2 were assessed in serial serum samples by highly sensitive enzyme-linked immunosorbent assays and correlated with radiological response after two cycles of chemotherapy and with overall survival (OS).
RESULTS:
Among 243 NSCLC patients, 185 achieved response (partial remission and stable disease) and 58 non-response (progression). The distribution of PD-1, PD-L1 and PD-L2 at baseline (C1), prior to staging (C3) and the relative changes (C3/C1) greatly overlapped between the patient groups with response and non-response, thus hindering the discrimination between the two groups. None of the PD markers had prognostic value regarding OS.
CONCLUSIONS:
Neither soluble PD-1, PD-L1 nor PD-L2 did provide clinical utility for predicting response to chemotherapy and prognosis. Studies on the relevance of PD markers in ICI therapies are warranted.
Main messages:
1. Soluble PD-1, PD-L1 and PD-L2 were assessed in serial blood samples of patients with non-small cell lung cancer undergoing platin-based combination chemotherapy at baseline and at time of first radiologic staging for estimating their power for predicting therapy response and overall prognosis.
2. Neither sPD-1, sPD-L1 nor sPD-L2 provide clinical utility for predicting response to chemotherapy and overall prognosis.
3. Further studies on cancer patients receiving PD-1- or PD-L1-inhibiting therapies are warranted to elucidate the programmed cell death biomarker utility in this specific setting.
1Introduction
Lung cancer is the second most common solid tumor and the first when mortality is considered for both genders together. In 2020, approximately 2.2 million patients were newly diagnosed with lung cancer [1]. Lung cancer can histologically be divided into two main subtypes, non-small-cell lung cancer (NSCLC) and small-cell lung cancer (SCLC) [2]. Classification is a prerequisite for therapy regimen assignment which is highly depending on the subtype. Both subtypes rarely show symptoms in early stages leading to the majority of cases being diagnosed in advanced stages III and IV [2, 3]. Tumor resection is the first line therapy in early-stage lung cancer, whereas later stages are treated by radiochemotherapy. Chemotherapeutic regimens usually consist of a doublette platinum-drug combination. The selection of the therapeutics is based on various prerequisites including general healthy status, tumor stage, contraindications and comorbidities [2, 3]. Lately, immune checkpoint inhibitor (ICI) therapies and targeted tyrosine kinase inhibitor (TKI) therapies have been introduced in the treatment schedule of late-stage lung cancers. While raising the hope for prolonged progression free and overall survival, their application is limited to specific study populations with the eligible targets [4, 5]. In any case, the identification of indicative biomarkers for patients who respond to treatment and can benefit from targeted therapies is crucial [3]. This is often assessed through tissue diagnostics prior to therapy and radiological exams during therapy. Alternatively, serial measurements of blood-based biomarkers provide information on the biochemical response to treatment [6–9].
In NSCLC, several biomarkers are used in the context of differential diagnosis, monitoring of therapy response and early recurrence detection, including CYFRA 21-1, CEA and SCC [6, 10]. Apart from these markers, there is a need for new biomarkers that complement the established ones and improve the diagnostic power, e.g. for predicting and monitoring response to conventional chemotherapies as well as novel ICI and TKI therapies. Programmed cell death protein (PD-1) and its two ligands (PD-L1 and PD-L2) play a pivotal role in modulating immune response. Whereas the receptor PD-1 is expressed on the surface of activated T-cells, B-cells, myeloid cells and macrophages, the ligands are found on a variety of hematopoetic and non-hematopoetic cells [11–14]. Their interaction leads to decreased cytokine production, including INF-γ, TNF-α and IL-2, as well as cell cycle arrest [15, 16]. Currently, the expression of PD-L1 is measured in tumor tissue to identify patients who will benefit more from ICI therapies. In some cases, surface and shed protein markers correlate with each other, and soluble protein markers are used as surrogate markers of cellular expression. For example, high levels of soluble transferrin receptor (sTFR) are detected in patients with iron deficiency, as a surrogate of the TFR status on red blood cells [17]. Likewise, it is hypothesized that the dynamics of soluble PD-L1 as well as of PD-1 and PD-L2 during the course of ICI therapy will be informative for the responsiveness of the patient [18–22]. Moreover, it remains unclear, whether soluble programmed cell death markers are also clinically meaningful markers for monitoring of response to conventional chemotherapies or for post-therapy surveillance [18, 23]. As a first step, the objective of this biomarker substudy is to investigate the predictive and prognostic potential of soluble PD-1, PD-L1 and PD-L2 in patients undergoing chemotherapy. This will be followed later by ICI treatment studies.
2Patients and methods
2.1Patients
The present study utilized biobanked serum samples were used that were prospectively collected in the multicentric CEPAC-TDM biomarker substudy at different study sites in Germany, Austria, and Switzerland. The substudy in NSCLC patients was part of an open-label, randomized study of individualized, pharmaco-kinetically (PK)-guided dosing of paclitaxel which was combined with a platin component (carboplatin or cisplatin). The Central European Society of Anticancer Drug Research (CESAR) organized this study in collaboration with Saladax Biomedical Inc. The clinical endpoints of the clinical CEPAC-TDM trial were published by Joerger et al. 2016 [24]. The study was approved by the respective institutional review boards (IRB-Nr 576/2010 AMG1 Eberhard-Karls-University Tübingen, Germany; EKSG 11/011 SG 323/10 St. Gallen, Switzerland) and conducted following the Declaration of Helsinki and Good Clinical Practice guidelines. Every enrolled patient signed informed consent prior to all study-related procedures and analyses.
All processes, such as the clinical documentation and the radiological response assessment by computed tomography (CT) after two therapy cycles were parts of the clinical trial and were closely monitored by CESAR study staff. In the biomarker substudy, the evaluation of the response before cycle 3 according to the RECIST-criteria, as well as the overall survival (OS), were considered as outcome endpoint.
2.2Blood samples and methods
Venous blood samples were collected in serum-gel monovettes (7.5 ml, Sarstedt, Nürmbrecht, German) at the following timepoints: prior to the chemotherapeutic cycles 1, 2 and 3 (C1, C2, C3), and at the end of the treatment (EoT). After clotting for at least 30 minutes at room temperature, the supernatant was separated by centrifugation at 2000 x g at 10°C within one to two hours after venepuncture. The serum was aliquoted à 500μl, pseudonomized, transferred to a central biobank, and stored at -80°C until analysis at the Munich Biomarker Research Center of the Institute of Laboratory Medicine at the German Heart Centre Munich of the Free State of Bavaria at the Technical University Munich.
Soluble biomarkers PD-1, PD-L1 and PD-L2 were measured applying self-developed and validated enzyme-linked immunosorbent assays (ELISA) as described in Krüger et al [25, 26]. Recombinant protein standards, controls and respective antibodies were bought from R&D Systems (Human PD-1 DuoSet® ELISA: DY1086/ Human PD-L1 DuoSet® ELISA: DY156/ Human PD-L2/B7-DC DuoSet® ELISA: DY1224, all: R&D Systems, Inc., Minneapolis, USA). An eight-point recombinant protein standard curve (range: 0.0073 ng/ml to 30 ng/ml) was used for quantification in all three assays. The ELISA plates were read on the Meso Quickplex SQ 120 analytical platform which operates on electrochemiluminescence (Meso Scale Discovery, LLC., Rockville, USA). In all plates, a single measurement of samples was conducted, and additional two-level serum controls were included. Final crossplate checks with three to five samples of each plate were performed to enssure high quality of data.
2.3Statistical analyses
The pseudonymized results of the lab analyses were transferred to the CESAR study center in Vienna, where they were matched with the pseudonymized clinical data. Then the pseudonymization codes were replaced by random numbers for anonymization. The anonymized data were transferred to the Center for the Evaluation of Biomarkers (CEBIO) GmbH for independent statistical evaluation. The data was checked for completeness and plausibility.
The study objectives were to investigate the relevance of the soluble biomarkers, PD-1, PD-L1 and PD-L2, for therapy response prediction and estimation of prognosis regarding OS. Evaluation of the prediction of therapy response assessed by computed tomography (CT) before cycle 3 was done by logistic regression analysis. Furthermore, the areas under the curve (AUC) of receiver operating characteristics (ROC) curves were calculated to discriminate patients with progressive disease (PD; non-responders) from responding patients, including those with stable disease (SD) or partial remission (PR). Regarding prognosis, the pretherapeutic biomarker values were evaluated using Kaplan-Meier curves. Statistical evaluations were conducted using of R-software version 4.2.2 (https://www.r-project.org/).
3Results
3.1Patient characteristics
In total N = 266 patients enrolled in the biomarker substudy, of which N = 243 were eligible for statistical analysis providing baseline samples and N = 233 of them also for relative change in biomarker concentrations (Fig. 1). Patients presented with a median age of 63 years (range 40 to 77 years of age). 217 (89%) of the patients in the study population had a history of smoking and 205 (84%) were diagnosed with stage IV disease. 186 study participants presented with non-squamous adenocarcinomas and 57 with squamous cell carcinomas. All patients were treated with a combination of paclitaxel and either carboplatin (N = 200) or cisplatin (N = 43) in a standard body surface area (BSA)- or a pharmacokinetic (PK)-guided dosing scheme. The characteristics of the cohort are summarized in Table 1. Response to therapy was assessed at staging, which took place after the second treatment cycle was completed and before the third treatment cycle started. At staging, 86 patients achieved partial remission (PR), 99 stable disease (SD) and 58 experienced progressive disease (PD) in radiological CT exams.
Fig. 1
Decision tree outlining included samples in the analysis for prediction of response in the programmed cell death markers. The depicted decision trees illustrate the process of sample inclusion for analyzing the predictive potential of response to therapy. The decision tree for pre-therapeutic study samples is shown on the left (A) and the one for the relative concentration change between baseline and the end of treatment cycle two–on the right (B).
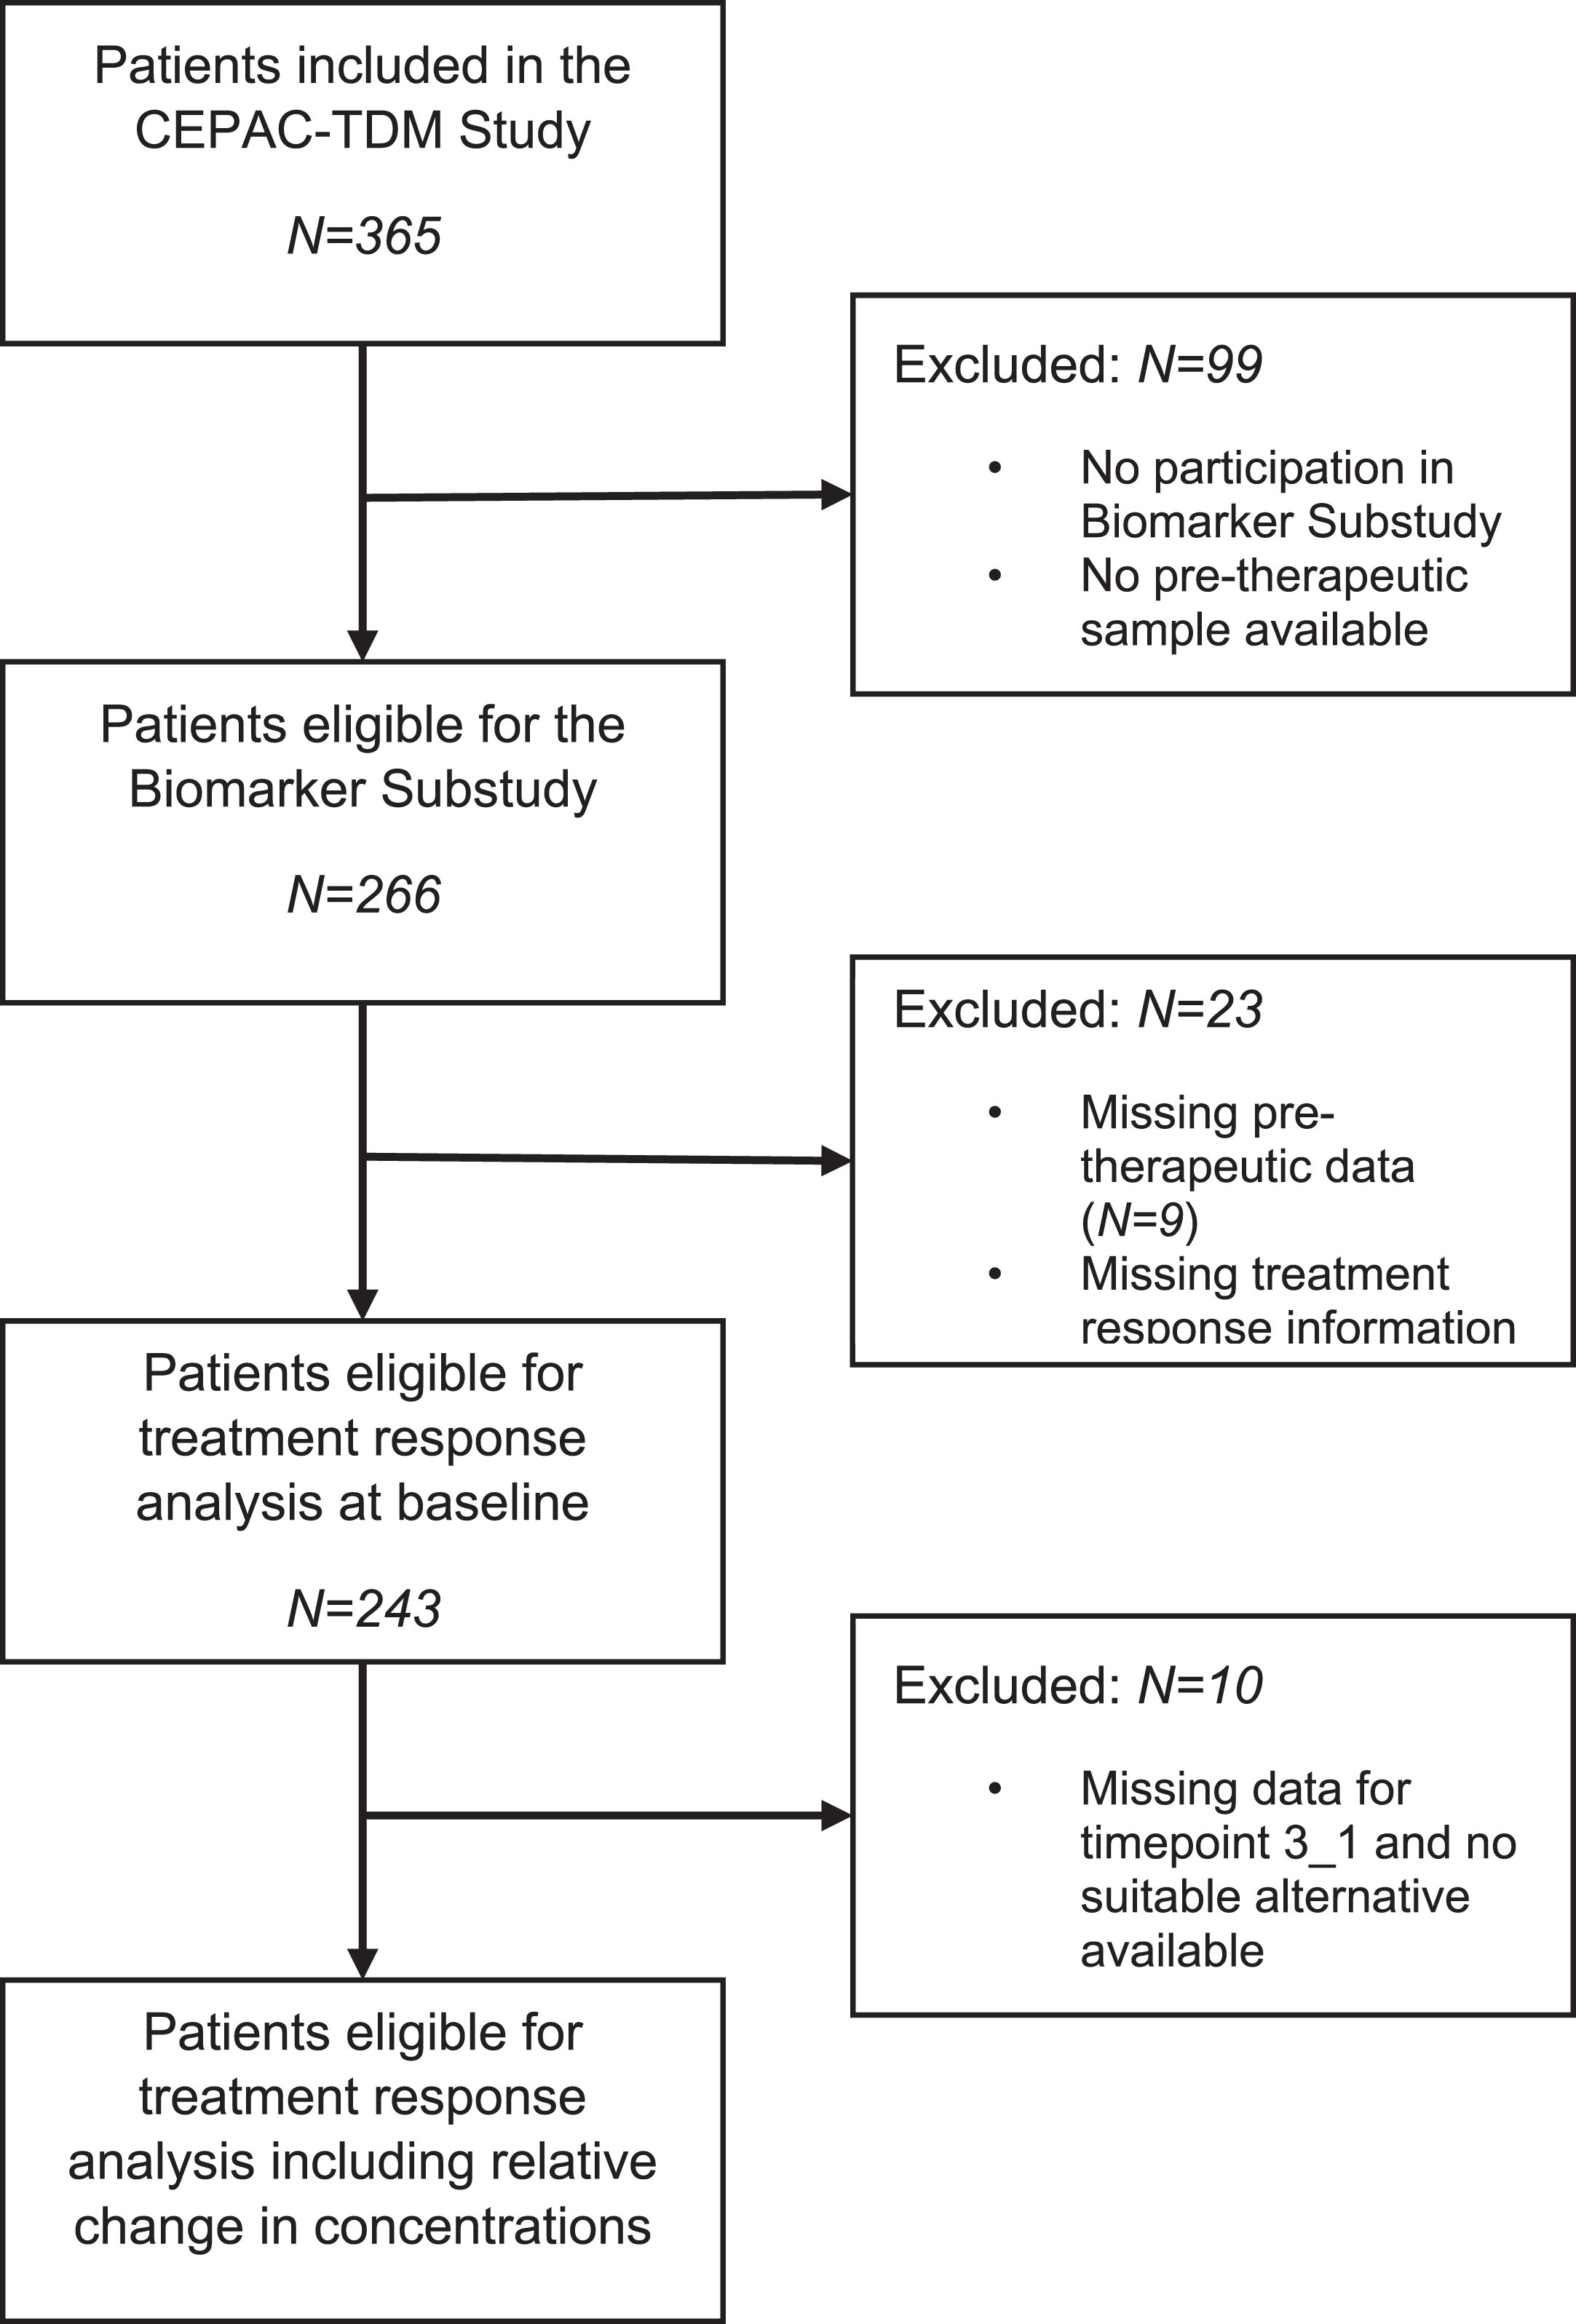
Table 1
Patient characteristics
| Patient Characteristic | Patients (N = 243) | |
| Age [years] | ||
| <65 | 108 | |
| > = 65 | 135 | |
| Min: Max | 40: 77 | |
| Median | 63 | |
| Gender | ||
| Female | 90 | |
| Male | 153 | |
| Smoking status | ||
| Current Smoker | 93 | |
| Former Smoker | 124 | |
| Never Smoked | 26 | |
| Stage at study entry | ||
| IIIB | 38 | |
| IV | 205 | |
| Tumor histology | ||
| Non-Squamous Adenocarcinoma | 186 | |
| Squamous Cell Carcinoma | 57 | |
| ECOG at study entry | ||
| 0 | 127 | |
| 1 | 84 | |
| 2 | 10 | |
| NA | 22 | |
| Study arm | ||
| BSA* | 121 | |
| PK* | 122 | |
| Study drug | ||
| Carboplatin | 200 | |
| Cisplatin | 43 | |
| Prior adjuvant chemotherapy | ||
| Yes | 23 | |
| No | 220 |
*Standard body surface area (BSA); *pharmacokinetic (PK).
3.2Distribution of programmed cell death markers in response groups
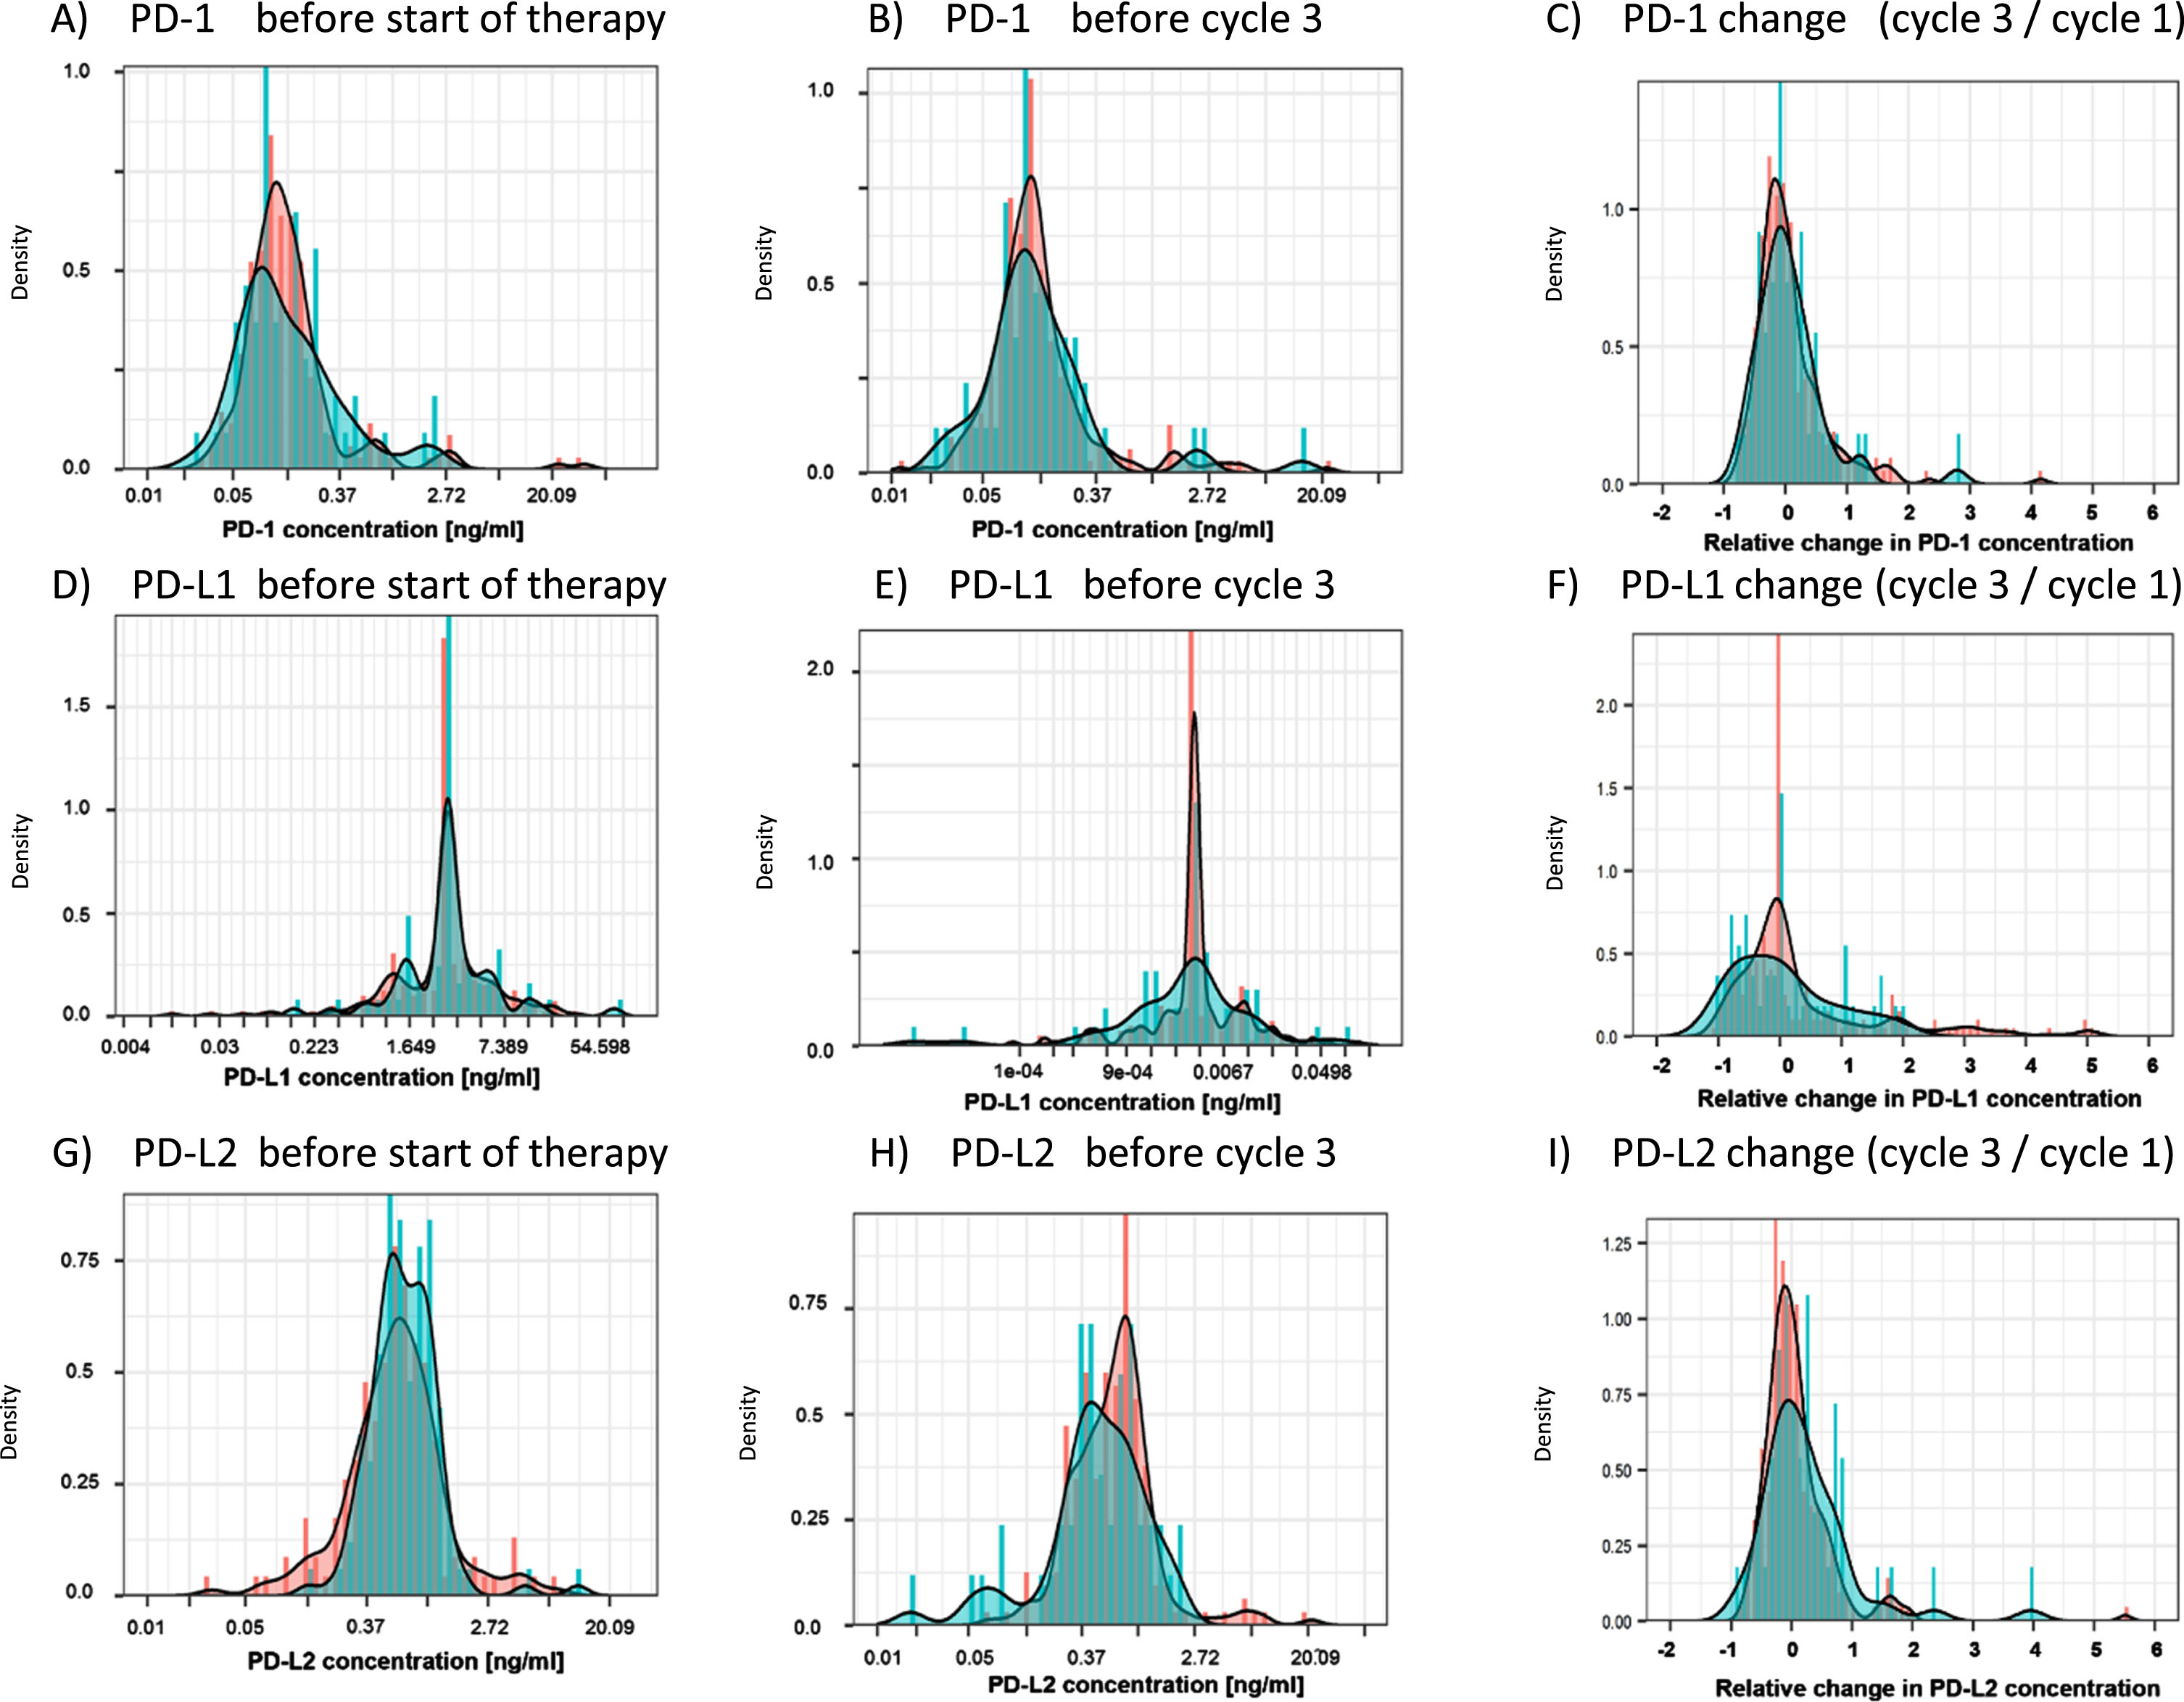
An overview over the measured biomarker concentrations for the three biomarkers is provided in Table 2. The distribution of PD-1, PD-L1 and PD-L2 before the start of the chemotherapy (C1) exhibited significant overlap between patients with a response (SD+PR) and no response (PD), as depicted in the density plots (Fig. 2). Similarly, at time of CT-based staging prior to cycle 3 (C3), no discrimination between responders and non-responders was possible by PD-1, PD-L1 and PD-L2 biomarkers. Finally, the relative change between C1 and C3 (C3/C1) was not different between responders and non-responders for any marker (Fig. 2, Table 2).
Table 2
Distribution of the measured PD-1, PD-L1 and PD-L2 concentration across the study population
| Marker | PD-1 | PD-L1 | PD-L2 | |||
| Timepoint | Pre-therapy | End of C2 | Pre-therapy | End of C2 | Pre-therapy | End of C2 |
| N | 243 | 164 | 243 | 165 | 243 | 165 |
| Median | 0.12 | 0.12 | 0.0073 | 0.0073 | 0.61 | 0.64 |
| Mean | 0.45 | 0.27 | 0.0093 | 0.0099 | 0.92 | 1.15 |
| 5th percentile | 0.048 | 0.04 | 0.0073 | 0.0073 | 0.22 | 0.25 |
| 95th percentile | 0.74 | 0.63 | 0.020 | 0.019 | 1.81 | 1.66 |
| Minimum | 0.023 | 0.012 | 0.0073 | 0.0073 | 0.029 | 0.071 |
| Maximum | 30.00 | 8.33 | 0.12 | 0.17 | 19.21 | 30.00 |
| N > ULOQ | 1 | 0 | 0 | 0 | 0 | 1 |
| N < LLOQ | 0 | 0 | 222 | 135 | 0 | 0 |
C2: Therapy Cycle 2, ULOQ: Upper limit of quantification, LLOQ: Lower limit of quantification. Units for all markers [ng/ml], except for N.
Fig. 2
Distribution of PD-1, PD-L1 and PD-L2 at baseline (C1), staging (C3) and relative changes between C1 and C3. Density plots visualize the distribution of the measured PD-1, PD-L1 and PD-L2 concentrations in the cohorts of patients with response (stable disease and partial remission; red) and progression at the time of first radiological exam. PD-1, PD-L1 and PD-L2 were assessed before the start of therapy (A, D, G) and prior to treatment cycle 3, at time of the first radiological exam (B, E, H). Additionally, the relative change from baseline to cycle 3 was evaluated (C, F, I).
3.3Discrimination between response groups
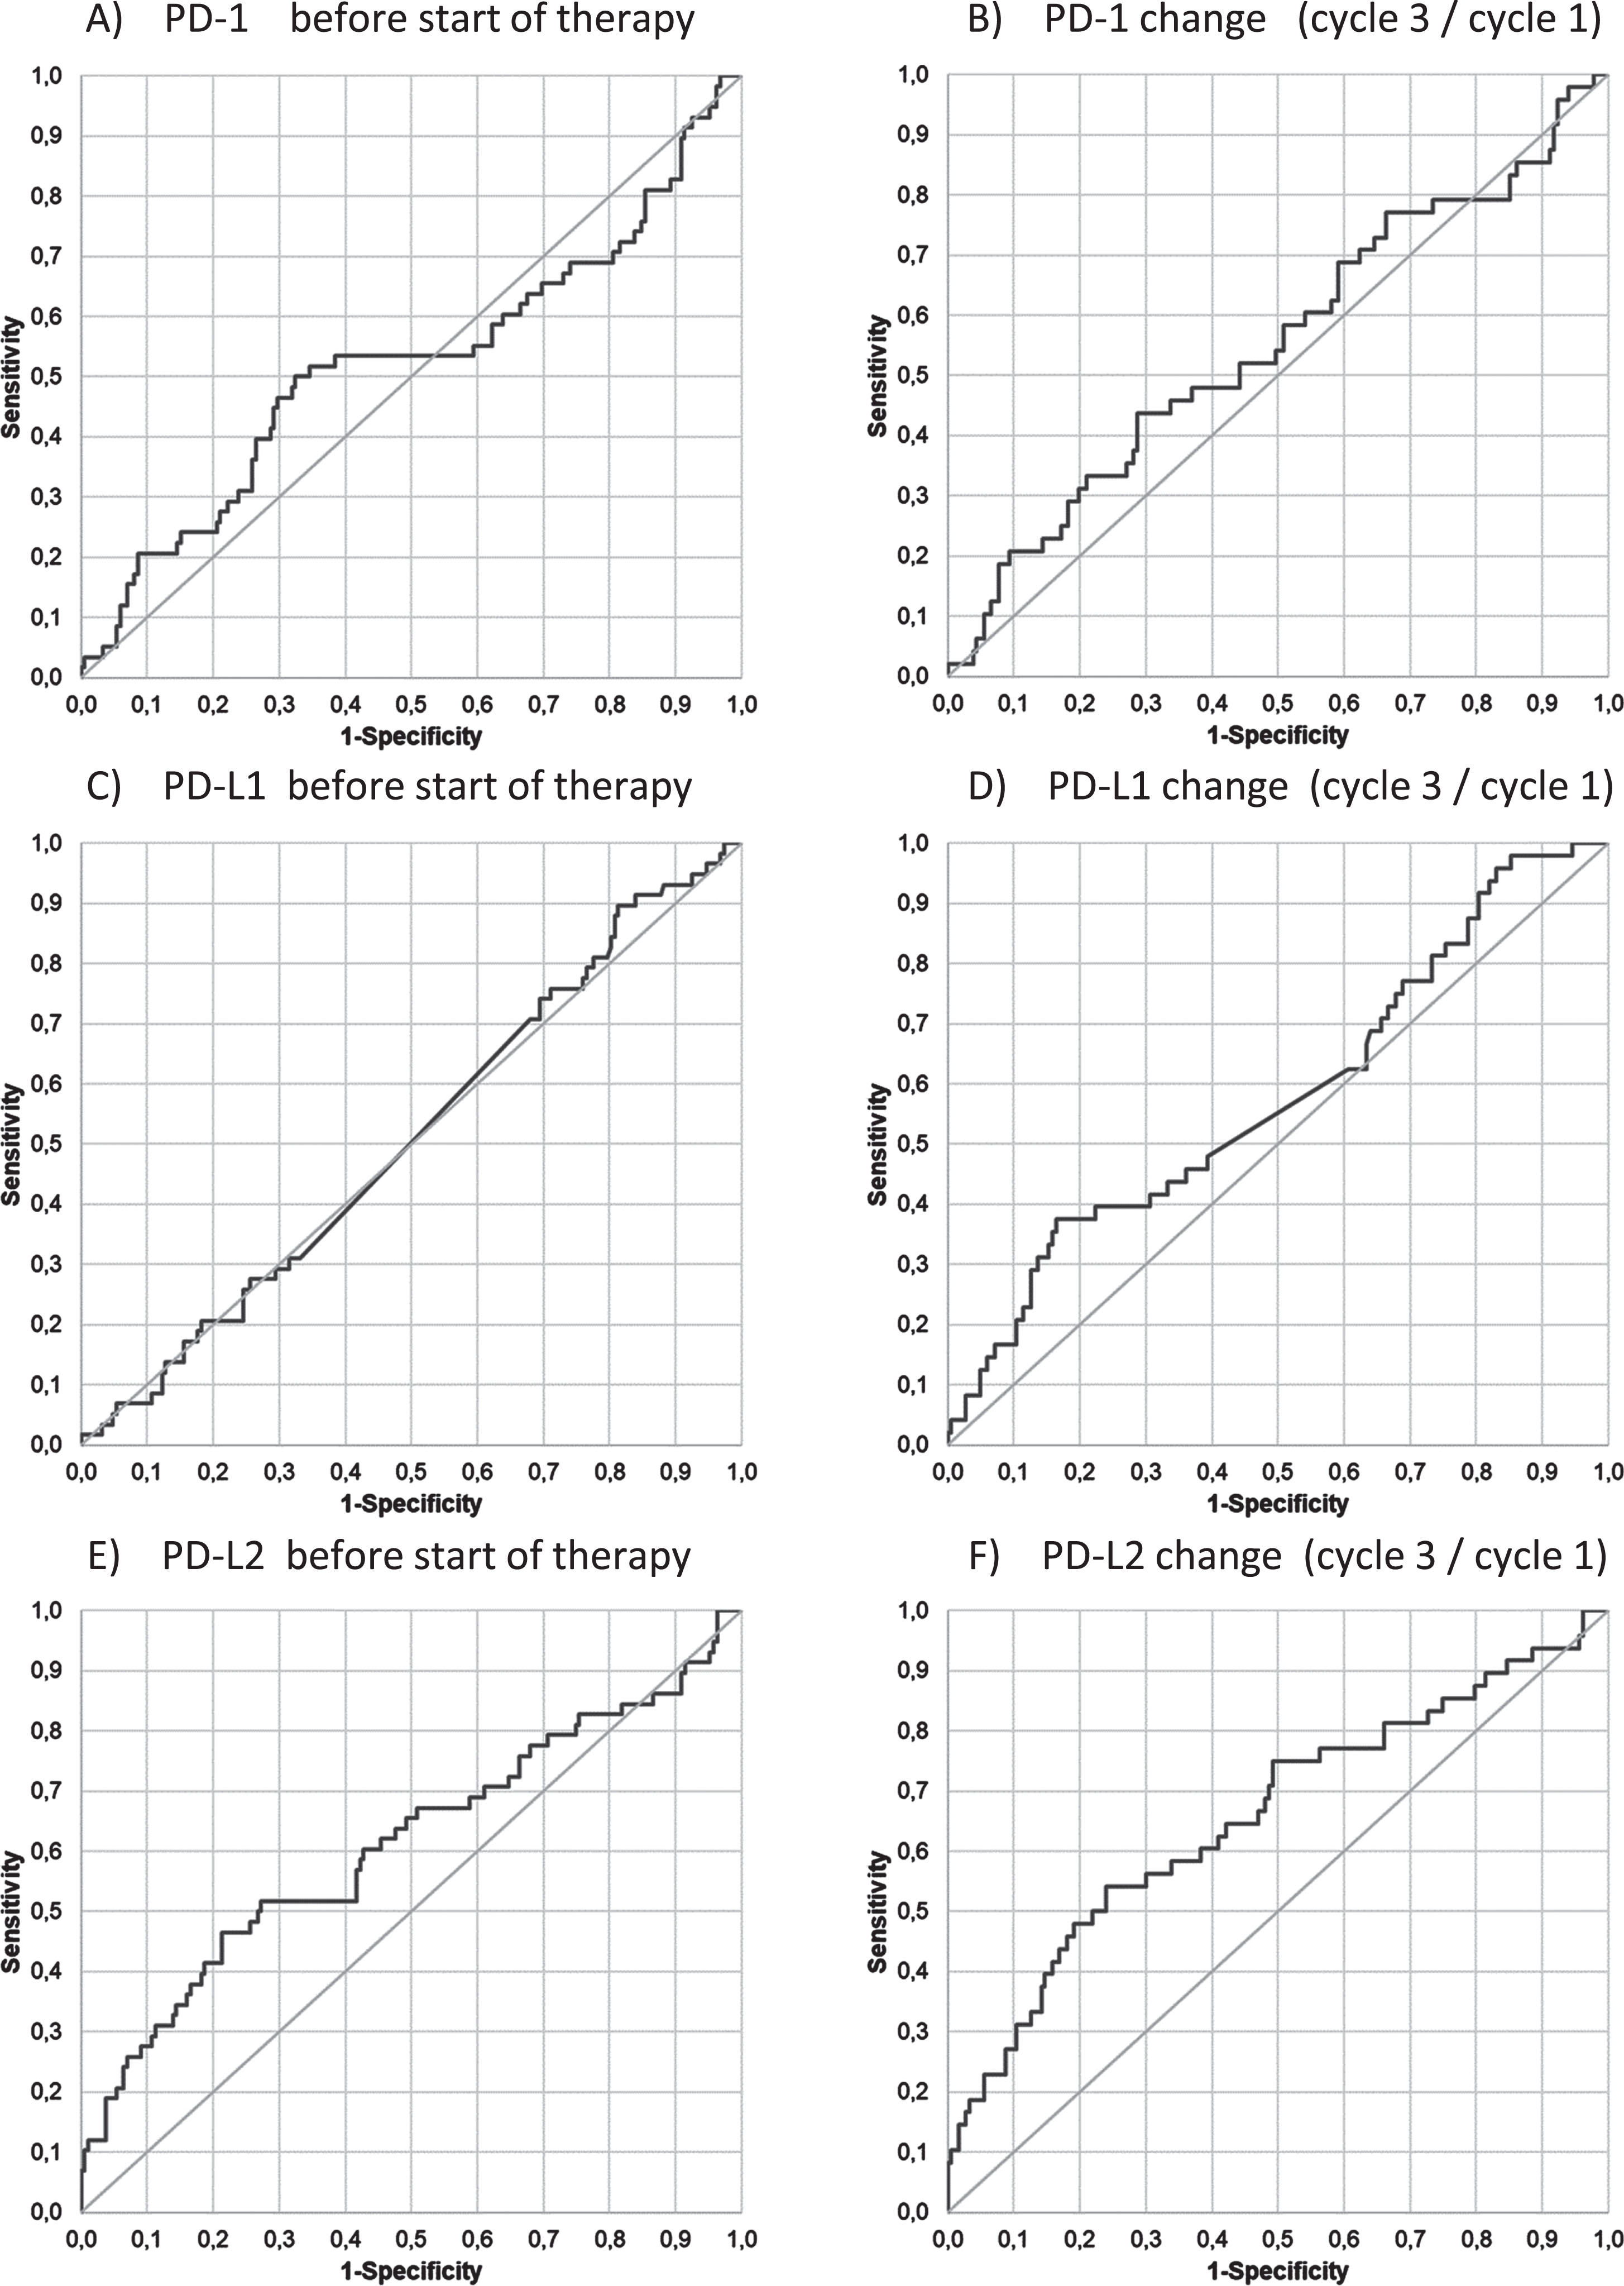
When calculating the ROC curves, AUCs for PD-1 and PD-L1 before the start of the therapy (0.52 and 0.51), at staging, and for relative changes from C1 to C3 (0.55 and 0.58) remained below 0.6, indicating no discrimination between responders and non-responders. For PD-L2, the AUCs were found to be 0.61 for the pre-treatment value and 0.66 for the relative change from C1 to C3, still indicating poor discrimination between response groups (Fig. 3).
Fig. 3
Discrimination between response groups (PD vs SD+PR). Receiver operating characteristic (ROC) curves of PD-1, PD-L1 and PD-L2 for the discrimination of patients with progression (PD) as compared with responding patients with stable disease and partial remission (SD+PR) at baseline (C1) before start of therapy (A, C, E) and for the relative changes from C1 to C3 (B, D, F).
3.4Estimation of prognosis
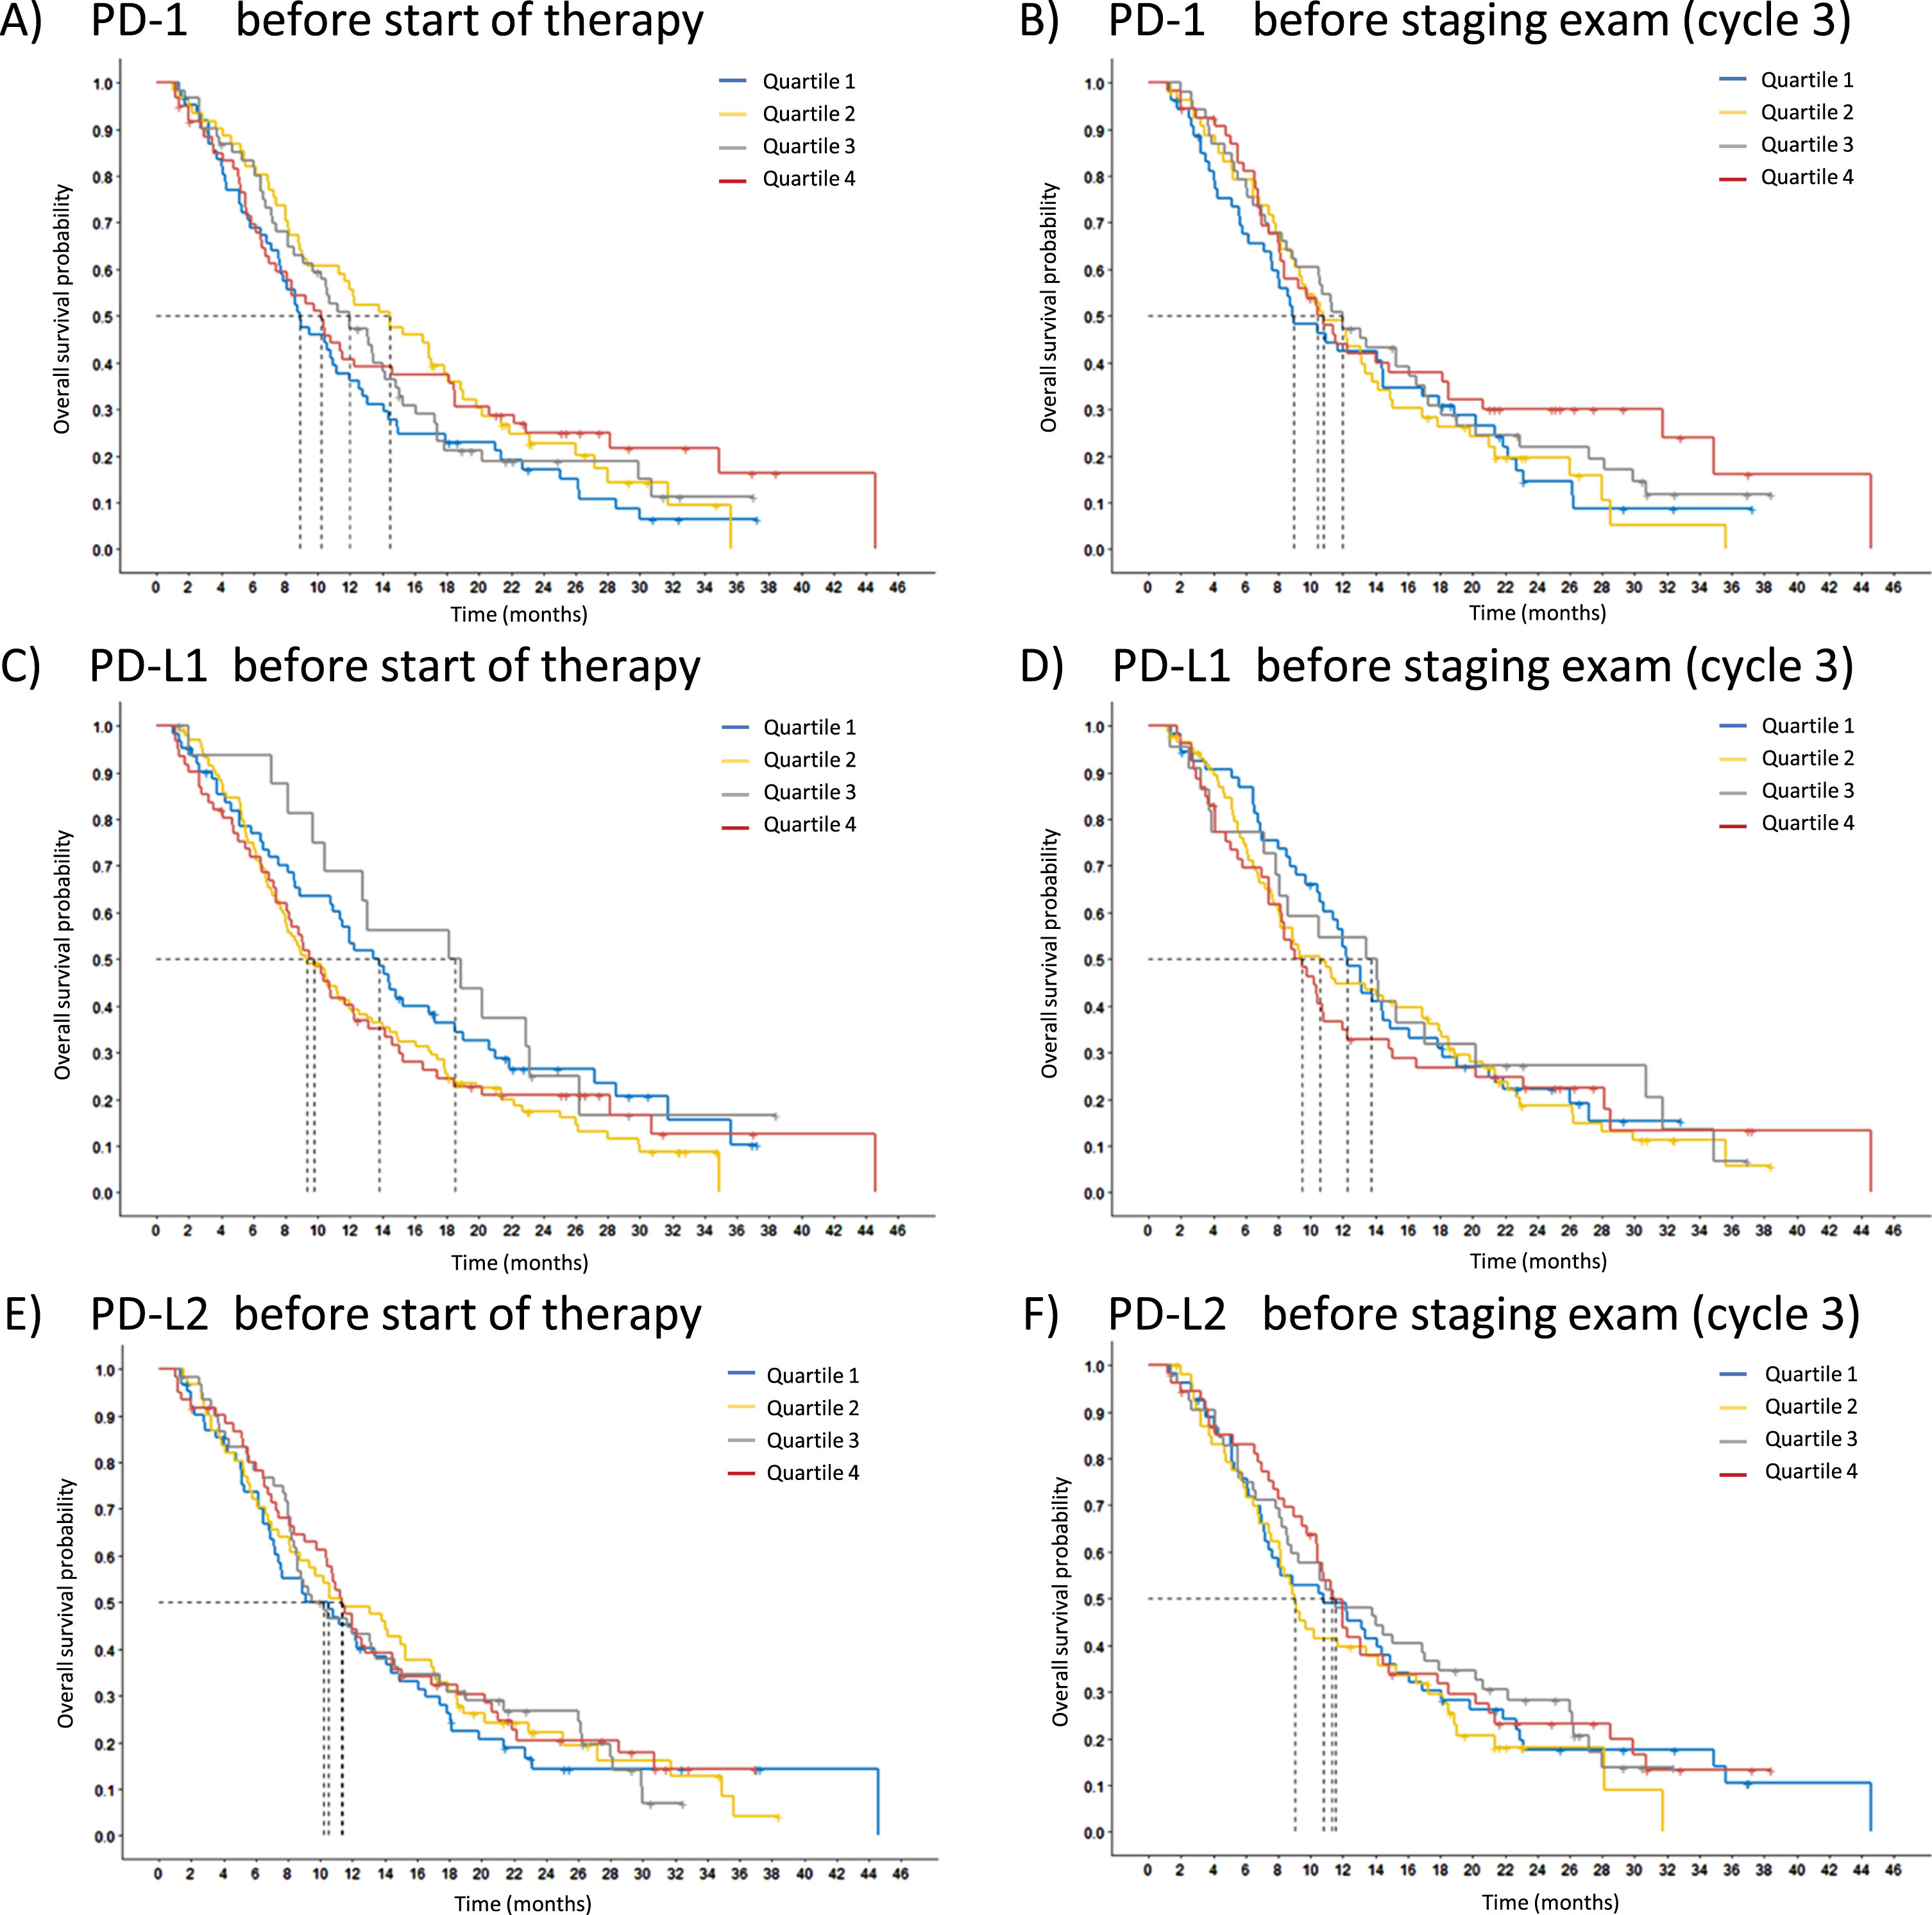
Prognosis is assessed for OS by Kaplan-Meier curves. The measured concentrations of the cohort were divided into quartiles to test whether the median or any quartile is suitable for distinguishing prognostically different groups. However, there was no prognostically significant difference between the groups for either the pretherapeutic values or the values at C3 of all PD markers (Fig. 4).
Fig. 4
Relevance of PD markers for overall survival (OS). Overall survival probability of the three markers is displayed using Kaplan-Meier curves, PD-1 (A,B), PD-L1 (C,D) and PD-L2 (E,F). The entire study population was split according to the marker levels into four quartiles (Q1 blue, Q2 yellow, Q3 grey, Q4 red). The pretherapeutic baseline levels (C1) are presented on the left (A, C, E) and the values at first radiological staging exam (C3) on the right (B, D, F).
4Discussion
In the present study, the immune checkpoint biomarkers PD-1, PD-L1 and PD-L2 in the blood of NSCLC patients who underwent systemic platinum-based combination chemotherapy proved to be ineffective for predicting therapy response or estimating prognosis. While the results may appear disappointing at first glance, they are well explainable. Platinum and its derivates alkylate DNA, forming cross links between the DNA-strands and thereby inhibiting DNA replication [27]. Often, its combination partners in lung cancer are taxanes that target and stabilize microtubules, impairing cell division and proliferation [28]. The cytostatic and cytotoxic effects of platins or taxanes are different from the novel concept of ICI therapies. These concepts are based on the fact that some tumors develop specific escape mechanisms, such as the silencing of tumor-infiltrating lymphocytes (TILs) via the programmed cell death receptors/ligands, CTLA-4 or similar systems [15]. PD-L1 is expressed on tumor cells and bind to its PD-1 receptor on TILs, thereby turning off their tumor-specific activity [29, 30]. ICI drugs, such as PD-1 or PD-L1 inhibitors interrupt this interaction leading to a reactivation of TILs and often to a sustainable antitumor efficacy [31]. One of the companion diagnostics that indicate the possible efficacy of ICI therapy is the expression of PD-L1 on tumor tissue in biopsy or resected samples [32,33]. Therefore, it was hypothesized that high PD-L1 levels in the blood might also serve as a predictive indicator of responsiveness to ICIs. Indeed, in the meantime several studies have shown that soluble PD-L1 in the serum or plasma, or alternatively, PD-L1 that is associated with extracellular vesicles (EVs) or circulating tumor cells (CTCs) which provides predictive or prognostic information across various solid tumors treated by ICIs [34–37].
Beyond these specific effects, it was assumed that PD-1, PD-L1 and PD-L2 play an additional role in regulating inflammatory processes that often accompany tumor growth and spread [15, 38–40]. Therefore, the present study was conducted with the use of novel, highly sensitive immunoassays on a chemiluminescent detection platform that has recently been developed and optimized at our Munich Biomarker Research Center. In this context, a comprehensive analytical and preanalytical validation was performed to confirm the robust assay performance necessary for clinical evaluations [25, 26]. Subsequently, an investigation was conducted to explore the potential utility of programmed cell death biomarkers beyond the specific ICI treatments, e.g. in conventional chemotherapies applied to cancer patients.
To address this scientific question, biobanked samples were obtained from a prospective blood collection as part of a biomarker substudy linked to a multicentric randomized clinical drug trial for individualized, pharmaco-kinetically (PK)-guided dosing of paclitaxel combined with carboplatin or cisplatin in patients with NSCLC (CEPAC-TDM) [24]. The advantages of this secondary use of serially collected samples were the consistency of all study sites in adhering to well-defined time points of venepuncture, the implementation of well-defined, standardized procedures of preanalytical blood handling and storage, the excellent clinical documentation, radiological outcome measurements and follow-up visits, as required in a GCP-level clinical trial, as well as and close monitoring of all study sites by a centrally organized study team of CESAR-EWIV. Furthermore, the analyses were done by experienced staff utilizing a range of processes and analytical controls, followed by an independent high quality statistic evaluation by biostatistics experts. The study’s limitations are the lack of a validation cohort and missing information on PD-L1 status in tissue exams. It has to be mentioned that adenocarcinoma were overrepresented, and the response rates were within the expectable range [2]. In addition to programmed cell death markers, established and new tumor markers have been assessed in a parallel study. Thereby, CYFRA 21-1, CA 125 and CA 15-3 have been revealed to be predictive and prognostic markers [41]. This was in line with other studies and a comprehensive metaanalysis that have reported CYFRA 21-1 and CEA being highly relevant biomarkers for prediction of response and monitoring of NSCLC patients with chemotherapy [8] as well as CYFRA 21-1 and other tumor markers for estimation of prognosis of advanced NSCLC [42]. Based on the analysis outcome, soluble programmed cell death markers are not relevant in chemotherapy-treated NSCLC patients. Different reasons might play a major role in this observation: Firstly, the measured markers are not the target of the therapy and as such are not expected to exhibit significant changes in marker concentrations. In addition, it is not clear whether soluble programmed cell death ligands and receptors are shed from the cell surface in a specific manner or actively released, thus correlating with reduced or enhanced presence on the cellular surface. Furthermore, they may interact with other proteins, or cellular or subcellular components in the blood stream that influence their metabolization, elimination, and thus their duration in the blood. To elucidate this complex and not yet fully understood biology of programmed cell death markers further studies are necessary. Additionally, their possible utility for prediction and prognosis in ICI-treated patients will have to be studied in future. Some recent studies have already reported correlations of high concentrations of soluble PD-L1 with poor OS in ICI-treated NSCLC patients [19, 20] and of soluble PD-1 with response to PD-1-targeting treatment and prognosis [18]. Nevertheless, standardizing the assays and antibodies used, as well as establishing universal applicable decision thresholds are challenges lying ahead, before the implementation of programmed cell death markers in future clinical diagnostic settings can be considered.
5Conclusions
The current prospective biomarker study involving serial samples from advanced NSCLC patients undergoing platinum-based chemotherapy does not provide evidence supporting the utility of soluble PD-1, PD-L1, and PD-L2 for predicting therapy response or estimating prognosis. Additional studies on NSCLC patients receiving PD-1 or PD-L1 inhibiting therapies are warranted to elucidate the biomarker utility in this more specific setting.
Acknowledgments
Blood samples were collected in the biomarker substudy of the clinical drug trial CEPAC-TDM that was conducted by CESAR-EWIV and sponsored by Saladax Biomedical Inc. The tumor marker substudy was organized and conducted by CEBIO GmbH.
Author contributions
CONCEPTION: KG and SH
DATA CURATION: KG, MJ, MR and KH
ANALYSIS OF DATA: KH, KS and SU
PREPARATION OF THE MANUSCRIPT: KG and SH
REVISION FOR IMPORTANT INTELLECTUAL CONTENT: all
SUPERVISION: SH
Conflict of interest
Stefan Holdenrieder has received research funding or honoraria from Roche Diagnostics, Bristol Myers Squibb, Merck KgaA, Sysmex Inostics, Thermo Fisher Scientific and Volition SPRL. SH is also an Editorial Board member of Tumor Biology but had no involvement in the peer review process of this manuscript.
Ethical considerations
The study was approved by the respective institutional review boards (IRB-Nr 576/2010 AMG1 Eberhard-Karls-University Tübingen, Germany; EKSG 11/011 SG 323/10 St. Gallen, Switzerland) and was performed in accordance with the Declaration of Helsinki and Good Clinical Practice guidelines. All patients provided written informed consent prior to any study-related procedures.
References
[1] | Sung H , Ferlay J , Siegel RL , Laversanne M , Soerjomataram I , Jemal A , et al. Global Cancer Statistics 2020: GLOBOCAN Estimates of Incidence and Mortality Worldwide for 36 Cancers in 185 Countries. CA Cancer J Clin. (2021) ;71: (3):209–49. doi: 10.3322/caac.21660 |
[2] | Ettinger DS , Wood DE , Aisner DL , Akerley W , Bauman JR , Bharat A , et al. Non–Small Cell Lung Cancer, Version 3.2022. JNCCN J Natl Compr Cancer Netw. (2022) ;20: (5):497–530. doi: 10.6004/jnccn.2022.0025 |
[3] | Sutić M , Vukić A , Baranasić J , Försti A , Dzubur F , Samarzija M , et al. Diagnostic, predictive and prognostic biomarkers in non-small cell lung cancer (Nsclc) management. J Pers Med. (2021) ;11: (1102). doi: 10.3390/jpm11111102 |
[4] | Shepherd Frances A , Rodrigues Pereira José , Ciuleanu Tudor , Tan Eng , Hirsh Vera , Thongprasert Sumitra , Campos Daniel , Maoleekoonpiroj Savitree , Smylie Michael , Martins Renato , van Kooten Maximiliano , Dediu Mircea , Findlay Brian , Tu Domgshem L . Erlotinib in Previously Treated Non–Small-Cell Lung Cancer. N Engl J Med. (2005) ;353: (2):123–32. doi: 10.1056/NEJMoa050753 |
[5] | Peters S , Gettinger S , Johnson ML , Jänne PA , Garassino MC , Christoph D , et al. Phase II trial of atezolizumab as first-line or subsequent therapy for patients with programmed death-ligand 1-selected advanced non-small-cell lung cancer (BIRCH). J Clin Oncol. (2017) ;35: (24):2781–9. doi: 10.1200/JCO.2016.71.9476 |
[6] | Holdenrieder S . Biomarkers along the continuum of care in lung cancer. Scand J Clin Lab Invest. (2016) ;76: (S245):S40–5. doi: 10.1080/00365513.2016.1208446 |
[7] | Barak V , Holdenrieder S , Nisman B , Stieber P . Relevance of circulating biomarkers for the therapy monitoring and follow-up investigations in patients with non-small cell lung cancer. Cancer Biomarkers. (2010) ;6: (3–4):191–6. doi: 10.3233/CBM-2009-0129 |
[8] | Holdenrieder S , Wehnl B , Hettwer K , Simon K , Uhlig S , Dayyani F . Carcinoembryonic antigen and cytokeratin-19 fragments for assessment of therapy response in non-small cell lung cancer: a systematic review and meta-Analysis. Br J Cancer. (2017) ;116: (8):1037–45. doi: 10.1038/bjc.2017.45 |
[9] | Moritz R , Muller M , Korse CM , van den Broek D , Baas P , van den Noort V , et al. Diagnostic validation and interpretation of longitudinal circulating biomarkers using a biomarker response characteristic plot. Clin Chim Acta. (2018) ;487: (September):6–14. doi: 10.1016/j.cca.2018.09.015 |
[10] | Molina R , Marrades RM , Augé JM , Escudero JM , Viñolas N , Reguart N , et al. Assessment of a Combined Panel of Six Serum Tumor Markers for Lung Cancer. Am J Respir Crit Care Med. (2016) ;193: (4):427–37. doi: 10.1164/rccm.201404-0603OC |
[11] | Blank C , Gajewski TF , Mackensen A . Interaction of PD-L1 on tumor cells with PD-1 on tumor-specific T cells as a mechanism of immune evasion: implications for tumor immunotherapy. Cancer Immunol Immunother. (2005) ;(54):307–14. doi: 10.1007/s00262-004-0593-x |
[12] | Freeman GJ , Long AJ , Iwai Y , Bourque K , Chernova T , Nishimura H , et al. Engagement of the PD-1 immunoinhibitory receptor by a novel B7family member leads to negative regulation of lymphocyte activation. J Exp Med. (2000) ;192: (7):1027–34. doi: 10.1084/jem.192.7.1027 |
[13] | Marzec M , Zhang Q , Goradia A , Raghunath PN , Liu X , Paessler M , et al. Oncogenic kinase NPM/ALK induces through STAT3 expression of immunosuppressive protein CD274 (PD-L1, B7-H1). Proc Natl Acad Sci U S A. (2008) ;105: (52):20852–7. doi: 10.1073/pnas.0810958105 |
[14] | Francisco LM , Sage PT , Sharpe AH . The PD-1 Pathway in Tolerance and Autoimmunity. Immunol Rev. (2010) ;236: (1):291–42. doi: 10.1111/j.1600-065X.2010.00923.x |
[15] | Schildberg FA , Klein SR , Freeman GJ , Sharpe AH . Coinhibitory Pathways in the B7-CD28 Ligand-Receptor Family. Immunity. (2016) ;44: (5):955–72. doi: 10.1016/j.immuni.2016.05.002 |
[16] | Brown JA , Dorfman DM , Ma F-R , Sullivan EL , Munoz O , Wood CR , et al. Blockade of Programmed Death-1 Ligands on Dendritic Cells Enhances T Cell Activation and Cytokine Production. J Immunol. (2003) ;170: (3):1257–66. doi: 10.4049/jimmunol.170.3.1257 |
[17] | Baillie FJ , Morrision AE , Fergus I . Soluble transferrin receptor: a discriminating assay for orpn deficiency. Int J Lab Hematol. (2003) ;25: (5). doi: 10.1046/j.0141-9854.2003.00548.x |
[18] | Khan M , Zhao Z , Arooj S , Fu Y , Liao G . Soluble PD- Predictive, Prognostic, and Therapeutic Value for Cancer Immunotherapy. Front Immunol. (2020) ;11: :1–16. doi: 10.3389/fimmu.2020.587460 |
[19] | Murakami S , Shibaki R , Matsumoto Y , Yoshida T , Goto Y , Kanda S , et al. Association between serum level soluble programmed cell death ligand 1 and prognosis in patients with non-small cell lung cancer treated with anti-PD-1 antibody. Thorac Cancer. (2020) ;11: :3585–95. doi: 10.1111/1759-7714.13721 |
[20] | Liao G , Zhao Z , Qian Y , Ling X , Chen S , Li X , et al. Prognostic Role of Soluble Programmed Death Ligand 1 in Non-Small Cell Lung Cancer: A Systematic Review and Meta-Analysis. Front Oncol. (2021) ;11: :1–10. doi: 10.3389/fonc.2021.774131 |
[21] | Oh SY , Kim S , Keam B , Kim TM , Kim DW , Heo DS . Soluble PD-L1 is a predictive and prognostic biomarker in advanced cancer patients who receive immune checkpoint blockade treatment. Sci Rep. (2021) ;11: :1–11. doi: 10.1038/s41598-021-99311-y |
[22] | Bailly C , Thuru X , Quesnel B . Soluble programmed death ligand-1 (sPD-D1): A pool of circulating proteins implicated in health and diseases. Cancers (Basel). (2021) ;13: (3034):131–24. doi: 10.3390/cancers13123034 |
[23] | He Y , Zhang X , Zhu M , He W , Hua H , Ye F , et al. Soluble PD-L a potential dynamic predictive biomarker for immunotherapy in patients with proficient mismatch repair colorectal cancer. J Transl Med. (2023) ;21: (25):1–13. doi: 10.1186/s12967-023-03879-0 |
[24] | Joerger M , von Pawel J , Kraff S , Fischer JR , Eberhardt W , Gauler TC , et al. Open-label, randomized study of individualized, pharmacokinetically (PK)-guided dosing of paclitaxel combined with carboplatin or cisplatin in patients with advanced non-small-cell lung cancer (NSCLC). Ann Oncol. (2016) ;27: (10):1895–902. doi: 10.1186/s12967-023-03879-0 |
[25] | Krueger K , Mayer Z , Gerckens M , Boeck S , Luppa P , Holdenrieder S . High Quality Performance of Novel Immunoassays for the Sensitive Quantification of Soluble PD-1, PD-L1 and PD-L2 in Blood. Biomedicines. (2022) ;10: (2405):1–13. doi: 10.3390/biomedicines10102405 |
[26] | Krueger K , Mayer Z , Kottmaier M , Gerckens M , Boeck S , Luppa P , et al. Robust Preanalytical Performance of Soluble PD-1, PD-L1 and PD-L2 Assessed by Sensitive ELISAs in Blood. Biomedicines. (2022) ;10: (2534):1–13. doi: 10.3390/biomedicines10102534 |
[27] | Schoch S , Gajewski S , Rothfuß J , Hartwig A , Köberle B . Comparative study of the mode of action of clinically approved platinum-based chemotherapeutics. Int J Mol Sci. (2020) ;21: :1–21. doi: 10.3390/ijms21186928 |
[28] | Abal M , Andreu JM , Barasoain I . Taxanes: microtubule and centrosome targets, and cell cycle dependent mechanisms of action. Curr Cancer Drug Targets. (2003) ;3: (3):193–203. doi: 10.2174/1568009033481967 |
[29] | Spranger S , Spaapen RM , Zha Y , Williams J , Meng Y , Ha TT , et al. Up-Regulation of PD-L1, IDO and Tregs in the Melanoma Tumor Microenvironment Is Driven by CD8+T Cells. Sci Transl Med. (2013) ;5: (200):1–21. doi: 10.1126/scitranslmed.3006504 |
[30] | Taube JM , Anders RA , Young GD , Xu H , Sharma R , McMiller TL , et al. Colocalization of Inflammatory Response with B7-H1 Expression in Human Melanocytic Lesions Supports an Adaptive Resistance Mechanism of Immune Escape. Sci Transl Med. (2012) ;4: (127):1–22. doi: 10.1126/scitranslmed.3003689 |
[31] | Liu Y , Sun Z . Turning cold tumors into hot tumors by improving T-cell infiltration. Theranostics. (2021) ;11: (11):5365–86. doi: 10.7150/thno.58390 |
[32] | Patel SP , Kurzrock R . PD-L1 expression as a predictive biomarker in cancer immunotherapy. Mol Cancer Ther. (2015) ;14: (4):847–56. doi: 10.1158/1535-7163.MCT-14-0983 |
[33] | Liu D , Wang S , Bindeman W . Clinical applications of PD-L1 bioassays for cancer immunotherapy. J Hematol Oncol. (2017) ;10: (110):1–6. doi: 10.1186/s13045-017-0479-y |
[34] | Liu J , Peng X , Yang S , Li X , Huang M , Wei S , et al. Extracellular vesicle PD-L1 in reshaping tumor immune microenvironment: biological function and potential therapy strategies. Cell Commun Signal. (2022) ;20: (14):1–18. doi: 10.1186/s12964-021-00816-w |
[35] | Poggio M , Hu T , Pai C-C , Belair CD , Chang A , Montabana E , et al. Suppression of Exosomal PD-L1 Induces Systemic Anti-tumor Immunity and Memory. Cell. (2019) ;177: (2):414–27. doi: 10.1016/j.cell.2019.02.016 |
[36] | Sinoquet L , Jacot W , Gauthier L , Pouderoux S , Viala M , Cayrefourcq L , et al. Programmed Cell Death Ligand 1-Expressing Circulating Tumor Cells: A New Prognostic Biomarker in Non-Small Cell Lung Cancer. Clin Chem. (2021) ;67: (11):1503–12. doi: 10.1093/clinchem/hvab131 |
[37] | Pantazaka E , Ntzifa A , Roumeliotou , Argyro , Lianidou E , Georgoulias V , Kotsakis A , Kallergi G . PD-L1/pS6 in Circulating Tumor Cells (CTCs) during Osimertinib Treatment in Patients with Non-Small Cell Lung Cancer Cancer (NSCLC). Biomedicines. (2022) ;10: (1893):1–14. doi: 10.3390/biomedicines10081893 |
[38] | Patsoukis N , Brown J , Petkova V , Liu F , Li L , Boussiotis VA . Selective effects of PD-1 on Akt and Ras pathways regulate molecular components of the cell cycle and inhibit T cell proliferation. Sci Signal. (2012) ;5: (230):1–30. doi: 10.1126/scisignal.2002796 |
[39] | Keir ME , Butte MJ , Freeman GJ , Sharpe AH . PD-1 and Its Ligands in Tolerance and Immunity. Annu Rev Immunol. (2008) ;26: :677–704. doi: 10.1146/annurev.immunol.26.021607.090331 |
[40] | Topalian SL , Drake CG , Pardoll DM . Immune checkpoint blockade: A common denominator approach to cancer therapy. Cancer Cell. (2015) ;27: (4):450–61. doi: 10.1016/j.ccell.2015.03.001 |
[41] | Geiger K , Joerger M , Roessler M , Hettwer K , Ritter C , Simon K , Uhlig S , Holdenrieder S . Relevance of tumor markers for prognosis, prediction and monitoring of therapy response in non-small cell lung cancer patients –a CEPAC-TDM biomarker substudy. Tumor Biol. 2023 in press. |
[42] | Trulson I , Holdenrieder S . Prognostic value of blood-based protein biomarkers in non-small cell lung cancer –a critical review and update. Tumor Biol. 2023; in press. |


