
Relevance of tumor markers for prognosis and predicting therapy response in non-small cell lung cancer patients: A CEPAC-TDM biomarker substudy
Abstract
BACKGROUND:
Protein tumor markers are released in high amounts into the blood in advanced non-small cell lung cancer (NSCLC).
OBJECTIVE:
To investigate the relevance of serum tumor markers (STM) for prognosis, prediction and monitoring of therapy response in NSCLC patients receiving chemotherapy.
METHODS:
In a biomarker substudy of a prospective, multicentric clinical trial (CEPAC-TDM) on 261 advanced NSCLC patients, CYFRA 21-1, CEA, SCC, NSE, ProGRP, CA125, CA15-3 and HE4 were assessed in serial serum samples and correlated with radiological response after two cycles of chemotherapy and overall (OS) and progression-free survival (PFS).
RESULTS:
While pretherapeutic STM levels at staging did not discriminate between progressive and non-progressive patients, CYFRA 21-1, CA125, NSE and SCC at time of staging did, and yielded AUCs of 0.75, 0.70, 0.69 and 0.67 in ROC curves, respectively. High pretherapeutic CA15-3 and CA125 as well as high CYFRA 21-1, SCC, CA125 and CA15-3 levels at staging were prognostic for shorter PFS and OS –also when clinical variables were added to the models.
CONCLUSIONS:
STM at the time of first radiological staging and pretherapeutic CA15-3, CA125 are predictive for first-line treatment response and highly prognostic in patients with advanced NSCLC.
Main messages:
1. Serum tumor markers CYFRA 21-1, CEA, SCC, NSE, ProGRP, CA 125, CA 15-3 and HE4 were assessed in serial blood samples of patients with non-small cell lung cancer undergoing platin-based combination chemotherapy at baseline and at time of first radiologic staging for estimating their power for predicting therapy response and prognosis.
2. While pretherapeutic STM levels at staging did not discriminate between response groups, CYFRA 21-1, CA 125, NSE and SCC at time of staging were significantly higher in non-responsive patients.
3. High levels of pretherapeutic CA 15-3 and CA 125 as well as high CYFRA 21-1, SCC, CA 125 and CA 15-3 levels at staging were prognostic for shorter progression-free and overall survival.
4. Tumor markers influenced prognosis independently of clinical variables.
1Introduction
Lung cancer is the second most common solid tumor and the first when it comes to mortality in both genders taken together. In 2020, approximately 2.2 million patients were newly diagnosed with lung cancer [1], and 1.8 million have died worldwide. Histological subtypes, non-small-cell lung cancer (NSCLC) and small-cell lung cancer (SCLC), show different clinical features, growth patterns and sensitivity to systemic therapies. Beyond morphological and immunohistochemical exams, molecular pathological classification of tumor tissue enables the stratification of cancer patients for targeted therapies in specific subtypes [2]. As NSCLC is frequently only detected in advanced stages, systemic radio- and chemotherapies complemented by biological and immune therapies are central for the therapeutic strategy [2]. However, only a portion of patients responds to the diverse treatment approaches. Therefore, accurate selection of patients for the specific therapies, individual monitoring of the response to therapy and estimation of overall prognosis by clinical and biochemical indicators are necessary for an individual guidance of the patients [3–6].
Despite significant progress made in the last decades in the discovery of novel cancer pathways and the development of novel drugs, many patients with advanced NSCLC still receive doublet platinum-based chemotherapeutic regimens [7, 8]. An open-label, randomized study of individualized, pharmaco-kinetically (PK)-guided dosing of paclitaxel combined with carboplatin or cisplatin in patients with NSCLC was performed in order to investigate the impact of dose-adjusted treatment for therapy outcome and control of side effects (CEPAC-TDM) in 2016 [9]. In adjunct to this therapeutic trial, a biomarker substudy was initiated in order to evaluate the relevance of several tumor markers for estimating the prognosis as well as for predicting and monitoring the therapy response that was assessed by morphological changes in computed tomography (CT) exams.
For this purpose, blood was taken at defined time points before and during therapy, samples were handled in a standardized preanalytical way and measured on one automatized platform in a centralized study lab to avoid non-patient related variations as possible. Importantly, multiple markers that are known to be relevant in NSCLC such as carcinoembryonic antigen (CEA), cytokeratin-19 fragments (CYFRA 21-1) and squamous cancer cell (SCC) antigen were included [6, 10–12], along with others that are frequently used in SCLC, such as neuron-specific enolase (NSE) and progastrin-releasing peptide (ProGRP) [4, 10, 13–15] or, in adenocarcinoma of other origins, such as CA 15-3, CA 125, and human epididymis protein 4 (HE4) [10, 16]. The aim of the study was to systematically evaluate whether these uncommon markers perform as effectively as the established ones in estimating prognosis and therapy response, and whether they provide additional independent prognostic value.
2Patients and methods
2.1Patients
The retrospective study was conducted on biobanked serum samples that were prospectively collected as a part of a biomarker substudy that was associated with an open-label, randomized study of individualized, pharmaco-kinetically (PK)-guided dosing of paclitaxel combined with carboplatin or cisplatin in patients with NSCLC (CEPAC-TDM). This multicentric therapeutic trial of the Central European Society of Anticancer Drug Research (CESAR) was performed in cooperation with Saladax Biomedical Inc. at several study sites in Germany, Austria and Switzerland. Details of the clinical CEPAC-TDM trial are published in Joerger et al. [9]. The study was approved by the respective institutional review boards (IRB-Nr 576/2010 AMG1 Eberhard-Karls-University Tübingen, Germany; EKSG 11/011 SG 323/10 St. Gallen, Switzerland) and was performed in accordance with the Declaration of Helsinki and Good Clinical Practice guidelines. All patients provided written informed consent prior to any study-related procedures.
Clinical documentation during the course of the study as well as response assessment by computed tomography (CT) after each two therapy cycles were done as parts of the GCP-conform clinical trial at each study site and monitored closely by CESAR study staff. Pseudonomized data were documented at the CESAR study center at Vienna. For the biomarker substudy, the evaluation of the response before cycle 3 and at the end of chemotherapy according to the RECIST-criteria [17] as well as the overall survival (OS) and the progression free survival (PFS) were considered as outcome endpoints.
2.2Blood samples and methods
Blood samples were obtained from patients at various study sites prior to the chemotherapeutic cycles 1, 2 and 3 (C1, C2, C3), and at the end of the treatment (EoT). Venous blood samples were collected into serum-gel monovettes (7.5 ml, Sarstedt, Nürmbrecht, Germany) and allowed to clot for at least 30 minutes at room temperature. Samples were then centrifuged at 2000 x g at 10°C within one to two hours of venipuncture. The pseudonomized serum samples were stored on site at –20°C or –80°C in cryotubes, shipped in batches on dry ice to the Central Lab of the University Bonn, where it was then divided into 500μL aliquots and stored at –80°C. For analysis, samples were shipped on dry ice to the Institute of Laboratory Medicine at the German Heart Centre Munich of the Free State of Bavaria at the Technical University Munich.
In total, 794 samples from 261 patients were analyzed. The samples were asservated during the CESAR trial using standard operating procedures. Concentrations of the tumor markers CEA, CYFRA 21-1, NSE, ProGRP, SCC, CA 15-3, CA 125, and HE4 were measured by electrochemiluminescence immunoassays (ECLIA) on an automated COBAS Elecsys E411 platform (Roche Diagnostics, Mannheim, Germany) in the certified lab of the German Heart Center. Assay calibration and daily run of supplied assay controls were performed as standard quality measures. The quality criteria of the Guidelines of the German Federal Association were applied during all measurements [17]. The generated results were transferred electronically to the laboratory database from which they were accessed for independent statistical analysis.
2.3Study objectives
The study objectives were to investigate the relevance of absolute values and relative changes of serially measured, single tumor markers CEA, CYFRA 21-1, NSE, ProGRP, SCC, CA 15-3, CA 125, and HE4 with regard to therapy response prediction, monitoring and prognosis –and if appropriate, also to investigate the relevance of combinations of biomarkers.
The main objectives were i) the prediction of progressive disease as non-response to therapy in first radiological staging, ii) prediction of partial remission as good response to therapy in first radiological staging, iii) the analysis of the prognostic value of biomarkers regarding progression free survival (PFS) and overall survival (OS).
2.4Anonymization and plausibility check
The pseudonymized results of the lab analyses were transferred to the CESAR study center in Vienna where they were joined with the pseudonymized clinical data. Then the pseudonymization codes were replaced by random numbers for anonymization. The anonymized data were transferred to the Center for the Evaluation of Biomarkers (CEBIO) GmbH for statistical evaluation. There, the data were checked for completeness and plausibility, with regard to the categorization of therapy response before cycle 3 and the end of therapy.
2.5Statistical analyses
For the evaluation of therapy response prediction and monitoring assessed by CT before cycle 3, the relevance of absolute values and relative changes of serially measured, single tumor markers before cycles 1 and 3 were analyzed by means of logistic regression. The dependent variable was the therapy response classification (responder, non-responder) and the marker levels and further patient demographics (gender, smoking status) as well as clinical characteristics (stage, histology, study arm and study drug) were used as covariates. Typically, the natural log of the markers was used for the regression analysis. Based on the results of the logistic regression analysis, the receiver operating characteristics (ROC curve) and area under ROC curve (AUC value) were calculated. The evaluation was done for two scenarios: First, patients with progressive disease (PD) were compared with patients who had stable disease (SD) or partial remission (PR). Second, patients with PR were compared with patients with either SD or PD.
The prognostic value of the pretherapeutic marker levels concerning PFS and OS was evaluated using Kaplan-Meier and Cox proportional hazard models. The effects of the covariates were reported as Hazard ratio. In addition to the pretherapeutic marker levels, the following covariates were taken into account: gender, smoking status, stage, histology, study arm, study drug, ECOG at study entry and prior therapies. Statistical evaluations were done using the R-software package version 4.2.2 (https://www.r-project.org/).
3Results
3.1Patients characteristics
In total, the biomarker study included 261 patients with a median age of 63 years (range 40 to 77 years of age). The majority of the study population had a history of smoking, either current or former (N = 233; 89%), and was diagnosed with stage IV cancer (N = 221; 85%) upon entry into the study. Two hundred and one study participants presented with non-squamous adenocarcinomas, whereas 60 with squamous cell carcinomas. All patients were treated with a combination of paclitaxel and either carboplatin (N = 217) or cisplatin (N = 44) in a standard body surface area (BSA)- or a pharmacokinetic (PK)-guided dosing scheme. The characteristics of the cohort are summarized in Table 1.
Table 1
Baseline characteristics of patients with advanced-stage NSCLC
| Characteristic | Patients (n = 261) |
| Age, years | |
| <65 | 141 |
| ≥65 | 120 |
| Min: Max | 40: 77 |
| Median | 63 |
| Gender | |
| Female | 92 |
| Male | 169 |
| Smoking status | |
| Current smoker | 97 |
| Former smoker | 136 |
| Never smoked | 28 |
| Stage at study entry | |
| IIIB | 40 |
| IV | 221 |
| Tumor histology | |
| Non-squamous adenocarcinoma | 201 |
| Squamous cell carcinoma | 60 |
| ECOG at study entry | |
| 0 | 135 |
| 1 | 94 |
| 2 | 10 |
| NA | 22 |
| Study arm | |
| BSA | 130 |
| PK | 131 |
| Study drug | |
| Carboplatin | 217 |
| Cisplatin | 44 |
| Prior adj. chemotherapy | |
| Yes | 26 |
| No | 235 |
| Response at staging before cycle 3 | |
| Partial remission (PR) | 88 |
| Stable disease (SD) | 99 |
| Progressive disease (PD) | 58 |
| Lost to follow up | 16 |
| Response at the end of therapy | |
| Partial remission (PR) | 104 |
| Stable disease (SD) | 83 |
| Progressive disease (PD) | 58 |
| Lost to follow up | 16 |
For the evaluation of response to therapy, 2 out of 261 patients were excluded as they died within the first week of therapy, and 14 due to missing response data, leaving 245 for the statistical analysis. Response to therapy was assessed at staging after the end of the second treatment cycle, before the third treatment cycle started, and at the end of the treatment. At staging, 88 patients achieved partial remission (PR), 99 stable disease (SD) and 58 had progressive disease (PD) in radiological CT exams. In the first evaluation, non-responders were defined PD patients (N = 58) and compared with PR and SD patients as responders (N = 187). In the second evaluation, non-responders were defined PD+SD patients (N = 157) and compared with PR as responders (N = 88; Table 1).
3.2Distribution of tumor markers over response groups
The distribution of most tumor markers before start of systemic treatment (C1) were greatly overlapping between patients with response (SD+PR) and non-response (PD) as depicted in the density plots (Fig. 1) and in Table 2. This applies to the established lung tumor markers CYFRA 21-1, CEA, SCC, NSE and ProGRP. It also extends to adenocellular cancer markers CA 125, CA 15-3 and HE4, which showed slightly higher values for non-responding patients but were unable to discriminate between response groups. At first radiological staging prior to cycle 3 (C3), responders presented with significantly lower concentrations for CYFRA 21-1 as compared with non-responders. The same tendency was observed for SCC, NSE, CA 125 and HE-4, however not for the remaining tumor markers CEA, CA 15-3, and ProGRP. In consequence, the relative change between C1 and C3 showed more pronounced decreases for CYFRA 21-1, SCC, NSE, and CA 125 in responders compared to non-responders, but not for the other tumor markers (Fig. 1, Table 2).
Fig. 1
Distribution of tumor marker levels in responding (SD+PR; red) and non-responding (PD; green) patients before the start of the therapy cycle 1 (C1), at staging before cycle 3 (C3), and shown as relative changes from C1 to C3.
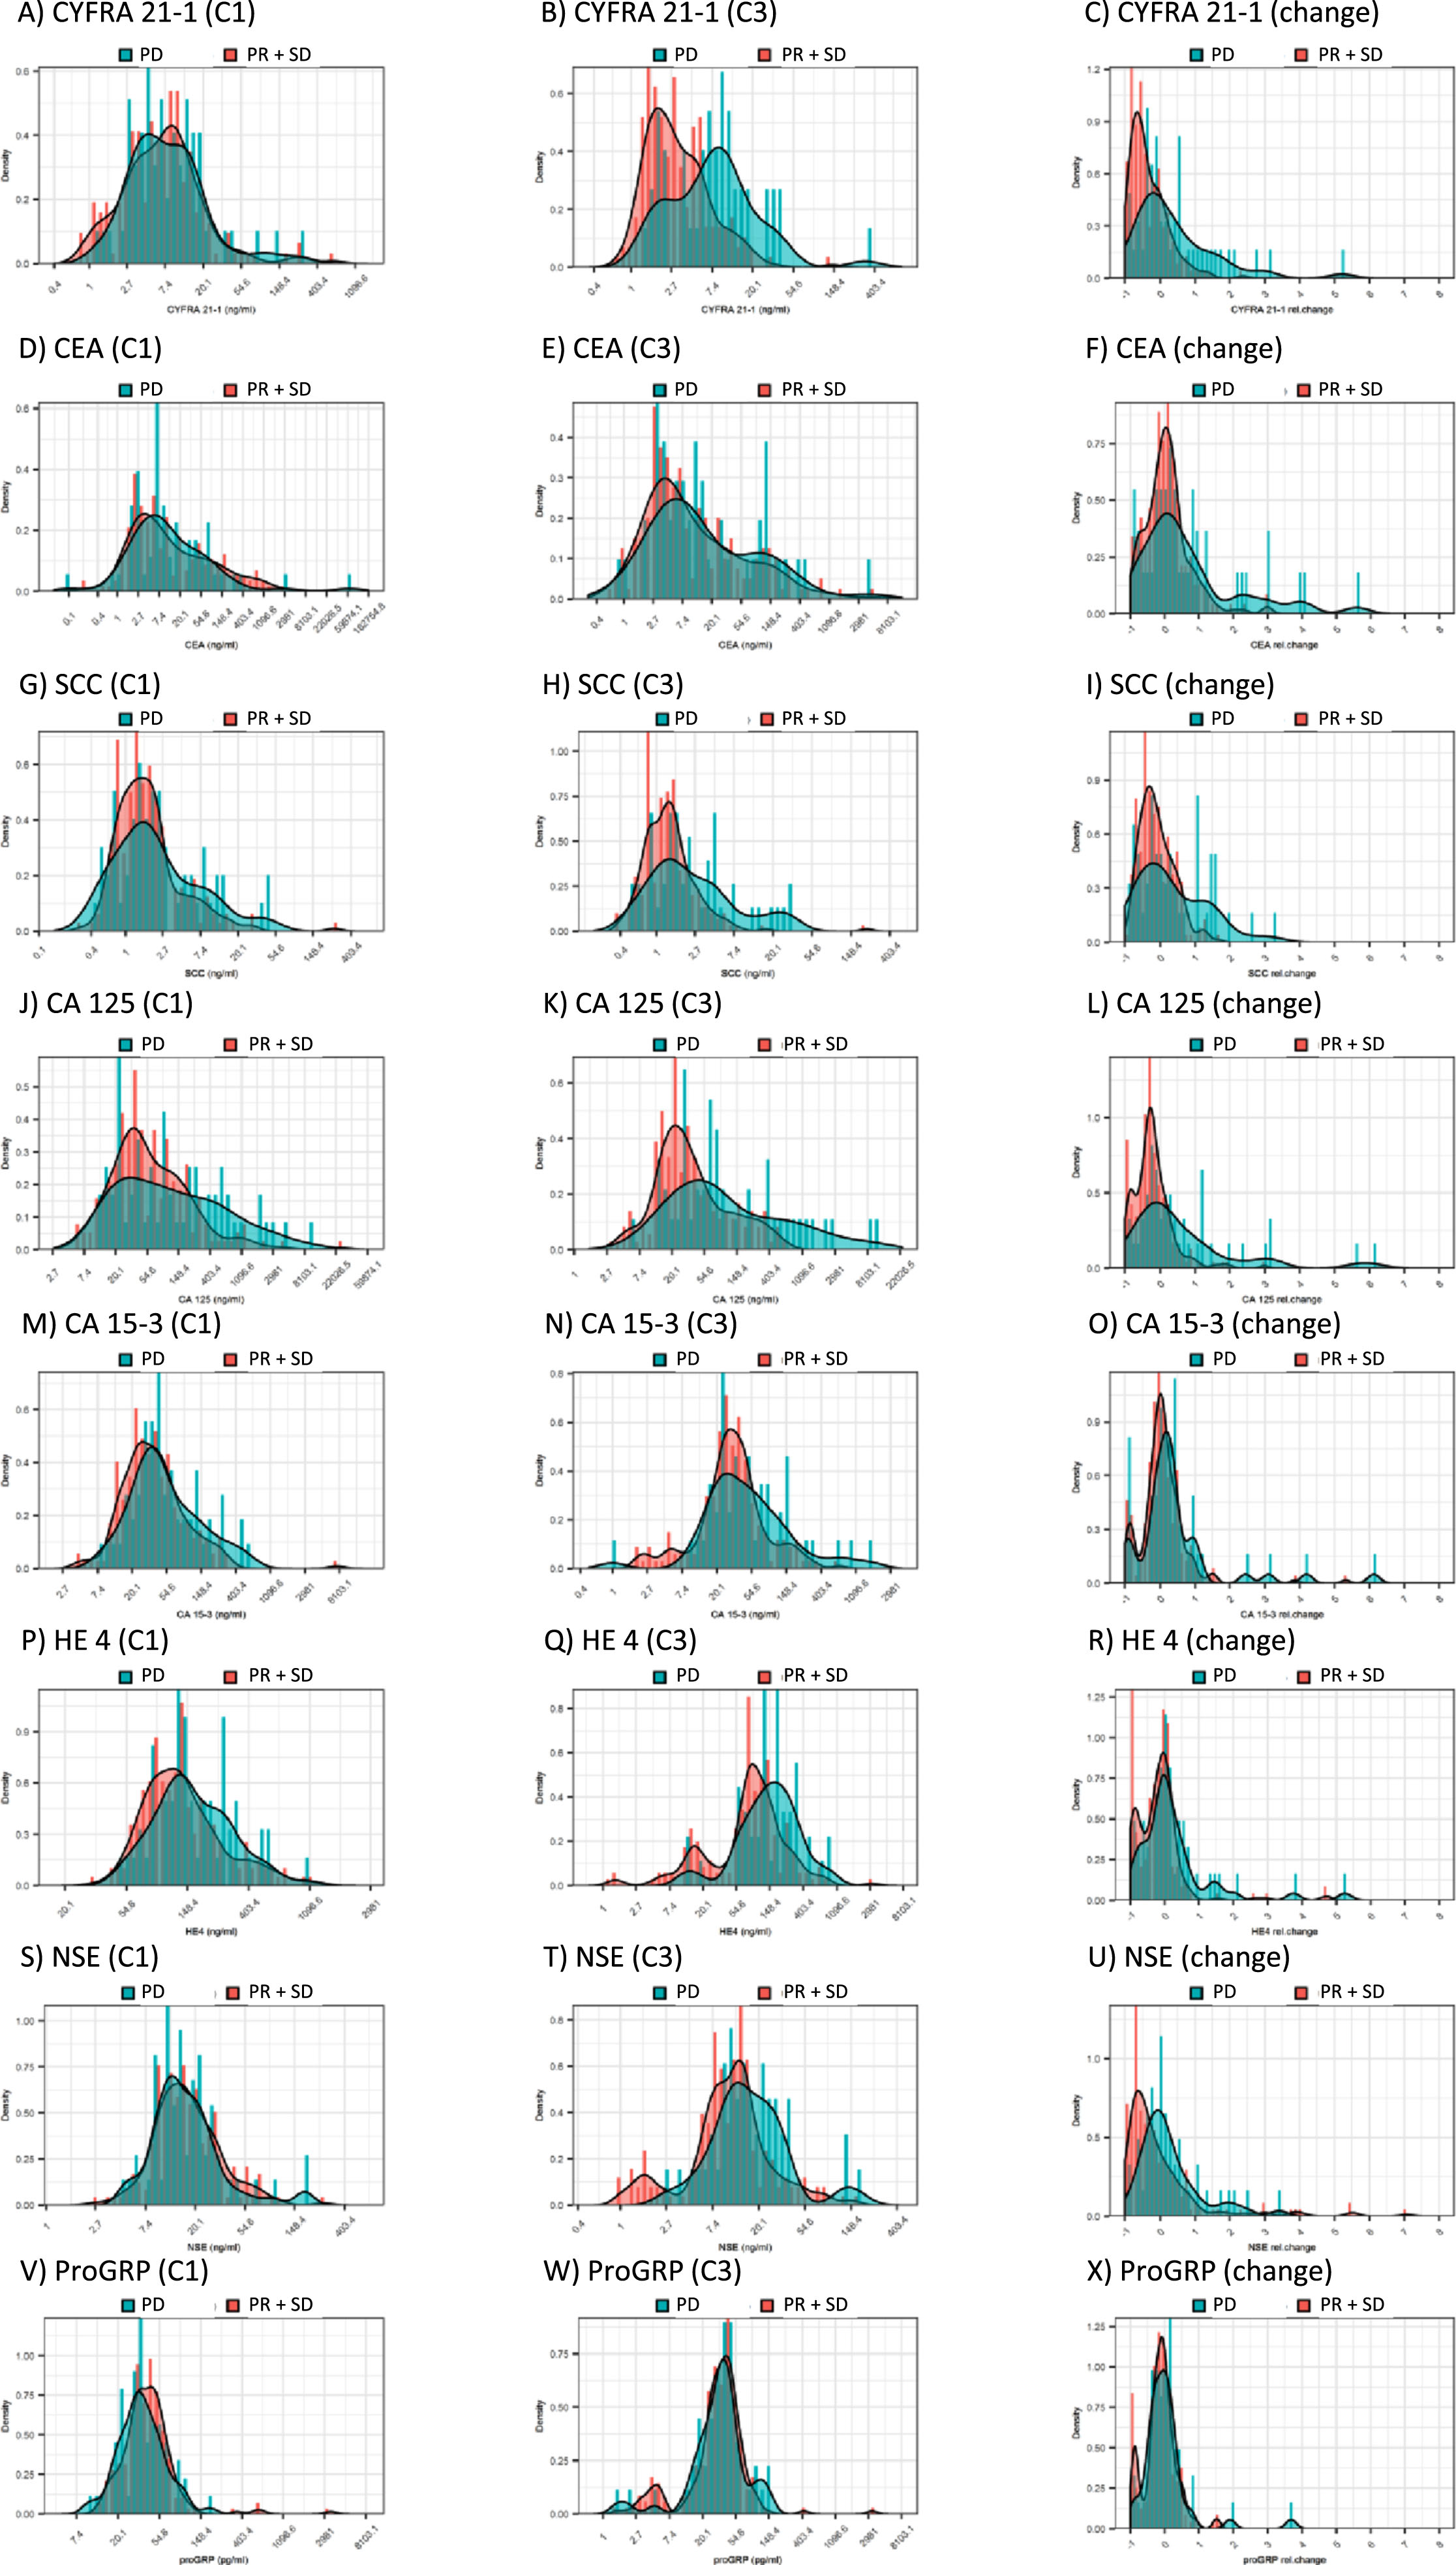
Table 2
Distribution of tumor marker values in various response groups
| CEA_C1 | CYFRA_C1 | NSE_C1 | ProGRP_C1 | SCC_C1 | CA15.3_C1 | CA125_C1 | HE4_C1 | CEA_C3 | CYFRA_C3 | NSE_C3 | ProGRP_C3 | SCC_C3 | CA15.3_C3 | CA125_C3 | HE4_C3 | CEA_d13 | CYFRA_d13 | NSE_d13 | ProGRP_d13 | SCC_d13 | CA15.3_d13 | CA125_d13 | HE4_d13 | ||
| ng/ml | ng/ml | ng/ml | pg/ml | ng/ml | U/ml | U/ml | pmol/l | ng/ml | ng/ml | ng/ml | pg/ml | ng/ml | U/ml | U/ml | pmol/l | dec % | dec % | dec % | dec % | dec % | dec % | dec % | dec % | ||
| PR | N | 88.0 | 88.0 | 88.0 | 88.0 | 88.0 | 88.0 | 88.0 | 88.0 | 87.0 | 87.0 | 87.0 | 87.0 | 87.0 | 87.0 | 87.0 | 87.0 | 87.0 | 87.0 | 87.0 | 87.0 | 87.0 | 87.0 | 87.0 | 87.0 |
| Min | 0.2 | 0.8 | 2.6 | 13.4 | 0.3 | 4.4 | 5.7 | 33.5 | 0.6 | 0.7 | 1.0 | 2.9 | 0.4 | 2.1 | 4.1 | 1.3 | -93.7 | -98.3 | -94.1 | -93.0 | -96.7 | -96.6 | -96.8 | -98.7 | |
| Q1 | 2.7 | 3.5 | 11.4 | 30.2 | 1.0 | 21.1 | 25.9 | 79.1 | 3.0 | 1.6 | 6.6 | 22.4 | 0.9 | 18.9 | 17.5 | 41.3 | -30.7 | -79.4 | -70.3 | -37.8 | -48.8 | -27.8 | -53.0 | -77.9 | |
| Med | 6.2 | 7.2 | 16.3 | 43.5 | 1.8 | 30.6 | 42.6 | 111.8 | 5.6 | 2.1 | 9.3 | 33.4 | 1.3 | 26.5 | 24.7 | 83.0 | 0.0 | -57.5 | -49.2 | -17.2 | -22.2 | -1.2 | -26.7 | -12.2 | |
| Q3 | 24.5 | 12.0 | 23.5 | 53.0 | 2.6 | 48.9 | 107.1 | 157.1 | 21.3 | 4.0 | 13.8 | 45.5 | 1.8 | 42.1 | 44.3 | 127.6 | 32.1 | -26.4 | -11.4 | -0.5 | 2.2 | 18.0 | -6.9 | 6.7 | |
| Max | 1672.0 | 281.1 | 262.6 | 3459.0 | 18.1 | 347.1 | 1265.0 | 1149.0 | 1559.0 | 33.1 | 162.6 | 3328.0 | 5.2 | 688.6 | 333.7 | 3132.0 | 2181.3 | 237.9 | 550.0 | 155.8 | 166.7 | 387.4 | 299.0 | 473.0 | |
| SD | N | 99.0 | 99.0 | 99.0 | 99.0 | 99.0 | 99.0 | 99.0 | 99.0 | 96.0 | 96.0 | 96.0 | 96.0 | 96.0 | 96.0 | 96.0 | 96.0 | 96.0 | 96.0 | 96.0 | 96.0 | 96.0 | 96.0 | 96.0 | 96.0 |
| Min | 0.6 | 1.0 | 3.6 | 11.9 | 0.5 | 4.2 | 8.1 | 47.3 | 0.9 | 1.0 | 1.0 | 1.5 | 0.4 | 2.1 | 3.1 | 1.5 | -99.1 | -99.6 | -94.0 | -91.1 | -79.2 | -98.9 | -98.7 | -98.6 | |
| Q1 | 3.2 | 3.4 | 10.3 | 28.3 | 1.0 | 21.2 | 27.7 | 93.9 | 3.6 | 2.1 | 7.7 | 25.0 | 0.9 | 22.4 | 16.9 | 52.7 | -32.5 | -62.5 | -60.7 | -29.1 | -37.6 | -14.6 | -49.6 | -54.4 | |
| Med | 10.7 | 6.5 | 15.9 | 37.2 | 1.5 | 38.3 | 61.1 | 137.1 | 8.9 | 3.2 | 12.9 | 35.4 | 1.4 | 35.8 | 34.8 | 94.3 | 5.9 | -33.6 | -19.6 | -4.0 | -8.1 | 7.5 | -23.2 | -22.0 | |
| Q3 | 83.0 | 11.3 | 27.0 | 54.4 | 2.4 | 65.2 | 153.3 | 203.7 | 36.1 | 5.6 | 18.4 | 48.5 | 1.9 | 56.6 | 116.9 | 152.9 | 35.5 | 6.8 | 35.2 | 17.0 | 29.1 | 41.1 | 10.8 | 8.9 | |
| Max | 2992.0 | 618.9 | 109.5 | 573.5 | 257.9 | 7520.0 | 24710.0 | 721.4 | 5275.0 | 141.7 | 134.0 | 143.2 | 224.0 | 285.3 | 672.4 | 795.2 | 905.7 | 143.0 | 707.6 | 150.8 | 125.0 | 1812.8 | 4157.8 | 471.0 | |
| PR+SD | N | 187.0 | 187.0 | 187.0 | 187.0 | 187.0 | 187.0 | 187.0 | 187.0 | 183.0 | 183.0 | 183.0 | 183.0 | 183.0 | 183.0 | 183.0 | 183.0 | 183.0 | 183.0 | 183.0 | 183.0 | 183.0 | 183.0 | 183.0 | 183.0 |
| Min | 0.2 | 0.8 | 2.6 | 11.9 | 0.3 | 4.2 | 5.7 | 33.5 | 0.6 | 0.7 | 1.0 | 1.5 | 0.4 | 2.1 | 3.1 | 1.3 | -99.1 | -99.6 | -94.1 | -93.0 | -96.7 | -98.9 | -98.7 | -98.7 | |
| Q1 | 3.0 | 3.4 | 11.2 | 29.1 | 1.0 | 21.2 | 26.3 | 87.8 | 3.2 | 1.8 | 7.1 | 24.5 | 0.9 | 19.5 | 17.1 | 51.6 | -31.9 | -73.3 | -67.5 | -33.5 | -42.2 | -22.8 | -52.1 | -66.9 | |
| Med | 7.2 | 6.9 | 15.9 | 39.8 | 1.6 | 34.6 | 45.1 | 123.0 | 7.2 | 2.8 | 11.3 | 34.4 | 1.3 | 31.1 | 29.4 | 85.2 | 0.0 | -48.2 | -35.5 | -9.6 | -17.2 | 3.0 | -25.6 | -17.3 | |
| Q3 | 49.0 | 11.5 | 25.3 | 53.3 | 2.5 | 59.7 | 126.0 | 192.8 | 28.6 | 5.2 | 15.8 | 47.4 | 1.8 | 48.6 | 63.3 | 144.6 | 34.0 | -2.9 | 17.6 | 10.7 | 22.2 | 30.5 | 2.9 | 8.2 | |
| Max | 2992.0 | 618.9 | 262.6 | 3459.0 | 257.9 | 7520.0 | 24710.0 | 1149.0 | 5275.0 | 141.7 | 162.6 | 3328.0 | 224.0 | 688.6 | 672.4 | 3132.0 | 2181.3 | 237.9 | 707.6 | 155.8 | 166.7 | 1812.8 | 4157.8 | 473.0 | |
| PD | N | 58.0 | 58.0 | 58.0 | 58.0 | 58.0 | 58.0 | 58.0 | 58.0 | 47.0 | 47.0 | 47.0 | 47.0 | 47.0 | 47.0 | 47.0 | 47.0 | 47.0 | 47.0 | 47.0 | 47.0 | 47.0 | 47.0 | 47.0 | 47.0 |
| Min | 0.1 | 1.2 | 4.6 | 9.7 | 0.4 | 8.2 | 10.7 | 50.9 | 0.8 | 1.3 | 2.6 | 1.5 | 0.5 | 1.0 | 6.2 | 11.8 | -93.9 | -95.0 | -97.4 | -93.5 | -87.6 | -97.6 | -98.7 | -94.0 | |
| Q1 | 3.0 | 3.8 | 11.1 | 26.8 | 1.1 | 27.5 | 28.5 | 114.9 | 4.0 | 3.4 | 10.1 | 23.2 | 1.3 | 22.7 | 28.6 | 91.2 | -9.7 | -33.9 | -28.9 | -32.8 | -33.9 | -6.4 | -30.8 | -21.7 | |
| Med | 7.6 | 6.7 | 14.5 | 34.5 | 1.9 | 41.1 | 89.1 | 143.7 | 10.0 | 7.6 | 14.5 | 35.9 | 2.0 | 42.0 | 68.2 | 163.7 | 32.1 | 3.1 | 4.0 | -4.5 | 14.3 | 20.5 | 12.6 | -0.2 | |
| Q3 | 35.4 | 13.1 | 21.2 | 49.8 | 4.9 | 100.4 | 406.6 | 259.4 | 68.8 | 12.7 | 25.4 | 47.5 | 4.3 | 78.4 | 369.3 | 267.7 | 216.8 | 84.9 | 55.2 | 16.6 | 104.0 | 49.3 | 108.2 | 43.5 | |
| Max | 64050.0 | 257.8 | 181.5 | 184.0 | 42.7 | 548.8 | 9787.0 | 1039.0 | 4223.0 | 319.5 | 181.1 | 141.2 | 31.1 | 1678.0 | 9465.0 | 901.7 | 4078.9 | 521.2 | 341.5 | 368.6 | 327.3 | 612.9 | 609.7 | 525.0 |
Number (N), Minimum (Min), Quartiles (Q1, Q3), Median (Med), Maximum (Max) levels of tumor markers at baseline before start of chemotherapy (C1), at time of radiological staging exams after 2 rounds of therapy (C3, before cycle 3), and percentage decreases from cycle 1 to 3 (d13, decreases are positive numbers) for patients with partial remission (PR), stable disease (SD), the combined group of responders (PR+SD) and progressive disease (PD) at staging.
If the focus was set on the detection of patients with PR as responders who were compared with SD and PD patients as non-responders, similar results were obtained, as listed in Table 2.
3.3Discrimination between response groups
Beyond the calculation of significance, the power of discrimination between patients with response (PR+SD) and non-response (PD) was demonstrated by receiver operating characteristic (ROC) curves giving a sensitivity-specificity profile for detection of non-response for the whole spectrum of possible decision thresholds. The area under the curve (AUC) of the ROC curves ranged for all tumor markers at C1 below 0.6 illustrating the poor power of discrimination. When all markers were combined, the AUC value increased only slightly to 0.624 (Fig. 2, Table 3).
Fig. 2
Receiver operating characteristic (ROC) curves for the discrimination between patients with response (SD+PR) and non-response (PD) by tumor markers before the start of the therapy cycle 1 (C1) and the combined value at baseline, at time of radiological staging and the percentage decreases (C1, C3, d13).
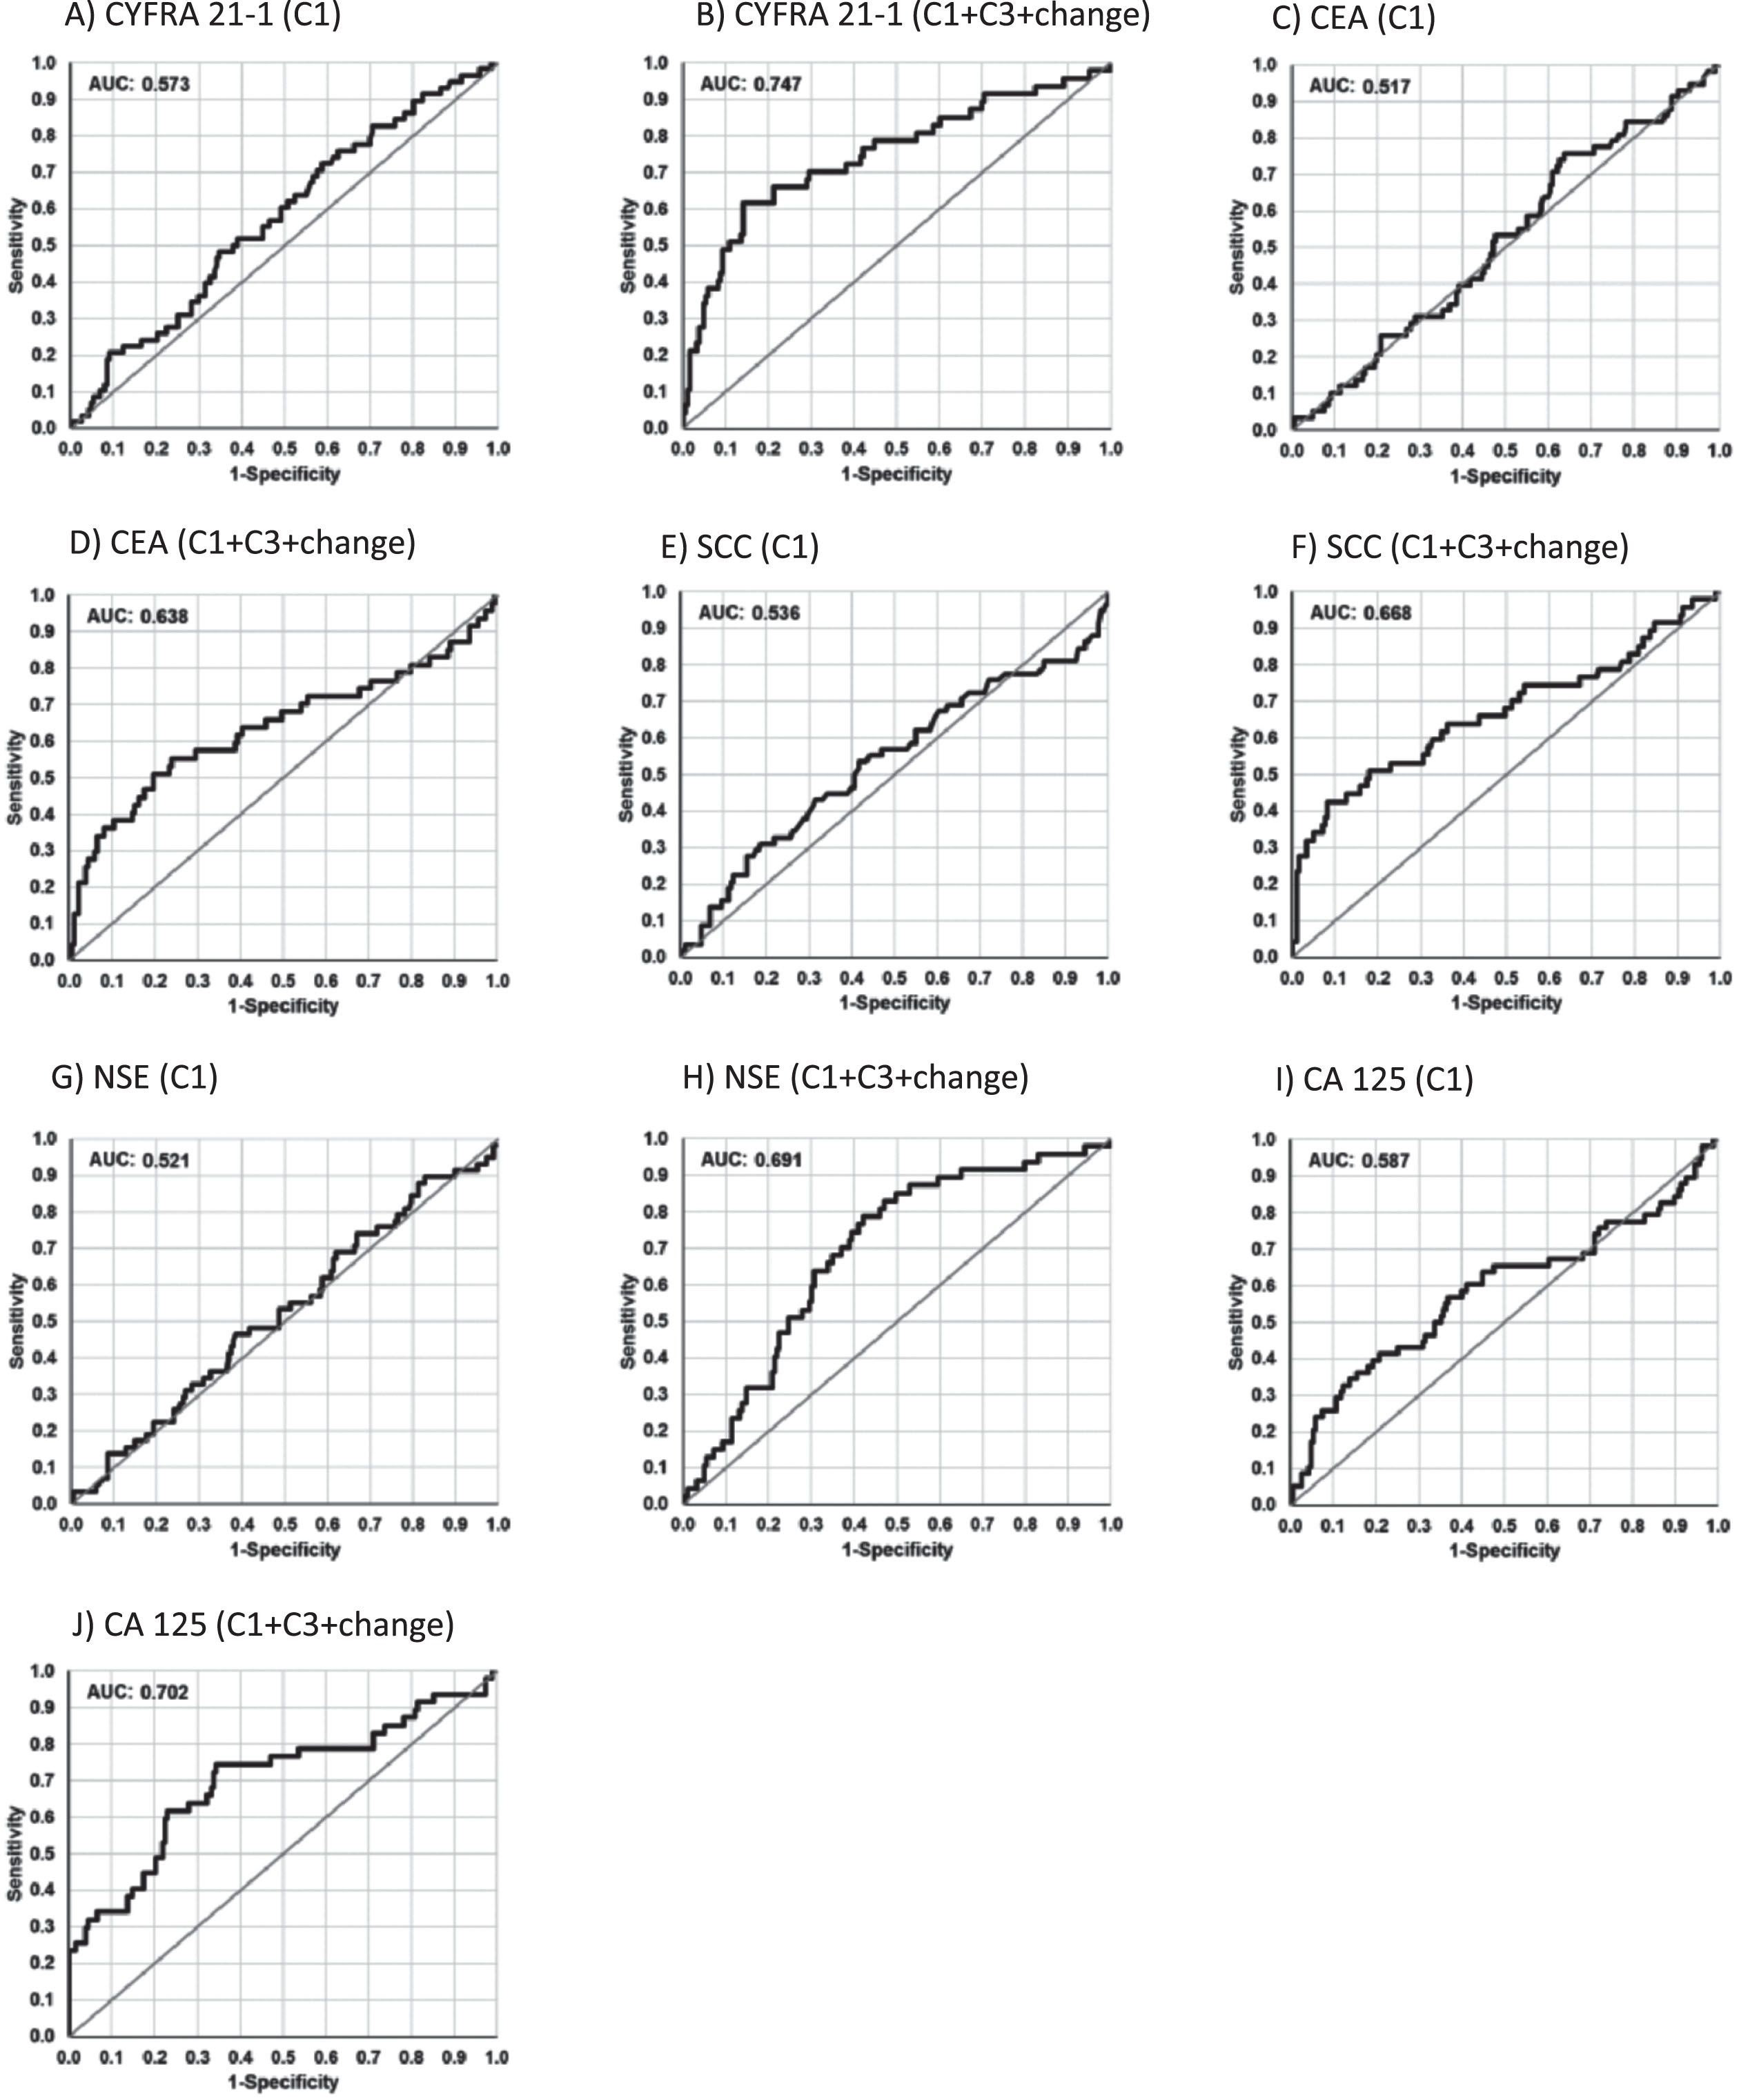
Table 3
Discrimination of response groups by tumor markers
| CEA | CYFRA | NSE | ProGRP | SCC | CA15.3 | CA125 | HE4 | Combination | |
| PR+SD vs PD | |||||||||
| C1 | 0.517 | 0.573 | 0.521 | 0.563 | 0.536 | 0.570 | 0.587 | 0.563 | |
| C1, C3, d13 | 0.638 | 0.747 | 0.691 | 0.518 | 0.668 | 0.583 | 0.702 | 0.634 | 0.906 |
| PR vs SD+PD | |||||||||
| C1 | 0.569 | 0.558 | 0.511 | 0.558 | 0.552 | 0.581 | 0.588 | 0.612 | |
| C1, C3, d13 | 0.600 | 0.718 | 0.630 | 0.542 | 0.585 | 0.590 | 0.670 | 0.622 | 0.862 |
Areas under the curves (AUC) of receiver operating characteristic (ROC) curves for the detection of progressive disease (PR+SD vs PD) and the detection of remission (PR vs SD+PD) by single tumor markers and marker combinations at baseline before start of chemotherapy (C1), and the combined value at baseline, at time of radiological staging and the percentage decreases (C1, C3, d13).
Combining the tumor marker values at C1, C3 and the relative change between C1 and C3 in a logistic regression analysis resulted in significantly improved AUCs for CYFRA 21–1 (0.747), CA 125 (0.702), and NSE (0.691). AUCs for SCC reached 0.668, 0.638 for CEA, and 0.634 for HE4. At 90% specificity, sensitivity for detecting non-response were 49% for CYFRA 21-1, 43% for SCC, 39% for CEA, and 35% for CA 125 (Fig. 2, Table 3). In a logistic regression analysis combining all relevant markers, AUC in the calibration set was increased to 0.906, with a sensitivity of 68% at a specificity of 90% or, at the optimized cut-off, with a sensitivity of 83% at a specificity of 83%. If the focus was shifted towards the detection of patients with PR as responders, CYFRA 21-1 and additionally CA 125 showed best discrimination, however, with slightly lower AUCs (Table 3).
3.4Prognostic relevance for PFS
For the evaluation of prognosis, only patients who were not progressive (for PFS) or survived (for OS) at least 28 days after start of chemotherapy were considered. With 20 early progressive patients dropping out, 241 remained for the statistical analysis of PFS. Using Kaplan-Meier curves and Cox proportional hazard models for clinical variables, better survival was seen in stage IIIB than IV, in squamous-cell than in adeno-cell carcinoma histology, in cisplatin- than in carboplatin-treated patients, as well as in never smokers when compared with former and current smokers for PFS and OS. Gender and age had no prognostic relevance. In order to test several thresholds for all markers in a systematic way, Kaplan-Meier curves were established with cut-offs separating four evenly distributed groups for each marker. The first and the fourth quartiles were used for comparisons in form of Hazard ratios (HR).
For pretherapeutic STM at C1, prognostic relevance for PFS was observed for CA 15-3 and CA 125. For both markers, lower baseline values were associated with significantly longer PFS interval compared to higher values. Specifically, there were hazard ratios of 1.34 (CI 1.17-1.54) for CA 15-3 and 1.22 (CI 1.09-1.36) for CA 125. All the other pretherapeutic tumor markers, including CYFRA 21-1, CEA and SCC, were exhibited no significant prognostic value (Fig. 3, Table 4).
Fig. 3
Kaplan-Meier curves of tumor marker levels before start of the therapy cycle 1 (C1) and at staging before cycle 3 (C3), indicating the prognostic relevance for progression-free survival (PFS).
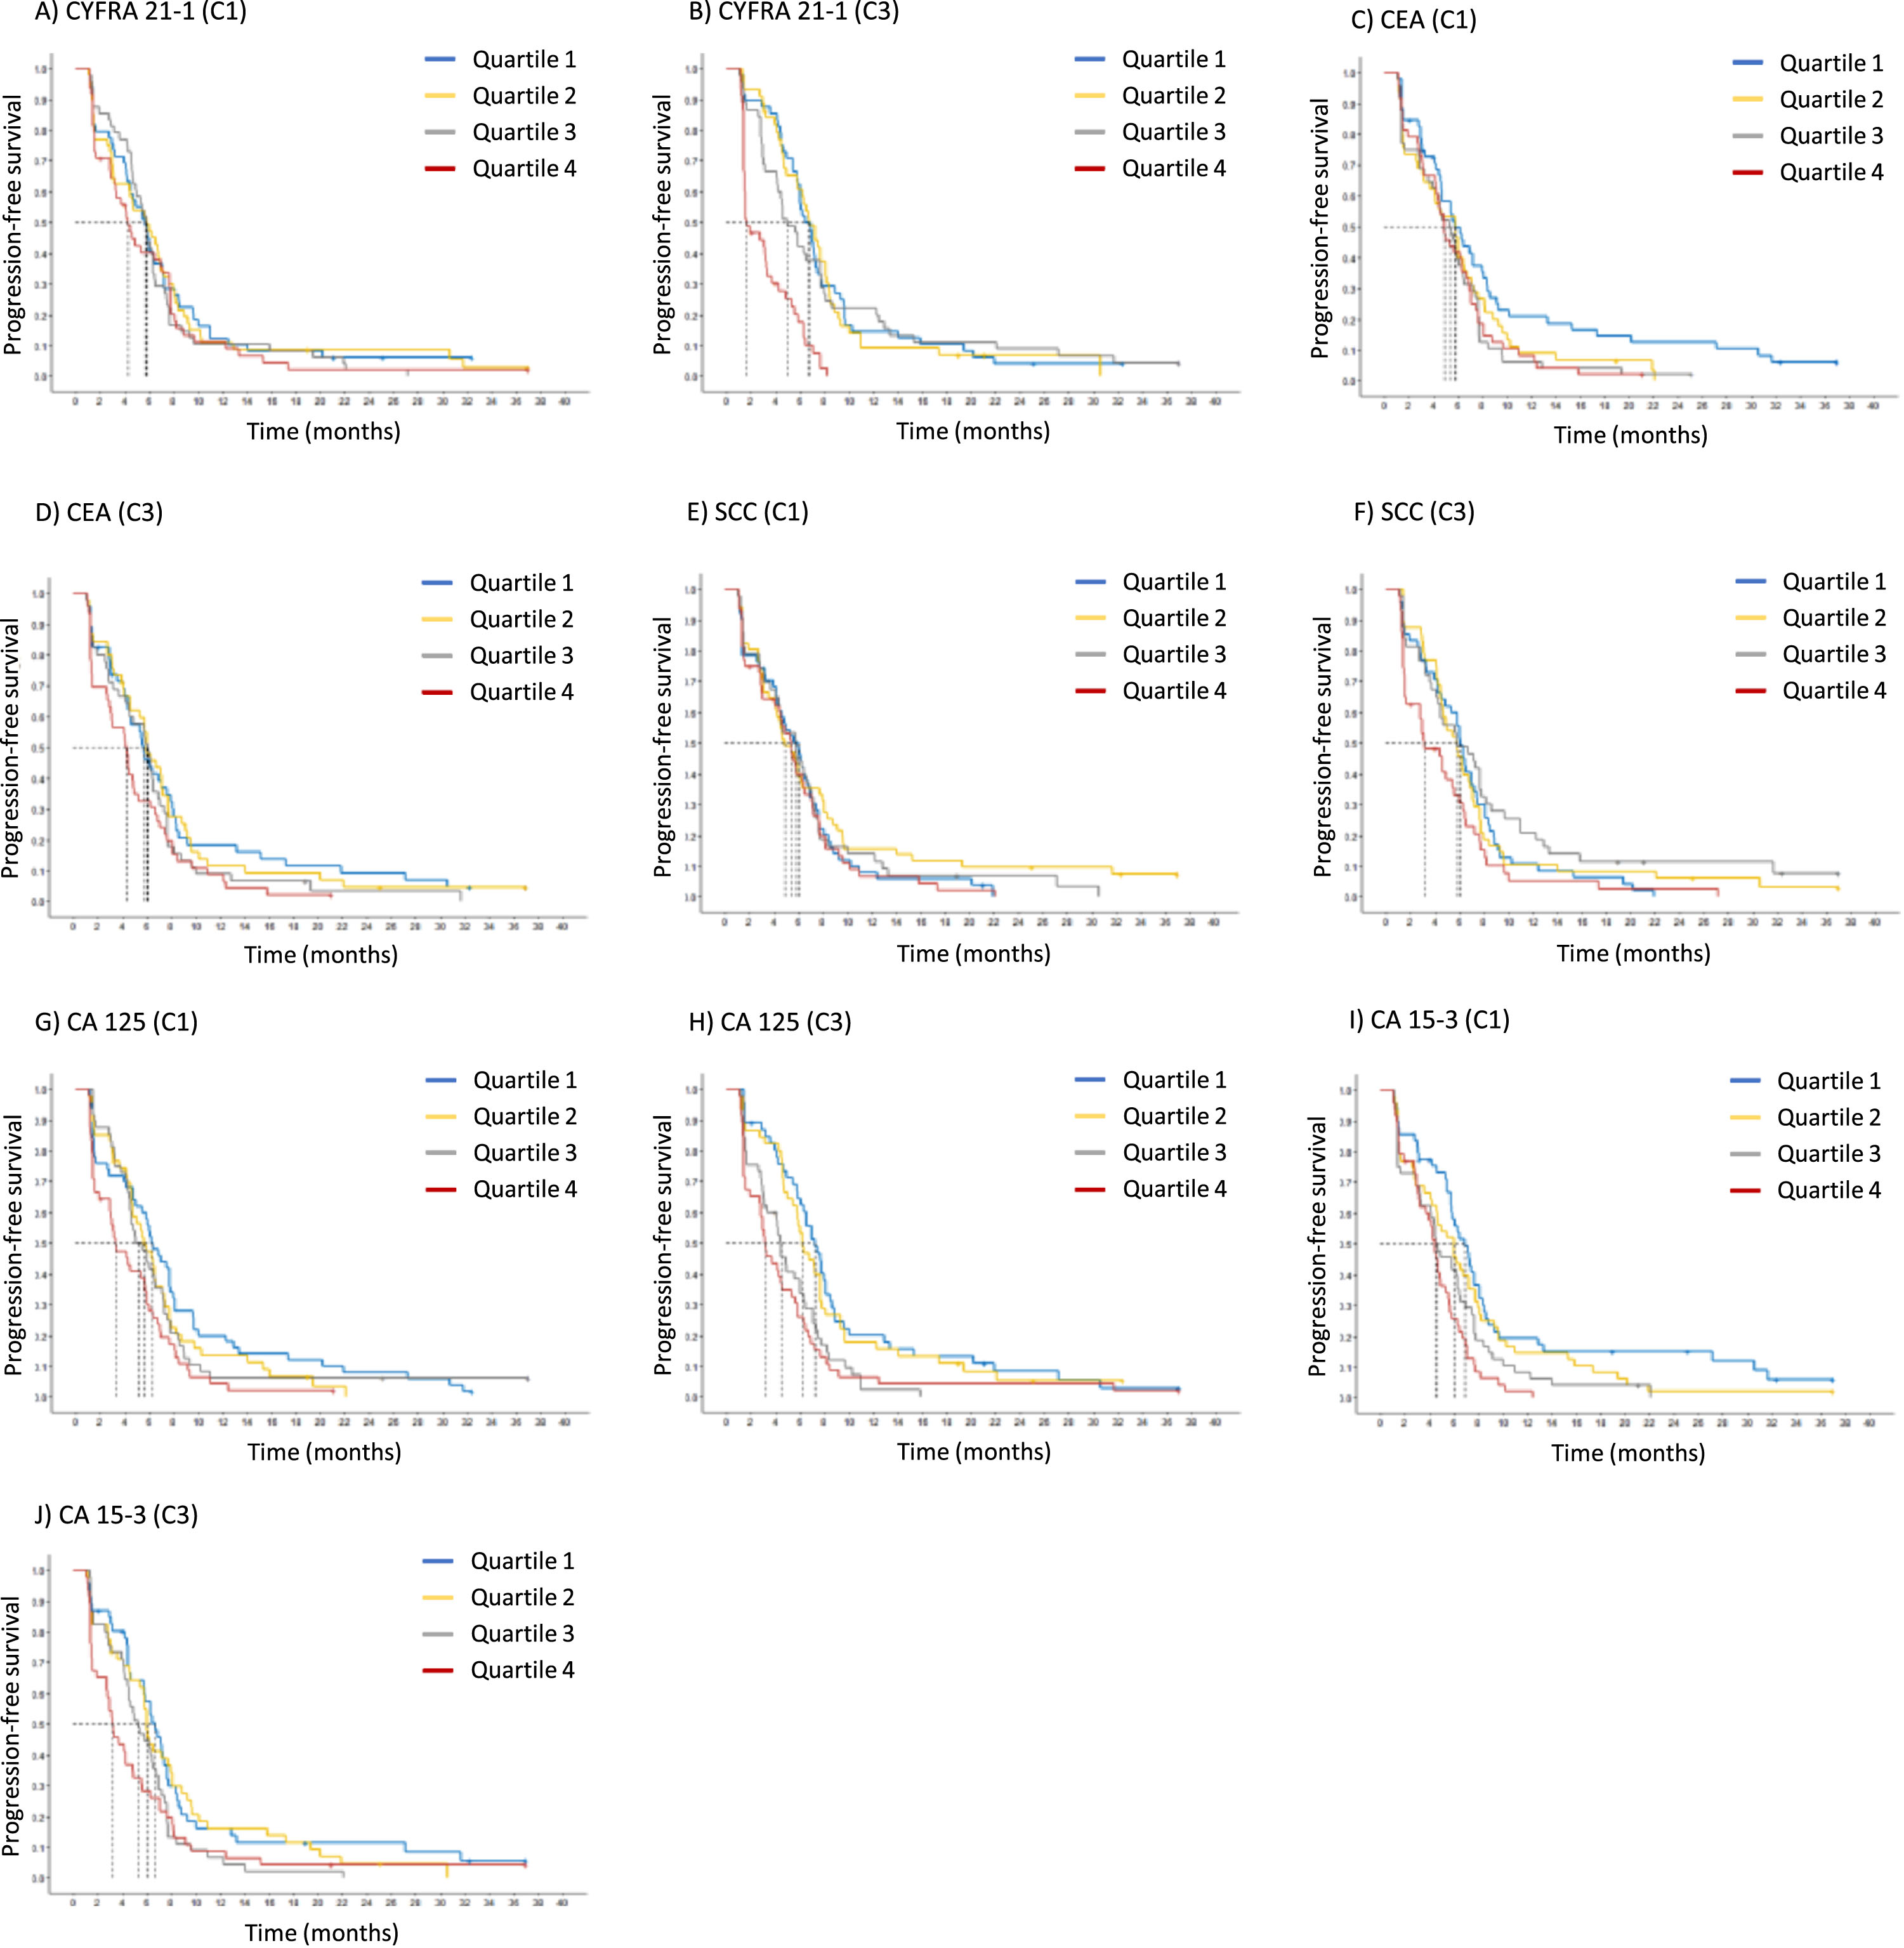
Table 4
Relevance of tumor markers for progression-free survival (PFS)
| Marker | Hazard ratio | Low Conc. | Median PFS | High Conc. | Median PFS |
| (95% CI) | [month] | [month] | |||
| Pretherapeutic (C1) | |||||
| CEA | 1.07 (0.99-1.16) | 2.00 ng/ml | 5.8 (4.9-6.9) | 164.76 ng/ml | 4.7 (4.2-5.8) |
| CYFRA 21-1 | 1.07 (0.94-1.22) | 2.32 ng/ml | 5.7 (4.7-6.5) | 19.78 ng/ml | 5.3 (4.5-6.1) |
| NSE | 1.20 (0.96-1.50) | 8.92 ng/ml | 5.8 (4.9-6.7) | 39.24 ng/ml | 4.7 (4.3-6.0) |
| ProGRP | 0.84 (0.64-1.08) | 20.12 pg/ml | 4.9 (4.4-6.0) | 69.90 pg/ml | 5.8 (4.8-6.7) |
| SCC | 1.11 (0.93-1.31) | 0.70 ng/ml | 5.8 (4.7-6.7) | 6.48 ng/ml | 4.9 (4.3-6.1) |
| CA 15-3 | 1.34 (1.17-1.54) | 13.80 ng/ml | 6.4 (5.8-7.5) | 134.22 ng/ml | 4.4 (3.6-5.3) |
| CA 125 | 1.22 (1.09-1.36) | 15.92 ng/ml | 6.3 (5.7-7.4) | 526.14 ng/ml | 4.3 (3.2-5.3) |
| HE4 | 1.20 (0.79-1.27) | 67.44 ng/ml | 5.5 (4.6-6.3) | 316.90 ng/ml | 5.4 (4.5-6.4) |
| Staging (C3) | |||||
| CEA | 1.14 (1.04-1.25) | 2.24 ng/ml | 6.3 (5.6-7.4) | 144.42 ng/ml | 4.4 (3.3-5.7) |
| CYFRA 21-1 | 1.66 (1.39-1.99) | 1.50 ng/ml | 7.2 (6.3-8.0) | 13.22 ng/ml | 3.6 (2.9-4.5) |
| NSE | 1.05 (0.90-1.23) | 3.06 ng/ml | 5.8 (4.6-6.9) | 32.32 ng/ml | 5.4 (4.4-6.3) |
| ProGRP | 1.16 (0.98-1.36) | 8.22 pg/ml | 6.3 (5.3-7.7) | 67.46 pg/ml | 4.9 (4.4-6.1) |
| SCC | 1.34 (1.09-1.66) | 0.70 ng/ml | 6.3 (5.6-7.4) | 4.08 ng/ml | 4.5 (4.1-5.8) |
| CA 15-3 | 1.29 (1.10-1.52) | 9.82 ng/ml | 6.5 (5.8-7.7) | 1333.3 ng/ml | 4.4 (3.2-5.6) |
| CA 125 | 1.35 (1.20-1.52) | 12.36 ng/ml | 6.7 (6.0-7.7) | 329.88 ng/ml | 3.3 (2.9-4.6) |
| HE4 | 1.06 (0.92-1.21) | 15.9 ng/ml | 5.8 (4.7-7.1) | 289.44 ng/ml | 5.3 (4.4-6.3) |
Harzard ratios for unfavourable progression-free survival (PFS) with 95% confidence interval (95% CI) and median PFS for each marker at two different levels at quartiles 1 and 4 (Q1, Q4) at baseline before start of chemotherapy (C1), and at time of radiological staging (3). Markers with significant effect are highlighted in red (p-value≤0.05) and orange (p-value>0.05 and≤0.1).
At time of first radiological staging exams at C3, the two adeno-cellular markers CA 15-3 and CA 125 remained significant with HRs of 1.29 (CI 1.10-1.52) and 1.35 (CI 1.20-1.52), respectively. In addition, CYFRA 21-1 proved to be a highly significant prognostic marker with an even higher HR of 1.66 (CI 1.39-1.99). Particularly very high CYFRA 21-1 values in the highest quartile Q4 were associated with a very short median PFS of 3.6 months, contrasting with 7.2 months in the lowest quartile Q1. Further prognostic markers at C3 were CEA and SCC with HRs of 1.14 (CI 1.04-1.25) and 1.34 (CI 1.09-1.66), respectively (Fig. 3, Table 4). When all relevant markers CYFRA 21-1, SCC, CA 125, CA 15-3 and CEA were combined with histology and medication in a Cox proportional hazard regression analysis, the independent prognostic value of the markers was maintained.
3.5Prognostic relevance for OS
Regarding the evaluation for OS, similar results were obtained as for PFS. After excluding 14 patients who deceased during the first 28 days of treatment, 247 remained for the statistical analysis of OS. Using Kaplan-Meier curves with quartiles for the evaluation of pretherapeutic markers, only CA 15-3 reached the level of prognostic significance with a HR of 1.27 (CI 1.11-1.44). The median survival was 12.2 months in Q1 with CA 15-3 values of 13.8 U/ml, compared to only 8.2 months in Q4 with CA 15-3 values of 140.6 U/ml.
At the time of staging at C3, several markers were prognostically significant again, including CYFRA 21-1 with a HR of 1.27 (CI 1.11-1.46), CA 15-3 with a HR of 1.26 (CI 1.07-1.48), and CA 125 with a HR of 1.16 (CI 1.03-1.31). In particular, CYFRA 21-1 values of 13.2 ng/ml (Q4), CA 15-3 values of 133 U/ml (Q4) and CA 125 values of 330 U/ml (Q4) were associated with a median OS of only 8.4, 8.4 and 8.5 months, respectively (Fig. 4, Table 5). When all relevant markers CYFRA 21-1, CA 125, CA 15-3 and SCC were combined with histology and medication in a Cox proportional hazard regression analysis, the independent prognostic value of the markers was maintained.
Fig. 4
Kaplan-Meier curves of tumor marker levels before the start of the therapy cycle 1 (C1) and at staging before cycle 3 (C3), indicating the prognostic relevance for overall survival (OS).
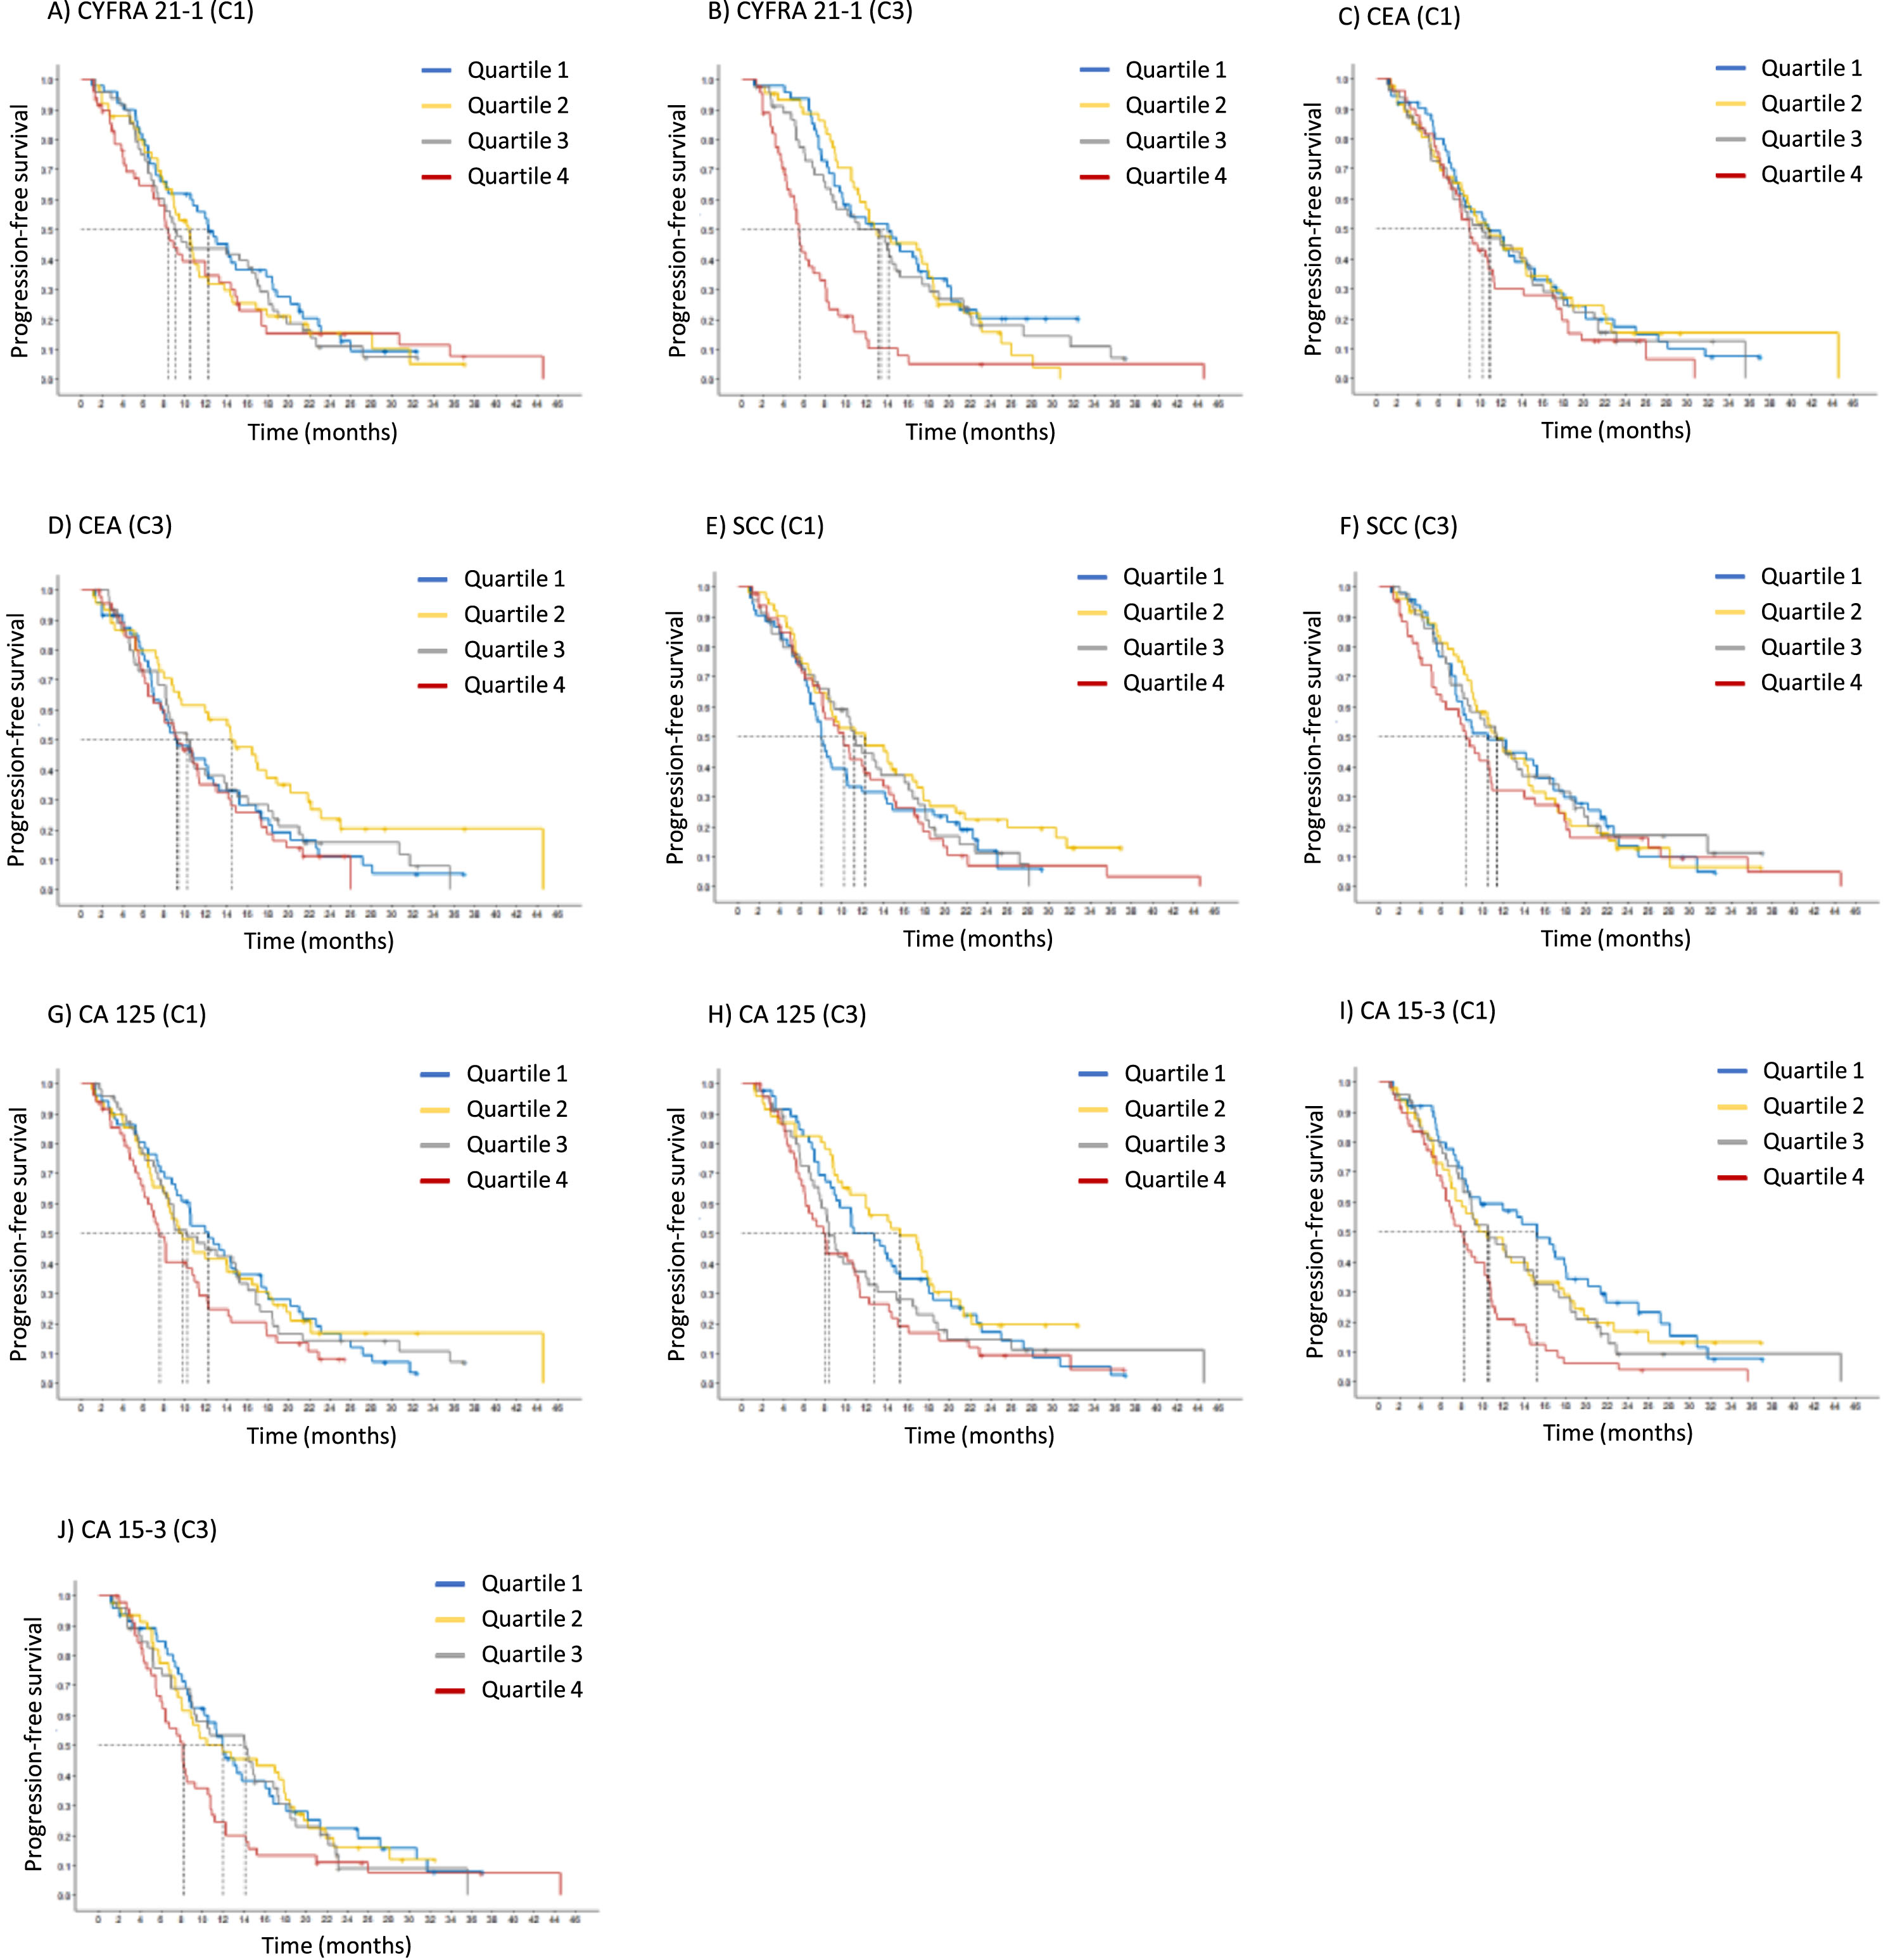
Table 5
Relevance of tumor markers for overall survival (OS)
| Marker | Hazard ratio | Low Conc. | Median OS | High Conc. | Median OS |
| (95% CI) | month] | [month] | |||
| Pretherapeutic (C1) | |||||
| CEA | 1.04 (0.95-1.13) | 2.00 ng/ml | 10.5 (8.8-14.1) | 161.88 ng/ml | 9.2 (8.1-12.2) |
| CYFRA 21-1 | 1.09 (0.95-1.25) | 2.36 ng/ml | 10.7 (8.9-14.2) | 19.74 ng/ml | 9.2 (8.1-12.0) |
| NSE | 0.99 (0.78-1.25) | 8.96 ng/ml | 10.2 (8.4-12.3) | 37.52 ng/ml | 10.2 (8.4-13.8) |
| ProGRP | 0.94 (0.73-1.21) | 20.16 pg/ml | 9.7 (8.2-12.3) | 69.90 pg/ml | 10.5 (8.7-13.4) |
| SCC | 1.07 (0.89-1.28) | 0.70 ng/ml | 10.5 (8.7-14.4) | 6.62 ng/ml | 9.2 (8.1-12.3) |
| CA 15-3 | 1.27 (1.11-1.44) | 13.80 ng/ml | 12.2 (10.4-16.1) | 140.58 ng/ml | 8.2 (7.3-10.2) |
| CA 125 | 1.10 (0.99-1.22) | 15.74 ng/ml | 11.2 (9.1-14.6) | 537.46 ng/ml | 8.7 (7.4-11.2) |
| HE4 | 1.00 (0.79-1.26) | 67.36 ng/ml | 10.2 (8.4-13.1) | 329.64 ng/ml | 10.2 (8.4-13.8) |
| Staging (C3) | |||||
| CEA | 1.06 (0.96-1.17) | 2.24 ng/ml | 11.2 (9.1-14.9) | 144.42 ng/ml | 9.2 (8.1-12.3) |
| CYFRA 21-1 | 1.27 (1.11-1.46) | 2.50 ng/ml | 12.2 (10.5-15.3) | 13.22 ng/ml | 8.4 (7.4-10.5) |
| NSE | 1.12 (0.94-1.32) | 3.06 ng/ml | 12.0 (9.2-16.1) | 32.32 ng/ml | 9.3 (8.2-12.2) |
| ProGRP | 1.15 (0.97-1.38) | 8.22 pg/ml | 12.2 (9.7-17.3) | 67.46 pg/ml | 9.5 (8.4-12.0) |
| SCC | 1.15 (0.93-1.42) | 0.70 ng/ml | 11.3 (9.2-14.9) | 4.08 ng/ml | 9.2 (8.1-12.2) |
| CA 15-3 | 1.26 (1.07-1.48) | 9.82 ng/ml | 13.4 (10.5-17.4) | 133.30 ng/ml | 8.4 (7.4-10.7) |
| CA 125 | 1.16 (1.03-1.31) | 12.36 ng/ml | 12.0 (10.2-15.3) | 329.88 ng/ml | 8.5 (7.4-10.8) |
| HE4 | 1.08 (0.94-1.25) | 15.90 ng/ml | 11.4 (9.1-16.5) | 289.44 ng/ml | 9.5 (8.2-12.2) |
Harzard ratios for unfavorable overall survival (OS) with 95% confidence interval (95% CI) and median PFS for each marker at two different levels at quartiles 1 and 4 (Q1, Q4) at baseline before start of chemotherapy (C1), and at time of radiological staging (3). Markers with significant effects are highlighted in red (p-value≤0.05) and orange (p-value>0.05 and≤0.1).
4Discussion
In the present study, the serum-based tumor markers (STM), CA 15-3 and CA 125 that were measured in NSCLC patients before the start of systemic platinum-based combination chemotherapy, and the levels of CYFRA 21-1, SCC, CA 125 and CA 15-3 that were assessed at the time of the first radiological staging, were informative for estimating therapy response. In addition, high levels of the same markers were prognostic for poor outcome (PFS and OS) and maintained their independent prognostic value when further clinical variables were added.
These findings are noteworthy as, in addition to the conventional lung-specific tumor markers like CYFRA 21-1 and SCC, previously not utilized markers, such as CA 15-3 and CA 125, have emerged as significant contributors to therapy response prediction and prognosis. One reason for this observation could be attributed to overrepresentation of adenocarcinomas in the trial resulting in an increased emphasis on adenocellular cancer markers, such as CA 125 and CA 15-3, in comparison to others, like CYFRA 21-1 and SCC that are more frequently released in squamous-cell cancer [10, 19].
It has to be emphasized that all patients underwent systemic platinum-based combination chemotherapy and that immune checkpoint inhibitors (ICI) were not used at the time of the CEPAC-TDM study. Other studies have already reported some prognostic value of CA 125 and CA 15-3, however, mainly in adenocarcinoma patients and also during TKI and ICI therapies [5, 18]. On the other hand, CYFRA 21-1 has been shown by many studies and structured reviews to be the major predictive and prognostic marker [11, 18–20]. High pretherapeutic levels often indicated unfavorable outcome and this informative value was further increased after one or two cycles of chemotherapy [11, 18, 21]. Some studies have also reported the prognostic relevance of CEA, NSE or HE4 in NSCLC patients [18, 20]. These markers showed moderate prognostic value in the present study. However, it is worth mentioning that the studies were quite heterogeneous in terms of different histologies, stages, outcome measures, clinical and tumor markers considered, different time intervals and follow-up visits etc. [11, 18]. As expected, ProGRP as a well-known SCLC marker was not useful in our setting [22]. Ojara et al. integrated individual baseline serum biomarker concentrations combined with early tumor response in a prognostic model and reported low baseline C-reactive protein and a decline in tumor size at staging being predictive for longer OS [23].
It should be noted that prediction of therapy response is interpreted in a classical way, questioning whether STM anticipate radiological response to systemic treatment. The STM do not reflect the mechanism of action of the chemotherapies used in CEPAC-TDM trial, as it is requested e.g. for predictive companion diagnostics for TKI or ICI therapies, and no therapeutic control arm was used in the study. Thus, it can be discussed whether STM are being prognostic rather than predictive [20]. However, as a consequence of insufficient radiological response, treatment of patients could be intensified or changed to an early second-line therapy in case of insufficient decrease or even increase of STMs.
A distinctive features of the present study were the evaluation of lung STMs, such as CYFRA 21-1, CEA, NSE and SCC, as well as of other STMs that normally are associated with adenocarcinomas in other localizations, such as CA 125, CA 15-3 and HE4 [24, 25] and the well-balanced venipuncture schedule before cycles 1, 2, 3 (at staging) and at the end of the treatment, enabling a multitude of statistical evaluations. For practical reasons, we focused on absolute values at C1 (baseline) and C3 (first radiological staging), as well as on relevant changes from C1 to C3. Furthermore, we evaluated multiple endpoints, including prediction (C1) and monitoring (C3) of response to therapy for two purposes the identification of i) progression and of ii) partial remission. The patients with stable disease were then shifted to the control group. Additionally, the prognostic value for all STMs and multiple clinical factors were considered by investigating their impact on PFS and OS.
To address these scientific questions, biobanked samples from a prospective blood collection were accessible as part of a biomarker substudy that was associated with a multicentric randomized clinical drug trial, namely the CEPAC-TDM trial. This trial aimed at individualized, pharmaco-kinetically (PK)-guided dosing of paclitaxel combined with carboplatin or cisplatin in patients with NSCLC [9]. The advantages of using serially collected samples for secondary analysis were manifold. They encompassed the adherence of all study sites to well-defined venipuncture time points, the well-defined standardized procedures of preanalytical blood handling and storage, the excellent clinical documentation and radiological outcome measurements and follow-up visits in line with the standards of a GCP-level clinical trial. Moreover, a centrally organized study team associated with CESAR-EWIV closely monitored all study sites, ensuring meticulous oversight. Furthermore, analyses were conducted by experienced staff in a certified central laboratory, adhering to stringent quality controls. The statistical evaluation was performed by an independent team of high-quality biostatistics experts. Limitations of the study included the lack of a validation cohort and the unbalanced histology within our cohort.
5Conclusions
Serum tumor markers assessed at time of the first radiological staging exams hold significant value for estimating both therapy response and prognosis in patients with advanced NSCLC. However, they are only moderately informative prior to the start of therapy. Beyond the well-known lung cancer biomarkers CYFRA 21-1 and SCC, the adenocellular cancer markers CA 125 and CA 15-3 show high predictive and prognostic relevance, and should be included in future clinical biomarker trials.
Acknowledgments
Blood samples were collected in the biomarker substudy of the clinical drug trial CEPAC-TDM that was conducted by CESAR-EWIV and sponsored by Saladax Biomedical Inc. The tumor marker substudy was organized and conducted by CEBIO GmbH and sponsored by Roche DiagnosticsGmbH.
Author contributions
CONCEPTION: KG, SH
DATA CURATION: KG, MJ, MR, KH
ANALYSIS OF DATA: KH, KS, SU
PREPARATION OF THE MANUSCRIPT: KG, SH
REVISION FOR IMPORTANT INTELLECTUAL CONTENT: all
SUPERVISION: SH
Conflict of interest
MJ reports institutional advisory roles for Novartis, Astra Zeneca, Bayer, BMS, Basilea Pharmaceutica, Debiopharm, MSD, Roche, Sanofi, as well as research funding from Swiss Cancer Research, and travel grants from Roche, Sanofi and Takeda. SH has received research funding or honoraria from Roche Diagnostics, Bristol Myers Squibb, Merck KgaA, Sysmex Inostics and Volition SPRL. SH is also an editorial board member of Tumor Biology and an editor of the special issue Lung Cancer Tumor Markers but had no involvement in the peer review process of this manuscript.
Ethical considerations
The study was approved by the respective institutional review boards (IRB-Nr 576/2010 AMG1 Eberhard-Karls-University Tübingen, Germany; EKSG 11/011 SG 323/10 St. Gallen, Switzerland) and was performed in accordance with the Declaration of Helsinki and Good Clinical Practice guidelines. All patients provided written informed consent prior to any study-related procedures.
References
[1] | Sung H , Ferlay J , Siegel RL , Laversanne M , Soerjomataram I , Jemal A , et al. Global Cancer Statistics GLOBOCAN Estimates of Incidence and Mortality Worldwide for 36 Cancers in 185 Countries, CA Cancer J Clin (2021) ;71: (3):209–49. doi: 10.3322/caac.21660. |
[2] | Ettinger DS , Wood DE , Aisner DL , Akerley W , Bauman JR , Bharat A , et al. Non–Small Cell Lung Cancer, Version 3, JNCCN J Natl Compr Cancer Netw (2022) ;20: (5):497–530. doi: 10.6004/jnccn.2022.0025. |
[3] | Duffy MJ , Crown J Circulating Tumor DNA as a Biomarker for Monitoring Patients with Solid Cancers: Comparison with Standard Protein Biomarkers, Clin Chem (2022) ;68: (11):1381–90. doi: 10.1093/clinchem/hvac121. |
[4] | Holdenrieder S Biomarkers along the continuum of care in lung cancer, Scand J Clin Lab Invest (2016) ;76: (S245):S40–5. doi: 10.1080/00365513.2016.1208446. |
[5] | van den Heuvel M , Holdenrieder S , Schuurbiers M , Cigoianu D , Trulson I , van Rossum H , et al. Serum tumor markers for response prediction and monitoring of advanced lung cancer: a review focusing on immunotherapy and targeted therapies. Tumor Biol. 2023. |
[6] | Buma AIG , Schuurbiers MMF , van Rossum HH , van den Heuvel MM Clinical perspectives on serum tumor marker use in predicting prognosis and treatment response in advanced non-small cell lung cancer. Tumor Biol. 2023;1-11. doi: 10.3233/tub-220034. |
[7] | Yoon SM , Shaikh T , Hallman M Therapeutic management options for stage III non-small cell lung cancer, World J Clin Oncol (2017) ;8: (1):1–20. doi: 10.5306/wjco.v8.i1.1. |
[8] | Miyawaki E , Kenmotsu H , Shintani Y , Sekine I , Shukuya T , Takayama K , et al. Efficacy of platinum agents for stage III non-small-cell lung cancer following platinum-based chemoradiotherapy: a retrospective study, BMC Cancer (2022) ;22: (342):1–10. doi: 10.1186/s12885-022-09441-3. |
[9] | Joerger M , von Pawel J , Kraff S , Fischer JR , Eberhardt W , Gauler TC , et al. Open-label, randomized study of individualized, pharmacokinetically (PK)-guided dosing of paclitaxel combined with carboplatin or cisplatin in patients with advanced non-small-cell lung cancer (NSCLC), Ann Oncol (2016) ;27: (10):1895–902. doi: 10.1093/annonc/mdw290. |
[10] | Molina R , Marrades RM , Augé JM , Escudero JM , Viñolas N , Reguart N , et al. Assessment of a Combined Panel of Six Serum TumorMarkers for Lung Cancer, Am J Respir Crit Care Med (2016) ;193: (4):427–37. doi: 10.1164/rccm.201404-0603OC. |
[11] | Holdenrieder S , Wehnl B , Hettwer K , Simon K , Uhlig S , Dayyani F Carcinoembryonic antigen and cytokeratin-19 fragments for assessment of therapy response in non-small cell lung cancer: a systematic review and meta-Analysis, Br J Cancer (2017) ;116: (8):1037–45. doi: 10.1038/bjc.2017.45. |
[12] | Moritz R , Muller M , Korse CM , van den Broek D , Baas P , van den Noort V , et al. Diagnostic validation and interpretation of longitudinal circulating biomarkers using a biomarker response characteristic plot, Clin Chim Acta. (2018) ;487: (September):6–14. doi: 10.1016/j.cca.2018.09.015. |
[13] | Du J , Li Y , Wang L , Zhou Y , Shen Y , Xu F , et al. Selective application of neuroendocrine markers in the diagnosis and treatment of small cell lung cancer, Clin Chim Acta (2020) ;509: :295–303. doi: 10.1016/j.cca.2020.06.037. |
[14] | Korse CM , Holdenrieder S , Zhi yi X , Zhang X , Qiu L , Geistanger A , et al. Multicenter evaluation of a new progastrin-releasing peptide (ProGRP) immunoassay across Europe and China, Clin Chim Acta (2015) ;438: :388–95. doi: 10.1016/j.cca.2014.09.015. |
[15] | Muley T , Herth FJ , Heussel CP , Kriegsmann M , Thomas M , Meister M , et al. Prognostic value of tumor markers ProGRP, NSE and CYFRA 21-1 in patients with small cell lung cancer and chemotherapy-induced remission. Tumor Biol. 2023. |
[16] | Tarekel Wasly N , Abdalla H , El Kady M , Abd El Moneim W , El Khazragy N , Saeid A Prospective Analysis ofSerum HE4 as an Independent Prognostic Factor in Non Small Cell Lung Cancer. QJM An Int J Med. 2021;114. doi:10.1093/qjmed/hcab103.014. |
[17] | Bundesaerztekammer Neufassung der Richtlinie der Bundesärztekammer zur Qualitätssicherung laboratoriumsmedizinischer Untersuchungen –Rili-BÄK, Deutsches Aezteblatt Online. 2019. doi: 10.3238/arztebl.2019.rili_baek_qs_labor20192312. |
[18] | Trulson I , Holdenrieder S Prognostic value of blood-based protein biomarkers in non-small cell lung cancer –a critical review and update. Tumor Biol. 2023. |
[19] | Pujol JL , Molinier O , Ebert W , Dayrès JP , Barlesi F , Buccheri G , et al. CYFRA 21-1 is a prognostic determinant in non-small-cell lung cancer: Results of a meta-analysis in patients, Br J Cancer (2004) ;90: (11):2097–105. doi: 10.1038/sj.bjc.6601851. |
[20] | Holdenrieder S , Nagel D , Stieber P Estimation of prognosis by circulating biomarkers in patients with non-small cell lung cancer, Cancer Biomarkers (2010) ;6: (3-4):179–90. doi: 10.3233/CBM-2009-0128. |
[21] | Holdenrieder S , Stieber P , Von Pawel J , Raith H , Nagel D , Feldmann K , et al. Circulating nucleosomes predict the response to chemotherapy in patients with advanced non-small cell lung cancer, Clin Cancer Res (2004) ;10: :5981–7. doi: 10.1158/1078-0432.CCR-04-0625. |
[22] | Holdenrieder S , Stieber P , Von Pawel J , Raith H , Nagel D , Feldmann K , et al. Early and Specific Prediction of the Therapeutic Efficacy in Non-Small Cell Lung Cancer Patients by Nucleosomal DNA and Cytokeratin-19 Fragments, Ann N Y Acad Sci (2006) ;1075: (1):244–57. doi: 10.1196/annals.1368.033. |
[23] | Ojara FW , Henrich A , Frances N , Nassar YM , Huisinga W , Hartung N , et al. A prognostic baseline blood biomarker and tumor growth kinetics integrated model in paclitaxel / platinum treated advanced non-small cell lung cancer patients. CPT Pharmacometrics Syst Pharmacol. 2023;1-12. doi: 10.1002/psp4.12937. |
[24] | Stieber P , Heinemann V Sensible use of tumor markers, J Lab Med (2008) ;32: (5):339–60. doi: 10.1515/JLM.2008.015. |
[25] | Holdenrieder S , Pagliaro L , Morgenstern D , Dayyani F Clinically meaningful use of blood tumor markers in oncology, Biomed Res Int (2016) ;2016: :1–10. doi: 10.1155/2016/9795269. |


