
Lack of clinical utility of serum macrophage migration inhibitory factor (MIF) for monitoring therapy response and estimating prognosis in advanced lung cancer
Abstract
BACKGROUND:
Lung cancer is a major burden to global health and is still among the most frequent and most lethal malignant diseases. Macrophage migration inhibitory factor (MIF) is a proinflammatory cytokine involved in a variety of processes including tumorigenesis, formation of a tumor microenvironment and metastasis. It is therefore a potential prognostic biomarker in malignant diseases.
OBJECTIVE:
In this study, we investigated the applicability of MIF in serum samples as a biomarker in lung cancer.
METHODS:
In a retrospective approach, we analyzed the sera of 79 patients with non-small-cell lung cancer (NSCLC) and 14 patients with small-cell lung cancer (SCLC) before the start of chemotherapy, as well as before the second and third chemotherapy cycle, respectively. Serum MIF levels were measured using a sandwich immunoassay with a sulfo-tag-labelled detection antibody, while pro-gastrin releasing peptide (proGRP) levels were determined with an enzyme-linked immunosorbent assay.
RESULTS:
No difference in serum MIF levels between responders and non-responders to chemotherapy was observed at all time points, while proGRP levels were significantly lower in responders before the second chemotherapy cycle (p = 0.012). No differences in biomarker levels depending on the histopathological classification of NSCLC patients was found. Moreover, in ROC curve analyses MIF was not able to distinguish between responders and non-responders to therapy. proGRP could differentiate between responders and non-responders before the second chemotherapy cycle (p = 0.015) with sensitivities of 43% at 90% and 95% specificity, respectively. Likewise, proGRP yielded significantly longer survival times of patients with low proGRP concentrations before the second chemotherapy cycle (p = 0.015) in Kaplan-Meier analyses, yet MIF showed no significant differences in survival times at all time points. Comparison with the biomarkers CEA and CYFRA 21-1 in the same cohort showed that these established biomarkers clearly performed superior to MIF and proGRP.
CONCLUSIONS:
From the present results, there is no indication that serum MIF may serve as a biomarker in prognosis and monitoring of response to therapy in lung cancer. Limitations of this study include its retrospective design, the inclusion of a larger NSCLC and a smaller SCLC subgroup, the classical chemotherapeutic treatment, the use of a non-diagnostic immunoassay (RUO-test) for MIF measurement and the lack of a validation cohort. Strengths of the study are its highly standardized procedures concerning sample collection, preanalytic treatment, measurements and quality control of the laboratory assays.
1Introduction
Lung cancer is a major health burden worldwide and is being held accountable for 18% of all cancer deaths [1]. The major cause of lung cancer is tobacco smoking [2]. Although new therapeutic possibilities such as immunotherapy have considerably improved the treatment of lung cancer, overall survival remains relatively low, especially in advanced stages [3–5].
Blood-based biomarkers can play an important role in the diagnosis, prognosis and monitoring of therapy response of malignant diseases, as they possess several advantages compared to other diagnostic tools. They are readily available in most laboratory medicine environments without the need for additional specialized equipment. On the other hand, blood-based biomarkers are easily obtained on a virtually non-invasive basis, in contrast to procedures such as tissue biopsies or lumbar punctures.
Due to the great impact of lung cancer on public health, a multitude of biomarkers has been studied. Some of the most widely studied biomarkers in lung cancer are cytokeratin fragment 19 (CYFRA 21-1), carcinoembryonic antigen (CEA) and pro-gastrin releasing peptide (proGRP) [6–8]. In studies with lung cancer patients, these markers showed promising sensitivities and specificities, but did not reach a level of reliability sufficient for routine application in a clinical setting. Moreover, when a potential use as a screening tool is considered, positive and negative predictive values are low due to the overall low prevalence of lung cancer, which is estimated to be in the range of 1–4% in high risk groups [9]. Although combinations of biomarkers can further increase sensitivities and specificities [8, 10, 11], the search for new biomarkers and their clinical evaluation remain crucial factors to facilitate early diagnosis of lung cancer.
The macrophage migration inhibitory factor (MIF) is a proinflammatory cytokine with an additional tautomerase activity which is expressed by a variety of cells including T cells, monocytes, macrophages, dendritic cells, B cells, granulocytes, epi- and endothelial cells, fibroblasts and cells of the anterior pituitary gland [12, 13]. Its active physiological form is a homotrimer with a molecular weight of 37.5 kDa [14, 15]. MIF is highly pleiotropic and hence exerts a multitude of effects on the immune system and the general inflammatory response. It can counteract the immunosuppressive effects of glucocorticoids [16], is an activator of macrophages and T cells [12], stimulates the release of proinflammatory molecules such as TNF, IFN-γ, interleukins, PGE2 or COX2 [17–19], and has been linked to the pathogenesis of sepsis, ARDS, atherosclerosis, thrombosis, ACS, depression and rheumatologic diseases, for instance [12, 20–26]. Besides these pivotal functions, MIF is involved in tumorigenesis, tumor growth, angiogenesis and metastasis in cancer [13]. It is able to suppress the tumor suppressor p53, leading to a perturbance of the normal cell cycle and a reduced ability to enter apoptosis [17]. Additionally, MIF upregulates HIF-1α and promotes the Warburg effect in lung cancer cell lines, induces VEGF secretion, reduces E-cadherin expression and activates both PI3K/Akt and ERK1/2 signaling pathways, which are known contributors to tumor formation [18, 27]. Furthermore, MIF supports the formation of a tumor microenvironment by M2 polarization of tumor-associated macrophages [28, 29]. In NSCLCs, MIF was found to exert at least part of its effects such as secretion of angiogenic mediators through CD74 receptors [30]. Inhibiting the tautomerase activity of MIF led to growth attenuation of lung cancer both in vitro and in a mouse model [31]. Kamimura et al. showed that the intracellular distribution of MIF predicted prognosis of patients with lung adenocarcinomas [32]. In another study with 96 patients with squamous cell carcinomas of the lung, high MIF levels were associated with lymph node metastases, shorter disease-free survival and shorter disease-specific survival [33]. Altogether, MIF may not only provide additional insight into the linkage between inflammation and tumor growth, but also has the potential to function as a novel biomarker in lung cancer.
In this study, we sought to evaluate the potential of MIF serum levels as a predictive factor of therapy response and a prognostic factor for survival. Moreover, the results are compared to established biomarkers of lung cancer so as to better assess the potential role ofMIF.
2Patients, materials and methods
The cohort reported in this study and the applied chemotherapeutic agents have already been described elsewhere [34], and is therefore covered only briefly here. In a retrospective approach, serum samples of 93 patients suffering from newly diagnosed or recurring lung cancer were investigated, comprising 79 patients with NSCLC (53 male, 26 female) and 14 SCLC (8 male, 6 female). NSCLC patients were classified as UICC stage 3 (N = 21, 27%) or 4 (N = 56, 71%); in two cases (2%), no staging information was available. SCLC cases comprised six patients (43%) with UICC stage 3 and eight patients (57%) with UICC stage 4. Samples were collected in a clinical routine setting in the Lungenfachklinik Gauting (Germany) between January 1999 and June 2002 prior to the start of chemotherapy as well as prior to cycles 2 and 3. Predominant histopathology in NSCLCs was adenocarcinoma (N = 30, 38%) and squamous cell carcinoma (N = 25, 33%), large cell carcinoma (N = 6, 8%) and unspecified (N = 17, 21%). NSCLC and SCLC groups did not differ significantly in terms of age (U test, p = 0.776) or sex (χ2 test, p = 0.546)[34].
Response to chemotherapy was determined by CT-based staging after cycle 2 according to the WHO classification, thereby defining partial remission as a reduction in tumor mass of at least 50%, progression as an increase in tumor mass of at least 25%, and no change if neither condition was met [35, 36]. Therapy response in patients classified as no change was reevaluated after cycle 4 by another CT-based staging. Patients classified as partial remission or no change were combined into the group response to therapy, while patients classified as progression were defined as no response to therapy.
MIF concentrations were determined using the Human MIF Assay (Meso Scale Diagnostics, Rockville, MD, USA) on a Meso Quickplex SQ120 imager (Meso Scale Diagnostics, Rockville, MD, USA). This method is based on a sandwich immunoassay with a sulfo-tag-labelled detection antibody. Detection is conducted by electroluminescence using tripropylamine and [Ru(bipyridyl)3]2 + as catalyst. Regeneration of the Ru(II) complex is controlled by an anodic current. Serum levels of CEA and CYFRA 21-1 were measured by electrochemiluminescence on the Cobas Elecsys E 411 platform (Roche Diagnostics, Mannheim, Germany), ProGRP by enzyme-linked immunosorbent assay (ELISA, IBL, Hamburg, Germany).
Statistical analyses were performed with IBM SPSS Statistics (version 23, International Business Machines Corporation, Armonk, NY, USA). Medians, interquartile ranges (IQRs) and ranges are used in tables and diagrams as measures of central tendency and measures of variation, respectively. Differences in MIF and proGRP between groups were calculated with Mann-Whitney-U tests. Correlations between biomarkers were assessed with Spearman’s rank-order correlation, whereas correlations of biomarkers with therapy response were assessed with point-biserial correlations. To evaluate the diagnostic power of MIF and proGRP, receiver operating characteristic (ROC) curves with tumor progression as state variable were computed. Areas under the curves (AUCs) as well as sensitivities at specificities of 90% (Sens90) and 95% (Sens95), were calculated from ROC curves. Prognostic value of MIF and proGRP was investigated by univariate log-rank tests and visualized with Kaplan-Meier curves. The significance level was set to p < 0.05 for all tests. Considering the explorative approach of this study, no correction for multiple testing was performed. Results of the analysis are compared to established tumor markers CEA and CYFRA 21-1, which have also been measured in the study cohort. The results from those measurements have already been reported elsewhere and are therefore not analyzed in detail here [34].
3Results
3.1Serum levels of MIF and proGRP
Pretherapeutic concentrations of MIF and proGRP in responders and non-responders with NSCLCs are given in Table 1, while the respective concentrations in SCLCs are shown in Table 2. MIF levels did not differ significantly between responders and non-responders at all time points both in NSCLCs and SCLCs, as determined by Mann-Whitney-U tests. Concentrations of proGRP only differed between responders and non-responders with NSCLCs at the second chemotherapy cycle, with responders possessing a lower concentration than non-responders.
Table 1
Serum concentrations of MIF and proGRP in responders and non-responders with NSCLC
| NSCLC | Response | N | Median | IQR | Range | p-value |
| Pretherapeutic | ||||||
| MIF | R | 41 | 5.91 | 7.25 | 2.27 – 92.0 | 0.610 |
| NR | 38 | 6.12 | 5.93 | 1.48 – 85.2 | ||
| proGRP | R | 31 | 16.0 | 12.0 | 3.0 – 48.0 | 0.699 |
| NR | 20 | 17.0 | 15.3 | 4.0 – 59.0 | ||
| Cycle 2 | ||||||
| MIF | R | 40 | 4.94 | 8.56 | 1.77 – 51.6 | 0.638 |
| NR | 38 | 6.62 | 7.37 | 1.42 – 39.0 | ||
| proGRP | R | 16 | 10.5 | 13.8 | 3.0–24.0 | 0.012 |
| NR | 7 | 22.0 | 32.0 | 9.0–174 | ||
| Cycle 3 | ||||||
| MIF | R | 40 | 7.09 | 6.44 | 2.61–36.3 | 0.753 |
| NR | 34 | 7.20 | 6.71 | 1.7–51.51 | ||
| proGRP | R | 20 | 12.5 | 11.8 | 3.0–193 | 0.403 |
| NR | 11 | 18.0 | 26.0 | 3.0–198 | ||
| Changes Cycles 1–2 (%) | ||||||
| MIF | R | 41 | 82.3 | 118 | 0.0 – 816 | 0.259 |
| NR | 38 | 96.0 | 108 | 24.0 – 884 | ||
| proGRP | R | 12 | 113.6 | 203.1 | 8.6 – 700 | 0.448 |
| NR | 3 | 135.3 | – | 44.4 – 916 | ||
| Changes Cycles 1–3 (%) | ||||||
| MIF | R | 41 | 94.4 | 182 | 0.0 – 977 | 0.969 |
| NR | 38 | 102 | 154 | 0.0 – 750 | ||
| proGRP | R | 31 | 0.00 | 93.8 | 0.0 – 1206 | 0.569 |
| NR | 20 | 0.00 | 46.3 | 0.0 – 1042 |
R: responders, NR: non-responders, IQR: interquartile range. Concentrations are given in ng/mL (MIF) and pg/mL (proGRP), respectively.
Table 2
Serum concentrations of MIF and proGRP in responders and non-responders with SCLC
| SCLC | Response | N | Median | IQR | Range | p-value |
| Pretherapeutic | ||||||
| MIF | R | 10 | 3.92 | 4.83 | 1.1 – 10.13 | 0.635 |
| NR | 4 | 5.37 | 43.08 | 2.2 – 57.84 | ||
| proGRP | R | 8 | 33.0 | 241 | 0.0 – 1261 | 0.461 |
| NR | 4 | 341 | 740 | 0.0 – 923 | ||
| Cycle 2 | ||||||
| MIF | R | 10 | 3.33 | 5.25 | 0.68 – 16.6 | 0.733 |
| NR | 4 | 4.66 | 7.58 | 1.77 – 10.5 | ||
| proGRP | R | 8 | 97.5 | 164 | 7.0 – 345 | 0.497 |
| NR | 3 | 364 | – | 0.0 – 1355 | ||
| Cycle 3 | ||||||
| MIF | R | 10 | 3.34 | 5.01 | 0.95 – 34.5 | 0.240 |
| NR | 4 | 5.63 | 30.92 | 3.1 – 43.02 | ||
| proGRP | R | 9 | 16.0 | 33.5 | 3.0 – 83.0 | 0.260 |
| NR | 4 | 430 | 2423 | 0.0 – 2977 | ||
| Changes Cycles 1–2 (%) | ||||||
| MIF | R | 10 | 101 | 117 | 33.3 – 433 | 0.733 |
| NR | 4 | 81.8 | 292 | 4.5 – 393 | ||
| proGRP | R | 6 | 61.0 | 96.6 | 12.1 – 150 | 0.429 |
| NR | 2 | 115 | – | 83.3 – 146.8 | ||
| Changes Cycles 1–3 (%) | ||||||
| MIF | R | 10 | 122 | 73.2 | 15.1 – 485 | 0.839 |
| NR | 4 | 116 | 1476 | 5.4 – 1957 | ||
| ProGRP | R | 7 | 13.1 | 31.5 | 0.0 – 200 | 0.117 |
| NR | 3 | 185 | – | 20.4 – 323 |
R: responders, NR: non-responders, IQR: interquartile range. Concentrations are given in ng/mL (MIF) and pg/mL (proGRP), respectively.
Spearman correlation of pretherapeutic levels of MIF with pretherapeutic levels of proGRP in NSCLC cases showed a positive correlation coefficient (ρ=0.195), but failed to reach the defined significance level (p = 0.171). Results from point-biserial correlation between baseline concentrations and therapy response yielded no significant correlations as well (MIF: ρ=–0.058, p = 0.613; proGRP: ρ=0.055, p = 0.703). Respective correlations in the SCLC subgroup revealed a correlation coefficient between pretherapeutic levels of MIF and proGRP of 0.532 (p = 0.075) as well as point-biserial correlation coefficients of 0.157 (p = 0.592) and 0.231 (p = 0.470) for correlations of therapy response with MIF and proGRP, respectively.
3.2Changes in MIF and proGRP during chemotherapy
As given in Tables 1 and 2, changes in biomarker concentrations from the start of chemotherapy to the second and third chemotherapeutic cycle did not differ significantly between responders and non-responders for both biomarkers and in both subgroups. In SCLC, median levels of proGRP were considerably higher in non-responding patients and kinetics differed between both response groups, too. However, the numbers of patients investigated were quite low preventing an acceptable level of significance.
3.3Influence of histopathology in NSCLC
Pretherapeutic serum concentrations of MIF and proGRP in the most prominent histopathological entities, i.e. adenocarcinomas and squamous cell carcinomas, were compared to the remaining NSCLC cases, respectively. According to the results shown in Table 3, no significant differences were found.
Table 3
Pretherapeutic serum concentrations of MIF and proGRP stratified for histopathological entities in NSCLC cases
| Histopathology | MIF (ng/mL) | proGRP (pg/mL) |
| Adenocarcinomas | 6.12 | 11.5 |
| Non-adenocarcinomas | 5.76 | 17.0 |
| p-value | 0.455 | 0.158 |
| Squamous cell carcinomas | 6.46 | 17.0 |
| Non-squamous cell carcinomas | 5.84 | 16.0 |
| p-value | 0.602 | 0.879 |
As MIF expression levels in tissue samples of squamous cell carcinomas (SCC) have been found to be associated with tumor progression [33], further analyses of MIF in patients with SCC were performed. No differences in MIF concentrations between responders and non-responders to chemotherapy within the SCC cohort were observed in pretherapeutic samples (p = 0.919), at cycle 2 (p = 1.000) or at cycle 3 (p = 0.546). Additionally, no significant differentiation between responders and non-responders was found in ROC curve analyses of pretherapeutic MIF levels (p = 0.897), at cycle 2 (p = 0.979) or at cycle 3 (p = 0.520). Likewise, Kaplan-Meier analyses yielded no significant differences in survival times of SCC patients after stratification according to the respective median serum MIF concentrations pretherapeutically (p = 0.190), at cycle 2 (p = 0.586) or at cycle 3 (p = 0.314).
3.4ROC curve analyses of therapy response in NSCLC
Results from ROC curve analyses of all three time points are shown in Table 4, while ROC curves are depicted in Fig. 1. While proGRP was able to significantly discriminate between therapy response and tumor progression at cycle 2, MIF failed to distinguish responders from non-responders at all time points. Accordingly, Sens90 and Sens95 values were well below 20% and 10%, respectively, with the exception of proGRP at cycle 2 reaching values above 40%.
Fig. 1
ROC curves of MIF (blue) and proGRP (green) in NSCLC patients with tumor progression as state variable. a) pretherapeutic biomarker concentrations, b) concentrations at cycle 2 and c) concentrations at cycle 3.
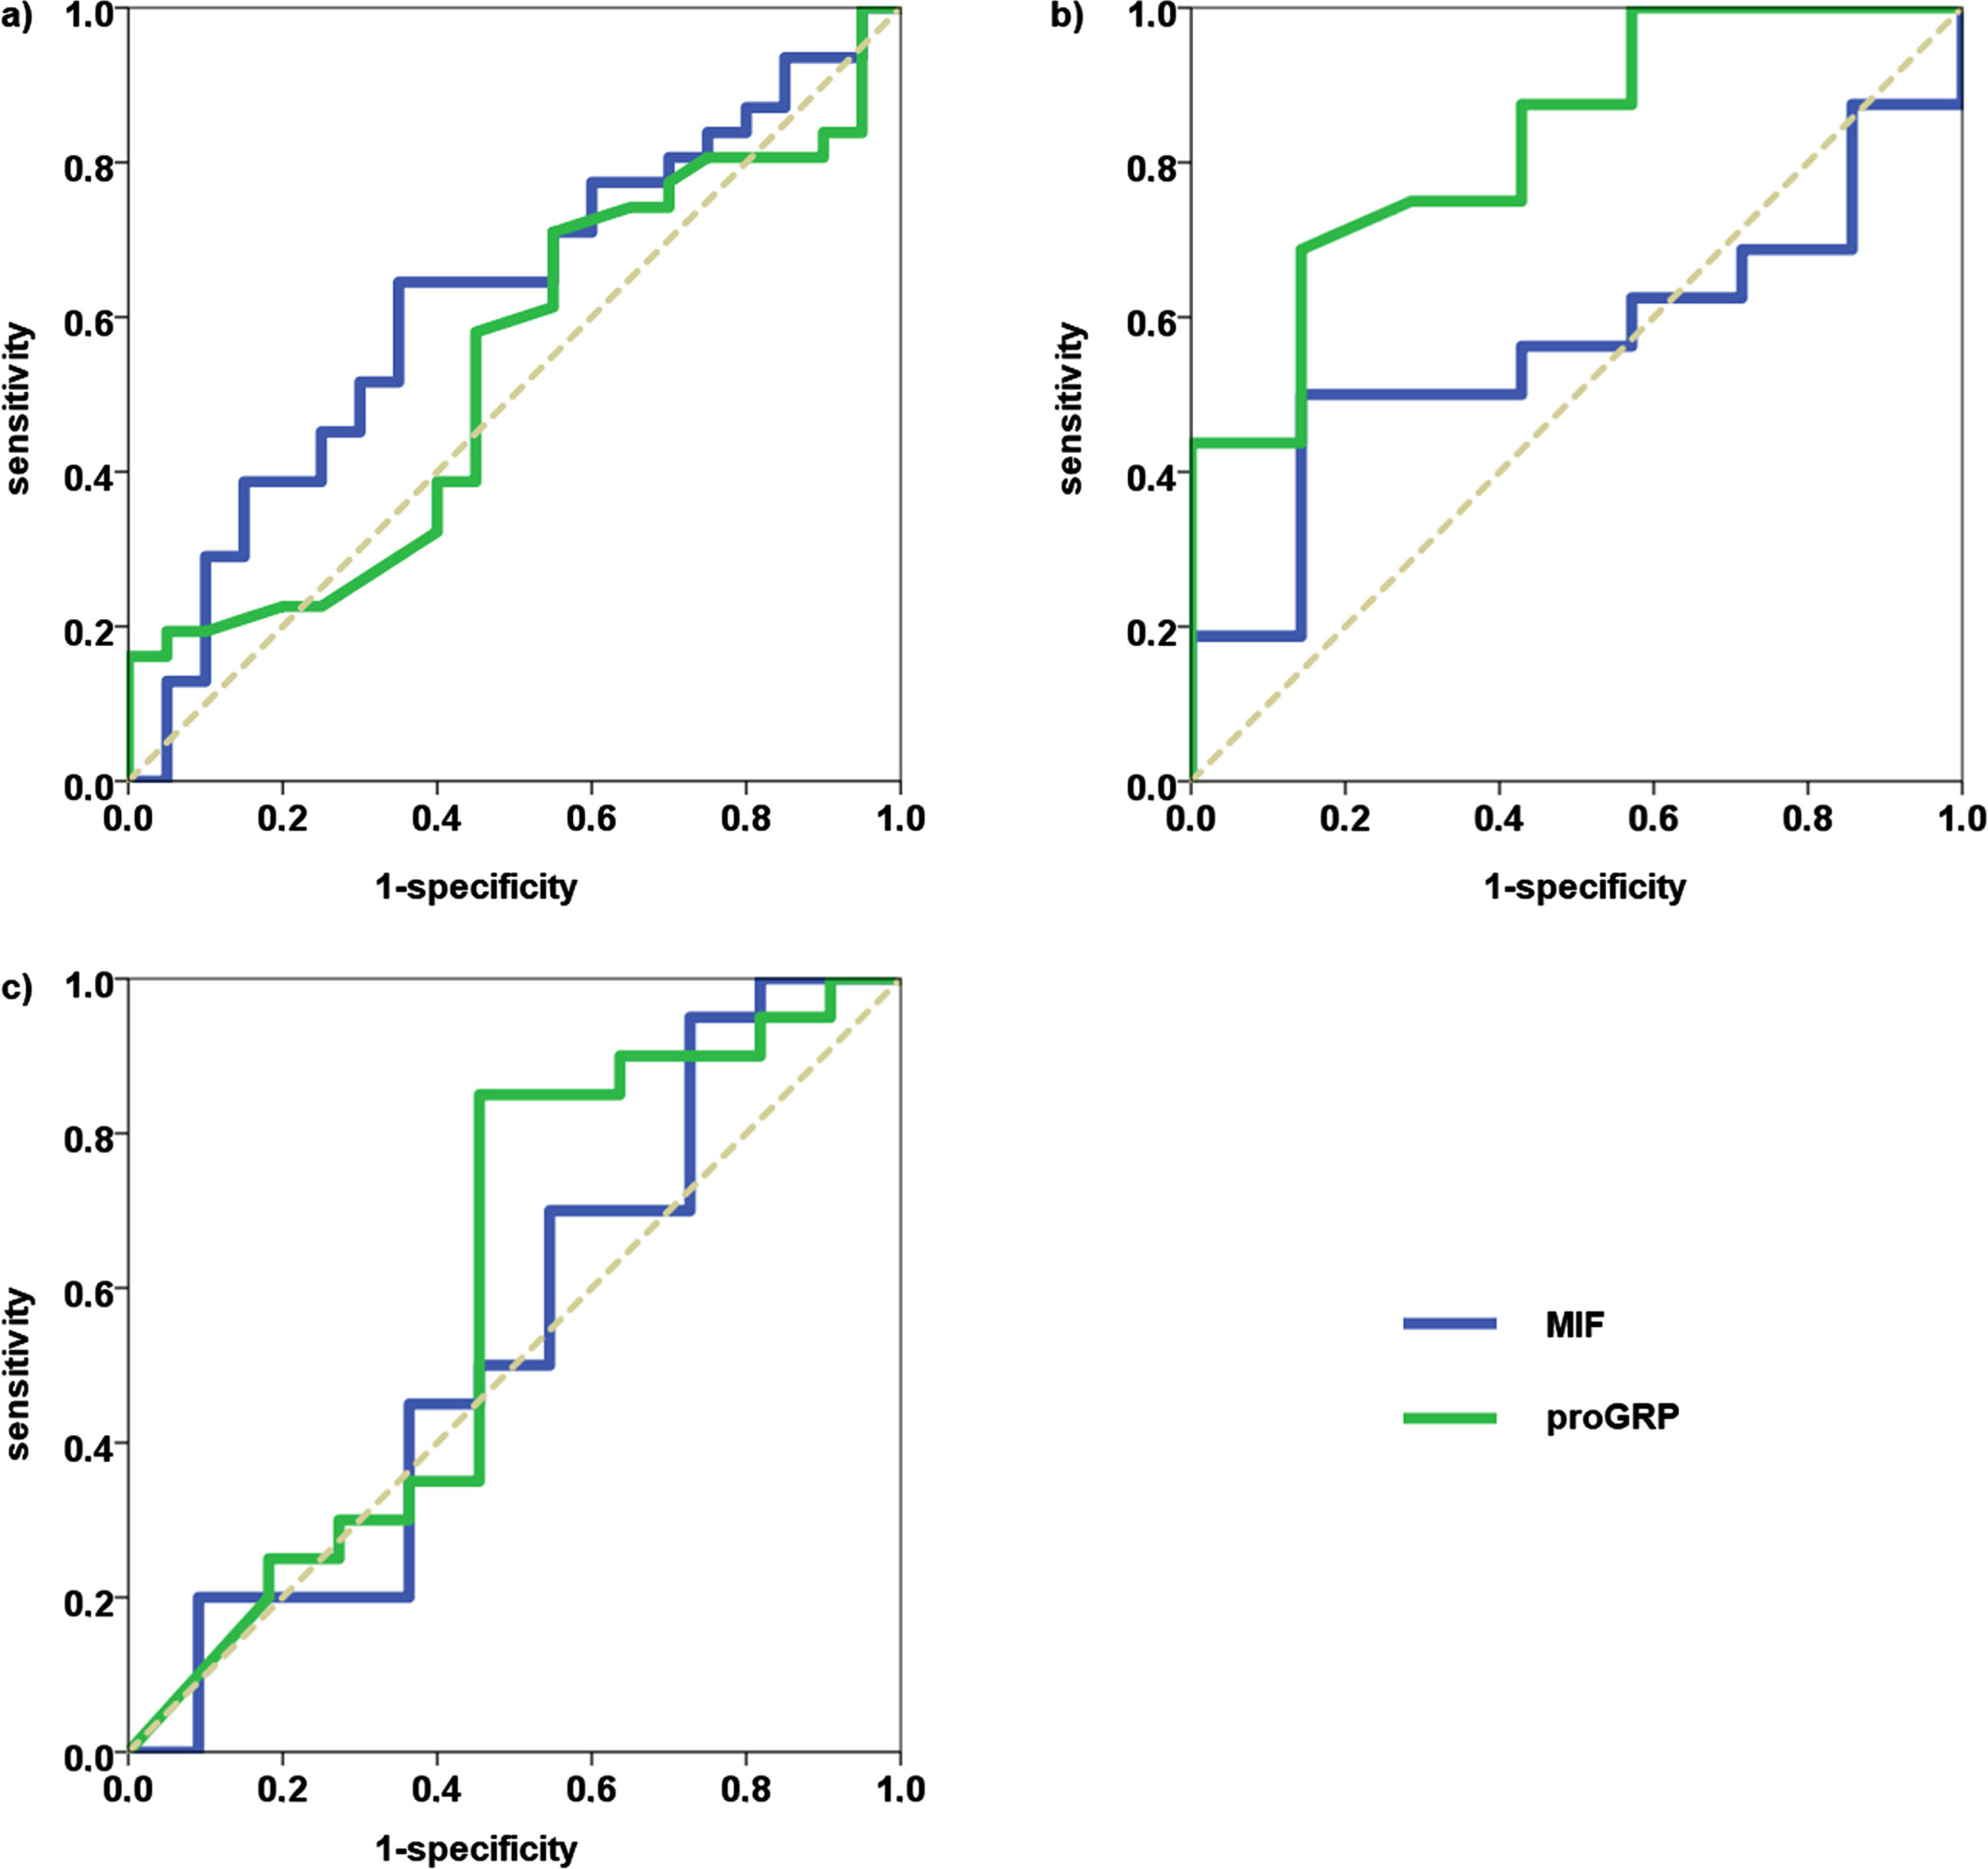
Table 4
Results from ROC curve analyses in NSCLC patients with tumor progression as state variable
| AUC | 95% -CI | Sens90 (%) | Sens95 (%) | p-value | |
| Pretherapeutic | |||||
| MIF | 0.467 | 0.338 – 0.595 | 10.5 | 2.6 | 0.610 |
| proGRP | 0.532 | 0.369 – 0.696 | 5.0 | 5.0 | 0.700 |
| Cycle 2 | |||||
| MIF | 0.531 | 0.401 – 0.661 | 7.9 | 0.0 | 0.638 |
| proGRP | 0.826 | 0.645 – 1.000 | 42.9 | 42.9 | 0.015 |
| Cycle 3 | |||||
| MIF | 0.521 | 0.387 – 0.655 | 17.6 | 8.8 | 0.753 |
| proGRP | 0.595 | 0.363 – 0.828 | 18.2 | 9.1 | 0.386 |
AUC: area under the curve, CI: confidence interval.
3.5Prognostic value of MIF and proGRP in NSCLC
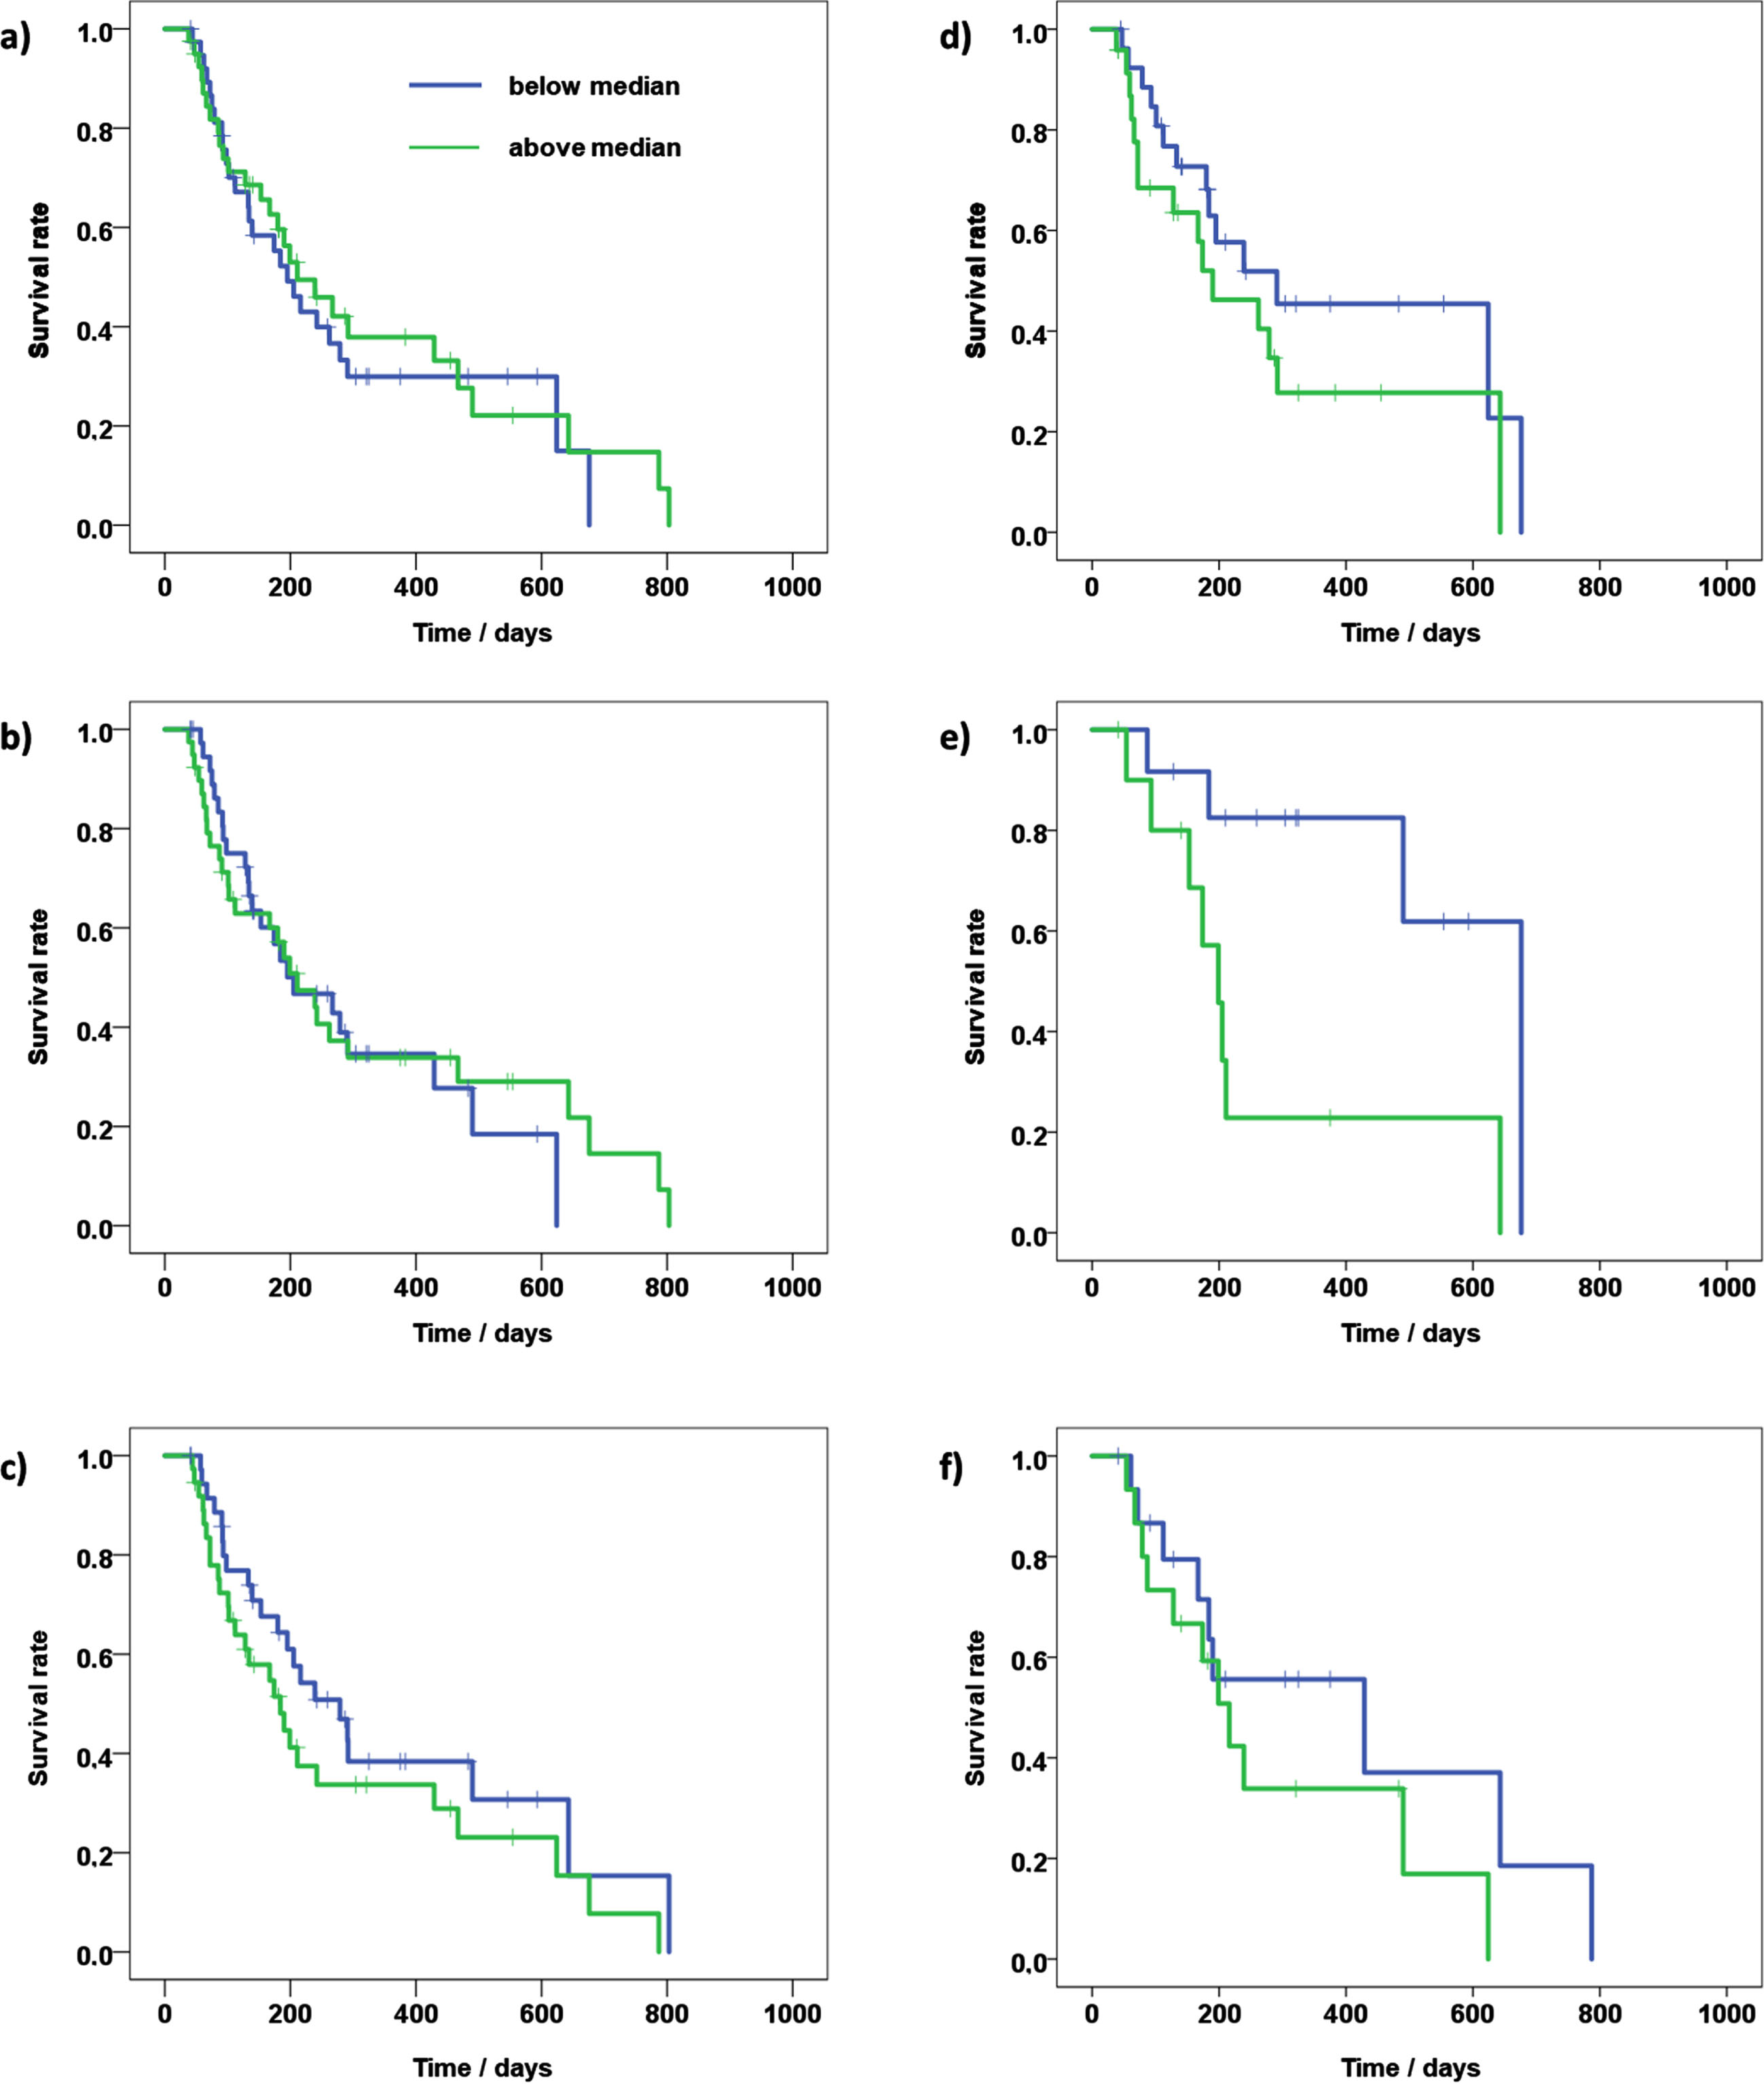
To assess the prognostic value of MIF and proGRP in NSCLC patients, the NSCLC group was stratified according to the respective median serum concentrations. Results of subsequent analyses of overall survival with Kaplan-Meier curves are given in Table 5 and Fig. 2. At cycle 2, proGRP levels above the median value of 13.0 pg/mL were associated with significantly shorter overall survival. At other time points, and at all time points in the case of MIF, no significant differences in survival times between low and high biomarker concentrations were obtained.
Table 5
Kaplan-Meier analyses of NSCLC patients
| Above threshold | Below threshold | |||||||
| Biomarker | Threshold | N | Median | 95% -CI | N | Median | 95% -CI | p-value |
| Pretherapeutic | ||||||||
| MIF | 5.91 | 40 | 211 | 120 – 302 | 39 | 195 | 138 – 252 | 0.655 |
| proGRP | 16.0 | 24 | 190 | 68 – 312 | 27 | 291 | 19 – 563 | 0.216 |
| Cycle 2 | ||||||||
| MIF | 6.16 | 39 | 211 | 136 – 286 | 39 | 205 | 90 – 320 | 0.858 |
| proGRP | 13.0 | 11 | 199 | 155 – 243 | 12 | 676 | – | 0.013 |
| Cycle 3 | ||||||||
| MIF | 7.19 | 37 | 184 | 113 – 255 | 37 | 279 | 177 – 381 | 0.183 |
| proGRP | 13.0 | 15 | 216 | 150 – 282 | 16 | 429 | 0 – 876 | 0.254 |
CI: confidence interval.
Fig. 2
Kaplan-Meier curves of NSCLC patients of a) pretherapeutic MIF concentrations, b) MIF levels at cycle 2, c) MIF levels at cycle 3, d) pretherapeutic proGRP concentrations, e) proGRP levels at cycle 2, f) proGRP levels at cycle 3.
3.6Analyses in the SCLC subgroup
In ROC curve analyses, neither proGRP nor MIF could differentiate significantly between responders and non-responders before the start of chemotherapy (proGRP: p = 0.445/MIF: p = 0.572), at the second chemotherapy cycle (p = 0.414/p=0.671) or at the third chemotherapy cycle (p = 0.217/p=0.203).
In Kaplan-Meier analyses after stratification by median serum concentrations of proGRP, no difference in survival times before chemotherapy (p = 0.071), at cycle 2 (p = 0.759) or at cycle 3 (p = 0.816) was found. When the SCLC subgroup was stratified according to the respective median MIF concentrations, again no significant difference in survival times between patients with high and those with low serum MIF levels before chemotherapy (p = 0.856) or at cycle 2 (p = 0.198) was obtained. At cycle 3, Kaplan-Meier analysis resulted in significantly longer survival times for patients with serum MIF concentrations below the median of 3.62 ng/ml (median survival 596 d vs. 144 d, 95% confidence interval: 213–980 d vs. 130–158 d, p = 0.029).
4Discussion
Lung cancer is still a severe burden to public and individual health. It is among the most frequent and most lethal types of cancer both in industrial and in developing countries. Although novel treatment options, such as immune checkpoint inhibitors expand therapeutic strategies, success rates remain relatively low in advanced stages [37]. Biomarkers have the potential to guide therapeutic decision making as well as provide a basis for prognosis. A biomarker with promising biochemical properties and a vital position within oncological pathways is MIF. Not only does MIF influence crucial processes such as apoptosis, it also serves as a link between tumorigenesis, inflammation and the immune system [38]. MIF has been shown to promote the tumor microenvironment, for instance, by stimulating tumor-associated macrophages [28, 29]. Additionally, MIF may affect the cell cycle and cell growth by interacting with pathways involving p53, Bcl-2 or PI3K/Akt [13, 17, 18]. Additionally, MIF supports immunoevasion of tumor cells by promoting suppression of T-cell activation [39–41] and activation of immunosuppressive functions of myeloid-derived suppressor cells [42, 43].
It has already been shown that MIF may facilitate prognosis in lung cancer [32, 33]. In the present study, we investigated the possible use of MIF and proGRP for prediction of therapy response and stratification of overall survival in a cohort of lung cancer patients. Pretherapeutic concentrations of MIF and proGRP in NSCLCs and SCLCs did not differ between responders and non-responders to subsequent chemotherapy. Therefore, it was assumed that initially, the biochemical status concerning MIF and proGRP was similar in responders and non-responders. Moreover, the histopathology within the NSCLC group did not influence pretherapeutic biomarker levels. In contrast to expectations, no differences in MIF concentrations between responders and non-responders occurred in the course of chemotherapy. As MIF promotes tumor growth and tumor microenvironment, tumor progression in non-responders was thought to increase MIF secretion as compared to responders.
The only significant results were obtained for proGRP in the NSCLC group before the second chemotherapy cycle, with responders possessing lower serum concentrations of proGRP and accordingly longer survival times in patients with lower proGRP levels. A possible explanation for this interesting finding is that after the start of chemotherapy and the onset of therapeutic response (or lack thereof in non-responders) with reduction in tumor burden, an increasing difference in serum marker concentrations and better differentiation between responders and non-responders based on these concentrations may occur. However, these considerations do not account for the lack of statistical significance before the third chemotherapy cycle. A thorough explanation for this convergence of proGRP concentrations at cycle 3 cannot be given at the moment.
4.1Comparison with established biomarkers
We have already reported results for the established biomarkers carcinoembryonic antigen (CEA) and cytokeratin-19 fragments (CYFRA 21-1) as well as for the immunogenic biomarker high mobility group box 1 protein (HMGB1) in the present cohort [34]. CYFRA 21-1 was well able to discriminate between responders and non-responders to chemotherapy in the case of NSCLCs, with significantly lower concentrations of CYFRA 21-1 in responders after the second and third chemotherapy cycle. In contrast, CEA allowed for a good differentiation between responders and non-responders in SCLCs. Furthermore, not only did CYFRA 21-1 show a good performance in ROC curves of NSCLC patients with areas under the curve above 0.7, but also yielded a significant prognostic value in Kaplan-Meier curves, with overall survival being 3.7–4.8 times higher in patients with a low CYFRA 21-1 concentration than in those with high serum levels. Similar results have also been obtained by other groups (reviewed in [44]). Clearly, both MIF and proGRP could not compete with these biomarkers. This is a remarkable result, since MIF has been linked to inflammatory processes which also occur within a tumor environment. Additionally, our study comprised patients in advanced tumor stages, tantamount to relatively high tumor mass and therefore not only a high relative, but also a potentially large absolute reduction of tumor mass in the case of responders to therapy. Hence, it was assumed that response to therapy would be associated with a decrease in serum levels of MIF, and that MIF in turn may serve as a significant factor in overall survival as determined by Kaplan-Meier analyses. It is unclear whether this is an intrinsic characteristic of lung cancer in general or a specific behavior of the cohort investigated here. However, as outlined above, studies concerning the role of MIF in cancer have found somewhat contradicting results. Our current data indicate that the subtype of NSCLCs does not change the secretion of MIF significantly, thereby ruling out the possibility of a histopathological sampling effect. It is unclear whether the lack of a change in MIF concentrations is influenced by chemotherapy itself in this cohort. Chemotherapeutic agents such as cisplatin or doxorubicin are known to promote inflammatory signal transduction [45]. However, due to the heterogeneous therapies and the general design of the present study, it was not possible to determine if the respective therapies themselves were able to elevate MIF concentrations and counterbalance a possible decrease of MIF serum levels in responders. In the SCLC subgroup, low MIF concentrations before the third chemotherapy cycle were associated with significantly longer survival times. This may indicate that serum MIF levels could be useful as a prognostic tool in SCLC patients. However, it must be emphasized that the significance of such a result is clearly limited due to the very limited number of SCLC patients in this study.
Therefore, more research is needed towards the effects and interlinkage of MIF in biochemical pathways involved in lung cancer progression. At present, we conclude that there is no indication that serum MIF levels may serve as a biomarker in prognosis and monitoring of response to chemotherapy in NSCLC. From the present data, no conclusions can be drawn regarding the applicability of MIF in immunotherapy of lung cancer, for instance with PD-1/PD-L1 inhibitors in advanced stages of NSCLC. Due to the constant advancement in therapeutic options with biologicals, more research towards the role of MIF and similar biomarkers in patients treated with such novel therapies is needed.
Obviously, there are some limitations of the study like the retrospective design, the inclusion of a larger NSCLC and a smaller SCLC subgroup, the classical chemotherapeutic treatment, the use of a non-diagnostic immunoassay (RUO-test) for MIF measurement and the lack of a validation cohort. However, samples were analyzed in a standardized procedure regarding collection, storage, treatment prior to measurement and analysis. High quality standards were obtained by standardized calibration curves, internal controls, measurement of serial samples within the same runs and final crossplate checks to minimize inter-assay variations. Radiological imaging analyses were performed by experienced, independent radiologists and data interpretation was done independently from data acquisition.
5Conclusion
The present study unfortunately revealed the lack of clinical utility of soluble MIF in serum samples of advanced lung cancer patients for monitoring therapy response and estimating prognosis in both NSCLC and SCLC subtypes.
Acknowledgments
We thank the biobank of the Ludwig Maximilians-University (LMU) Munich for storage of serum samples.
Author contributions
CONCEPTION: S.H. and J.v.P.
DATA CURATION: S.H., J.v.P., S.B., N.T. and A.R.
ANALYSIS OF DATA: S.B., A.R. and S.H.
PREPARATION OF THE MANUSCRIPT: S.H. and A.R.
REVISION FOR IMPORTANT INTELLECTUAL CONTENT: J.v.P., S.B. and N.T.
SUPERVISION: S.H. and J.v.P.
Conflict of interest
S. H. is one of the editors of the special issue “Lung Cancer Tumor Markers” but had no involvement in the peer review process of this article. The other authors declare no potential conflicts of interest with respect to the research, authorship, and/or publication of this article.
Ethical considerations
The study was conducted according to the guidelines of the Declaration of Helsinki, and approved by the Ethics Committee (IRB) of the Ludwig Maximilians-University (LMU) Munich (UE-Nr 114-13, date of approval: 05.08.2013). Anonymized biobanked serum specimens of the LMU Munich were used for this retrospective study as specified in the IRB approval (waiver for informed consent).
References
[1] | Bray F , Ferlay J , Soerjomataram I , Siegel RL , Torre LA , Jemal A . Global cancer statistics 2018: GLOBOCAN estimates of incidence and mortality worldwide for 36 cancers in 185 countries. CA Cancer J Clin. (2018) ;68: :394–424. 10.3322/caac.21492. |
[2] | Wild CP , Weiderpass E , Stewart BW , editors. World Cancer Report: Cancer Research for Cancer Prevention. Lyon, France: International Agency for Research on Cancer; 2020. |
[3] | Du L , Herbst RS , Morgensztern D . Immunotherapy in Lung Cancer. Hematol Oncol Clin North Am. (2017) ;31: :131–41. 10.1016/j.hoc.2016.08.004. |
[4] | Somasundaram A , Burns TF . The next generation of immunotherapy: keeping lung cancer in check. J Hematol Oncol. (2017) ;10: :87. 10.1186/s13045-017-0456-5. |
[5] | Villanueva N , Bazhenova L . New strategies in immunotherapy for lung cancer: beyond PD-1/PD-L1. Ther Adv Respir Dis. (2018) ;12: :1753466618794133. 10.1177/1753466618794133. |
[6] | Holdenrieder S . Biomarkers along the continuum of care in lung cancer. Scand J Clin Lab Invest Suppl. (2016) ;245: :S40–5. 10.1080/00365513.2016.1208446. |
[7] | Duffy MJ , O’Byrne K . Tissue and Blood Biomarkers in Lung Cancer: A Review. Adv Clin Chem. (2018) ;86: :1–21. 10.1016/bs.acc.2018.05.001. |
[8] | Seijo LM , Peled N , Ajona D , Boeri M , Field JK , Sozzi G , et al. Biomarkers in Lung Cancer Screening: Achievements, Promises, and Challenges. J Thorac Oncol. (2019) ;14: :343–57. 10.1016/j.jtho.2018.11.023. |
[9] | Diederich S , Wormanns D , Semik M , Thomas M , Lenzen H , Roos N , Heindel W . Screening for early lung cancer with low-dose spiral CT: prevalence in 817 asymptomatic smokers. Radiology. (2002) ;222: :773–81. 10.1148/radiol.2223010490. |
[10] | Nolen BM , Langmead CJ , Choi S , Lomakin A , Marrangoni A , Bigbee WL , et al. Serum biomarker profiles as diagnostic tools in lung cancer. Cancer Biomark. (2011) ;10: :3–12. 10.3233/CBM-2012-0229. |
[11] | Ma R , Xu H , Wu J , Sharma A , Bai S , Dun B , et al. Identification of serum proteins and multivariate models for diagnosis and therapeutic monitoring of lung cancer. Oncotarget. (2017) ;8: :18901–13. 10.18632/oncotarget.14782. |
[12] | Calandra T , Roger T . Macrophage migration inhibitory factor: a regulator of innate immunity. Nat Rev Immunol. (2003) ;3: :791–800. 10.1038/nri1200. |
[13] | Guda MR , Rashid MA , Asuthkar S , Jalasutram A , Caniglia JL , Tsung AJ , Velpula KK . Pleiotropic role of macrophage migration inhibitory factor in cancer. Am J Cancer Res. (2019) ;9: :2760–73. |
[14] | Sun HW , Bernhagen J , Bucala R , Lolis E . Crystal structure at 2.6-A resolution of human macrophage migration inhibitory factor. Proc Natl Acad Sci U S A. (1996) ;93: :5191–6. 10.1073/pnas.93.11.5191. |
[15] | Sun HW , Swope M , Cinquina C , Bedarkar S , Bernhagen J , Bucala R , Lolis E . The subunit structure of human macrophage migration inhibitory factor: evidence for a trimer. Protein Eng (1996) ;9: :631–5. 10.1093/protein/9.8.631. |
[16] | Calandra T , Bernhagen J , Metz CN , Spiegel LA , Bacher M , Donnelly T , et al. MIF as a glucocorticoid-induced modulator of cytokine production. Nature (1995) ;377: :68–71. 10.1038/377068a0. |
[17] | Conroy H , Mawhinney L , Donnelly SC . Inflammation and cancer: macrophage migration inhibitory factor (MIF)–the potential missing link. QJM (2010) ;103: :831–6. 10.1093/qjmed/hcq148. |
[18] | Nobre CCG , Araújo JMG de , Fernandes TAAdM , Cobucci RNO , Lanza DCF , Andrade VS , Fernandes JV . Macrophage Migration Inhibitory Factor (MIF): Biological Activities and Relation with Cancer. Pathol Oncol Res. (2017) ;23: :235–44. 10.1007/s12253-016-0138-6. |
[19] | Donnelly SC , Haslett C , Reid PT , Grant IS , Wallace WA , Metz CN , et al. Regulatory role for macrophage migration inhibitory factor in acute respiratory distress syndrome. Nat Med (1997) ;3: :320–3. 10.1038/nm0397-320. |
[20] | Müller II , Müller KAL , Schönleber H , Karathanos A , Schneider M , Jorbenadze R , et al. Macrophage migration inhibitory factor is enhanced in acute coronary syndromes and is associated with the inflammatory response. PLoS One (2012) ;7: :e38376. 10.1371/journal.pone.0038376. |
[21] | Chatterjee M , Borst O , Walker B , Fotinos A , Vogel S , Seizer P , et al. Macrophage migration inhibitory factor limits activation-induced apoptosis of platelets via CXCR7-dependent Akt signaling. Circ Res (2014) ;115: :939–49. 10.1161/CIRCRESAHA.115.305171. |
[22] | Larson DF , Horak K . Macrophage migration inhibitory factor: controller of systemic inflammation. Crit Care (2006) ;10: :138. 10.1186/cc4899. |
[23] | Petralia MC , Mazzon E , Fagone P , Basile MS , Lenzo V , Quattropani MC , et al. Pathogenic contribution of the Macrophage migration inhibitory factor family to major depressive disorder and emerging tailored therapeutic approaches. J Affect Disord. (2020) ;263: :15–24. 10.1016/j.jad.2019.11.127. |
[24] | Wirtz TH , Tillmann S , Strüßmann T , Kraemer S , Heemskerk JWM , Grottke O , et al. Platelet-derived MIF: a novel platelet chemokine with distinct recruitment properties. Atherosclerosis. (2015) ;239: :1–10. 10.1016/j.atherosclerosis.2014.12.039. |
[25] | Morand EF , Leech M , Weedon H , Metz C , Bucala R , Smith MD . Macrophage migration inhibitory factor in rheumatoid arthritis: clinical correlations. Rheumatology (Oxford) (2002) ;41: :558–62. 10.1093/rheumatology/41.5.558. |
[26] | Lai KN , Leung JCK , Metz CN , Lai FM , Bucala R , Lan HY . Role for macrophage migration inhibitory factor in acute respiratory distress syndrome. J Pathol (2003) ;199: :496–508. 10.1002/path.1291. |
[27] | Li J , Zhang J , Xie F , Peng J , Wu X . Macrophage migration inhibitory factor promotes Warburg effect via activation of the NF-κB/HIF-1α pathway in lung cancer. Int J Mol Med. (2018) ;41: :1062–8. 10.3892/ijmm.2017.3277. |
[28] | Huang W-C , Kuo K-T , Wang C-H , Yeh C-T , Wang Y . Cisplatin resistant lung cancer cells promoted M2 polarization of tumor-associated macrophages via the Src/CD155/MIF functional pathway. J Exp Clin Cancer Res. (2019) ;38: :180. 10.1186/s13046-019-1166-3. |
[29] | Avasarala S , Wu P-Y , Khan SQ , Yanlin S , van Scoyk M , Bao J , et al. PRMT6 Promotes Lung Tumor Progression via the Alternate Activation of Tumor-Associated Macrophages. Mol Cancer Res (2020) ;18: :166–78. 10.1158/1541-7786.MCR-19-0204. |
[30] | McClelland M , Zhao L , Carskadon S , Arenberg D . Expression of CD74, the receptor for macrophage migration inhibitory factor, in non-small cell lung cancer. Am J Pathol. (2009) ;174: :638–46. 10.2353/ajpath.2009.080463. |
[31] | Mawhinney L , Armstrong ME , O’ Reilly C , Bucala R , Leng L , Fingerle-Rowson G , et al. Macrophage migration inhibitory factor (MIF) enzymatic activity and lung cancer. Mol Med (2015) ;20: :729–35. 10.2119/molmed.2014.00136. |
[32] | Kamimura A , Kamachi M , Nishihira J , Ogura S , Isobe H , Dosaka-Akita H , et al. Intracellular distribution of macrophage migration inhibitory factor predicts the prognosis of patients with adenocarcinoma of the lung. Cancer. (2000) ;89: :334–41. 10.1002/1097-0142(20000715)89:2<334::AID-CNCR18>3.0.CO;2-N. |
[33] | Koh HM , Kim DC , Kim Y-M , Song DH . Prognostic role of macrophage migration inhibitory factor expression in patients with squamous cell carcinoma of the lung. Thorac Cancer. (2019) ;10: :2209–17. 10.1111/1759-7714.13198. |
[34] | Handke NA , Rupp ABA , Trimpop N , Pawel J von , Holdenrieder S . Soluble High Mobility Group Box 1 (HMGB1) Is a Promising Biomarker for Prediction of Therapy Response and Prognosis in Advanced Lung Cancer Patients. Diagnostics (Basel) (2021) . 10.3390/diagnostics11020356. |
[35] | Miller AB , Hoogstraten B , Staquet M , Winkler A . Reporting results of cancer treatment. Cancer. (1981) ;47: :207–14. 10.1002/1097-0142(19810101)47:1<207::aid-cncr2820470134>3.0.co;2-6. |
[36] | Holdenrieder S , Pawel J von , Dankelmann E , Duell T , Faderl B , Markus A , et al. Nucleosomes and CYFRA 21-1 indicate tumor response after one cycle of chemotherapy in recurrent non-small cell lung cancer. Lung Cancer. (2009) ;63: :128–35. 10.1016/j.lungcan.2008.05.001. |
[37] | ReckampKL. Lung Cancer: Treatment and Research. 1st ed. Cham: Springer International Publishing; (2016) . doi: 10.1007/978-3-319-40389-2 |
[38] | Bucala R , Donnelly SC . Macrophage migration inhibitory factor: a probable link between inflammation and cancer. Immunity. (2007) ;26: :281–5. 10.1016/j.immuni.2007.03.005. |
[39] | Rotte A , Bhandaru M . Mechanisms of Immune Evasion by Cancer. In: RotteA, BhandaruM, editors. Immunotherapy of Melanoma. Cham: Springer International Publishing; (2016) . p. 199–232. 10.1007/978-3-319-48066-4_8. |
[40] | Yaddanapudi K , Rendon BE , Lamont G , Kim EJ , Al Rayyan N , Richie J , et al. MIF Is Necessary for Late-Stage Melanoma Patient MDSC Immune Suppression and Differentiation. Cancer Immunol Res (2016) ;4: :101–12. 10.1158/2326-6066.CIR-15-0070-T. |
[41] | Zhou Q , Yan X , Gershan J , Orentas RJ , Johnson BD . Expression of macrophage migration inhibitory factor by neuroblastoma leads to the inhibition of antitumor T cell reactivity in vivo. J Immunol. (2008) ;181: :1877–86. 10.4049/jimmunol.181.3.1877. |
[42] | Otvos B , Silver DJ , Mulkearns-Hubert EE , Alvarado AG , Turaga SM , Sorensen MD , et al. Cancer Stem Cell-Secreted Macrophage Migration Inhibitory Factor Stimulates Myeloid Derived Suppressor Cell Function and Facilitates Glioblastoma Immune Evasion. Stem Cells. (2016) ;34: :2026–39. 10.1002/stem.2393. |
[43] | Simpson KD , Templeton DJ , Cross JV . Macrophage migration inhibitory factor promotes tumor growth and metastasis by inducing myeloid-derived suppressor cells in the tumor microenvironment. J Immunol. (2012) ;189: :5533–40. 10.4049/jimmunol.1201161. |
[44] | Holdenrieder S , Wehnl B , Hettwer K , Simon K , Uhlig S , Dayyani F . Carcinoembryonic antigen and cytokeratin-19 fragments for assessment of therapy response in non-small cell lung cancer: a systematic review and meta-analysis. Br J Cancer (2017) ;116: :1037–45. 10.1038/bjc.2017.45. |
[45] | Vyas D , Laput G , Vyas AK . Chemotherapy-enhanced inflammation may lead to the failure of therapy and metastasis. Onco Targets Ther (2014) ;7: :1015–23. 10.2147/OTT.S60114. |


