
Combined use of CYFRA 21-1 and CA 125 predicts survival of patients with metastatic NSCLC and stable disease in IMpower150
Abstract
BACKGROUND:
Patients with non-small cell lung cancer (NSCLC) and stable disease (SD) have an unmet clinical need to help guide early treatment adjustments.
OBJECTIVE:
To evaluate the potential of tumor biomarkers to inform on survival outcomes in NSCLC SD patients.
METHODS:
This post hoc analysis included 480 patients from the IMpower150 study with metastatic NSCLC, treated with chemotherapy, atezolizumab and bevacizumab combinations, who had SD at first CT scan (post-treatment initiation). Patients were stratified into high- and low-risk groups (overall survival [OS] and progression-free survival [PFS] outcomes) based on serum tumor biomarker levels.
RESULTS:
The CYFRA 21-1 and CA 125 biomarker combination predicted OS and PFS in patients with SD. Risk of death was ~4-fold higher for the biomarker-stratified high-risk versus low-risk SD patients (hazard ratio [HR] 3.80; 95% confidence interval [CI] 3.02–4.78; p < 0.0001). OS in patients with the low- and high-risk SD was comparable to that in patients with the CT-defined partial response (PR; HR 1.10; 95% CI 0.898–1.34) and progressive disease (PD) (HR 1.05; 95% CI 0.621–1.77), respectively. The findings were similar with PFS, and consistent across treatment arms.
CONCLUSIONS:
Biomarker testing shows potential for providing prognostic information to help direct treatment in NSCLC patients with SD. Prospective clinical studies are warranted.
ClinicalTrials.gov: NCT02366143
1Introduction
Non-small cell lung cancer (NSCLC) accounts for approximately 85% of all lung cancers, and is a major cause of mortality worldwide [1]. The treatment paradigm for NSCLC has evolved in recent years due to the availability of biomarkers that enable the selection of individualized treatment regimens [2]. For example, tyrosine kinase inhibitors (TKIs) of epidermal growth factor receptor (EGFR), anaplastic lymphoma kinase (ALK), BRAF V600E, c-ros oncogene 1 (ROS1), neurotrophic tyrosine receptor kinase (NTRK) 1/2/3, RET, MET and KRAS have been shown to improve survival and are recommended for patients with advanced or metastatic NSCLC with the respective oncogenic driver alterations [3–6]. Immune-checkpoint inhibitors, either as monotherapy or in combination with chemotherapy and/or anti-angiogenic monoclonal antibodies, have also elicited significant improvements in survival rates and are widely available for patients with metastatic NSCLC [3, 4].
Imaging techniques, such as computed tomography (CT), are the methods of choice for evaluating tumor burden and monitoring response to treatment in NSCLC. However, advances in lung cancer treatment, including molecular targeted therapy directed at specific genomic mutations, necessitates a parallel evolution of the approaches used to assess treatment response [7, 8]. Conventional criteria used to assess tumor response to therapy, including Response Evaluation Criteria in Solid Tumors (RECIST), were initially designed to characterize responses to chemotherapy regimens, and may be inadequate to fully assess responses in patients receiving specific targeted therapies. With the arrival of treatments such as immunotherapy leading to more complex treatment responses [9], and with greater knowledge of the molecular determinants of cancer, tumor shrinkage is no longer the only indicator of disease response [10]. Pseudoprogression, described as an initial increase in tumor size or the appearance of new lesions, followed by tumor regression, has been described with immune-checkpoint inhibitors and may be caused by tumor-infiltrating lymphocytes [10, 11]. CT assessment relies solely on tumor size and does not take into account cellular events such as apoptosis, inhibition of proliferation or cell cycle arrest, which can limit the utility of imaging alone for directing treatment decisions [11]. Evidence has also shown that measurement of tumor size by CT is subject to considerable inter-observer variability [12, 13]. In this context, the assessment of tumor biomarkers –with time efficient and readily available tests that are already routinely used in a variety of tumor types –may be of value to complement imaging modalities and provide additional information in the clinical evaluation of tumor response and/or survival benefit [14]. However, their use in lung cancer has not yet been firmly established.
In addition to roles in diagnosis and treatment response, tumor biomarkers may also have potential prognostic value. Here, we evaluated the prognostic significance of a number of serum tumor biomarkers and their combinations in patients with NSCLC, to determine if they could be applied as early surrogates of overall survival (OS) or progression-free survival (PFS). Based on their use or prior assessment in lung cancer monitoring, 10 serum tumor biomarkers were selected for evaluation –Carbohydrate antigen (CA) 125 (CA 125), CA 15-3, CA 19-9, carcinoembryonic antigen (CEA), cytokeratin 19 fragment 21-1 (CYFRA 21-1), human epididymis protein 4 (HE4), neuron specific enolase (NSE), squamous cell carcinoma antigen (SCC), progastrin-releasing peptide (ProGRP) and c-reactive protein (CRP). CA 125, a member of the mucin family glycoproteins, plays a role in tumor proliferation and has been shown to correlate with poorer prognosis in NSCLC [15–17]. CA 15-3, a biomarker predominantly used for monitoring of breast cancer, has been reported to be involved in lung cancer prediction and correlates with lung adenocarcinoma primary tissue and metastasis [18, 19]. CA 19-9 has previously been identified as a prognostic marker in patients with advanced lung adenocarcinoma, either independently or in combination with CYFRA 21-1 [20]. CYFRA 21-1 (abundant in the pulmonary tissue) and CEA (a serum glycoprotein), have been considered potential biomarkers in differential diagnosis of NSCLC [21], and a meta-analysis found high clinical utility of both markers for assessing treatment response in NSCLC [22]. HE4, encoded by the WAP 4-disulfilde core domain 2 (WFDC2) gene, is expressed in the respiratory tract and has been associated with worse prognosis in adenocarcinomas [23–25]. NSE, SCC and ProGRP, alone and in combination with other biomarkers, have been extensively researched in the diagnosis and monitoring of lung cancer [17, 26–28]. Finally, elevated CRP (a non-specific marker of inflammation and immune activation), is associated with adverse disease outcomes in NSCLC [29–31]
In this analysis, we utilized samples from patients with non-squamous NSCLC from the Phase III IMpower150 trial (NCT02366143), which evaluated three different treatment regimens [32]. This study led to the approval of atezolizumab with bevacizumab, paclitaxel, and carboplatin for the first-line treatment of patients with metastatic non-squamous NSCLC with no EGFR or ALK genomic tumor aberrations [33]. We evaluated whether any of the selected biomarkers and biomarker combinations could provide additional information on survival outcomes (OS and PFS) in patients with stable disease (SD; determined by RECIST v1.1) after two treatment cycles. We focussed on patients with SD due to their unmet clinical need, as SD in response to immunotherapy is common in patients with NSCLC, and the prognosis of this patient population varies greatly due to the complexity of SD [9, 34, 35]. The analysis evaluated potential early surrogates in order to help further risk stratification in patients with RECIST-determined SD and assist with treatment decision-making.
2Materials and methods
2.1Study population
In this retrospective exploratory analysis, stored samples from participants enrolled in the Phase III IMpower150 study (NCT02366143) were assessed. Full methodological details of this study have been described previously [32].
IMpower150 included patients with chemotherapy-naïve stage IV or recurrent metastatic non-squamous NSCLC per RECIST (v1.1) and an Eastern Cooperative Oncology group (ECOG) Performance Status Scale 0–1. Patients were recruited at 240 sites in 26 countries between March 2015 and December 2016, and randomized 1:1:1 to therapy with atezolizumab + carboplatin + paclitaxel (ACP), atezolizumab + bevacizumab + carboplatin + paclitaxel (ABCP), or bevacizumab + carboplatin + paclitaxel (BCP), every 3 weeks for 4–6 cycles. This was followed by maintenance therapy with atezolizumab, bevacizumab, or both. Treatment was administered on Day 1 of each cycle, and patients underwent CT scan based tumor assessments every 6 weeks from Day 1 of Cycle 1 for the first 48 weeks, and every 9 weeks thereafter.
The current biomarker analysis included patients from IMpower150 who had SD after two treatment cycles (i.e. at the first CT scan, 6 weeks post-treatment initiation), with available CT scan data and serum samples (serum samples were usually taken pre-dose, and the timepoint was selected to be as close as possible to that of the CT scan, with maximum of 14 days between CT and serum collection). Tumor response was determined by CT scan using RECIST v1.1, as assessed by investigators [36] and categorized as partial response (PR), SD, progressive disease (PD) or ‘other’. As an additional assessment of tumor response, the sum of the longest diameter of the target lesions (SLD) was measured at baseline and at the first post-treatment CT scan, and the proportion of patients with an increase or decrease in SLD was calculated. Serum tumor markers (CA 125, CA 15-3, CA 19-9, CEA, CYFRA 21-1, HE4, NSE, SCC, ProGRP and CRP) were measured on Cycle 1 Day 1 (C1D1), Cycle 2 Day 1 (C2D1) and Cycle 3 Day 1 (C3D1), Cycle 4 Day 1 and Cycle 8 Day 1, with one sample measured per patient. The current analysis only includes data from C3D1. Patients without CT scan data at 6 weeks or with progression/death prior to the CT scan at 6 weeks or the corresponding specimen collection date, were excluded.
2.2Efficacy assessments
In order to evaluate whether patients with SD at the first CT scan (6 weeks after treatment initiation) can be stratified into high- and low-risk groups for death/disease progression based on their serum tumor biomarker levels, OS and PFS were analyzed separately. The primary endpoint was OS, defined as the time from treatment start date to any cause of death. The secondary endpoint was PFS, defined as time from randomization to disease progression on CT or to any cause of death.
For both OS and PFS analyses, only the events occurring after the 6-week CT scan (i.e., after C3D1) were considered.
2.3Sample collection and biomarker evaluation
Measurements from a panel of 10 in vitro diagnostics biomarkers were evaluated, including nine electrochemiluminescence immunoassays ([ECLIA]: CA 125, CA 15-3, CA 19-9, CEA, CYFRA 21-1, HE4, NSE, SCC, and ProGRP) measured on the cobas® e 411 analyzer, and CRP measured on the cobas c 501 analyzer, all from Roche Diagnostics Solutions. Serum samples were measured in singlicates as per manufacturer instructions.
2.4Statistical analysis
Patient demographics and disease characteristics were summarized using descriptive statistics. Only patients with tumor response of either PR, SD or PD as determined by CT scan (RECIST) were included in the analyses.
Biomarker cut-offs were optimized to obtain maximum risk differences (maximum hazard ratio [HR]) between biomarker (score) low risk SD and biomarker (score) high risk SD patients in terms of OS or PFS. All quantiles from 0.2 to 0.8 by steps of 0.05 were tested to split the patients into two groups (0.2 and 0.8 were selected as boundaries to avoid any of the groups being inappropriately small, which could result in inflated HRs). In practice, patients were sorted based on their biomarker or biomarker composite score. Iteratively, a log-rank test was performed between the biomarker (score) low and high groups, starting from 20% of SD patients allocated in the biomarker low group. The proportion of biomarker low group was then increased by 5% and the log rank test was applied again. This was repeated until the biomarker low group included 80% of SD patients. The log-rank p-value was calculated for all possible cut-offs and the quantile with the lowest value was chosen as the optimized cut-off. Cut-offs were optimized for OS when OS was the endpoint and for PFS when PFS was the endpoint.
The composite score was derived from a linear combination of biomarkers. The composite score of biomarkers is equal to the linear predictor extracted from Cox models including two or three biomarkers.
Alternatively, a simplified statistical approach was performed using the univariate splits of singular biomarkers to separate into two risk groups: two markers elevated above the derived optimal cut-off (i.e. high-high, representing the extreme high-risk group), and all others combined (i.e. combined low/low, low/high, and high/low). Risk predictions for OS and PFS were obtained for serum tumor biomarkers (individual and combinations of markers), for CT response categories (PR, SD, PD) and SLD categories (increased or decreased), and were compared using Cox regression models and Kaplan–Meier curves.
2.5Ethical considerations
IMpower150 was conducted in accordance with the International Conference on Harmonisation Good Clinical Practice guidelines and with the principles of the Declaration of Helsinki. All patients provided written informed consent. An independent data monitoring committee reviewed safety data. The study protocol was approved by independent ethics committees at each participating site.
3Results
3.1Study patients
Of 1202 patients with NSCLC enrolled in the IMpower150 study (intention-to-treat, ITT), 750 patients had complete biomarker and first CT scan data (biomarker-evaluable population; BEP), with no more than 14 days between CT scan and serum sample collection. These patients were classified via RECIST v1.1 assessment: 480 patients had SD, 247 had PR, and 17 had PD. The 6 remaining patients, classed as ‘other’, displayed mixed and other responses on CT and so were not included in the biomarker analysis (Fig. 1). Patient demographics and characteristics of the BEP are shown in Table 1. Of the 480 patients with SD, 44 (9.2%) had an increase in SLD at the first post-treatment CT scan compared with baseline.
Fig. 1
Study population. a. At 6 weeks post treatment initiation. C1D1, Cycle 1 Day 1; C3D1, Cycle 3 Day 1; CT, computed tomography; CR, complete response; PD, progressive disease; PR, partial response; NE, non-evaluable; SD, stable disease.
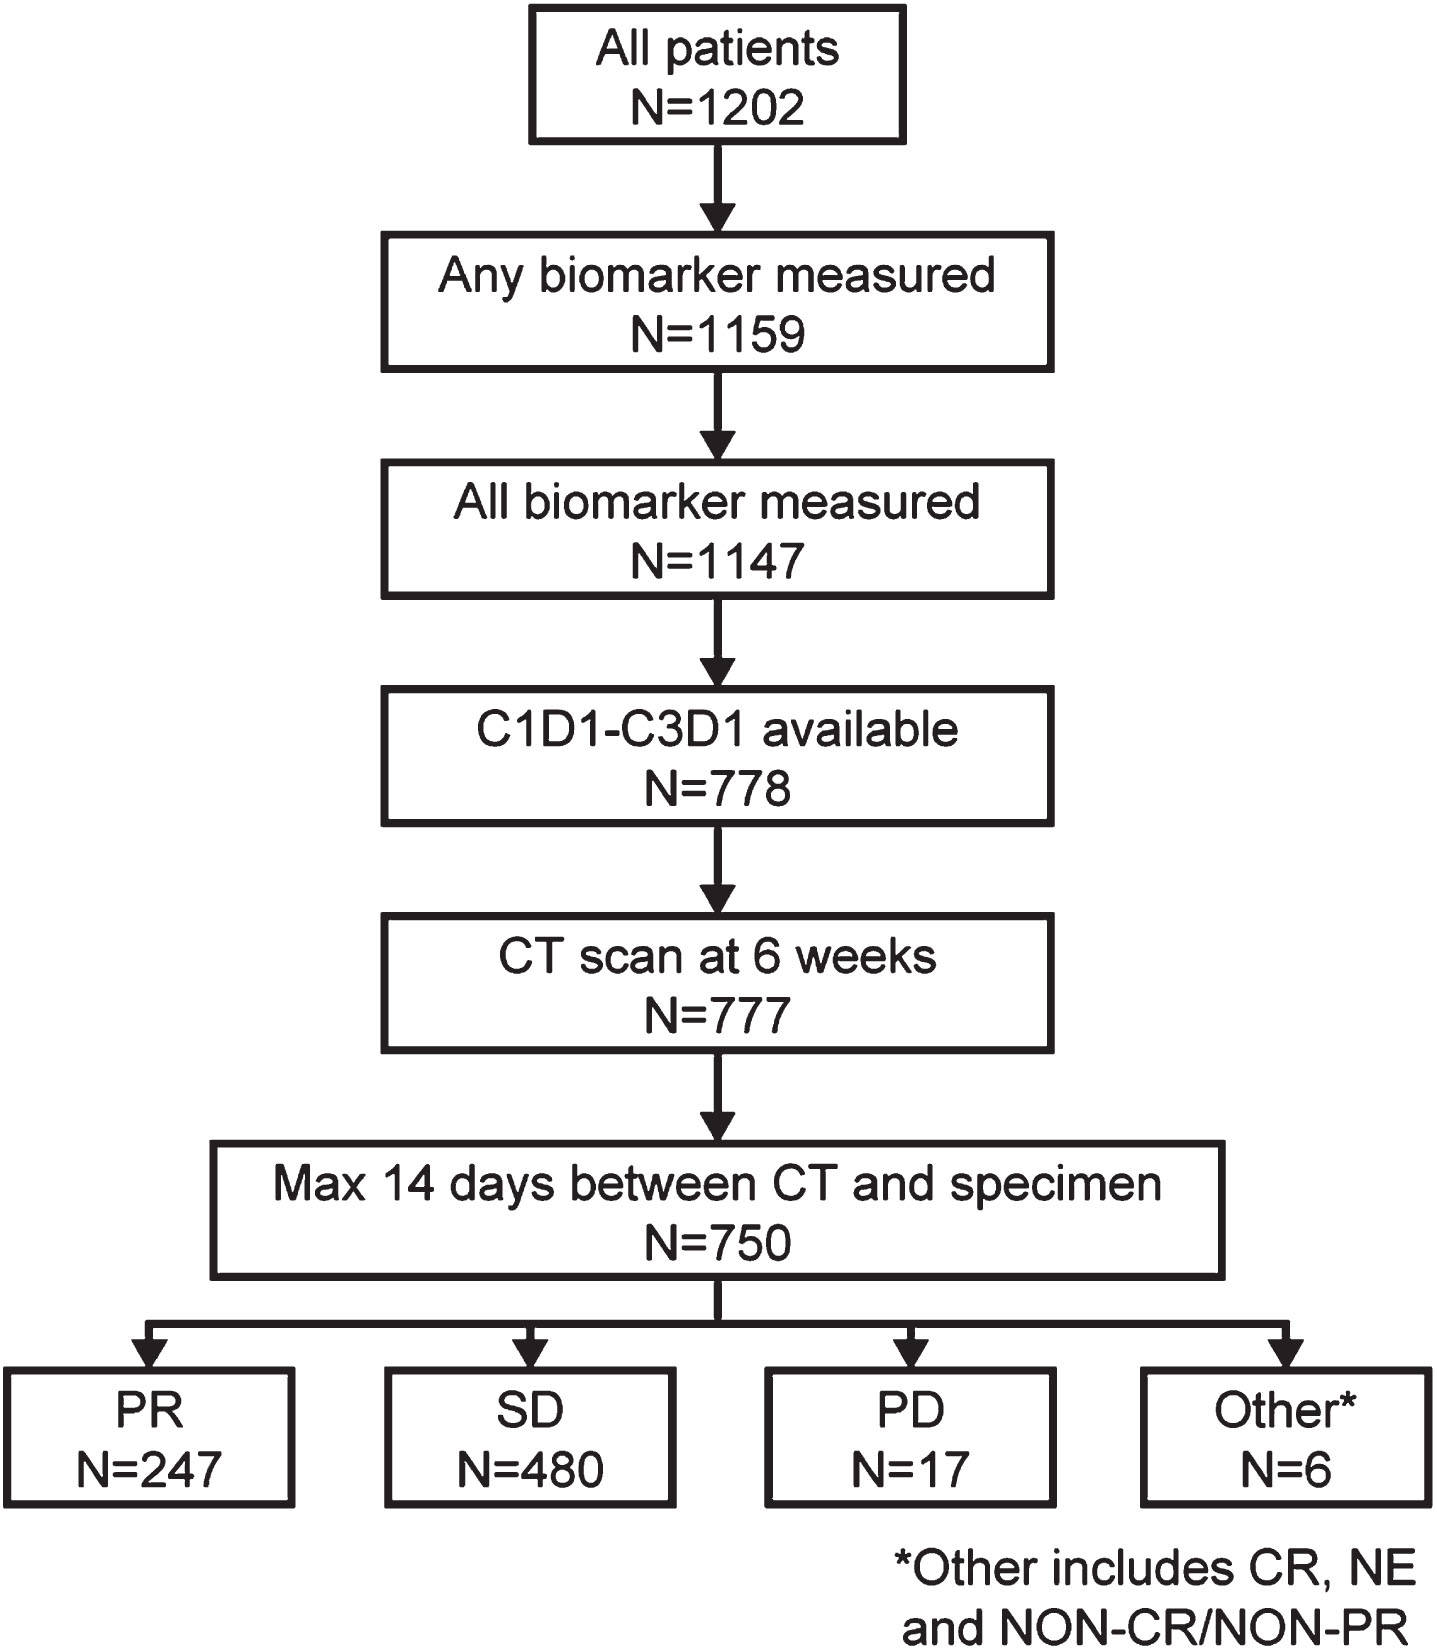
Table 1
Patient characteristics and demographics of the BEP by first CT scan resulta
| Patients with NSCLC | ||||
| PR (n = 247) | SD (n = 480) | PD (n = 17) | All (N = 744) | |
| Mean age, years (standard deviation) | 62.6 (9.07) | 62.6 (9.14) | 63.9 (6.43) | 62.6 (9.06) |
| Female/Male, n (%) | 102/145 | 185/295 | 7/10 | 294/450 |
| (41.3/58.7) | (38.5/61.5) | (41.2/58.8) | (39.5/ 60.5) | |
| Race, n (%) | ||||
| White | (81.0) | 397 (82.7) | 17 (100) | 614 (82.5) |
| Black | 6 (2.4) | 8 (1.7) | – | 14 (1.9) |
| Asian | 30 (12.1) | 64 (13.3) | – | 94 (12.6) |
| Multiple | 2 (0.8) | 1 (0.2) | – | 3 (0.4) |
| American Indian or Alaskan Native | 2 (0.8) | – | – | 2 (0.3) |
| Unknown | 7 (2.8) | 10 (2.1) | – | 17 (2.3) |
| ECOG performance status, n (%) | ||||
| 0 | 128 (52.0) | 203 (42.6) | 7 (41.2) | 338 (45.7) |
| 1 | 118 (48.0) | 273 (57.4) | 10 (58.8) | 401 (54.3) |
| Histology, n (%) | ||||
| Adenocarcinoma | 237 (96.0) | 451 (94.0) | 14 (82.4) | 702 (94.4) |
| Otherb | 8 (3.2) | 23 (4.8) | 2 (11.8) | 33 (4.4) |
| Unknown | 2 (0.8) | 6 (1.3) | 1 (5.9) | 9 (1.2) |
| KRAS mutation status, n (%) | ||||
| Negative | 46 (18.6) | 93 (19.4) | 1 (5.9) | 140 (18.8) |
| Positive | 25 (10.1) | 45 (9.4) | 3 (17.6) | 73 (9.8) |
| Unknown | 176 (71.3) | 342 (71.3) | 13 (76.5) | 531 (71.4) |
| ALK mutation status, n (%) | ||||
| Negative | 240 (97.2) | 460 (95.8) | 15 (88.2) | 715 (96.1) |
| Positive | 7 (2.8) | 16 (3.3) | 0 | 23 (3.1) |
| Unknown | 0 | 4 (0.8) | 2 (11.8) | 6 (0.8) |
| EGFR mutation status, n (%) | ||||
| Negative | 223 (90.3) | 412 (85.8) | 14 (82.4) | 649 (87.2) |
| Positive | 24 (9.7) | 58 (12.1) | 2 (11.8) | 84 (11.3) |
| Unknown | 0 | 10 (2.1) | 1 (5.9) | 11 (1.5) |
| PD-L1 status, n (%) | ||||
| Negative | 94 (38.1) | 247 (51.5) | 8 (47.1) | 349 (46.9) |
| Positive | 153 (61.9) | 233 (48.5) | 9 (52.9) | 395 (53.1) |
aAt 6 weeks post treatment initiation. bOther histologies included adenocarcinoma with neuroendocrine features, adenosquamous carcinoma, bronchioloalveolar carcinoma, large-cell carcinoma, sarcomatoid carcinoma, and undifferentiated carcinoma. ALK, anaplastic lymphoma kinase; BEP, biomarker-evaluable population; CT, computed tomography; ECOG, Eastern Cooperative Oncology Group; EGFR, epidermal growth factor receptor; KRAS, Kirsten rat sarcoma viral oncogene homologue; PD, progressive disease; PR, partial response; SD, stable disease.
3.2Prognostic value of serum tumor biomarkers
The prognostic value of individual, or combinations of, cancer biomarkers at the first post-treatment CT scan (6 weeks post treatment initiation) were evaluated for predicting OS and PFS in the group of 480 patients with SD (Table 2). When differentiating low- or high-risk SD using derived biomarker cut-offs, CYFRA 21-1 and CA 125 displayed the best individual performance for both OS and PFS (Table 2) using the optimized cut-offs calculated as 4.63 ng/mL and 77.32 U/mL, respectively; expected normal values for these assays have been reported as≤2.37 ng/mL and < 35 U/mL [37, 38]. Predictive value was further improved using CYFRA 21-1 and CA 125 combined to derive an optimized biomarker score (Table 2). The addition of a third biomarker did not significantly improve the prognostic value of the two markers and therefore, CYFRA 21-1 + CA 125 was determined as the optimal panel. Prognostic data for this two-marker panel are reported here.
Table 2
Analysis of OS and PFS outcomes in patients with SD at 6-week CT scan (n = 480)
| High- vs low-risk SD | ||||
| Biomarker | Optimized cut-off | N | Hazard ratio | |
| OS | PFS | |||
| Single biomarkersa | ||||
| CA 125 | 77.32 U/mL | 96 vs 384 | 2.88 | 2.51 |
| CA 15-3 | 54.59 U/mL | 96 vs 384 | 2.29 | 1.93 |
| CA 19-9 | 33.84 U/mL | 96 vs 384 | 1.46 | 1.37 |
| CEA | 25.70 ng/mL | 120 vs 360 | 1.56 | 1.54 |
| CYFRA 21-1 | 4.63 ng/mL | 95 vs 385 | 2.62 | 2.73 |
| HE4 | 150.80 pmol/L | 96 vs 384 | 2.01 | 1.84 |
| NSE | 13.78 ng/mL | 144 vs 336 | 1.33 | 1.13 |
| SCC | 1.12 ng/mL | 216 vs 264 | 1.20 | 1.24 |
| proGRP | 34.98 pg/mL | 216 vs 264 | 1.21 | 1.25 |
| CRP | 2.33 mg/L | 383 vs 97 | 1.94 | 1.37 |
| Combination biomarkersb | ||||
| CA 125, CYFRA 21-1 | – | 120 vs 360 | 3.80 | 2.99 |
| CA 125, CYFRA 21-1, CRP | – | 96 vs 384 | 3.58 | 3.00 |
Cut-off values reported for univariate markers and not applicable to multivariate biomarker score. aPatients with SD stratified as high- or low-risk according to biomarker above or below optimized cut-off value. bPatients with SD stratified as high- or low-risk according to combined biomarker score above or below optimized cut-off. OS, overall survival; PFS, progression-free survival; SD, stable disease.
3.3Overall survival
Patients with SD at the first 6-week CT scan had a 42% increased risk of death compared with patients with PR (median OS 18.8 vs 24.8 months; HR 1.424; 95% CI 1.179–1.720; p < 0.0001; Fig. 2a). The risk of death was considerably higher for patients with PD compared with patients with SD (median OS 6.1 months; HR 2.680; p < 0.0001 (Fig. 2a). Within patients with SD, the risk of death was similar between patients with increased versus decreased SLD (HR 1.32; 95% CI 0.93–1.86; p = 0.11).
Fig. 2
Kaplan-Meier plot of overall survival in (a) Patients with partial response, stable disease, or progressive disease at first CT scana (b) Cox-proportional hazard model including patients with SD stratified into high- and low-risk groups by biomarker combination, CYFRA 21-1 +CA 125 (above or below optimized cut-off). a. At 6 weeks post treatment initiation. OS, overall survival; PD, progressive disease; PR, partial response; SD, stable disease.
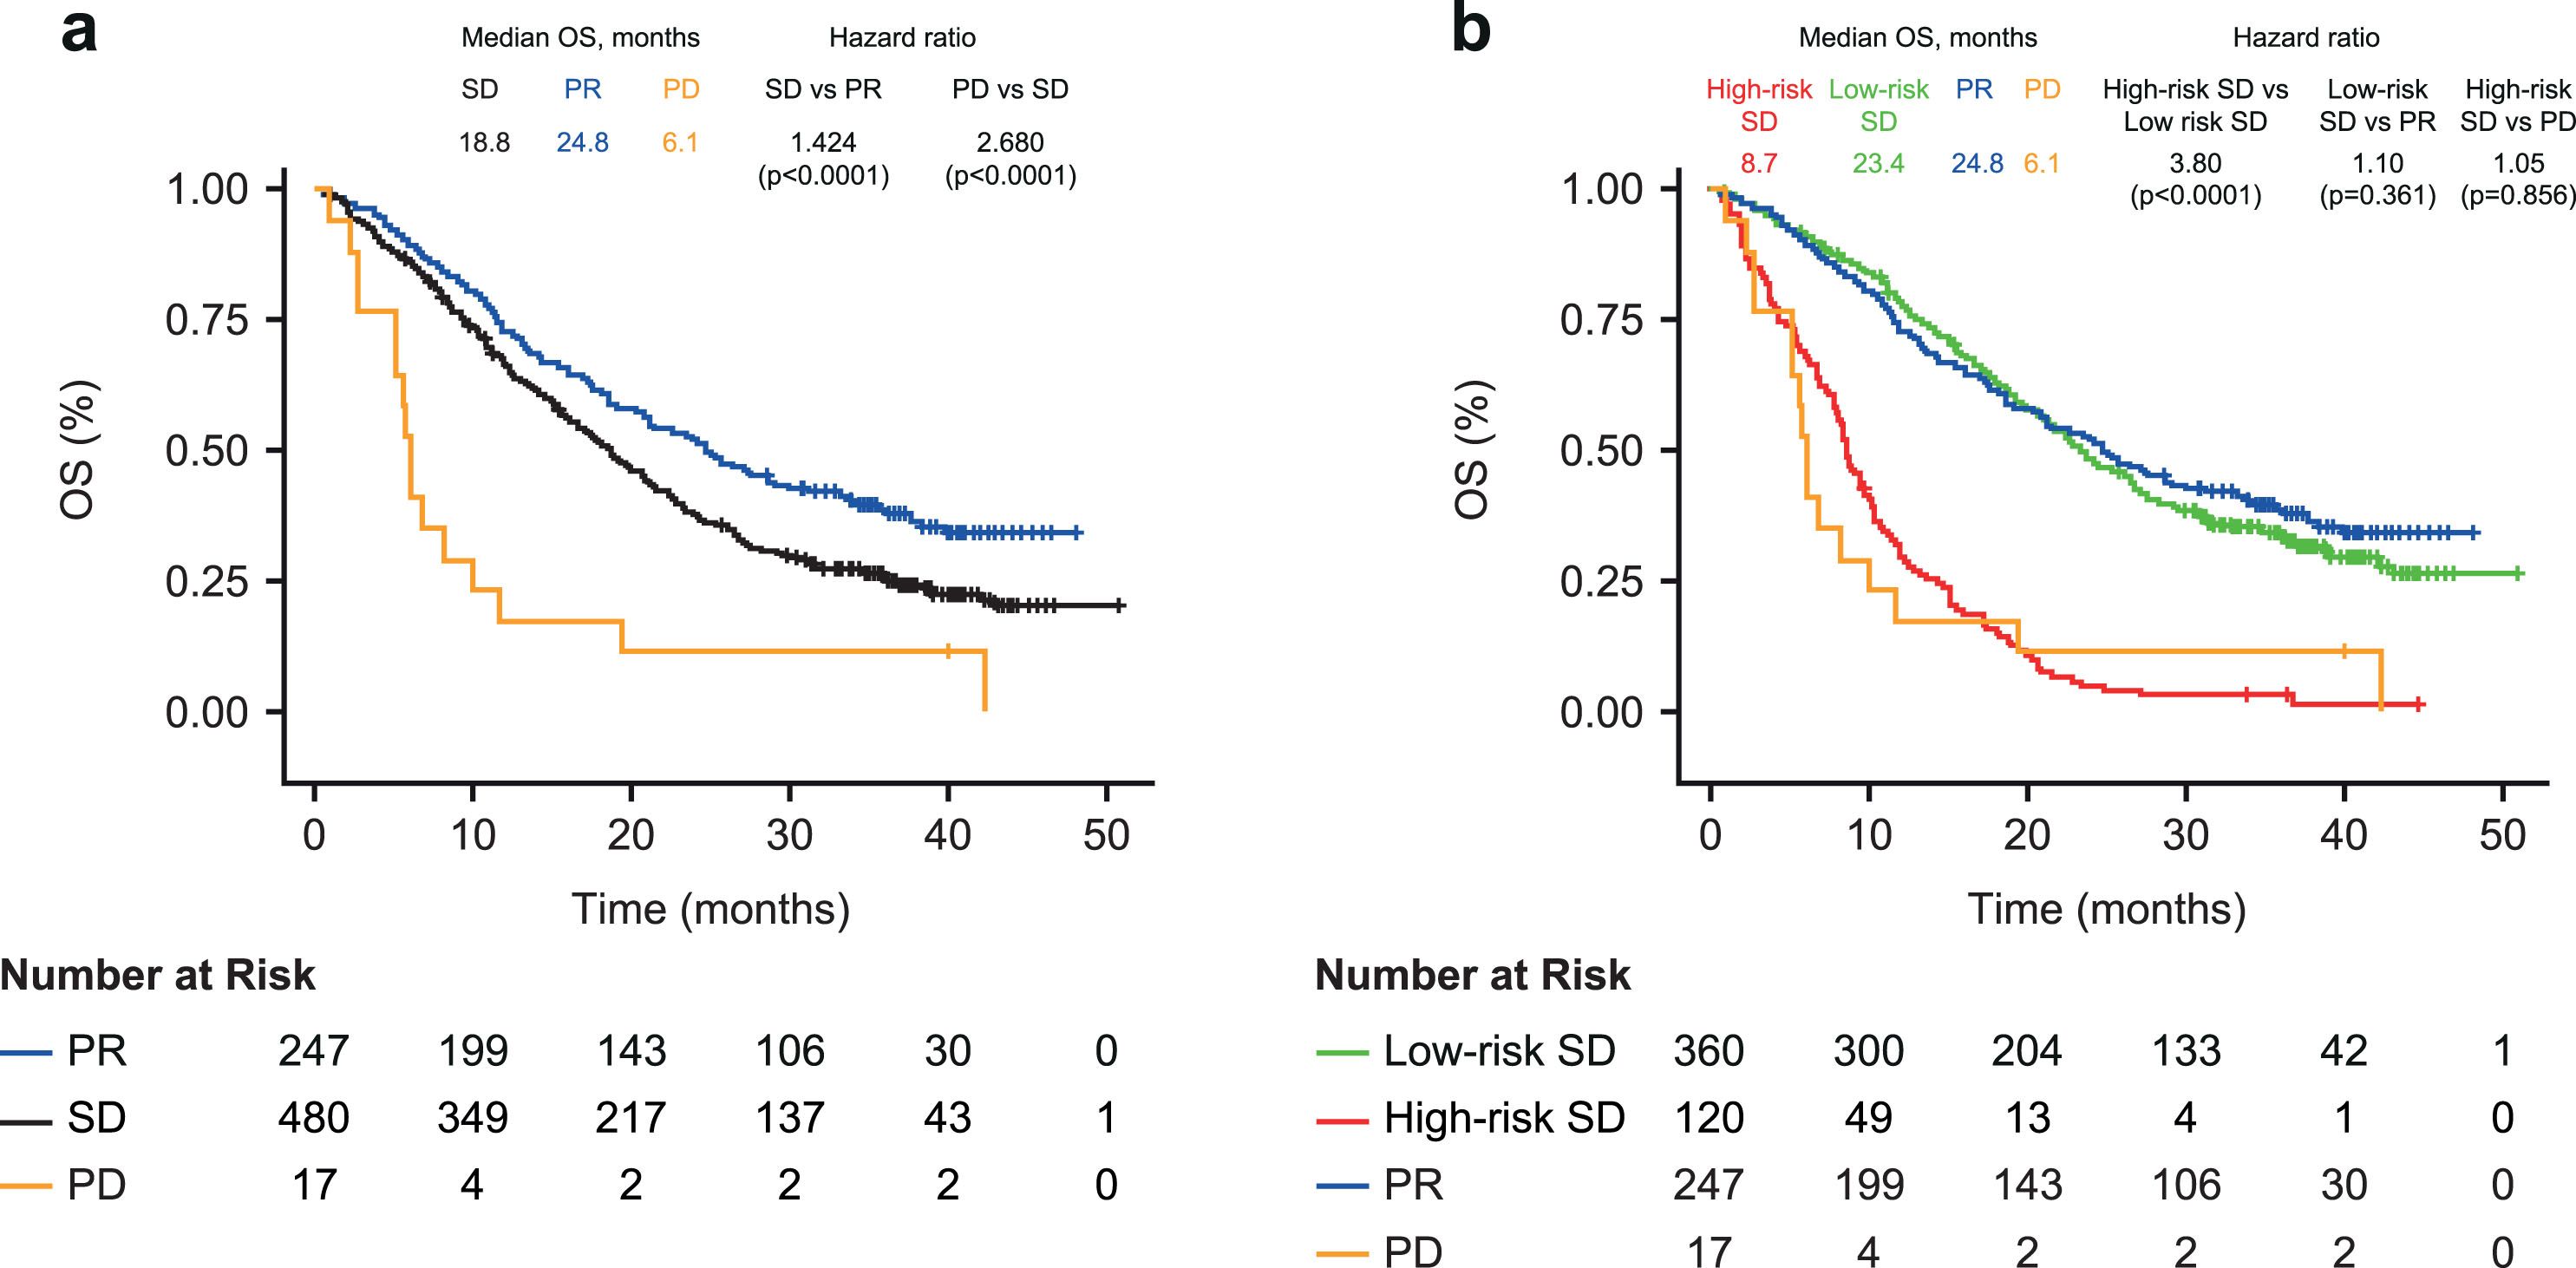
Using the two-biomarker combination model (cut-off optimized on the biomarker combination), the risk of death was almost 4-fold higher for the high-risk SD versus low-risk SD patients (median OS 8.7 vs 23.4 months; HR, 3.80, 95% CI 3.02–4.78; p < 0.0001; Fig. 2b). This finding was similar across the ACP and BCP treatment groups (median OS 8.8 vs 25.6 months and 7.9 vs 18.8 months; both HR 3.47), with a slightly higher risk observed in the ABCP treatment group (9.5 vs 26.5 months; HR 5.21; Table 3). OS was comparable between patients with SD in the biomarker low-risk group and those with PR on the first CT scan (median OS 23.4 vs 24.8 months; HR 1.10; 95% CI 0.898–1.34; p = 0.361); and between patients with SD in the biomarker high-risk group and those with PD on the first CT scan (8.7 vs 6.1 months; HR 1.05; 95% CI 0.621–1.77; p = 0.856).
Table 3
Hazard ratios for OS and PFS in patients with SD at the 6-week CT scan stratified into high- and low-risk groups by the CYFRA 21-1 + CA 125 biomarker combination, according to treatment group
| Treatment group | N | OS | PFS | ||||
| High-risk SD, Median (months) | Low-risk SD, Median (months) | HR (high- vs low-risk SDa) | High-risk SD, Median (months) | Low-risk SD, Median (months) | HR (high- vs low-risk SDa) | ||
| ACP: atezolizumab + carboplatin + paclitaxel | 174 | 8.8 | 25.6 | 3.47 | 4.0 | 6.8 | 3.79 |
| ABCP: atezolizumab + bevacizumab + carboplatin + paclitaxel | 153 | 9.5 | 26.5 | 5.21 | 5.1 | 10 | 2.74 |
| BCP: bevacizumab + carboplatin + paclitaxel | 153 | 7.9 | 18.8 | 3.47 | 3.8 | 7.9 | 2.56 |
aPatients with SD stratified as high- or low-risk according to biomarker value above or below optimized cut-offs. OS, overall survival; PFS, progression-free survival; SD, stable disease.
A similar pattern of results was observed when using univariate cut-offs for both CYFRA 21-1 and CA 125 to split patients into biomarker-stratified risk groups (Supplementary Figure 1). Patients with SD at first CT scan and with both markers elevated above the derived cut-offs (high-high) had a 4-fold increased risk of death compared with patients who had only one or neither marker elevated (7.0 vs 20.7 months; HR 3.96; 95% CI 2.89–5.42; p < 0.0001). OS was comparable between SD patients with both markers elevated (high-high) and patients with PD (7.0 vs 6.1 months; HR 1.31; 95% CI 0.74–2.32; p = 0.351). In patients with SD plus only one or neither biomarker elevated, the risk was slightly elevated compared with those with PR (median OS 20.7 vs 24.8 months; HR 1.29; 95% CI 1.07–1.57; p = 0.009).
Thus, overall, the newly defined two-biomarker combination defined high- and low-risk SD groups generally compared well with the CT-defined clear-cut response groups, PD and PR.
3.4Progression-free survival
Patients with SD at the first CT scan had a 40% higher risk of progression or death compared with patients with PR (median PFS 6.5 vs 8.0 months; HR 1.402; 95% CI 1.189–1.654; p < 0.0001; Fig. 3a). Within patients with SD, the risk of progression or death was 56% higher in patients with an increased SLD versus patients with a decreased SLD (HR 1.56; 95% CI 1.13–2.16; p = 0.008).
Fig. 3
Kaplan-Meier plot of progression-free survival in (a) Patients with partial response or stable disease at first CT scana (b) Cox-proportional hazard model including patients with SD stratified into high- and low-risk groups by biomarker combination (above or below optimized cut-off). a. At 6 weeks post treatment initiation. PFS, progression-free survival; PR, partial response; SD, stable disease.
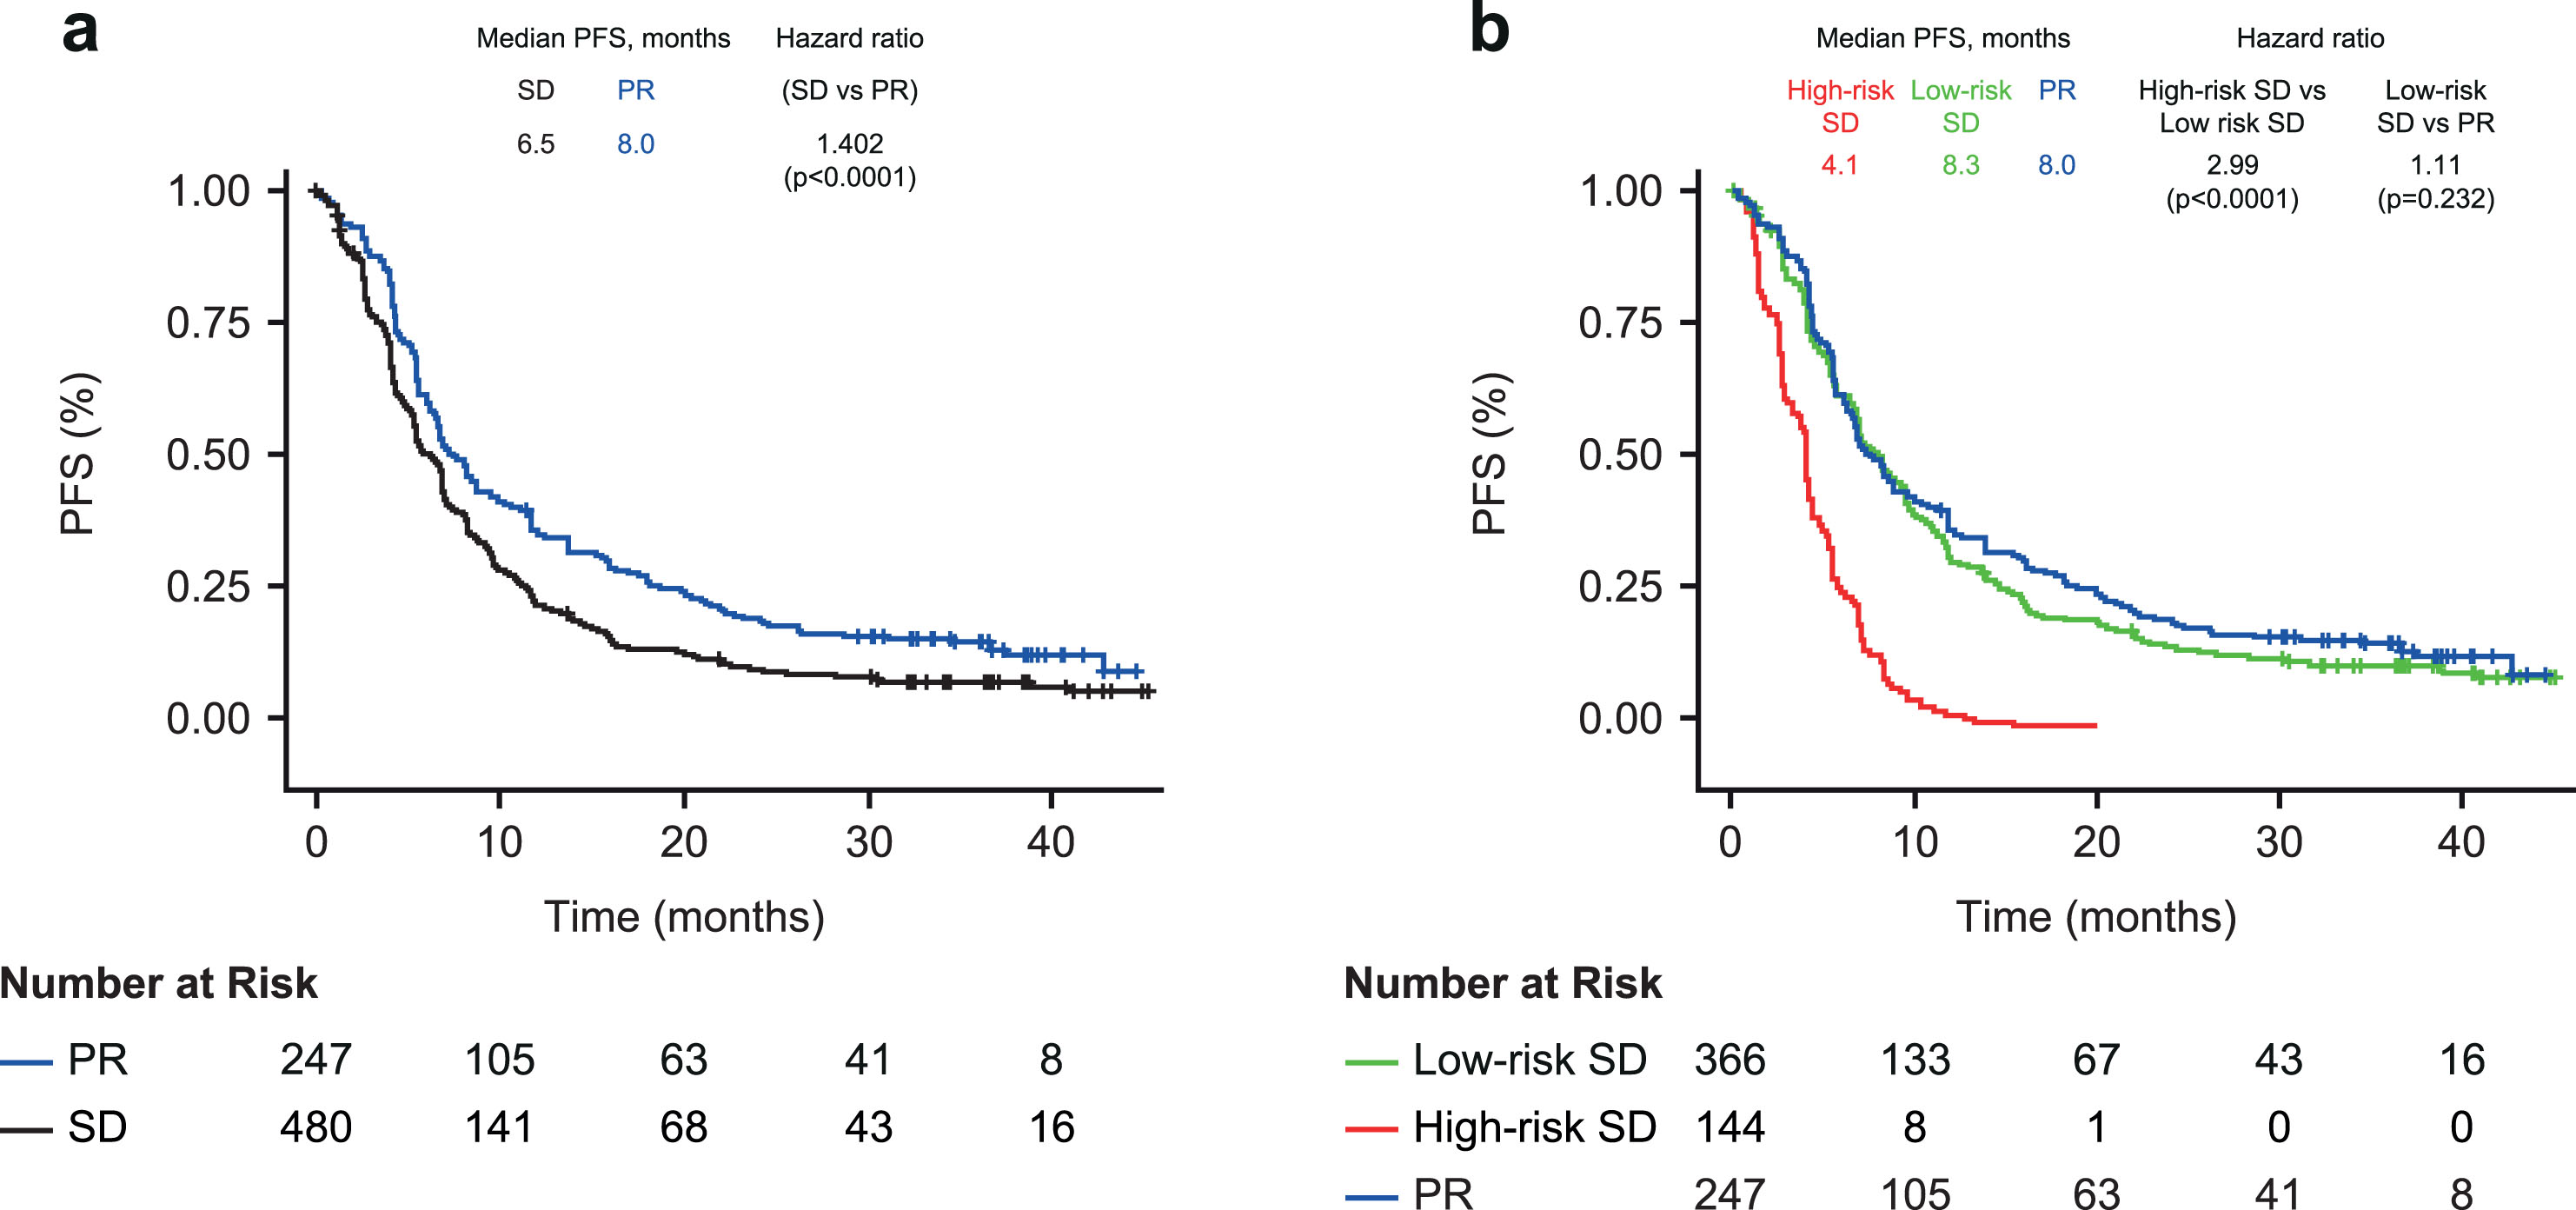
Using the two-biomarker combination model (CYFRA 21-1 + CA 125), the risk of progression or death was 3-fold higher in the high-risk versus low-risk SD group (4.1 vs 8.3 months; HR 2.99; 95% CI 2.42–3.68; p < 0.0001; Fig. 3b). CYFRA 21-1 + CA 125 also enabled risk discrimination of PFS within the individual treatment groups (HR 2.56–3.79; Table 3). PFS was comparable between patients with low-risk SD and those with PR on the first CT scan (8.3 vs 8.0 months; HR 1.11 95% CI 0.933–1.33; p = 0.232).
The findings were similar when using the simplified approach to stratify patients with SD (both markers elevated, high-high vs only one or neither marker elevated; Supplementary Figure 2). Patients with SD and both markers elevated (high-high) had a greater than 3-fold increased risk of progression or death compared to SD patients with only one or neither marker elevated (2.6 vs 6.9 months; HR 3.44; 95% CI 2.53–4.66; p < 0.0001). SD patients with one or neither marker elevated had a slightly higher risk of progression than patients with PR (median PFS 6.9 vs 8.0 months; HR 1.30; 95% CI 1.10–1.54; p = 0.002).
4Discussion
The data presented here demonstrate that a biomarker score generated using a combination of two serum tumor biomarkers (CYFRA 21-1 + CA 125) can determine risk for future OS and PFS in NSCLC patients with SD (per RECIST v1.1) at the first CT scan 6 weeks after treatment with immune checkpoint inhibitor (atezolizumab), anti-angiogenic agent (bevacizumab) and chemotherapy combinations. Our results show that patients in the high-risk SD group, similarly to those with PD at the initial CT scan, do not show survival benefit, while patients in the low-risk SD group show similar OS to patients with PR, for each of the three treatment regimens, suggesting these serum tumor biomarker risk scores are treatment-agnostic. Treatment is often continued in patients with SD despite the fact that their tumors may not be responding [4]. Although additional immune-related RECIST has been proposed for the assessment of novel patterns of response to immunotherapies, these complex criteria are difficult to implement within routine clinical practice [31, 40]. Pseudo-growth/progression can lead to misclassification of CT response, as can dissociated response (the co-existence of both responding and non-responding lesions within the same patient) [10]. We also found that categorizing SD patients by their change in lesion size (either increased or decreased SLD) provided no significant prognostic value for OS and relatively low prognostic value for PFS. Therefore, different, more widely accessible methods of assessment of treatment response are needed as an adjunct to complement routine CT assessment.
Our retrospective exploratory analysis suggests that serum tumor biomarker assessment may have clinical significance. Patients who are not likely to benefit from their first line of therapy can be easily identified and thus spared from unnecessary treatment and possible severe adverse events [39]. Therefore, identifying those patients with serum tumor biomarkers could help to minimize side effects and avoid unnecessary treatment costs. Additional prospective studies might be conducted to confirm these findings and further evaluate whether SD high-risk patients would benefit from switching to a different treatment regimen.
Our findings are consistent with another lung cancer multi-marker (LCMM) study, which reported that when patients with SD were split into high- and low-risk groups using biomarker median value, CYFRA 21-1 had the highest prognostic value for adenocarcinoma and CA125 for squamous cell carcinoma [40]. While addition of CEA improved their prognostic value in the LCMM study, inclusion of additional tumor biomarkers did not improve the predictive performance of the two-marker model in our analysis, though it should be noted that our study only tested patients with adenocarcinoma, and most patients in the LCMM study did not receive any immunotherapy. Another study comparing circulating tumor DNA (ctDNA) and serum tumor markers in measuring changes in biomarker concentrations in patients with NSCLC and small-cell lung cancer found both ctDNA and CA 125 showed substantial agreement with CT scan response, while moderate agreement was reported between CYFRA 21-1 and CT response [41]. Combined, these studies suggest an opportunity to use tumor biomarkers CYFRA 21-1 and CA 125 for personalizing treatment strategies in patients with NSCLC that may have indeterminate response by CT scan.
Developments in artificial intelligence and machine learning applications might further improve the accuracy and ease of implementation of biomarker models. In the future, the combined technologies of imaging and biomarkers might help guide treatment decisions for patients with SD at the first CT scan after treatment, by discriminating risk.
The fact that both the Cox model and the simplified cut-off model generated the same conclusion, is a notable strength of our analysis and findings. Limitations of this study are that the biomarker analysis was established post hoc, and was not included in the original IMpower150 study design. While modest, there are differences in the distribution of responses in this biomarker subset compared with the IMpower150 primary analysis population. The analysis also evaluated biomarkers on-treatment (i.e., as a post-baseline variable, rather than a baseline factor), thus cannot rule out imbalances that may develop in prognostic factors and more sophisticated modelling may be needed to account for potentially confounding factors such as anti-drug antibodies. It should also be noted that the biomarkers appear to be prognostic regardless of treatment received, and that among high-risk patients the ABCP arm still outperformed the BCP arm –so their utility for guiding treatment decisions (in this case, with or without atezolizumab) requires further investigation.
5Conclusions
The serum tumor biomarker score shows potential for providing important prognostic information on patient response to immunotherapy- chemotherapy combination regimens. Serum tumor biomarker testing is relatively quick and easy to implement, and has been employed in routine clinical practice for a variety of tumor types, with validated tests routinely available (if not yet indicated for this use) in most countries. Further prospective clinical studies to support the use of serum tumor biomarkers as an adjunct to imaging to evaluate NSCLC patient prognosis are warranted.
Author contributions
CONCEPTION: BW, AM, NP and WZ
DATA CURATION: AM and WZ
LAB ANALYSES: SH
ANALYSES OF DATA: AM and VR
PREPARATION OF THE MANUSCRIPT: AM, NP and DC
REVISION FOR IMPORTANT INTELLECTUAL CONTENT: AM, BW and MR
SUPERVISION: BW, DC and MR
Review and approval of the manuscript: All
Conflict of interest
AM: employee of Roche Diagnostics GmbH (Penzberg, Germany).
DC: employee of Roche Diagnostics International (Rotkreuz, Switzerland) and hold stock/stock options in CSL Limited ASX and F. Hoffmann-La Roche.
VR: employee of Roche Diagnostics GmbH (Penzberg, Germany) and hold stocks/stock options in F. Hoffmann-La Roche.
BW: employee of Roche Diagnostics GmbH (Penzberg, Germany) and hold stocks/stock options in F. Hoffmann-La Roche.
SH: Research funding or honoraria from Roche Diagnostics, Bristol Myers Squibb, Merck KgaA, Sysmex Inostics and Volition SPRL. SH serves as Editorial Board member of Tumor Biology but had no involvement in the peer review process of this article.
WZ: Employee of Genentech Roche and hold stocks/stock options in F. Hoffmann-La Roche.
MR: Honoraria for lectures and consultancy from Roche.
KS: Employee of Genentech Roche and holds stocks/stock options in F. Hoffmann-La Roche.
MAS: Research funding from AstraZeneca, Genentech, Spectrum, Daiichi –Sankyo, Takeda, Novartis, Merck, and Speaker bureau from AstraZeneca, Genentech, BMS, Celgene, Takeda, Novartis, Merck, BluePrint
DS: Employee of Genentech Roche and holds stocks/stock options in F. Hoffmann-La Roche.
NP: Employee of Genentech Roche and holds stocks/stock options in F. Hoffmann-La Roche.
Data availability
The study was conducted in accordance with applicable regulations. Requests concerning the data supporting the findings of this study can be directed to for consideration.
Funding
The study was sponsored by Roche Diagnostics GmbH, Mannheim, Germany.
Acknowledgments
The study was sponsored by Roche Diagnostics GmbH Mannheim. The authors would like to thank the patients and their families for their contribution to the study. The authors would also like to thank Matthias Neumair (Roche Diagnostics) for his support with some of the follow-up analyses. Editorial support was provided by Juliet George, Jade Drummond and Helen Brereton of inScience Communications, Springer Healthcare Ltd (UK) and was funded by Roche Diagnostics International Ltd (Rotkreuz, Switzerland). COBAS, COBAS C, and COBAS E are trademarks of Roche. The assays used in this analysis are currently not specifically intended to be used for aid in the management of NSCLC patients in US or in CE-markets. All other product names and trademarks are the property of their respective owners.
References
[1] | World Health Organization. Cancer Fact Sheet 2022 [Available from: https://www.who.int/news-room/factsheets/detail/cancer. |
[2] | Wang M , Herbst RS , Boshoff C . Toward personalized treatment approaches for non-small-cell lung cancer. Nat Med. (2021) ;27: (8):1345–56. doi: 10.1038/s41591-021-01450-2. |
[3] | Ettinger DS , Wood DE , Aisner DL , Akerley W , Bauman JR , Bharat A , et al. NCCN Guidelines insights: Non-small cell lung cancer, version 2. J Natl Compr Canc Netw. (2021) ;19: (3):254–66. doi: 10.6004/jnccn.2021.0013. |
[4] | Planchard D , Popat S , Kerr K , Novello S , Smit EF , Faivre-Finn C , et al. Metastatic non-small cell lung cancer: ESMO Clinical Practice Guidelines for diagnosis, treatment and follow-up. Ann Oncol. (2018) ;29: (Suppl 4):iv192–iv237. doi: 10.1093/annonc/mdy275. |
[5] | Postmus PE , Kerr KM , Oudkerk M , Senan S , Waller DA , Vansteenkiste J , et al. Early and locally advanced non-small-cell lung cancer (NSCLC):ESMO Clinical Practice Guidelines for diagnosis, treatment and follow-up. Ann Oncol. (2017) ;28: (suppl_4):iv1–iv21. doi: 10.1093/annonc/mdx222. |
[6] | Konig D , Savic Prince S , Rothschild SI . Targeted therapy in advanced and metastatic non-small cell lung cancer. An update on treatment of the most important actionable oncogenic driver alterations. Cancers (Basel). (2021) ;13: (4):804. doi: 10.3390/cancers13040804. |
[7] | Nishino M , Hatabu H , Johnson BE , McLoud TC . State of the art: Response assessment in lung cancer in the era of genomic medicine. Radiology. (2014) ;271: (1):6–27. doi: 10.1148/radiol.14122524. |
[8] | Nishino M , Jagannathan JP , Krajewski KM , O’Regan K , Hatabu H , Shapiro G , et al. Personalized tumor response assessment in the era of molecular medicine: cancer-specific and therapy-specific response criteria to complement pitfalls of RECIST. AJR Am J Roentgenol. (2012) ;198: (4):737–45. doi: 10.2214/AJR.11.7483. |
[9] | Borcoman E , Kanjanapan Y , Champiat S , Kato S , Servois V , Kurzrock R , et al. Novel patterns of response under immunotherapy. Ann Oncol. (2019) ;30: (3):385–96. doi: 10.1093/annonc/mdz003. |
[10] | Humbert O , Chardin D . Dissociated response in metastatic cancer: An atypical pattern brought into the spotlight with immunotherapy. Front Oncol. (2020) ;10: :566297. doi: 10.3389/fonc.2020.566297. |
[11] | Bai JW , Qiu SQ , Zhang GJ . Molecular and functional imaging in cancer-targeted therapy: current applications and future directions. Signal Transduct Target Ther. (2023) ;8: (1):89. doi: 10.1038/s41392-023-01366-y. |
[12] | Dimou A , Sherman C , Wrangle J . Imaging in advanced non-small cell lung cancer: A medical oncology perspective. J Thorac Imaging. (2016) ;31: (4):238–42. doi: 10.1097/rti.0000000000000219. |
[13] | Woo M , Lowe SC , Devane AM , Gimbel RW . Intervention to reduce interobserver variability in computed tomographic measurement of cancer lesions among experienced radiologists. Curr Probl Diagn Radiol. (2021) ;50: (3):321–7. doi: 10.1067/j.cpradiol.2020.01.008. |
[14] | Kammer MN , Massion PP . Noninvasive biomarkers for lung cancer diagnosis, where do we stand? J Thorac Dis. (2020) ;12: (6):3317–30. doi: 10.21037/jtd-2019-ndt-10. |
[15] | Cedrés S , Nuñez I , Longo M , Martinez P , Checa E , Torrejón D , et al. Serum tumor markers CEA, CYFRA21-1, andCA-125 are associated with worse prognosis in advancednon-small-cell lung cancer (NSCLC). Clin Lung Cancer. (2011) ;12: (3):172–9. doi: 10.1016/j.cllc.2011.03.019. |
[16] | Giannakouros P , Comamala M , Matte I , Rancourt C , Piche A . MUC16 mucin (CA125) regulates the formation of multicellular aggregates by altering beta-catenin signaling. Am J Cancer Res. (2015) ;5: (1):219–30. |
[17] | Yu D , Du K , Liu T , Chen G . Prognostic value of tumor markers, NSE, CA125 and SCC, in operable NSCLC Patients. Int J Mol Sci. (2013) ;14: (6):11145–56. doi: 10.3390/ijms140611145. |
[18] | Chen ZQ , Huang LS , Zhu B . Assessment of seven clinical tumor markers in diagnosis of non-small-cell lung cancer. Dis Markers. (2018) ;2018: :9845123. doi: 10.1155/2018/9845123. |
[19] | Liu X , Wang C , Zhang L , Gu H , Yang J , Wang Y , et al. Prognostic and diagnostic values of circulating tumor cells and tumor markers for lung cancer. Clin Lab. (2021) ;67: (4). doi: 10.7754/Clin.Lab.2020.200654. |
[20] | Sato Y , Fujimoto D , Uehara K , Shimizu R , Ito J , Kogo M , et al. The prognostic value of serum CA 19-9 for patients with advanced lung adenocarcinoma. BMC Cancer. (2016) ;16: (1):890. doi: 10.1186/s12885-016-2897-6. |
[21] | Molina R , Marrades RM , Auge JM , Escudero JM , Vinolas N , Reguart N , et al. Assessment of a combined panel of six serum tumor markers for lung cancer. Am J Respir Crit Care Med. (2016) ;193: (4):427–37. doi: 10.1164/rccm.201404-0603OC. |
[22] | Holdenrieder S , Wehnl B , Hettwer K , Simon K , Uhlig S , Dayyani F . Carcinoembryonic antigen and cytokeratin-19 fragments for assessment of therapy response in non-small cell lung cancer: a systematic review and meta-analysis. Br J Cancer. (2017) ;116: (8):1037–45. doi: 10.1038/bjc.2017.45. |
[23] | Bingle L , Cross SS , High AS , Wallace WA , Rassl D , Yuan G , et al. WFDC2 (HE4):a potential role in the innate immunity of the oral cavity and respiratory tract and the development of adenocarcinomas of the lung. Respir Res. (2006) ;7: :61. doi: 10.1186/1465-9921-7-61. |
[24] | He YP , Li LX , Tang JX , Yi L , Zhao Y , Zhang HW , et al. HE4 as a biomarker for diagnosis of lung cancer: A meta-analysis. Medicine (Baltimore). (2019) ;98: (39):e17198. doi: 10.1097/md.0000000000017198. |
[25] | Yamashita S , Tokuishi K , Hashimoto T , Moroga T , Kamei M , Ono K , et al. Prognostic significance of HE4 expression in pulmonary adenocarcinoma. Tumour Biol. (2011) ;32: (2):265–71. doi: 10.1007/s13277-010-0118-5. |
[26] | Li Q , Sang S . Diagnostic value and clinical significance of combined detection of serum markers CYFRA21-1, SCC Ag, NSE, CEA and ProGRP in non-small cell lung carcinoma. Clin Lab. (2020) ;66: (11). doi: 10.7754/Clin.Lab.2020.191243. |
[27] | Svaton M , Blazek J , Krakorova G , Buresova M , Teufelova Z , Vodicka J , et al. Laboratory parameters are possible prognostic markers in patients with advanced-stage NSCLC treated with bevacizumab plus chemotherapy. J Cancer. (2021) ;12: (19):5753–9. doi: 10.7150/jca.58851. |
[28] | Wang L , Wang D , Zheng G , Yang Y , Du L , Dong Z , et al. Clinical evaluation and therapeutic monitoring value of serum tumor markers in lung cancer. Int J Biol Markers. (2016) ;31: (1):e80–7. doi: 10.5301/jbm.5000177. |
[29] | Wilop S , Crysandt M , Bendel M , Mahnken AH , Osieka R , Jost E . Correlation of C-reactive protein with survival and radiographic response to first-line platinum-based chemotherapy in advanced non-small cell lung cancer. Onkologie. (2008) ;31: (12):665–70. doi: 10.1159/000165054. |
[30] | Patil NS , Zou W , Mocci S , Sandler A , Ballinger M , Flynn S , et al. C-reactive protein reduction post treatment is associated with improved survival in atezolizumab (anti-PD-L1) treated non-small cell lung cancer patients. PLoS One. (2021) ;16: (2):e0246486. doi: 10.1371/journal.pone.0246486. |
[31] | Lindenmann J , Fink-Neuboeck N , Taucher V , Pichler M , Posch F , Brcic L , et al. Prediction of Postoperative Clinical Outcomes in Resected Stage I Non-Small Cell Lung Cancer Focusing on the Preoperative Glasgow Prognostic Score. Cancers (Basel). (2020) ;12: (1). doi: 10.3390/cancers12010152. |
[32] | Socinski MA , Jotte RM , Cappuzzo F , Orlandi F , Stroyakovskiy D , Nogami N , et al. Atezolizumab for first-line treatment of metastatic nonsquamous NSCLC. N Engl J Med. (2018) ;378: (24):2288–301. doi: 10.1056/NEJMoa1716948. |
[33] | Administration UFD. FDA approves atezolizumab with chemotherapy and bevacizumab for first-line treatment of metastatic non-squamous NSCLC 2018 [Available from: https://www.fda.gov/drugs/fda-approves-atezolizumabchemotherapy-and-bevacizumab-first-line-treatment-metastatic-non-squamous. |
[34] | Luo J , Wu S , Rizvi H , Zhang Q , Egger JV , Osorio JC , et al. Deciphering radiological stable disease to immune checkpoint inhibitors. Ann Oncol. (2022) ;33: (8):824–35. doi: 10.1016/j.annonc.2022.04.450. |
[35] | Grossi F . Management of non-small cell lung in cancer patients with stable disease. Drugs. (2012) ;72 Suppl 1: :20–7. doi: 10.2165/1163013-S0-000000000-00000. |
[36] | Eisenhauer EA , Therasse P , Bogaerts J , Schwartz LH , Sargent D , Ford R , et al. New response evaluation criteria in solid tumours: revised RECIST guideline (version 1. 1). Eur J Cancer. (2009) ;45: (2):228–47. doi: 10.1016/j.ejca.2008.10.026. |
[37] | Roche Diagnostics GmBH. Elecsys® CYFRA 21-1, instructions for use. August 2021. |
[38] | Roche Diagnostics GmBH. Elecsys® CA 125 II, instructions for use. May 2022. |
[39] | Barbee MS , Ogunniyi A , Horvat TZ , Dang TO . Current status and future directions of the immune checkpoint inhibitors ipilimumab, pembrolizumab, and nivolumab in oncology. Ann Pharmacother. (2015) ;49: (8):907–37. doi: 10.1177/1060028015586218. |
[40] | Muley T , Schneider M , Meister M , Thomas M , Heussel C , Kriegsmann M , et al. Serum biomarkers enhance prognostic value of computed tomography (CT) in patients with non-small cell lung cancer (NSCLC). J Thorac Oncol. (2021) ;16: (10):S1028–S9. doi: 10.1016/j.jtho.2021.08.364. |
[41] | de Kock R , Borne BVD , Soud MY , Belderbos H , Stege G , de Saegher M , et al. Circulating biomarkers for monitoring therapy response and detection of disease progression in lung cancer patients. Cancer Treat Res Commun. (2021) ;28: :100410. doi: 10.1016/j.ctarc.2021.100410. |
[42] | Eze C , Schmidt-Hegemann NS , Sawicki LM , Kirchner J , Roengvoraphoj O , Kasmann L , et al. PET/CT imaging for evaluation of multimodal treatment efficacy and toxicity in advanced NSCLC-current state and future directions. Eur J Nucl Med Mol Imaging. (2021) ;48: (12):3975–89. doi: 10.1007/s00259-021-05211-8. |


