
CYFRA 21-1, CA 125 and CEA provide additional prognostic value in NSCLC patients with stable disease at first CT scan
Abstract
BACKGROUND:
Serum tumor markers (STM) may complement imaging and provide additional clinical information for patients with non-small cell lung cancer (NSCLC).
OBJECTIVE:
To determine whether STMs can predict outcomes in patients with stable disease (SD) after initial treatment.
METHODS:
This single-center, prospective, observational trial enrolled 395 patients with stage III/IV treatment-naïve NSCLC; of which 263 patients were included in this analysis. Computed Tomography (CT) scans were performed and STMs measured before and after initial treatment (two cycles of chemotherapy and/or an immune checkpoint inhibitor or tyrosine kinase inhibitor); analyses were based on CT and STM measurements obtained at first CT performed after cycle 2 only PFS and OS were analyzed by Kaplan-Meier curves and Cox-proportional hazard models.
RESULTS:
When patients with SD (n = 100) were split into high- and low-risk groups based on CYFRA 21-1, CEA and CA 125 measurements using an optimized cut-off, a 4-fold increase risk of progression or death was estimated for high- vs low-risk SD patients (PFS, HR 4.17; OS, 3.99; both p < 0.0001). Outcomes were similar between patients with high-risk SD or progressive disease (n = 35) (OS, HR 1.17) and between patients with low-risk SD or partial response (n = 128) (PFS, HR 0.98; OS, 1.14).
CONCLUSIONS:
STMs can provide further guidance in patients with indeterminate CT responses by separating them into high- and low-risk groups for future PFS and OS events.
1Introduction
Lung cancer is the second most commonly diagnosed cancer and the leading cause of cancer mortality worldwide, with an estimated 2.2 million new cases and 1.8 million deaths reported in 2020 [1]. Approximately 85% of all cases of lung cancer are non-small cell lung cancer (NSCLC), with the most common histological subtypes of NSCLC being adenocarcinoma (ADC; ∼40% of all cases) and squamous cell carcinoma (SCC; 25–30% of all cases) [2]. As lung cancer symptoms often do not appear until the disease has progressed into the late stages, the majority of cases (∼75%) are diagnosed at an advanced stage and overall survival (OS) rates are poor [3, 4].
Current treatment options for NSCLC include surgery, radiation therapy, chemotherapy, and immune checkpoint inhibitors, with adjuvant chemotherapy recommended for patients with stage II and IIIA NSCLC [5, 6]. Small molecule tyrosine kinase inhibitors (TKIs) have been shown to improve survival and are recommended for patients with advanced NSCLC who are positive for oncogenic driver mutations [5]. In patients with locally advanced NSCLC without an oncogenic driver, immunotherapies are typically recommended after concurrent chemoradiation, with specific guidance being based on PD-L1 expression levels and response to previous treatments [5].
Imaging modalities, such as computed tomography (CT) or positron emission tomography (PET), are widely used for clinical staging, monitoring treatment response, and detecting recurrent or residual disease [7]. Response criteria based on cross-sectional imaging results have been successfully used in numerous randomized clinical trials, and CT is currently the method of choice for assessing treatment response [8]. However, CT-based response criteria were developed in patients receiving cytotoxic chemotherapy as a means of evaluating treatment efficacy based on the extent of tumor shrinkage [8]. While there were indications that tumor measurement by CT was subject to considerable inter-observer variability [9–12], World Health Organization criteria and later response evaluation criteria in solid tumors (RECIST) were adopted as the gold standard for assessing treatment response in clinical trials [8, 13]. At present, bi- and unidirectional measurements remain the mainstay of NSCLC response assessment in routine clinical practice [5, 14]. Nevertheless, objective tumor response on imaging shows an imperfect correlation with patient outcomes, and its utility has been challenged in recent studies assessing non-chemotherapeutic treatments [15–18].
According to RECIST 1.1 criteria, the term stable disease (SD) is assigned to measurable lesions that have neither sufficient tumor shrinkage to qualify as a partial response (PR; ≥30% decrease in size), nor sufficient growth to qualify as progressive disease (PD; ≥20% increase in size) [8]. While SD is generally considered to reflect clinical benefit for patients in these advanced stages, it can also be thought of as an indeterminate response, encompassing patients whose tumors fall between the cutoffs defined for PD or PR [8]. Multiple trials have shown that a substantial proportion of patients can have SD despite not receiving active therapy, and the identification of patients with SD who are indeed benefiting from therapy remains a fundamental challenge [13].
With the introduction of targeted therapies and immunotherapies for NSCLC, additional tools are now needed to better evaluate treatment efficacy [17–21]. One such tool is serum tumor marker (STM) testing, which can be used to complement radiologic assessments and may provide additional clinical information for patients undergoing treatment. Several studies in patients with lung cancer have demonstrated that STMs, such as cytokeratin 19 fragment 21-1 (CYFRA 21-1), carcinoembryonic antigen (CEA), progastrin-releasing peptide (ProGRP) and neuron-specific enolase (NSE) can be used to determine lung cancer subtype, and have been shown to correlate with tumor stage, prognosis, and response to therapy [22–26]. Circulating tumor DNA (ctDNA) has also been shown to have a potential role in monitoring response to treatment [27]; however, it is currently limited by cost and turnaround time and can only be applied to mutation-positive patients. Despite the emerging evidence supporting a role for STMs in monitoring treatment response in NSCLC, they have not yet been incorporated into clinical guidelines.
Here, we present the results of the Lung Cancer Multi-Marker (LCMM) study, which assessed a number of potential biomarker and biomarker combinations using samples from patients with a histologically-confirmed diagnosis of NSCLC. While the clinical question of whether a therapy should be continued is clearly answered when patients show PR or PD in CT scans at staging examinations, additional information would be helpful in SD patients for better decision making. Therefore, we focused this analysis on the subgroup of patients identified as having SD at a CT scan performed after the first two treatment cycles. The aim was to understand how STMs might complement imaging and whether they can provide additional information on the risk for disease progression or death in patients with SD after initial treatment.
2Materials and methods
2.1Study population
The LCMM prospective, observational study enrolled patients≥18 years of age with previously untreated stage III or IV NSCLC, an Eastern Cooperative Oncology Group (ECOG) performance score of 0–2 and a treatment plan for at least four cycles of chemotherapy and/or an immune checkpoint inhibitor or TKI (as detailed in Table 1) at the Thoraxklinik, University Hospital Heidelberg between December 2015 and April 2020. Patients with unobtainable blood samples, a history of secondary malignancy, or who were pregnant or breastfeeding were excluded from the study. The sub-group analysis reported here was limited to patients with either an ADC or SCC and who had data available from a CT scan performed after cycle 2 of first-line therapy. The study was approved by the ethics committee of the University of Heidelberg (MZmo-407/2015) and was performed in accordance with the Declaration of Helsinki.
Table 1
Patient demographics and treatment schemes
| Patients with PR at first CT after Cycle 2 (N = 128) | Patients with SD at first CT after Cycle 2 (N = 100) | Patients with PD at first CT after Cycle 2 (N = 35) | |
| Mean age, years (standard dev.) | 66.0 (9.8) | 67.3 (8.7) | 63.1 (8.4) |
| Male sex, n (%) | 74 (57.8) | 69 (69.0) | 22 (62.9) |
| Smoking status, n (%) | |||
| Smoker | 44 (34.4) | 34 (34.0) | 19 (54.3) |
| Ex-smoker | 66 (51.6) | 58 (58.0) | 13 (37.1) |
| Never smoked | 18 (14.1) | 8 (8.0) | 3 (8.6) |
| UICC stage, n (%) | |||
| III | 41 (32.0) | 27 (27.0) | 3 (8.6) |
| IV | 87 (68.0) | 73 (73.0) | 32 (91.4) |
| ECOG PS, n (%) | |||
| 0 | 64 (50.0) | 50 (50.0) | 17 (48.6) |
| 1 | 64 (50.0) | 49 (49.0) | 18 (51.4) |
| 2 | – | 1 (1.0) | – |
| NSCLC histopathology, n (%) | |||
| ADC | 90 (70.3) | 76 (76.0) | 27 (77.1) |
| SCC | 38 (29.7) | 24 (24.0) | 8 (22.9) |
| Treatment until first CT after Cycle 2, n (%) | |||
| Platinum-based combinationa | 88 (68.9) | 71 (71.0) | 27 (80.0) |
| Platinum-freeb | 4 (3.1) | 6 (6.0) | – |
| TKI ± radiotherapyc | 21 (16.4) | 8 (8.0) | 1 (2.9) |
| ICI alone or in combinationd | 9 (7.0) | 12 (12.0) | 5 (14.3) |
| Investigational treatmente | 5 (3.9) | 3 (3.0) | 1 (2.9) |
| Median time from therapy initiation to, days: | |||
| First CT scan | 45.5 | 43.0 | 44.0 |
| Biomarker measurement | 46.0 | 44.0 | 47.0 |
All values n (%), unless otherwise stated. ADC, adenocarcinoma; CT, computed tomography; ECOG, Eastern Cooperative Oncology Group; ICI, immune checkpoint inhibitor; PR, partial response; SCC, squamous cell carcinoma; SD, stable disease; TKI, tyrosine kinase inhibitor; UICC, Union for International Cancer Control. aPlatinum-based therapy included carboplatin and cisplatin. bPlatinum free therapy included etoposide, gemcitabine, nab-paclitaxel, paclitaxel, pemetrexed, vincristine, vinorelbine, doxorubicin, cyclophosphamide, docetaxel, tomudex, topotecan and trofosfamide. cTKI (EGFR) included afatinib, erlotinib, gefitinib and osimertinib. TKI (ALK) included alectinib, ceritinib and crizotinib. dICI (PD) were atezolizumab, nivolumab, pembrolizumab; ICI (CTLA) was ipilimumab. eTreatment type was not captured.
2.2Study objectives
The main objective was to assess the prognostic value of STMs in monitoring treatment success by testing whether patients with SD on CT after the first two cycles of therapy can be differentiated into high- and low-risk groups based on STM levels, with separate analyses for progression-free survival (PFS) and OS.
2.3Efficacy assessments
Following initial treatment, patients were defined as having PR, SD or PD based on results from the first CT scan performed after treatment cycle 2 (maximum time between administration of the second cycle and the first CT was 60 days). Tumor response on CT was defined by RECIST v1.1 and evaluated by medical staff at the Thoraxklinik [11]. PFS was defined as the time from treatment start date to disease progression date on CT, death from any cause or the last observation. Patients still alive and without evidence of recurrence were censored. OS was defined as the time from the treatment start date to the date of the last observation or the date of death from any cause. Patients still alive were censored.
2.4Sample collection and biomarker evaluation
Venous blood samples were collected from each patient at baseline and at each routine visit as applicable. Samples of minimum 5 mL extracted blood serum (S-Monovette Serum-Gel, 7.5 mL, Sarstedt GmbH, Nürmbrecht, Germany) were centrifuged within 1 hour of venipuncture and the serum was divided into a minimum of three 500μL aliquots and stored frozen below –70°C. Samples were shipped on dry ice to a certified laboratory conducting quality-controlled measurements. Samples were then thawed and processed in batches. Measurements were performed using a panel of eight electrochemiluminescence immunoassays (ECLIA) for in vitro diagnostics biomarkers (Elecsys® assays: CEA, ProGRP, NSE, CYFRA 21-1, SCC, cancer antigen 15-3 [CA 15-3], CA 125 and HE4) on a cobas® e 411 analyzer from Roche Diagnostic Solutions (Mannheim, Germany). The individual biomarkers with the highest prognostic value were assessed in two and three biomarker combinations to predict PFS or OS in patients identified as having SD at the first CT scan performed after two treatment cycles (Supplementary Figure 1 and Supplementary Table 1).
2.5Statistical analysis
Patient demographics and disease characteristics were summarized using descriptive statistics. Risk prediction for PFS and OS was compared between subgroups defined by CT response or biomarker results using Cox regression models and Kaplan–Meier curves. Models were based on CT and biomarker data obtained at the first CT scan performed after treatment cycle 2 only. Biomarker values were log2 transformed. Prognostic models were evaluated using hazard ratios (HR) and C-index values (non-parametric estimator of the proportion of all patient pairs for which model prediction and observed outcome were concordant).
In biomarker-based risk prediction models, patients were separated into two risk groups based on 1) the median biomarker value for the analyzed population and 2) the optimized cut-off (all quantiles from 0.2 to 0.8 by steps of 0.05 were tested to split the patients into two groups. The quantiles 0.2 and 0.8 were selected to avoid any of the groups being inappropriately small, which could lead to overfitting. HR and log-rank p-value for each split were calculated. The quantile with the lowest log-rank p-value was chosen as the optimized cut-off). Cox proportional hazard models were based on either a single biomarker or combinations of two or three biomarkers. For the combined population of ADC and SCC, the models also included the interaction term between histology and each biomarker.
3Results
3.1Study patients
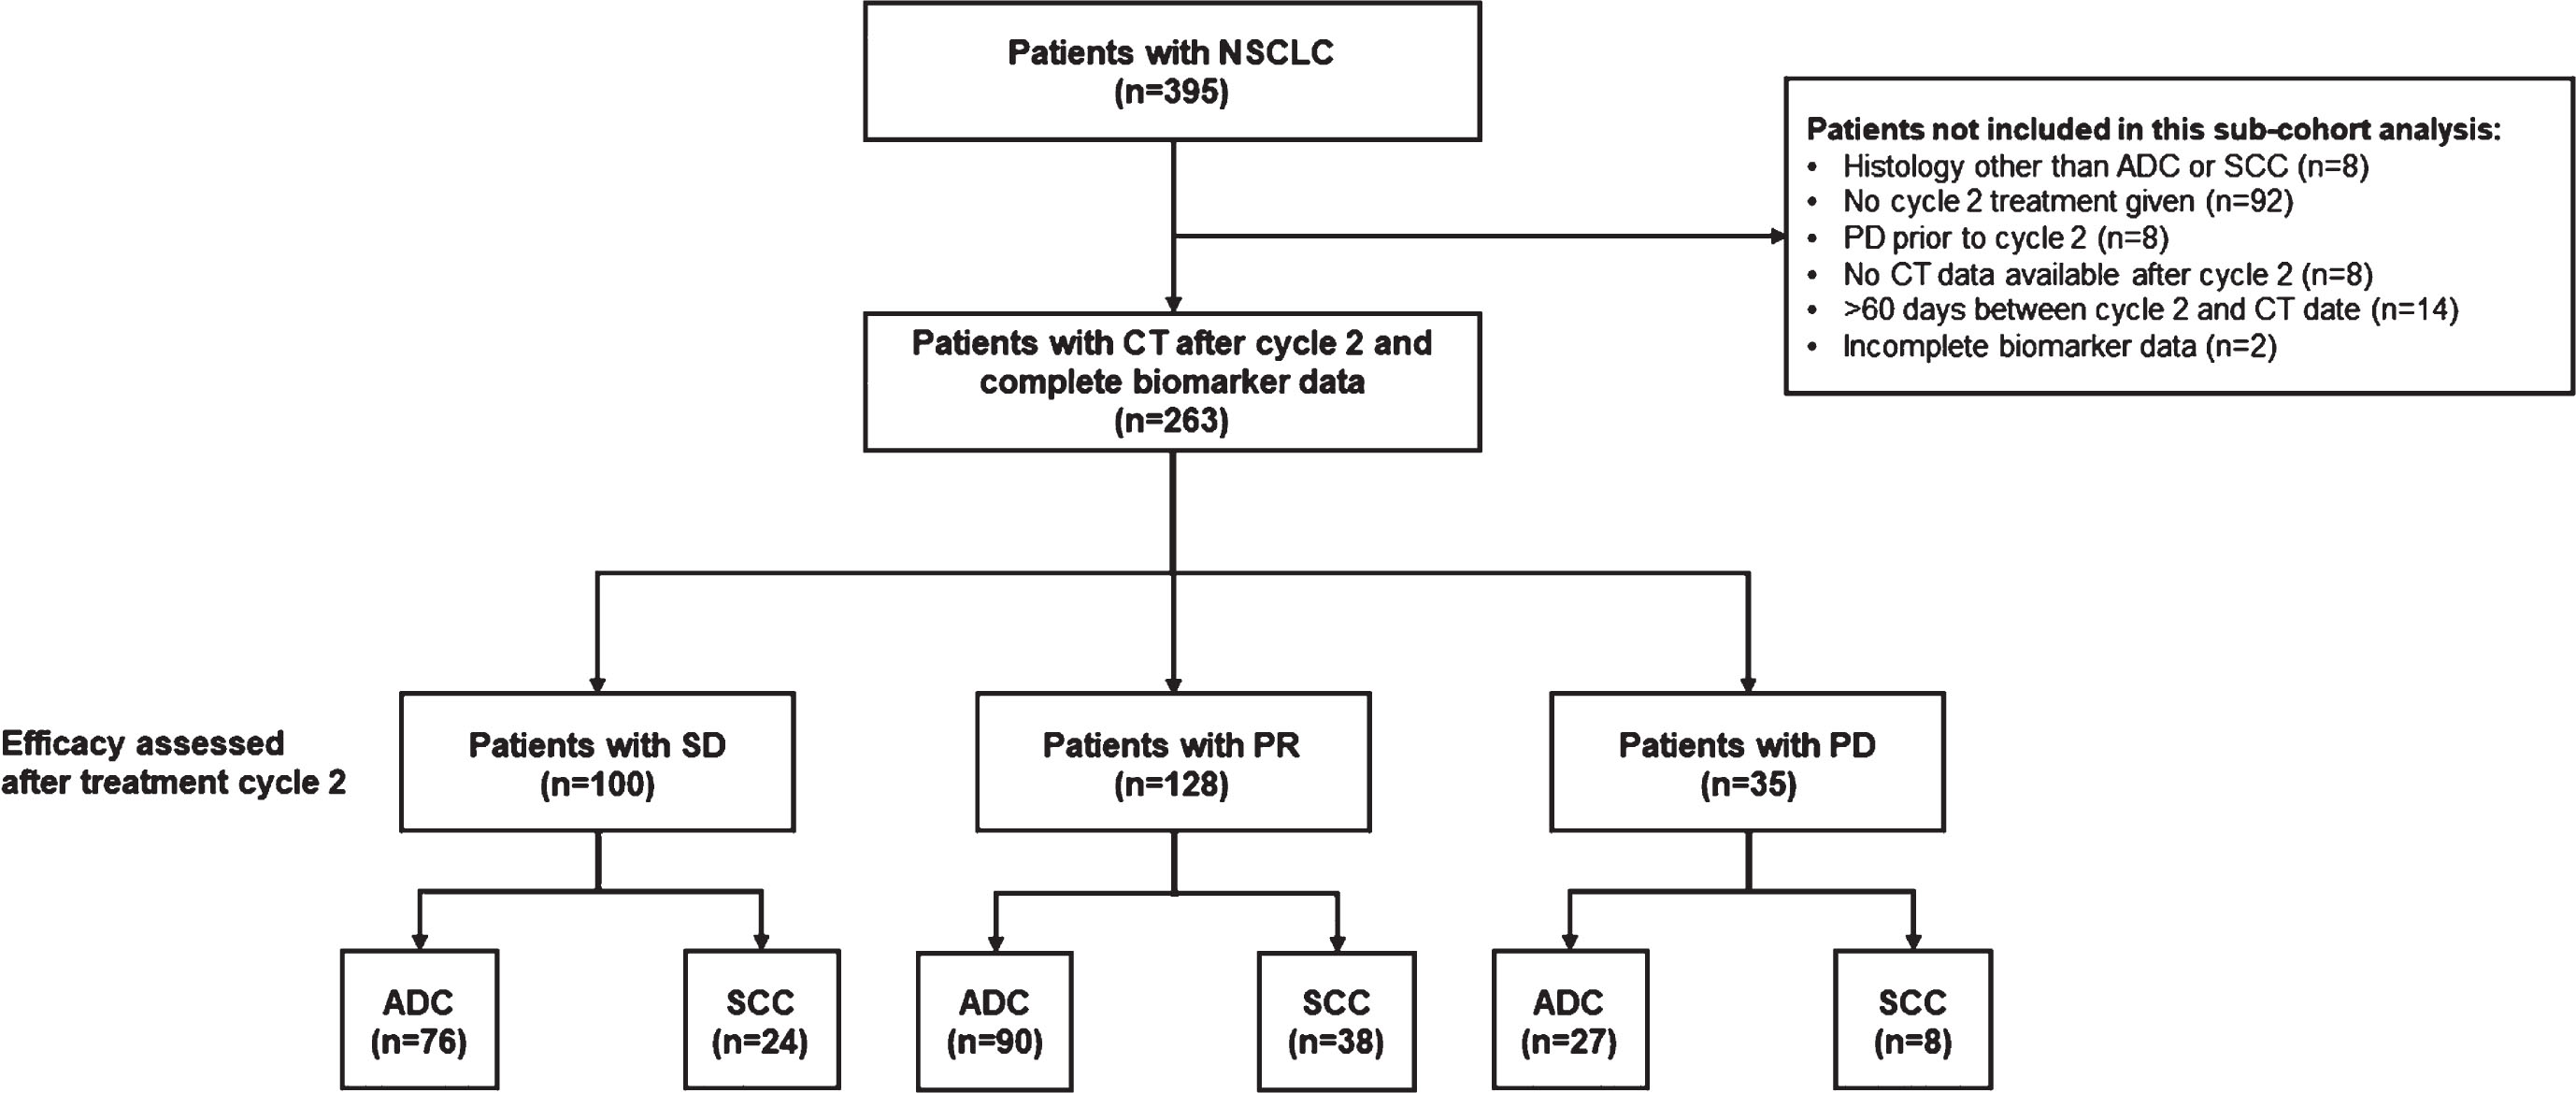
Of the 395 patients with NSCLC enrolled, 263 met the eligibility criteria for the current analyses. Following initial treatment, 100 patients had SD (ADC, n = 76; SCC, n = 24), 128 had PR (ADC, n = 90; SCC, n = 38) and 35 had PD (ADC, n = 27; SCC, n = 8) (Fig. 1). Patients with PR and PD were included for comparison in the outcome analyses. Patient demographics and treatment schemes for the PR, SD, and PD subgroups are summarized in Table 1. Patients received chemotherapy (71.9%, 77.0% and 80.0% for PR, SD and PD, respectively) and/or immune-checkpoint inhibitor therapy (7.0%, 12.0% and 14.3%, respectively) or TKI (16.4%, 8.0%, 2.9% respectively). The most common treatment regimen was platinum-based combination chemotherapy (68.9%, 71.0% and 80.0% of patients in the PR, SD, and PD groups, respectively). The median time from treatment initiation to first CT scan and to STM measurements were similar across CT-response groups. Overall, the median follow-up time in this study was 462 days.
Fig. 1
Study population. ADC, adenocarcinoma; CT, computed tomography; NSCLC, non-small cell lung cancer; PD, progressive disease; PR, partial response; SCC, squamous cell carcinoma; SD, stable disease.
3.2Prognostic value of the first CT scan after the second treatment cycle
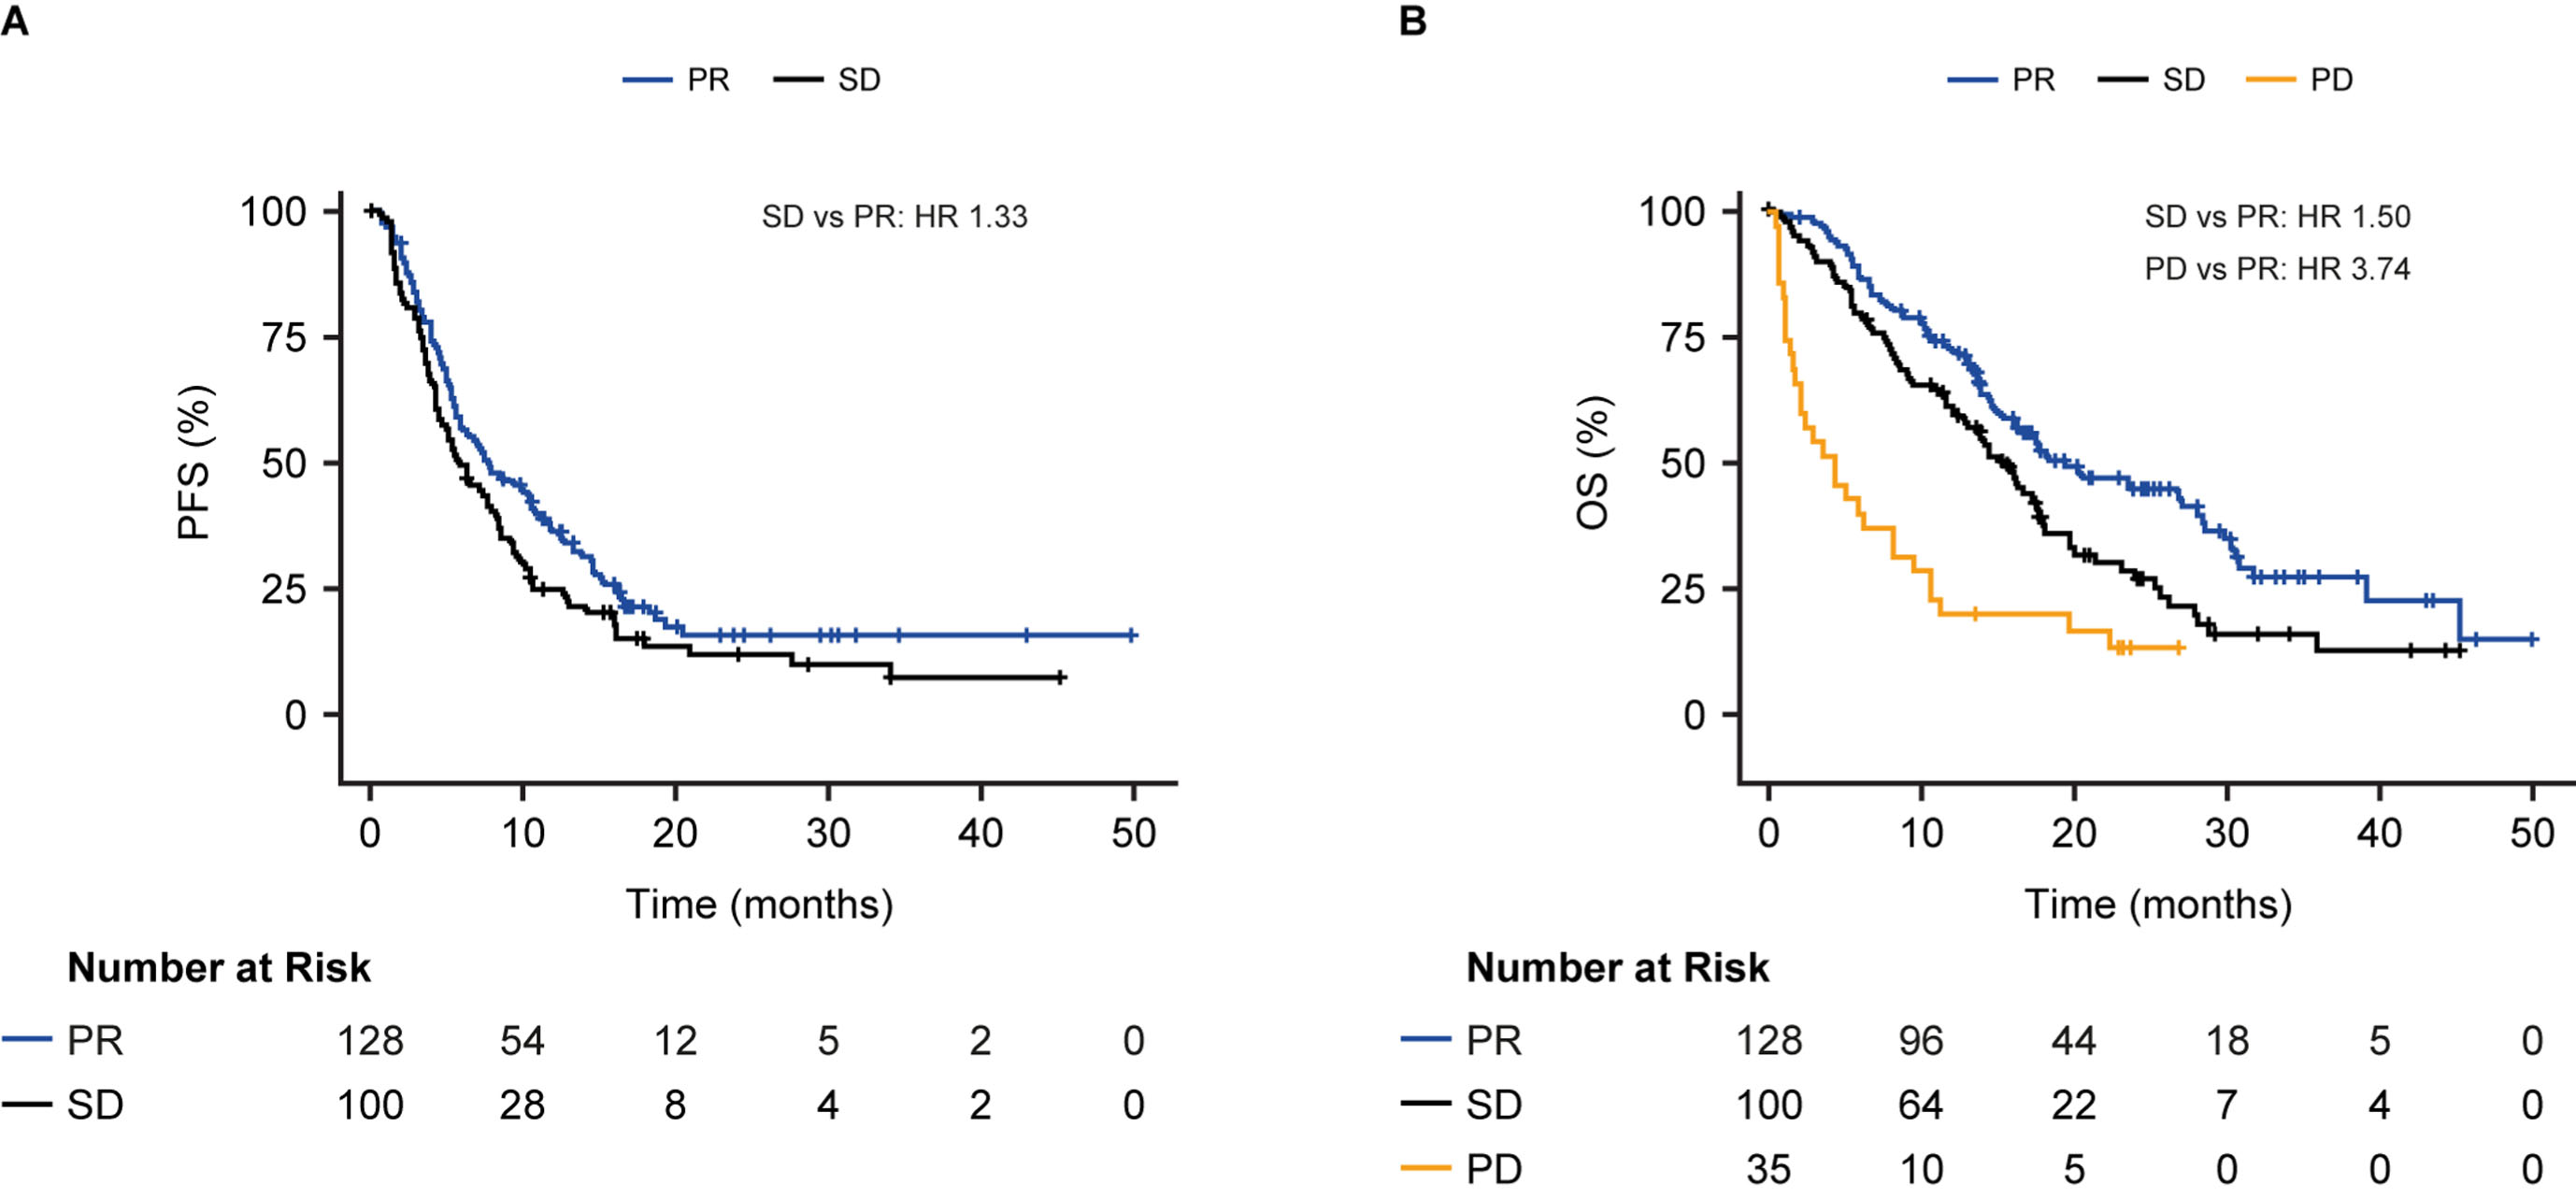
Patients identified as having SD at the first CT scan performed after two treatment cycles had a similar risk of progression or death compared with patients with PR (median PFS; 6 vs 8 months; HR 1.33, 95% CI 0.99–1.77, p = 0.055; Fig. 2A). For the endpoint of OS, patients with SD had a modestly increased risk of death from any cause compared with patients with PR (median OS 15 vs 19 months; HR 1.50, 95% CI 1.09–2.07, p = 0.014; Fig. 2B). As expected, the risk of death from any cause was considerably higher for patients with PD vs PR (median OS 4 vs 19 months; HR 3.74, 95% CI 2.43–5.76, p < 0.0001; Fig. 2B).
Fig. 2
Progression-free survival (A) and overall survival (B) in patients with partial response, stable disease, or progressive disease at the first CT scan after the second cycle stratified by CT scan results. CI, confidence interval; HR, hazard ratio; OS, overall survival; PD, progressive disease; PFS, progression-free survival; PR, partial response; SD, stable disease
3.3Prognostic value of serum tumor markers
Prognostic data for the biomarkers CYFRA 21-1, CEA and CA 125 are reported here. Prognostic data for remaining biomarkers are shown in Supplementary Table 2.
3.3.1Median biomarker cut-off
Initially, all biomarker data were analyzed by splitting patients with SD into two groups (high risk vs low risk) using the median value for each biomarker as a cutoff (Supplementary Table 1). For the endpoint of PFS, CYFRA 21-1 had the highest prognostic value for ADC, with a median PFS of 4 months for the high-risk SD group and 8 months for the low-risk SD group (HR 2.30, 95% CI, 1.40–3.78, p = 0.001 for high vs low-risk SD). CA 125 had the highest prognostic value for SCC, with a median PFS of 4 months for the high-risk SD group and 9 months for the low-risk SD group (HR 3.47, 95% CI 1.42–8.49, p = 0.006 for high vs low-risk SD) (Supplementary Table 3; Supplementary Figure 2A, B).
For the combined population of patients with ADC and SCC, a combination of CYFRA 21-1 and CA 125 and an interaction term between each biomarker and histology had a greater prognostic value for PFS than either biomarker alone (Supplementary Table 3; Supplementary Figure 2C). The addition of a third biomarker, CEA, further improved the prognostic performance for the combined population of patients with ADC and SCC and indicated an almost 2.5-fold increased risk of progression or death for patients with high vs low-risk SD (median PFS: high-risk SD 4 months, low-risk SD 9 months, HR 2.41, 95% CI 1.57–3.70, p < 0.0001); Supplementary Table 3; Supplementary Figure 2D). Using this three-marker model, patients in the low-risk SD group had a similar PFS compared with patients identified as having PR based on CT scan results after two treatment cycles (median PFS: low-risk SD 9 months, PR 8 months; HR 0.90, p = 0.57; Fig. 3A).
Fig. 3
Progression-free survival (A) and overall survival (B) in patients with stable disease at the first CT scan after the second cycle in those with ADC or SCC stratified into high- and low-risk groups by CYFRA 21-1, CA 125, CEA and the interaction term between histology and each biomarker, above or below median. Results are compared to patients with PR (A) or PR and PD (B). The C-index was calculated based on a model that included the continuous form of the biomarkers. HR, hazard ratio; OS, overall survival; PD, progressive disease; PFS, progression-free survival; PR, partial response; SD, stable disease.
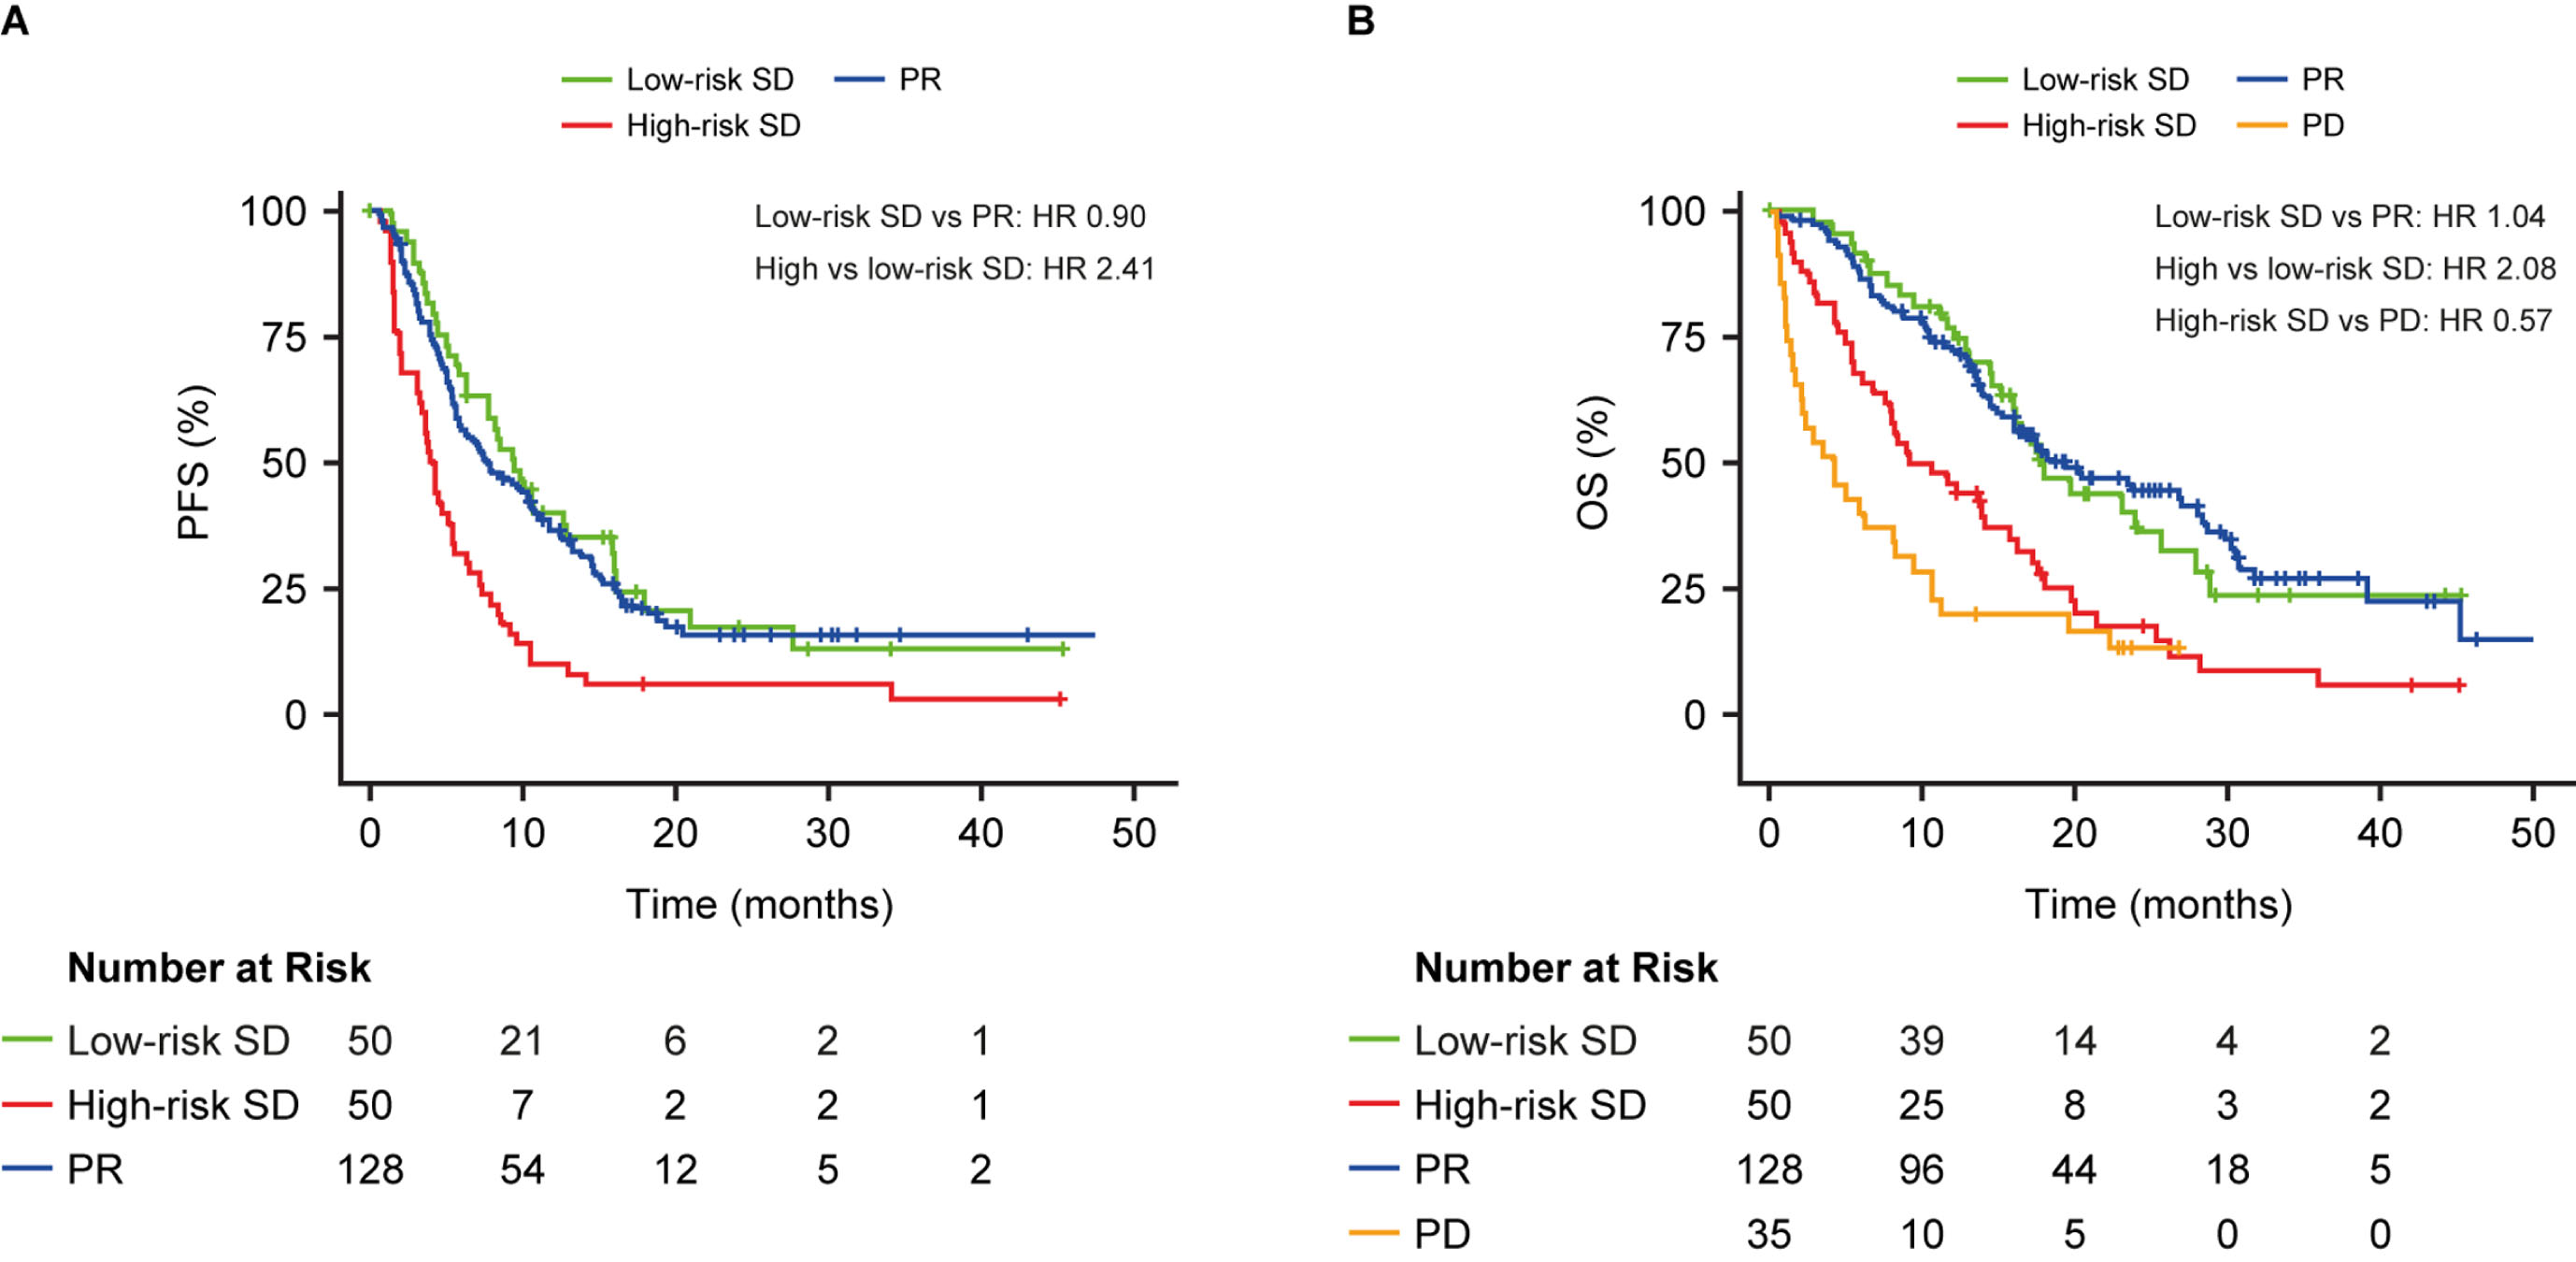
For the OS endpoint, patients in the low-risk SD group had a similar risk of death compared with patients identified as having PR on a CT scan (median OS: low-risk SD 18 month, PR 19 months; HR 1.04, p = 0.87). Patients with high-risk SD had a 2-fold increased risk of death vs patients with low-risk SD (median OS: high-risk SD 10 months, low-risk SD 18 months; HR 2.08, 95% CI 1.29–3.33, p = 0.002), but a 2-fold decreased risk of death vs patients with PD (median OS: high-risk SD 10 months, PD 4 months; HR 0.57) (Fig. 3B).
3.3.2Optimized biomarker cut-off
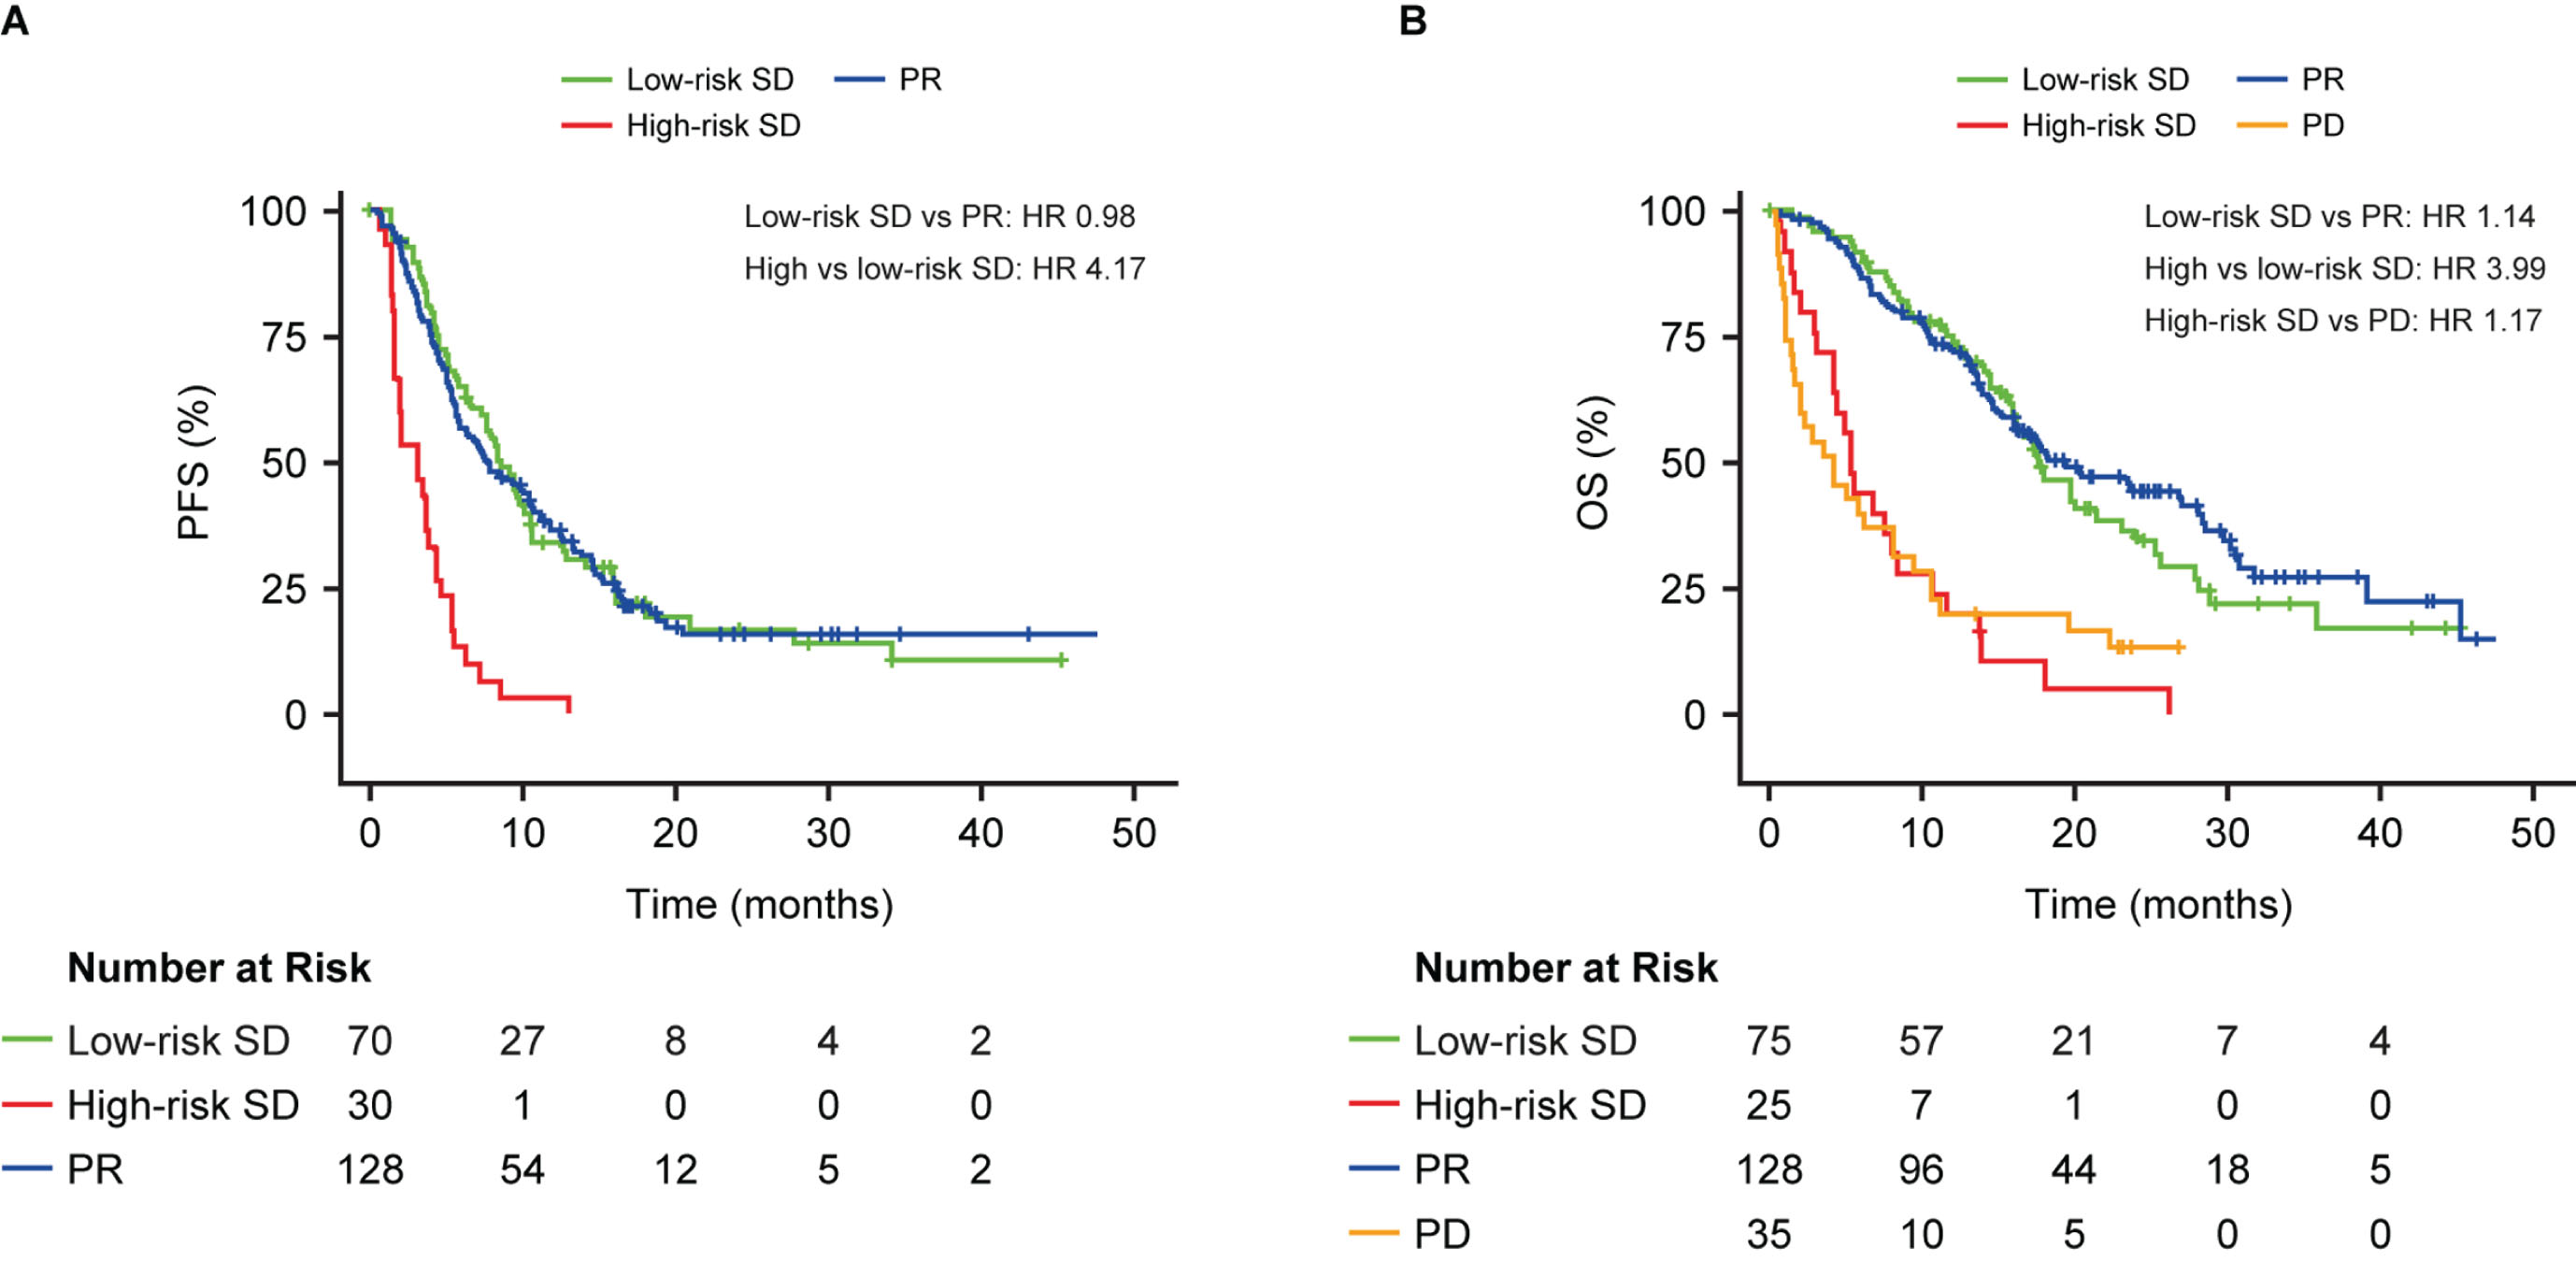
Using the optimized biomarker cut-off, a 4-fold increase in PFS or OS was estimated for the high vs low-risk SD patients (median PFS: high-risk SD 3 months, low-risk SD 8 months; HR 4.17, 95% CI 2.63–6.62, p < 0.0001; median OS: high-risk SD 5 months, low-risk SD 17 months; HR 3.99, 95% CI 2.41–6.59, p < 0.0001; Fig. 4). Patients with low-risk SD had similar outcomes to those with PR for PFS (median PFS: low-risk SD 8 months, PR 8 months; HR 0.98; p = 0.92; Fig. 4A) and OS (median OS: low-risk SD 17 months, PR 19 months; HR 1.14; Fig. 4B). Patients with high-risk SD had a similar OS probability to those with PD (median OS: high-risk SD 5 months, PD 4 months; HR 1.17; Fig. 4B).
Fig. 4
Progression-free survival (A) and overall survival (B) in patients with stable disease at the first CT scan after the second cycle in those with ADC or SCC stratified into high- and low-risk groups by CYFRA 21-1, CA 125, CEA and the interaction term between histology and each biomarker, above or below optimized cut-off. Results are compared to patients with PR (A) or PR and PD (B). The C-index was calculated based on a model that included the continuous form of the biomarkers. HR, hazard ratio; OS, overall survival; PD, progressive disease; PFS, progression-free survival; PR, partial response; SD, stable disease.
4Discussion
CT is currently the method of choice for assessing response to therapy in lung cancer; however, it has certain limitations, especially in patients receiving targeted therapy or immunotherapy. This analysis indicates that CT performed after the first two treatment cycles has limited prognostic value. Although a clear difference in OS was observed for patients with PD vs PR, the ability of CT to discriminate between PR and SD in terms of PFS and OS was limited.
The limitations associated with CT have led to the development of alternative response criteria in various patient groups [16–19]. However, these alternative criteria have been designed for use in the clinical trial setting, where complexity is an acceptable trade-off for greater accuracy in measuring response, and they may not be suited to clinical practice. Several previous studies have supported the use of predictive and prognostic biomarkers to monitor response to various treatment modalities in NSCLC [25, 26, 28–30]. A recent meta-analysis of studies analyzing the predictive and prognostic utility of CYFRA 21-1 and CEA concluded that both markers may be used for monitoring treatment response, and that biomarkers may have a role in prediction of treatment response [29, 31], although no conclusions could be drawn based on patients’ RECIST category. Despite the growing body of supporting evidence, the use of serum tumor markers for the monitoring of response to therapy has not yet been incorporated into current guidelines [5, 14], possibly because it remains unclear how they should be used in conjunction with imaging. Indeed, tumor markers do not provide any added value when they align with the CT results. Moreover, if their predictions diverge from the comprehensive clinical and radiological assessment, they are also unlikely to influence patient management. However, SD represents a clinical ‘grey zone’, where it is difficult to tell whether a patient is responding or progressing [8, 13], and adding tumor markers to CT may assist in risk discrimination among these patients. Tumor markers may also hold potential for guiding treatment decisions especially in scenarios involving therapy-related side effects such as organ toxicity or autoimmunity. In cases where anti-tumor treatment is predicted to be successful, these markers could aid in the decision to manage such side effects symptomatically within the low-risk SD group. Conversely, for the high-risk SD group, where the predicted benefit of anti-tumor treatment is limited, these markers might prompt consideration for treatment modification [32]. In addition, an alternative response evaluation would be welcome in cases where there is pseudoprogression on CT [33] or poor differentiation between tumor and adjacent atelectasis/retention pneumonia; or when there’s uncertainty about whether new lesions are new metastases or, for example, new bronchopneumonia [33].
Of the eight serum tumor markers tested, the optimal prognostic biomarker was dependent on the underlying histology, i.e., CYFRA 21-1 had the highest prognostic value for patients with an ADC and CA 125 for patients with SCC. The combination of these two markers plus CEA had the greatest prognostic value in the overall population of patients with SD (ADC and SCC) for PFS. This biomarker combination also demonstrated high prognostic value for OS, but a slightly higher C-index for OS was found when replacing CEA with CA 15-3 (i.e. by the combination of CYFRA 21-1, CA 125 and CA 15-3). Future investigations are warranted to assess whether this difference might be cohort-specific. Nonetheless, it is evident from our findings that three-biomarker combinations including CYFRA 21-1 demonstrate the highest prognostic value in this setting.
The prognostic power of the triple marker model CYFRA 21-1 + CA 125 + CEA further increased when patients were stratified using an optimized rather than a median biomarker cut-off. Using the optimized cut-offs, patients in the high-risk SD subgroup had a similar risk for PFS and OS compared with patients with PD, suggesting that these patients may not derive further benefit from therapy and a treatment switch could be considered. Conversely, patients in the low-risk SD subgroup had responses similar to patients with PR, suggesting that the continuation of therapy may be beneficial in these patients. Similar results were obtained in an analysis of the large IMpower150 study (n = 750), which demonstrated that a combination of CA 125 and CYFRA 21-1 with or without C-reactive protein could be used to predict OS and PFS in NSCLC patients with SD following two treatment cycles with a regimen that included chemotherapy combined with an immune checkpoint inhibitor and/or a growth factor inhibitor [34]. These results from the LCMM and IMpower150 studies support the use of a combination of tumor serum biomarkers to further risk stratify patients identified as having SD after the first two treatment cycles with either chemotherapy or immunotherapy/targeted therapies.
The limitations of the current study are that it only includes data obtained from a single center and that the model was both trained and tested on the same study population. However, we found that the survival outcome data in the current study are comparable to other real-world cohorts with similar treatment patterns, i.e., predominantly first-line platinum-based chemotherapy combinations [35, 36]. Additionally, given this is a data-driven method, the suitability of the cut-off chosen may vary between different clinical practices. While the methodology used is prone to overfitting, quantiles of 0.2 and 0.8 were selected to avoid any of the groups being unsuitably small. The limited number of tested samples may warrant further validation of these results in additional cohorts. Performing alternative analyses such as receiver operating characteristic curves, or Brier-Score analysis could also be beneficial in further confirming our findings.
5Conclusions
The combination of CYFRA 21-1, CA 125 and CEA may provide additional information in patients with an indeterminate CT response after initial treatment by differentiating those with SD into high- and low-risk groups for PFS and OS. Biomarkers may have a potential role in prognosis prediction in patients with NSCLC, although further research will be needed to assess their clinical utility. Validation of these results based on an external cohort is required as is confirmation that managing patients based on their biomarker score improves outcomes.
Acknowledgments
The study was sponsored by Roche Diagnostics GmbH Mannheim. The authors would like to thank the patients and their families for their contribution to the study. The authors also gratefully acknowledge the technical assistance and data management provided by Andrea Bopp, Christa Stolp, Ying He and Jialing Huang. Editorial support was provided by Sinéad Mutton of inScience Communications, Springer Healthcare (UK) and was funded by Roche Diagnostics. ELECSYS and COBAS are trademarks of Roche. The assays used in this analysis are currently not specifically intended to be used for aid in the management of NSCLC patients in US or in CE-markets. All other product names and trademarks are the property of their respective owners.
Author contributions
CONCEPTION: TM, FH, MAS and BW.
DATA CURATION: TM, FH, MS, MM, AM, SH and MK.
ANALYSIS OF DATA: AM.
PREPARATION OF THE MANUSCRIPT: TM, AM, MAS, BW, RG and SH.
REVISION FOR IMPORTANT INTELLECTUAL CONTENT: CPH and MK.
Conflict of interest
Thomas Muley has received institutional funding or honoraria and is involved in patents from Roche Diagnostics (Penzberg, Germany). TM has also received institutional funding from OncoHost (Israel) and Cellzome (Germany). Marc Schneider has received institutional funding from Roche, OncoHost (Israel), and Cellzome (Germany). Michael Thomas has received honoraria from AstraZeneca, Beigene, Bristol Myers Squibb, Boehringer Ingelheim, Celgene, Chugai, Daiichi Sankyo, GlaxoSmithKline, Janssen Oncology, Lilly, Merck, MSD, Novartis, Pfizer, Roche, Sanofi and Takeda. MT has also received institutional funding from AstraZeneca, Bristol-Myers Squibb, Merck, Roche and Takeda. MT has also received travel costs from AstraZeneca, Bristol Myers Squibb, Boehringer Ingelheim, Daiichi Sankyo, Janssen Oncology, Lilly, Merck, MSD, Novartis, Pfizer, Roche, Sanofi and Takeda. Claus Peter Heussel has received lecture fees from AstraZeneca and Boehringer Ingelheim, owns stock in GlaxoSmithKline. Stefan Holdenrieder has received research funding or honoraria from Roche Diagnostics, Bristol Myers Squibb, Merck KgaA, Sysmex Inostics and Volition SPRL. SH is also a guest editor of the special issue Lung Cancer Tumor Markers but had no involvement in the peer review process of this manuscript. Rebecca Gerber is an employee of Roche Diagnostics GmbH (Mannheim, Germany) and Vinzent Rolny and Birgit Wehnl are employees of Roche Diagnostics GmbH (Penzberg, Germany); all three hold stocks/stock options in F. Hoffmann-La Roche Ltd. Anika Mang is an employee of Roche Diagnostics GmbH (Penzberg, Germany). Felix Herth has received institutional funding and honoraria (advisory board) and is involved in patents from Roche Diagnostics (Penzberg, Germany). The other authors do not have any COI to be declared.
Data availability
The study was conducted in accordance with applicable regulations. Requests concerning the data supporting the findings of this study can be directed to for consideration.
Funding
The study was sponsored by Roche Diagnostics GmbH, Mannheim, Germany.
Supplementary material
[1] The supplementary material is available in the electronic version of this article: https://dx.doi.org/10.3233/TUB-220042.
References
[1] | Sung H , Ferlay J , Siegel RL , Laversanne M , Soerjomataram I , Jemal A , et al. Global Cancer Statistics GLOBOCAN estimates of incidence and mortality worldwide for 36 cancers in 185 countries. CA Cancer J Clin. (2021) ;71: (3):209–49. doi: 10.3322/caac.21660. |
[2] | Zappa C , Mousa SA . Non-small cell lung cancer: current treatment and future advances. Transl Lung Cancer Res. (2016) ;5: (3):288–300. doi: 10.21037/tlcr.2016.06.07. |
[3] | Blandin Knight S , Crosbie PA , Balata H , Chudziak J , Hussell T , Dive C . Progress and prospects of early detection in lung cancer. Open Biol. (2017) ;7: (9):170070. doi: 10.1098/rsob.170070. |
[4] | Cassim S , Chepulis L , Keenan R , Kidd J , Firth M , Lawrenson R . Patient and carer perceived barriers to early presentation and diagnosis of lung cancer: a systematic review. BMC Cancer. (2019) ;19: (1):25. doi: 10.1186/s12885-018-5169-9. |
[5] | NCCN Guidelines. Non-Small-Cell Lung Cancer. Version 4.2019. 2019. 21 November 2019. Available from: https://www.nccn.org/professionals/physician_gls/pdf/nscl.pdf. |
[6] | Postmus PE , Kerr KM , Oudkerk M , Senan S , Waller DA , Vansteenkiste J , et al. Early and locally advanced non-small-cell lung cancer (NSCLC): ESMO Clinical Practice Guidelines for diagnosis, treatment and follow-up†. Ann Oncol. (2017) ;28: (suppl_4):iv1–iv21. doi: 10.1093/annonc/mdx222. |
[7] | Greenspan BS . Role of PET/CT for precision medicine in lung cancer: perspective of the Society of Nuclear Medicine and Molecular Imaging. Transl Lung Cancer Res. (2017) ;6: (6):617–20. doi: 10.21037/tlcr.2017.09.01. |
[8] | Eisenhauer EA , Therasse P , Bogaerts J , Schwartz LH , Sargent D , Ford R , et al. New response evaluation criteria in solid tumours: revised RECIST guideline (version 1. 1). Eur J Cancer. (2009) ;45: (2):228–47. doi: 10.1016/j.ejca.2008.10.026. |
[9] | Dinkel J , Khalilzadeh O , Hintze C , Fabel M , Puderbach M , Eichinger M , et al. Inter-observer reproducibility of semi-automatic tumor diameter measurement and volumetric analysis in patients with lung cancer. Lung Cancer. (2013) ;82: (1):76–82. doi: 10.1016/j.lungcan.2013.07.006. |
[10] | Jiang B , Zhou D , Sun Y , Wang J . Systematic analysis of measurement variability in lung cancer with multidetector computed tomography. Ann Thorac Med. (2017) ;12: (2):95–100. doi: 10.4103/1817-1737.203750. |
[11] | McErlean A , Panicek DM , Zabor EC , Moskowitz CS , Bitar R , Motzer RJ , et al. Intra- and interobserver variability in CT measurements in oncology. Radiology. (2013) ;269: (2):451–9. doi: 10.1148/radiol.13122665. |
[12] | Oxnard GR , Zhao B , Sima CS , Ginsberg MS , James LP , Lefkowitz RA , et al. Variability of lung tumor measurements on repeat computed tomography scans taken within 15 minutes. J Clin Oncol. (2011) ;29: (23):3114–9. doi: 10.1200/JCO.2010.33.7071. |
[13] | Pinker K , Riedl C , Weber WA . Evaluating tumor response with FDG PET: updates on PERCIST, comparison with EORTC criteria and clues to future developments. Eur J Nucl Med Mol Imaging. (2017) ;44: (suppl_1):55–66. doi: 10.1007/s00259-017-3687-3. |
[14] | Planchard D , Popat S , Kerr K , Novello S , Smit EF , Faivre-Finn C , et al. Metastatic non-small cell lung cancer: ESMO Clinical Practice Guidelines for diagnosis, treatment and follow-up. Ann Oncol. (2018) ;29: (suppl_4):iv192–iv237. doi: 10.1093/annonc/mdy275. |
[15] | Hwang KE , Kim HR . Response evaluation of chemotherapy for lung cancer. Tuberc Respir Dis (Seoul). (2017) ;80: (2):136–42. doi: 10.4046/trd.2017.80.2.136. |
[16] | Lee HY , Lee KS , Ahn MJ , Hwang HS , Lee JW , Park K , et al. New CT response criteria in non-small cell lung cancer: proposal and application in EGFR tyrosine kinase inhibitor therapy. Lung Cancer. (2011) ;73: (1):63–9. doi: 10.1016/j.lungcan.2010.10.019. |
[17] | Tazdait M , Mezquita L , Lahmar J , Ferrara R , Bidault F , Ammari S , et al. Patterns of responses in metastatic NSCLC during PD-1 or PDL-1 inhibitor therapy: Comparison of RECIST 1. 1, irRECIST and iRECIST criteria. Eur J Cancer. (2018) ;88: :38–47. doi: 10.1016/j.ejca.2017.10.017. |
[18] | Wolchok JD , Hoos A , O’Day S , Weber JS , Hamid O , Lebbe C , et al. Guidelines for the evaluation of immune therapy activity in solid tumors: immune-related response criteria. Clin Cancer Res. (2009) ;15: (23):7412–20. doi: 10.1158/1078-0432.CCR-09-1624. |
[19] | Goldfarb L , Duchemann B , Chouahnia K , Zelek L , Soussan M . Monitoring anti-PD-1-based immunotherapy in non-small cell lung cancer with FDG PET: introduction of iPERCIST. EJNMMI Res. (2019) ;9: (1):8. doi: 10.1186/s13550-019-0473-1. |
[20] | Lim SM , Hong MH , Kim HR . Immunotherapy for non-small cell lung cancer: Current landscape and future perspectives. Immune Netw. (2020) ;20: (1):e10. doi: 10.4110/in.2020.20.e10. |
[21] | Zhu Y , Zhao F , Li Z , Yu J . Current landscape and future directions of biomarkers for predicting responses to immune checkpoint inhibitors. Cancer Manag Res. (2018) ;10: :2475–88. doi: 10.2147/CMAR.S167400. |
[22] | Jiang A-G , Chen H-L , Lu H-Y . The relationship between Glasgow prognostic score and serum tumor markers in patients with advanced non-small cell lung cancer. BMC Cancer. (2015) ;15: (1):386. doi: 10.1186/s12885-015-1403-x. |
[23] | Liu L , Teng J , Zhang L , Cong P , Yao Y , Sun G , et al. The combination of the tumor markers suggests the histological diagnosis of lung cancer. BioMed Res Int. (2017) ;2017: :1–9. doi: 10.1155/2017/2013989. |
[24] | Muley T , Rolny V , He Y , Wehnl B , Escherich A , Warth A , et al. The combination of the blood based tumor biomarkers cytokeratin 19 fragments (CYFRA 21-1) and carcinoembryonic antigen (CEA) as a potential predictor of benefit from adjuvant chemotherapy in early stage squamous cell carcinoma of the lung (SCC). Lung Cancer. (2018) ;120: :46–53. doi: 10.1016/j.lungcan.2018.03.015. |
[25] | Tiseo M , Ardizzoni A , Cafferata MA , Loprevite M , Chiaramondia M , Filiberti R , et al. Predictive and prognostic significance of neuron-specific enolase (NSE) in non-small cell lung cancer. Anticancer Res. (2008) ;28: (1B):507–13. doi: none. |
[26] | Wojcik E , Kulpa JK . Pro-gastrin-releasing peptide (ProGRP) as a biomarker in small-cell lung cancer diagnosis, monitoring and evaluation of treatment response. Lung Cancer (Auckl). (2017) ;8: :231–40. doi: 10.2147/LCTT.S149516. |
[27] | Herbreteau G , Vallee A , Charpentier S , Normanno N , Hofman P , Denis MG . Circulating free tumor DNA in non-small cell lung cancer (NSCLC): clinical application and future perspectives. J Thorac Dis. (2019) ;11: (suppl_1):S113–S26. doi: 10.21037/jtd.2018.12.18. |
[28] | Ardizzoni A , Cafferata MA , Tiseo M , Filiberti R , Marroni P , Grossi F , et al. Decline in serum carcinoembryonic antigen and cytokeratin 19 fragment during chemotherapy predicts objective response and survival in patients with advanced nonsmall cell lung cancer. Cancer. (2006) ;107: (12):2842–9. doi: 10.1002/cncr.22330. |
[29] | Holdenrieder S , Wehnl B , Hettwer K , Simon K , Uhlig S , Dayyani F . Carcinoembryonic antigen and cytokeratin-19 fragments for assessment of therapy response in non-small cell lung cancer: a systematic review and meta-analysis. Br J Cancer. (2017) ;116: (8):1037–45. doi: 10.1038/bjc.2017.45. |
[30] | Yoshimura A , Uchino J , Hasegawa K , Tsuji T , Shiotsu S , Yuba T , et al. Carcinoembryonic antigen and CYFRA 21-1 responses as prognostic factors in advanced non-small cell lung cancer. Transl Lung Cancer Res. (2019) ;8: (3):227–34. doi: 10.21037/tlcr.2019.06.08. |
[31] | van den Heuvel M , Holdenrieder S , Schuurbiers M , Cigoianu D , Trulson I , van Rossum H , et al. Serum tumor markers for response prediction and monitoring of advanced lung cancer: a review focusing on immunotherapy and targeted therapies. Tumor Biol. (2023) , May 23. Online ahead of print. doi: 10.3233/TUB-220039. |
[32] | Hommes JW , Verheijden RJ , Suijkerbuijk KPM , Hamann D . Biomarkers of checkpoint inhibitor induced immune-related adverse events-A comprehensive review. Front Oncol. (2020) ;10: :585311. doi: 10.3389/fonc.2020.585311. |
[33] | Frelaut M , du Rusquec P , de Moura A , Le Tourneau C , Borcoman E . Pseudoprogression and hyperprogression as new forms of response to immunotherapy. BioDrugs. (2020) ;34: (4):463–76. doi: 10.1007/s40259-020-00425-y. |
[34] | Mang A , Zou W , Rolny V , Reck M , Cigoianu D , Schulze K , et al. Combined use of CYFRA 21-1, CA125 and CRP predicts survival of metastatic NSCLC patients with stable disease. J Thorac Oncol. (2021) ;16: (Suppl_10):P22.02. doi: 10.1016/j.jtho.2021.08.356. |
[35] | Gaitonde P , Chirikov V , Kelkar S , Liljas B . Considerations for the Utility of Real-World Evidence Beyond Trial Data in Advanced NSCLC: The Case of Frontline Tyrosine Kinase Inhibitors. Cancer Manag Res. (2022) ;2022: :(14):P3421–35. doi: 10.2147/CMAR.S380857. |
[36] | Simeone J , Nordstrom BL , Patel K , Klein AB . Treatment patterns and overall survival in metastatic non-small-cell lung cancer in a real-world, US setting. Future Oncol. (2019) ;15: (30):P3491–502. doi: 10.2217/fon-2019-0348. |


