
Comparing modeling strategies combining changes in multiple serum tumor biomarkers for early prediction of immunotherapy non-response in non-small cell lung cancer
Abstract
BACKGROUND:
Patients treated with immune checkpoint inhibitors (ICI) are at risk of adverse events (AEs) even though not all patients will benefit. Serum tumor markers (STMs) are known to reflect tumor activity and might therefore be useful to predict response, guide treatment decisions and thereby prevent AEs.
OBJECTIVE:
This study aims to compare a range of prediction methods to predict non-response using multiple sequentially measured STMs.
METHODS:
Nine prediction models were compared to predict treatment non-response at 6-months (n = 412) using bi-weekly CYFRA, CEA, CA-125, NSE, and SCC measurements determined in the first 6-weeks of therapy. All methods were applied to six different biomarker combinations including two to five STMs. Model performance was assessed based on sensitivity, while model training aimed at 95% specificity to ensure a low false-positive rate.
RESULTS:
In the validation cohort, boosting provided the highest sensitivity at a fixed specificity across most STM combinations (12.9% –59.4%). Boosting applied to CYFRA and CEA achieved the highest sensitivity on the validation data while maintaining a specificity >95%.
CONCLUSIONS:
Non-response in NSCLC patients treated with ICIs can be predicted with a specificity >95% by combining multiple sequentially measured STMs in a prediction model. Clinical use is subject to further external validation.
1Introduction
Immune checkpoint inhibitors with or without chemotherapy have become a standard first-line treatment for advanced non-small cell lung cancer (NSCLC) patients without actionable oncogenic mutations [1, 2]. Nonetheless, only up to 50% of patients show survival benefit while all patients treated are at risk of immunotherapy-related adverse events (irAEs) [3, 4]. Therefore, optimizing non-response prediction prior to therapy initiation or during early therapy phase may help to prevent exposing patients to irAEs while not expecting benefit.
Since the introduction of immunotherapy, multiple biomarkers have been assessed for their value in the upfront selection of patients most likely to benefit from immunotherapy, including PD-L1 expression, tumor mutational burden (TMB), radiomics, and exhaled breath analysis [3, 5–7]. Despite efforts to find new and better biomarkers, PD-L1 expression remains the only biomarker currently used to identify patients most likely to benefit from immunotherapy. While the upfront evaluation of biomarkers might provide prognostic information, it does not provide information on actual tumor response, and therefore upfront evaluation of biomarkers might be less sensitive in the prediction of non-response.
Serum tumor markers (STM) such as carcinoembryonic antigen (CEA), cytokeratin 19 fragment (CYFRA), and neuro specific enolase (NSE) are known to reflect tumor mass [8]. Lang et al. showed that a decrease in STM levels between baseline and the first response assessment can be used to identify NSCLC patients receiving single-agent immune checkpoint inhibitors (ICIs) with more favorable outcomes [9].
Previous studies have shown that serum tumor markers can be used to predict non-response to immunotherapy in NSCLC patients [10, 11]. However, these prediction models were developed using a single STM measured over time, multiple STM measured at a single time point, or a summary statistic (e.g., change between two measurements) [10–12]. While single longitudinally measured STMs or multiple STMs measured at a single time point can be used to predict treatment non-response, combining longitudinal STM measurements might provide more predictive information. Therefore, this study aims to compare the accuracy of several analytic methods utilizing multiple longitudinal STM measurements in the prediction of non-response in immunotherapy treated NSCLC patients.
2Methods
This study is based on a cohort of 412 NSCLC patients described in previous studies [11, 13]. Patients were treated with either nivolumab or pembrolizumab at the Netherlands Cancer Institute between March 2013 and September 2019. Retrospective collection of data was approved by the local institutional review board and ethics committee (PTC NKI-AvL, NL45524.031.13). Blood samples were provided prior to treatment initiation and bi-weekly thereafter as part of regular care. CYFRA, CEA, CA125 and NSE were measured on a Cobas 6000 system (Roche) and SCC on a Kryptor system (Thermo Fisher).
2.1Model training
All models described in this study aimed to predict non-response at six months after treatment initiation by combining sequential biomarker measurements obtained during the first six weeks of treatment. A CT scan was made at six weeks, three months, and every three months thereafter to monitor disease progression. In this study, non-response is defined as progressive disease by Response Evaluation Criteria in Solid Tumors version 1.1 (RECIST), clinical progressive disease or death within six months after treatment initiation [11, 14, 15]. The baseline measurement was defined as the measurement taken between 7 days before and 1 day after treatment initiation. Other time points were defined as the measurement taken closest to the intended measurement date according to the bi-weekly measurement schedule, and taken one week before or after the intended date (e.g., a measurement for week six should be taken between day 35 and 49 after treatment initiation, and the measurement taken closest to day 42 is selected as the measurement for week six).
Nine prediction models, with varying levels of complexity and flexibility, were assessed in this study: logistic regression (LR), quadratic discriminant analysis (QDA), least absolute shrinkage and selection operator (LASSO), random forest (RF), bootstrap aggregating (bagging), boosting, artificial neural network (NN), support vector machine (SVM), and recurrent neural network (RNN). All models combine sequential measurements from multiple serum tumor markers to estimate a single probability of non-response per patient. All models except the RNN used the baseline measurement, the measurement at week six, the absolute difference between baseline and week six, and the relative difference between baseline and week six as input variables. The RNN used all available measurements between baseline and week six based on interpolation. Here, a monotone Hermite spline was fitted on log-transformed measurement data, and then seven data points were extracted from the fitted spline with seven-day intervals. The interpolated data points were transformed back using the exponential function. More details on model training and data requirements are depicted in Table 1. All models were applied to six different STM combinations of two to five STMs per combination. Since applying the models to all possible STM combinations (2∧5 = 32) would be computationally unfeasible, a team of clinical experts was consulted to identify the most promising combinations, which were: CYFRA/CEA, CYFRA/CEA/CA125, CYFRA/CEA/NSE, CEA/CA125/NSE, CYFRA/CEA/CA125/NSE, and CYFRA/CEA/CA125/NSE/SCC. Patients were excluded from the analysis depending on model-specific data requirements, i.e., a minimum number of measurements in the six-week period, or missing data (Table 1).
Table 1
The data requirements, data transformations, and training procedures used per prediction model
| Method | Data requirement | Data transformations | Model training | R packages (Version) |
| Logistic regression | Baseline and week six measurement | 1) Log transformation 2) Min-max normalization | No additional hyperparameters | Stats (4.0.4) |
| Quadratic discriminant analysis | 5 fold cross validation, with accuracy as metric | Caret (6.0.88) | ||
| Least absolute shrinkage and selection operator | 5 fold cross validation with grid search, lambda sequence 10x (x from 10 to –3, by 0.0013). | Glmnet (4.1.1) | ||
| Random Forest | NA | 5 fold cross validation, with accuracy as metric. | randomForest (4.6.14), caret (6.0.88) | |
| Bootstrap aggregating | Tune grid: | |||
| - Nodesize: 1 to 5 | ||||
| - Number of trees: 100 to 1000 | ||||
| - Maximum number of terminal nodes: 5 to 25 | ||||
| Boosting | - 5 fold cross validation | Gbm (2.1.8) | ||
| - Shrinkage = 0,001 | ||||
| - Number of trees = 5000 | ||||
| - Interaction depth: 2 to 15 | ||||
| Artificial neural network* | 1) Log transformation 2) Min-max normalization | - Network structure: 3 dense layers with 32, 16, and 1 unit respectively | Keras (2.4.0), tensorflow (2.4.4) | |
| - Dropout: 20% | ||||
| - Regularizer L2: 0.01 | ||||
| - Validation split: 20% | ||||
| - epochs: 500, select epoch with highest validation accuracy | ||||
| Support vector machine | - Cross validation: 5 fold, | Caret (6.0.88) | ||
| - grid search: | ||||
| - C (0.0001, 0.001, 0.01, 0.1, 1, 10, 100) | ||||
| - Sigma (0.01 to 0.41, by 0.1) | ||||
| Recurrent neural network* | At least 3 available STM measurements including a baseline and week six measurement. | 1) Log transfor-mation | - Grid search: 2, 3, 6, 7 GRU layers, layer size 16 to 300, select model | Keras (2.4.0), |
| 2) Fit monotone Hermite spline | with highest pAUC. - Dropout: 15% | Tensorflow (2.4.0) | ||
| 3) Extract 7 datapoints at 1 week intervals | - Recurrent dropout: 15% | |||
| 4) Rescale data using the exponential function (y =ex) | - Optimizer: Adam - Metric: accuracy | |||
| 5) Log transformation | ||||
| 6) Min-max scaling | ||||
| - Monitor: accuracy | ||||
| - Validation split: 25% | ||||
| - Epochs: 200 (select epoch with highest accuracy) |
Serum tumor marker: STM, gated recurrent unit: GRU, partial area under curve, pAUC. *For the artificial neural network it was possible to define a network structure that provided a good performance across all STM combination, this was not possible for the recurrent neural network. Therefore, a grid search was used to select a network structure for the recurrent neural network for each STM combination.
2.2Model evaluation
Patients were randomly assigned to a training (75%) and validation (25%) cohort. All models included in this study provided a class probability as outcome. Since the primary aim of the models is to early cease treatment in those patients who do not respond to the treatment provided, thus requiring a low false positive rate, the prediction threshold resulting in a specificity closest to 95% was chosen for all further analyses. In case multiple thresholds resulted in equal specificity outcomes, the threshold resulting in the highest sensitivity was chosen. The trained prediction models and thresholds were then applied to the validation cohort to evaluate and compare model performance. Therefore, models were compared on the maximum sensitivity for the number of persons exhibiting immunotherapy non-response, given this 95% specificity requirement. Models were deemed useful when a sensitivity of at least 20% is achieved while maintaining a 95% specificity [11]. While a specificity slightly less than 95% may still be acceptable, models were deemed not useful when specificity dropped below 90%. Further analyses were performed to obtain a broader view of the model performance and generalizability. First, the standardized partial area under curve (pAUC) was calculated for the section of the receiver operating characteristics (ROC) curve ranging from 90% to 100% specificity [16]. Second, the optimism was calculated for the best performing model, i.e., the model providing the highest sensitivity on the training data [17]. To calculate the optimism, the model fit procedure was repeated on 1000 bootstrap samples. The sample size of the bootstrap samples was equal to 75% of the full patient cohort, samples were drawn randomly with replacement. Last, a bootstrap procedure was performed to assess the predictive accuracy of the models evaluated in this study. During this bootstrap procedure, the model fit on the training cohort was applied to 1000 bootstrap samples. As opposed to the optimism correction, models were not re-trained during this bootstrap procedure. The bootstrap samples were drawn from the full patient cohort, samples were drawn with replacement and the sample size was equal to 75% of the full patient cohort.
3Results
3.1Training and validation results
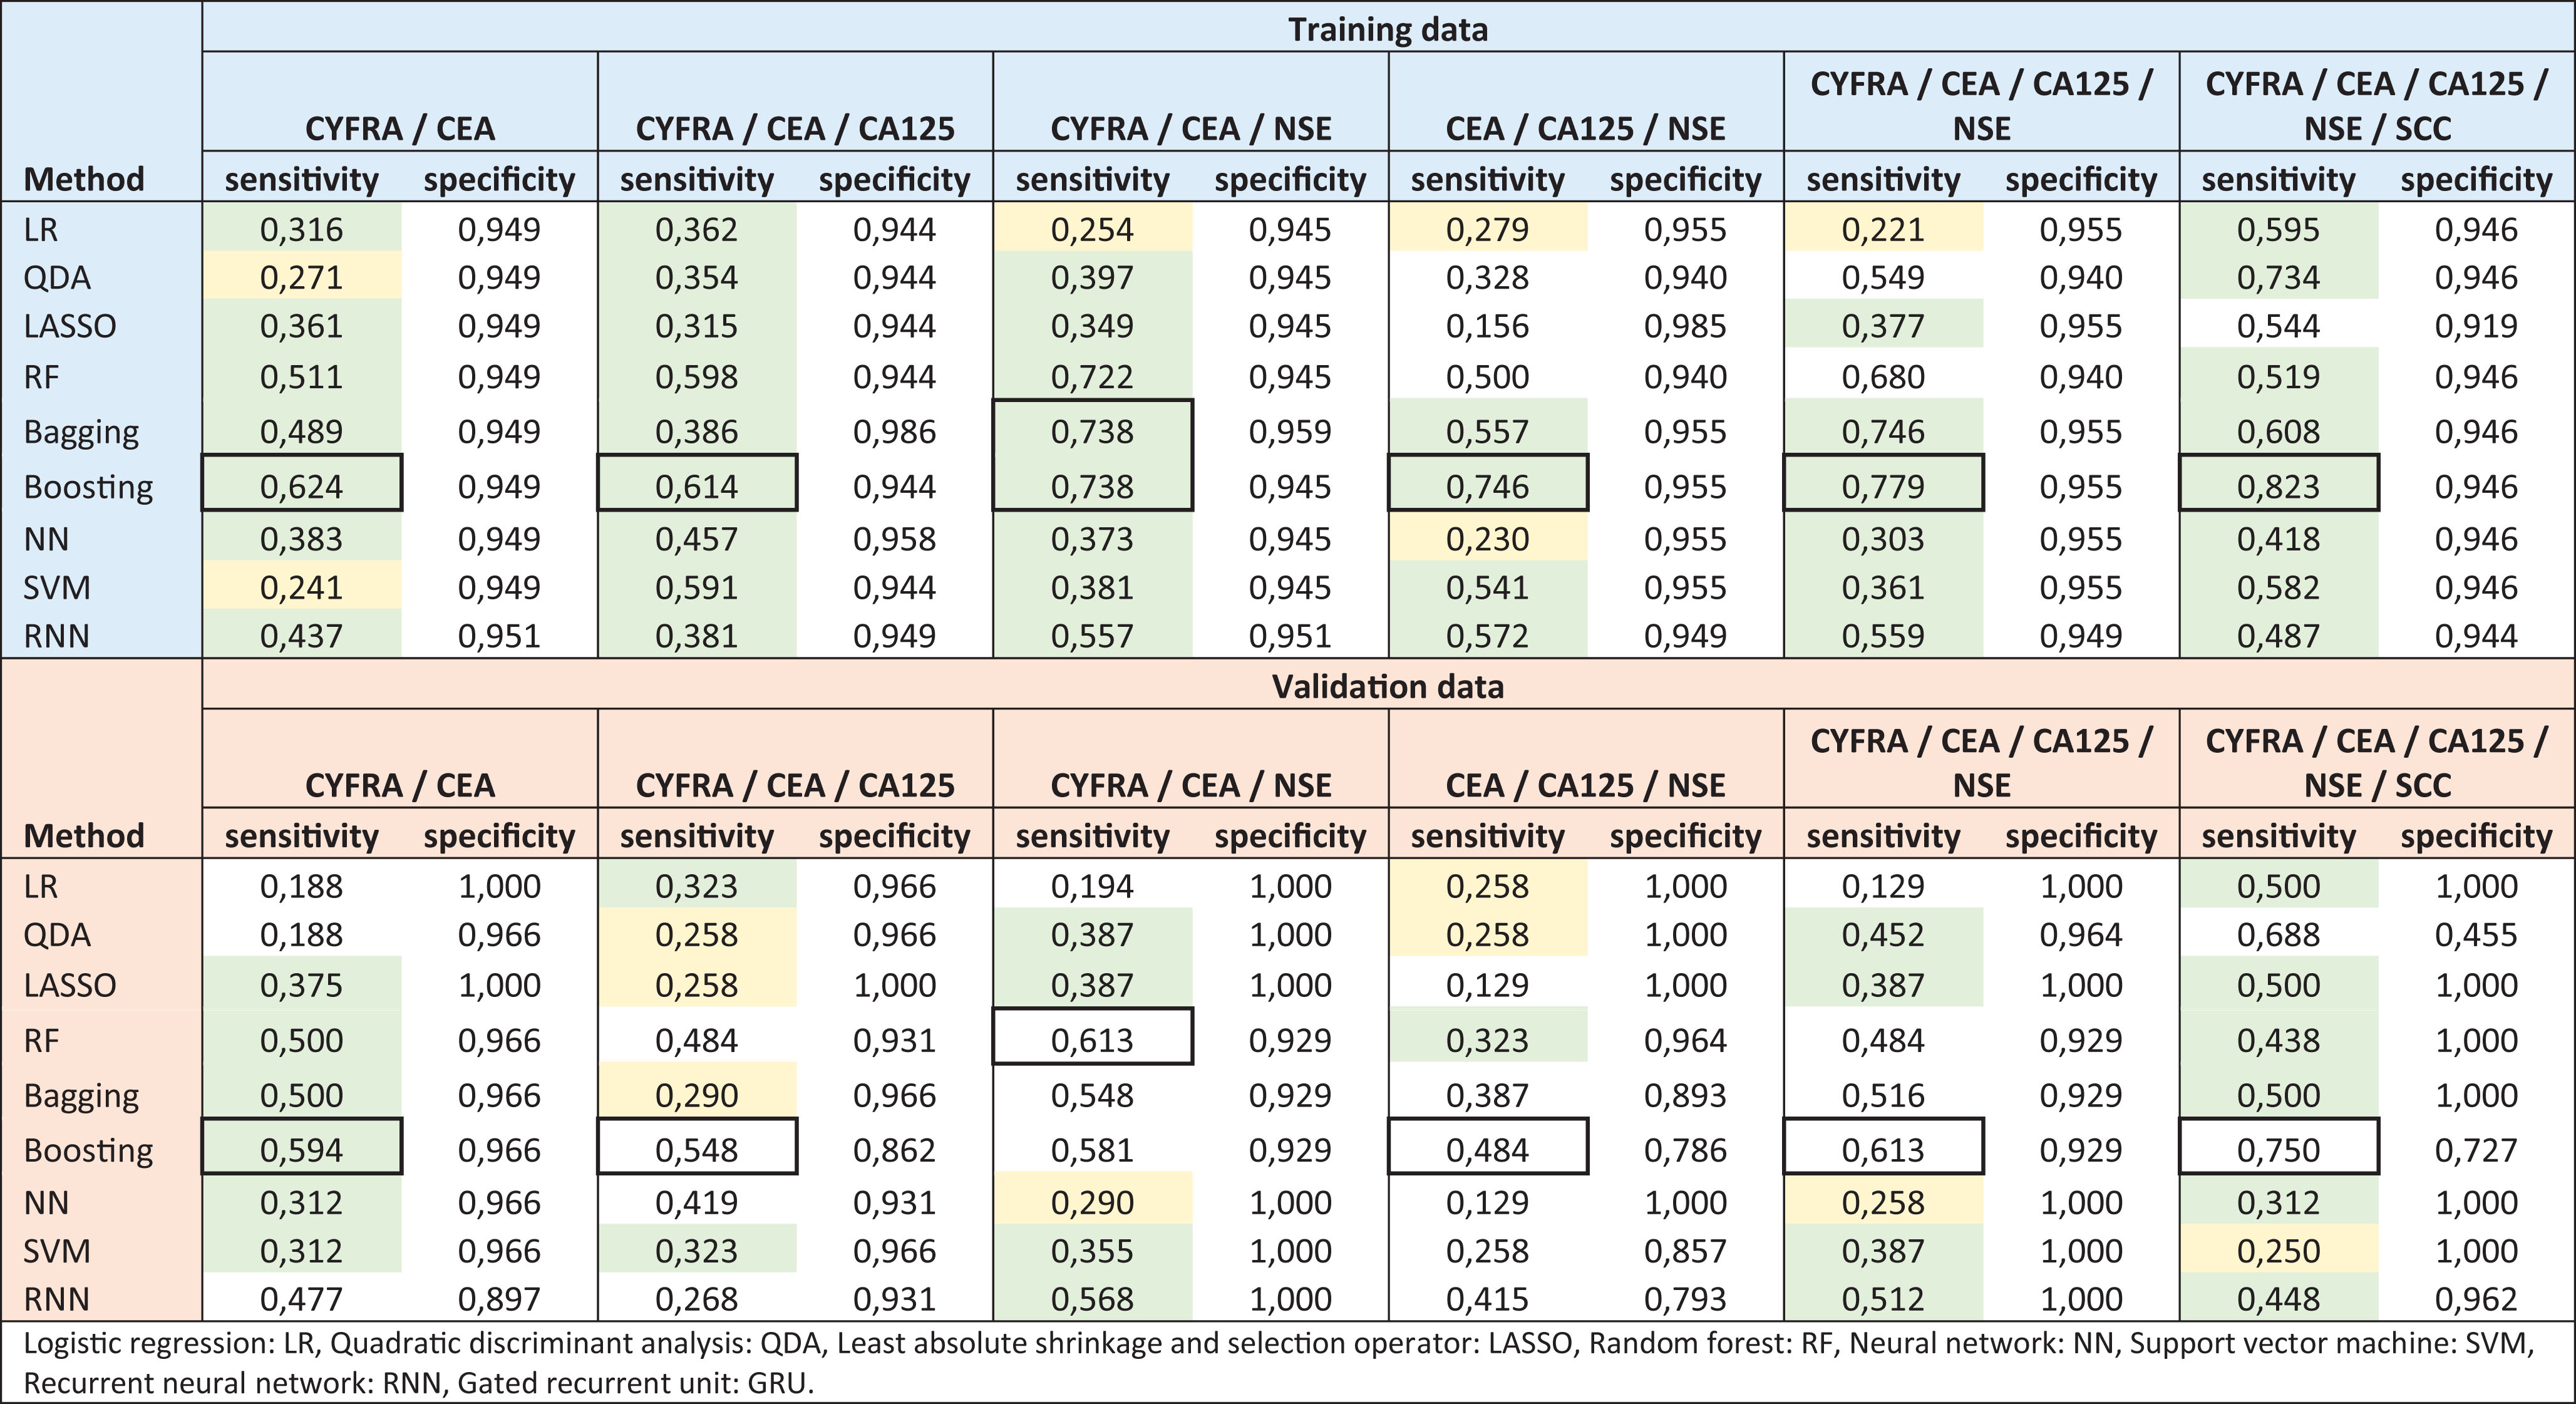
The accuracy of the different models applied to combinations of multiple longitudinal STM measurements is depicted in Table 2. The highest sensitivity achieved on the training data was 82.3%, using a boosting model applied to CYFRA, CEA, CA125, NSE, and SCC. For all STM combinations, boosting provided the highest sensitivity on the training data. However, for the STM combination of CYFRA, CEA, and NSE, bagging provided similar results. As indicated by the colored fields in Table 2, on the training data, all model and STM combinations, except the LASSO model applied to CEA, CA125, and NSE, are deemed useful since all sensitivity results exceed the set 20% sensitivity threshold. On the validation data the boosting model provided the highest sensitivity on five of the six STM combinations. The boosting model applied to all five STMs provided the highest sensitivity on the validation data. However, the specificity decreased to 72.7%, a 21.9% drop in specificity compared to the 94.6% achieved on the training data. The highest sensitivity on the validation data while maintaining a minimum specificity of 95% was 59.4%, achieved using boosting with CYFRA and CEA as input. In the validation, 48 out of the 54 model and STM combinations exceeded the 20% threshold. However, for 17 combinations, the specificity dropped to <95%, and 8 of these combinations resulted in a specificity <90%. Finally, 31 model and STM combinations were considered useful based on the prespecified criteria [11].
Table 2
The training and validation results per method and serum tumor marker (STM) combination. The model providing the highest sensitivity per STM combination is indicated by a black square. Model and STM combinations resulting in a sensitivity >20% and <30% and a specificity >95% are marked yellow, combinations resulting in a sensitivity >30% and specificity >95% are marked green
 |
3.2Partial area under receiver operating characteristics curve
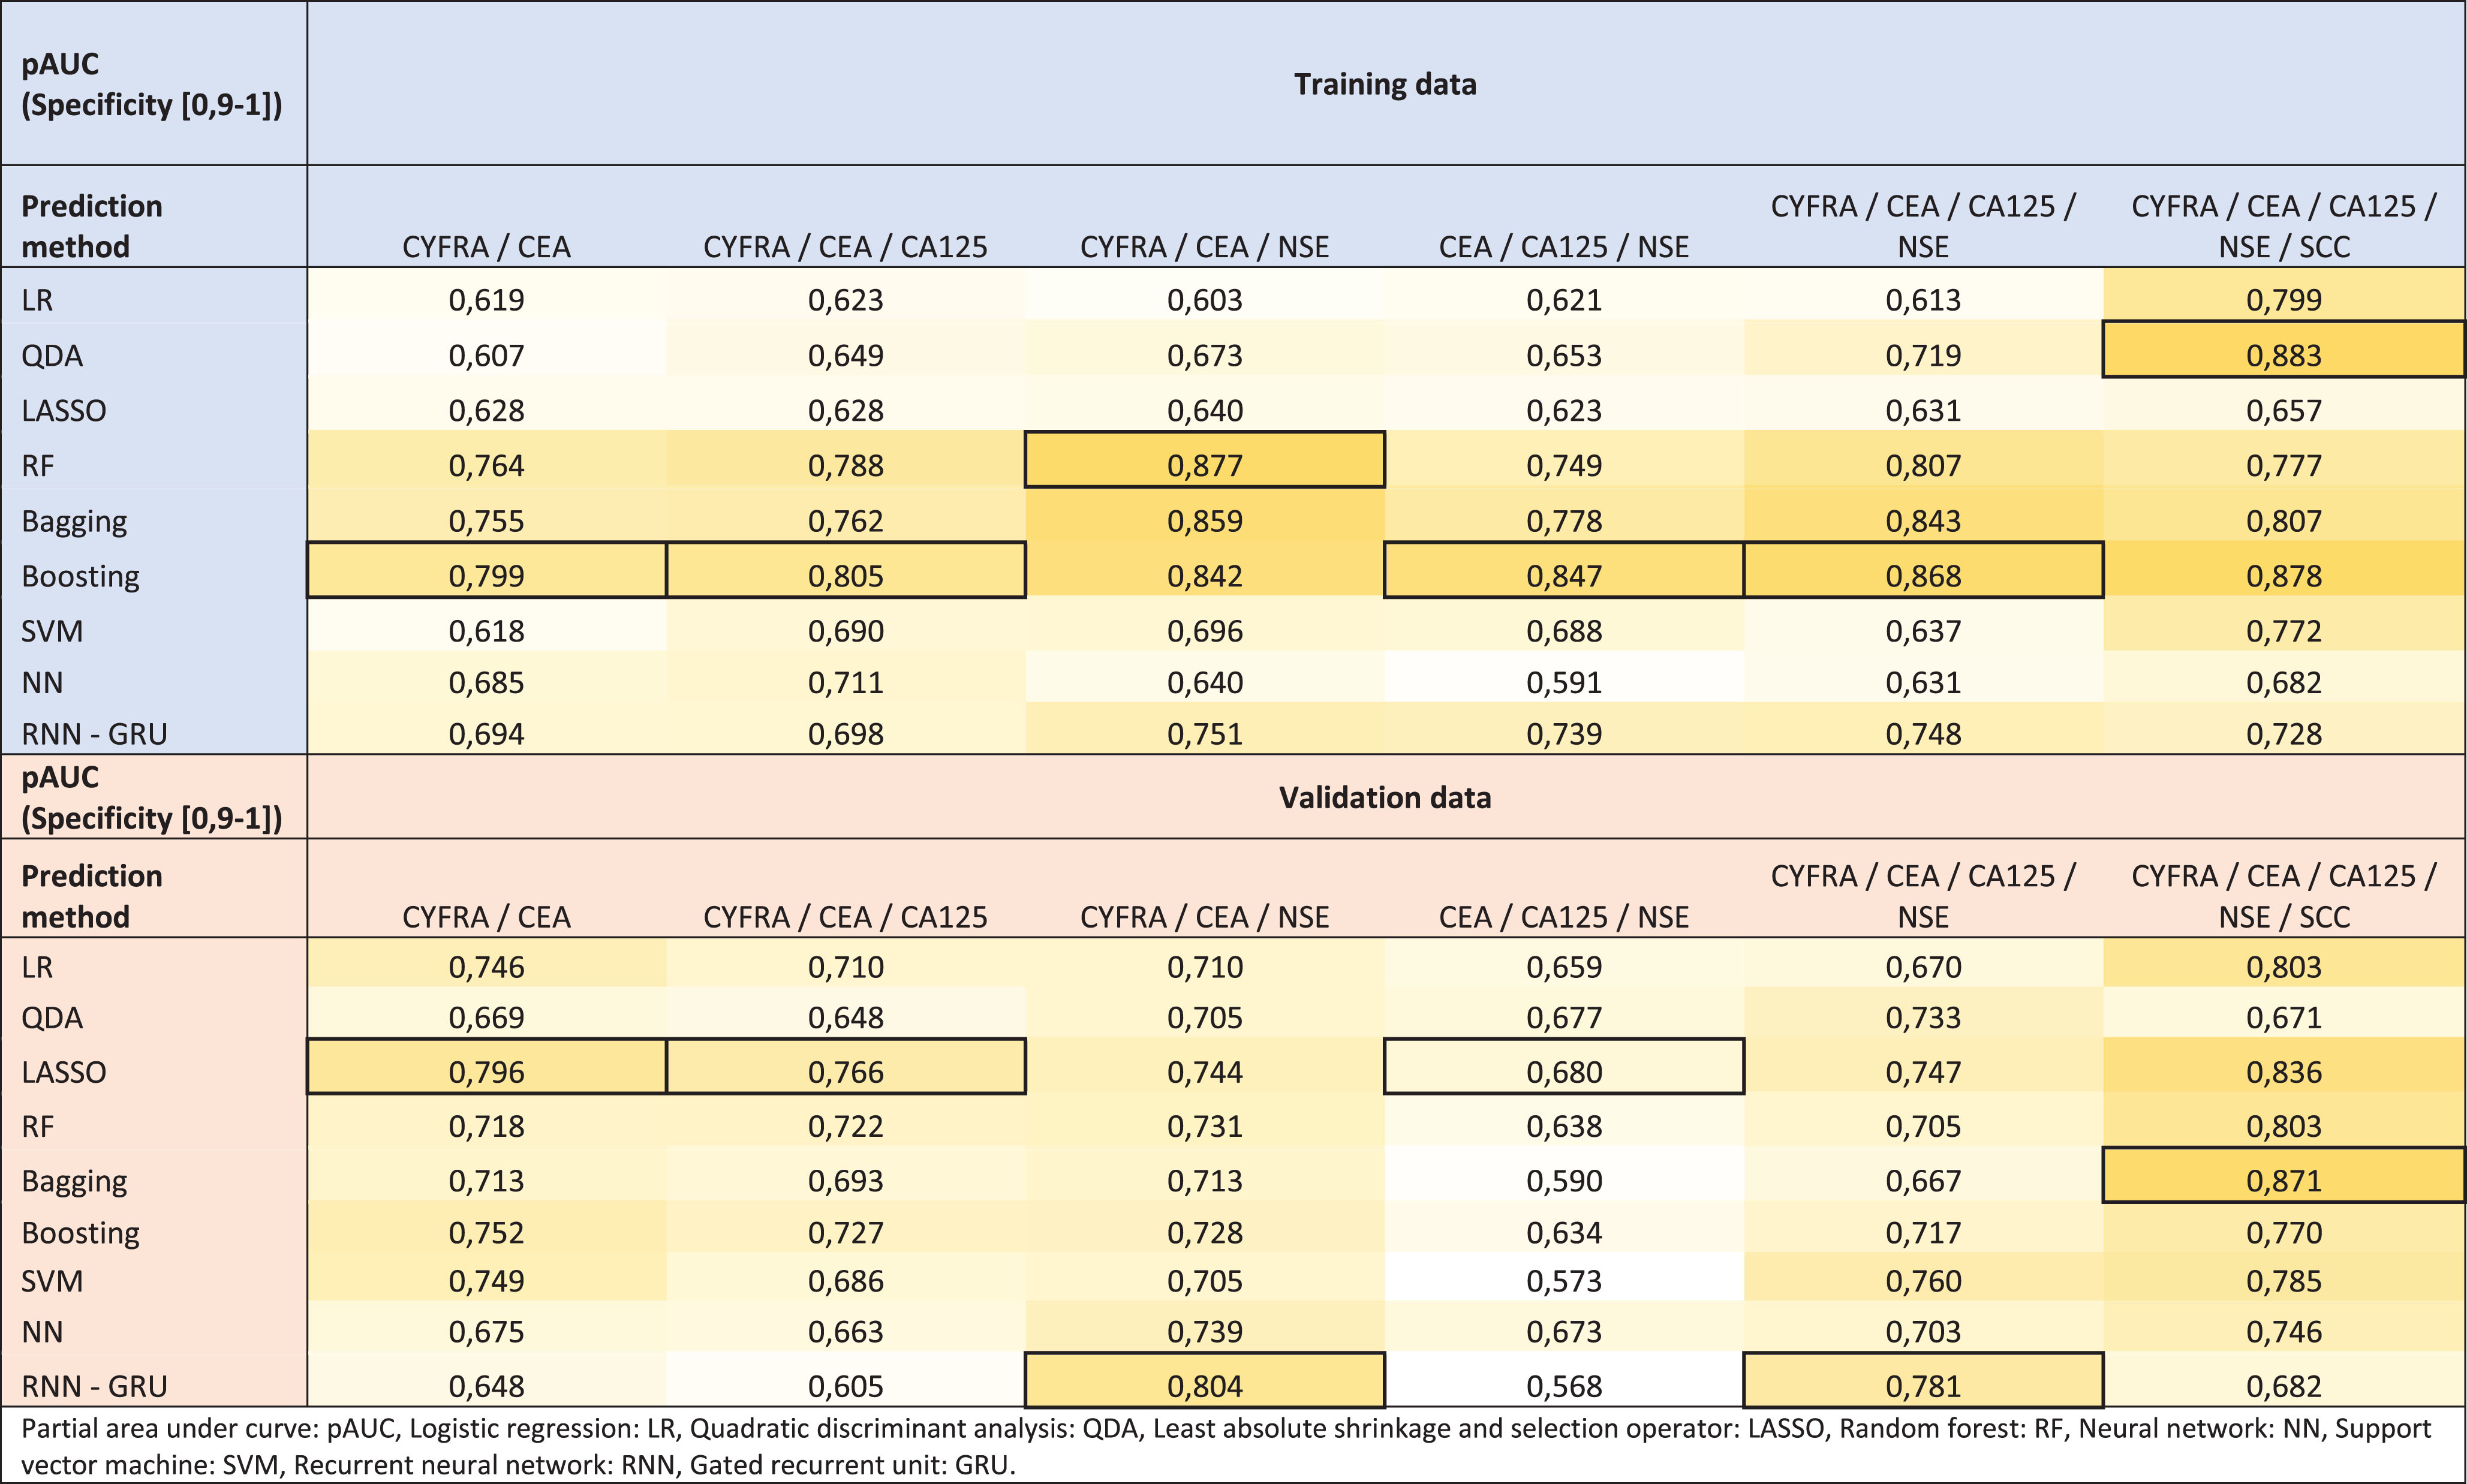
The pAUC for each method and STM combination are depicted in Table 3. The pAUC for the training data ranged from 0.591 for the NN applied to CYFRA, CEA, and NSE, to 0.883 for the QDA applied to all five STMs. The boosting model provided the highest pAUC for four of the six STM combinations. On the validation data, the pAUC ranged from 0.568 for RNN applied to CYFRA, CEA, and NSE, to 0.871 for bagging applied to all five STMs. Full ROC curves for each STM combination are depicted in supplementary materials, Figs. S1 to S6.
Table 3
The partial area under receiver operating characteristics curve (pAUC) [specificity: 0.9–1]. A darker shade of yellow is used to indicate a higher pAUC, and the black square indicates the highest pAUC per serum tumor marker combination
 |
3.3Optimism correction
The optimism was calculated for the model providing the highest sensitivity on the training data, i.e., boosting applied to CYFRA, CEA, CA125, and CEA. This boosting model achieved a sensitivity and specificity of 82.3% and 94.6% on the training data, respectively. The average optimism was 7.7% (SD: 4.4%) and 10.7% (SD:6.1%) for the sensitivity and specificity, respectively. Resulting in an optimism-corrected sensitivity of 70.7%, and an optimism-corrected specificity of 78.5%.
3.4Model accuracy on bootstrap samples
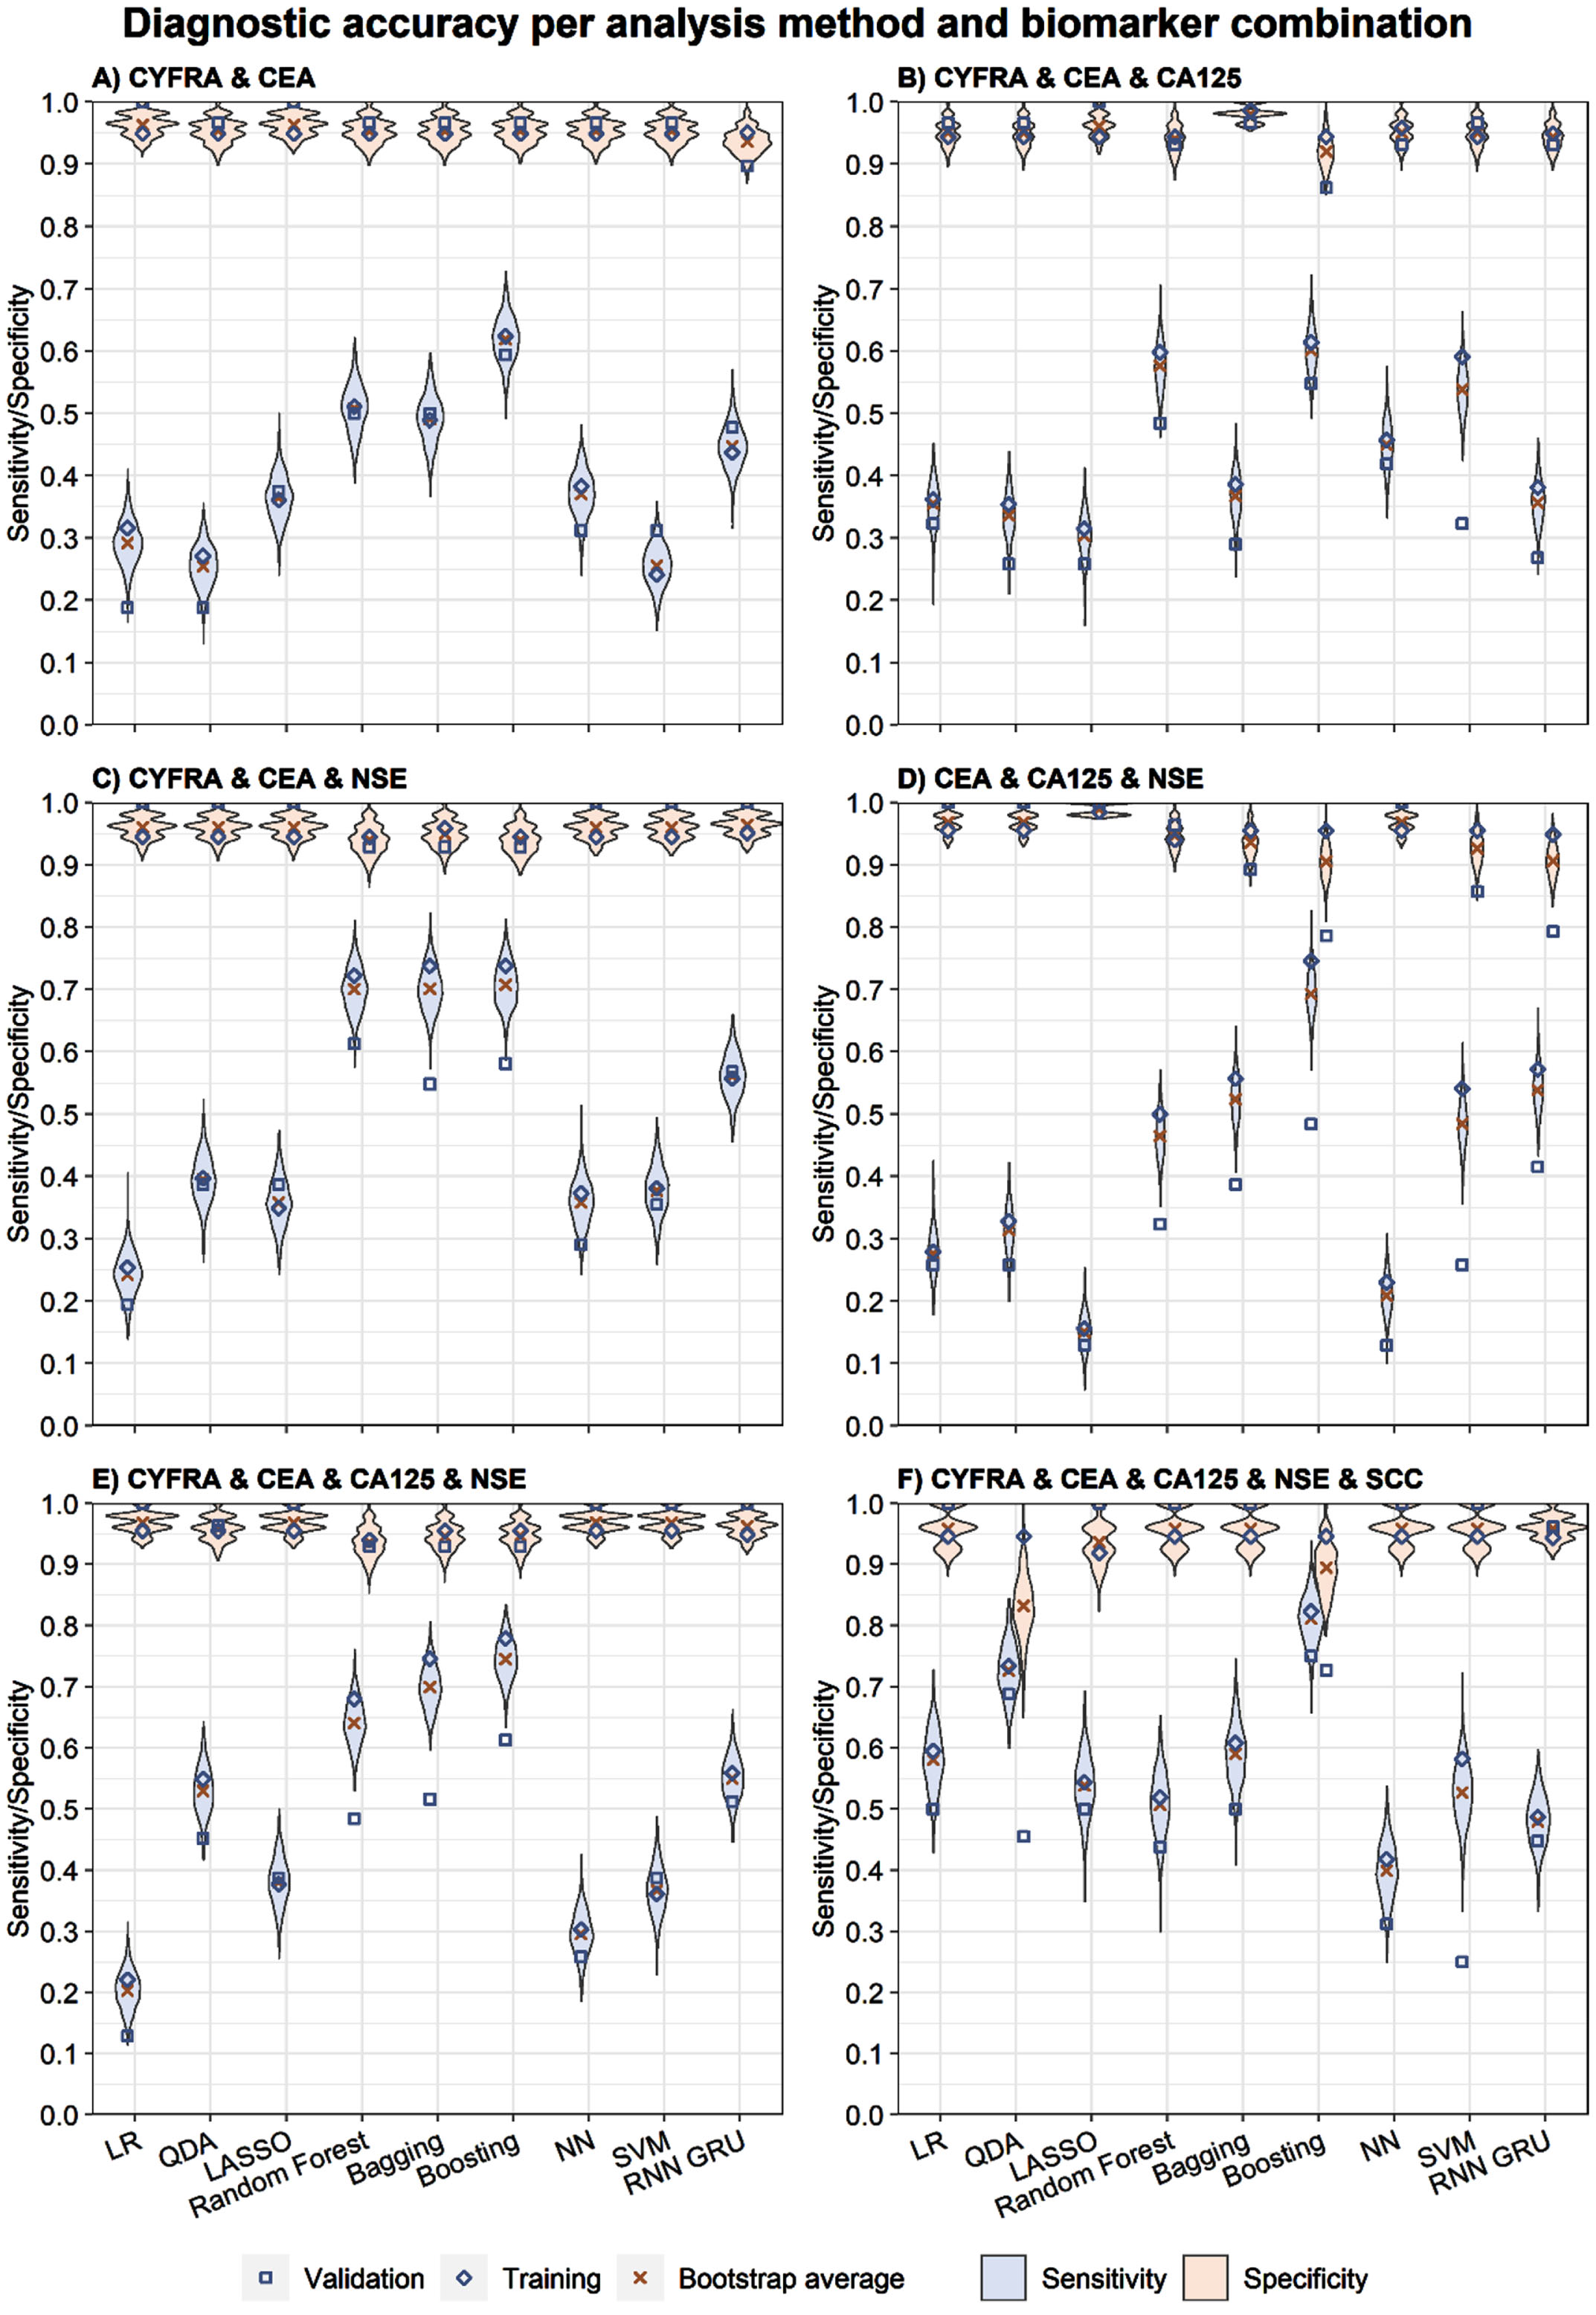
Figure 1 depicts the sensitivity and specificity for all model and STM combinations for the training, validation, and bootstrap samples. Violin plots are used to depict the distribution of bootstrap results. The highest average sensitivity on the bootstrap sample was 81.2%, and was achieved using boosting with CYFRA, CEA, CA125, NSE, and SCC as input. The average specificity found for this model and STM combination was 89.5%. Moreover, boosting models provided the highest sensitivity for all STM combinations. The average sensitivity and specificity for each model and biomarker combination are depicted in Table S7 (supplementary materials). Additionally, the correlation and covariance between the sensitivity and specificity are provided in Tables S8 and S9 (supplementary materials).
Fig. 1
The sensitivity and specificity outcomes for the training, validation, and bootstrap per method and biomarker combination.
4Discussion
Combining multiple biomarkers measured over time into a single response measure is complex and, to our knowledge, has not been previously applied to the prediction of immunotherapy response in NSCLC patients. The best performing model applied to a combination of STMs presented in this study reached a 59.4% sensitivity with a ≥95% specificity for predicting non-response at six months after treatment (Table 2). Overall, the results from model training and validation indicate that a boosting model performs best in this context, which is also supported by the pAUC outcomes on the training data. However, the pAUC results found on the validation data show that LASSO, bagging, and RNN might outperform the boosting models for some STM combinations (Table 3).
The best performing model found in this study was a boosting model using CYFRA, and CEA as input. Increasing the number of STMs by adding CA125 and NSE did increase the sensitivity of boosting on the validation data to 61.3%, however, the specificity dropped to 92.9% (Table 2). The pAUC results on the training data also show that including more STMs in models results in marginal gains in accuracy. On the training data RF, bagging, and boosting reach a pAUC >0.7 for each STM combination. When looking at all methods considered, the gain in pAUC from adding one more STM(s) to one of these models is marginal. For example, an average increase in pAUC of 0.021 and 0.046 was found when adding either CA125 or NSE as input, compared with using only CYFRA and CEA as input, respectively (Table 3). While adding more STMs to the model might increase the available information for prediction, adding additional variables to the model might also introduce noise. Particularly, known benign causes of falsely elevated tumor marker concentrations might be of influence here [18]. Although more flexible models can potentially extract more predictive information from the data, the flexibility can also cause models to follow the noise too closely causing the model to generalize poorly [19]. During model training, cross validation and dropout were used when appropriate to avoid overfitting.
Comparing the pAUC to the sensitivity and specificity results found on the training data shows that both results align well, given that model and STM combinations resulting in a high sensitivity also achieve a high pAUC (Tables 2 & 3). As shown in the results, boosting provided the highest sensitivity for all STM combinations. Except for the STM combinations of CYFRA, CEA, and NSE and all five STMs, boosting also provided the highest pAUC. However, on the validation data other models achieved a higher pAUC on five out of the six STM combinations. Since the prediction threshold is chosen such that 95% specificity is obtained on the training data, the sensitivity and specificity results only reflect a single point on the ROC curve, while the pAUC is based on the 90% to 100% specificity range of the ROC curve. From the pAUC results it is clear that, depending on the actual acceptable specificity in clinical practice, multiple methods can have good predictive performance.
The optimism-corrected performance was calculated to estimate the true performance of the best performing model in an external cohort. This procedure was applied to boosting using all STMs as input. The optimism correction shows a drop in specificity of 16.1% from 94.6% to 78.5%, while the sensitivity dropped by 11.6% from 82.3% to 70.7%. This indicates that when applying the model to an external cohort, the specificity is expected to drop more than the sensitivity. When comparing the optimism-corrected performance to the results found on the validation data, similar specificity results were found, i.e., 72.7% and 78.5% for the validation data and after optimism correction, respectively. For the sensitivity the difference was even smaller. The sensitivity results on the validation data and after optimism correction were 75.0% and 70.7%, respectively.
There are several limitations to this study. First, the LR, QDA, and LASSO models might be improved by incorporating interaction terms. However, the number of variables would then increase rapidly when incorporating more STMs. As inclusion of interaction terms would also require assumptions about relationships between STMs, no interaction terms were included in this study. Second, while an attempt was made to optimize the investigated models’ settings, it may still be possible to improve the performance of models further. Last, the use of other summary measures of STM values could potentially also result in improved performance. It would therefore be valuable to evaluate and include more summary statistics when developing a prediction model.
In conclusion, this study shows how multiple sequentially measured STMs can be combined in a prediction model to predict non-response in immunotherapy treated NSCLC patients. These models may help guide immunotherapy decisions and identify the patients most likely to benefit from this specific treatment. Overall, boosting provided the best model performance across all investigated STM combinations and this model could potentially be used to discontinue treatment after six weeks in almost two thirds of patients who will not benefit from treatment. The boosting model based on CYFRA and CEA should be subject to external validation to assess its potential value in clinical use.
Acknowledgments
None.
Author contributions
CONCEPTION: FAvD, MS, HK, MJIJ, HHvR and MMvdH
DATA CURATION: MS, MM, SAB, HHvR and MMvdH
ANALYSIS OF DATA: FAvD and MS
PREPARATION OF THE MANUSCRIPT: FD, MS, HHvR, HK, MMvdH and MJIJ
REVISION FOR IMPORTANT INTELLECTUAL CONTENT: FAvD, MS, HK, MM, SAB, HHvR, MMvdH and MJIJ
SUPERVISION: MJIJ, MMvdH, HK and HHvR
Conflict of interest
HHvR is an editorial board member of Tumor Biology but had no involvement in the peer review process of this article. MMvdH is one of the editors of the lung cancer special issue of Tumor Biology but had no involvement in the peer review process of this article. The other authors have no conflicts of interest to report.
Supplementary material
[1] The supplementary material is available in the electronic version of this article: https://dx.doi.org/10.3233/TUB-220022.
References
[1] | Planchard D , Popat S , Kerr K , Novello S , Smit EF , Faivre-Finn C , et al. Metastatic non-small cell lung cancer: ESMO Clinical Practice Guidelines for diagnosis, treatment and follow-up. Annals of Oncology. (2018) ;29: :iv192–237. 10.1093/annonc/mdy275. |
[2] | Low JL , Walsh RJ , Ang Y , Chan G , Soo RA . The evolving immuno-oncology landscape in advanced lung cancer: First-line treatment of non-small cell lung cancer. Therapeutic Advances in Medical Oncology. (2019) ;11: :1758835919870360. doi: 10.1177/1758835919870360. |
[3] | Garon EB , Rizvi NA , Hui R , Leighl N , Balmanoukian AS , Eder JP , et al. Pembrolizumab for the treatment of non–small-cell lung cancer. New England Journal of Medicine. (2015) ;372: (21):2018–28. doi: 10.1056/NEJMoa1501824. |
[4] | Borghaei H , Gettinger S , Vokes EE , Chow LQM , Burgio MA , de Castro Carpeno J , et al. Five-year outcomes from the randomized, phase III trials checkMate 017 and Nivolumab versus docetaxel in previously treated non–small-cell lung cancer. Journal of Clinical Oncology. (2021) ;39: (7):723–33. doi: 10.1200/JCO.20.01605. |
[5] | Anagnostou V , Niknafs N , Marrone K , Bruhm DC , White JR , Naidoo J , et al. Multimodal genomic features predict outcome of immune checkpoint blockade in non-small-cell lung cancer. Nature Cancer. (2020) ;1: (1):99–111. doi: 10.1038/s43018-019-0008-8. |
[6] | De Vries R , Muller M , Van Der Noort V , Theelen WSME , Schouten RD , Hummelink K , et al. Prediction of response to anti-PD-1 therapy in patients with non-small-cell lung cancer by electronic nose analysis of exhaled breath. Annals of Oncology. (2019) ;30: (10):1660–6. doi: 10.1093/annonc/mdz279. |
[7] | Valentinuzzi D , Vrankar M , Boc N , Ahac V , Zupancic Z , Unk M , et al. [F]FDG PET immunotherapy radiomics signature (iRADIOMICS) predicts response of non-small-cell lung cancer patients treated with pembrolizumab. Radiology and Oncology. (2020) ;54: (3):285–94. doi: 10.2478/raon-2020-0042. |
[8] | Molina R , Holdenrieder S , Auge JM , Schalhorn A , Hatz R , Stieber P . Diagnostic relevance of circulating biomarkers in patients with lung cancer. Cancer Biomarkers: Section A of Disease Markers. (2010) ;6: (3-4):163–78. doi: 10.3233/cbm-2009-0127. |
[9] | Lang D , Horner A , Brehm E , Akbari K , Hergan B , Langer K , et al. Early serum tumor marker dynamics predict progression-free and overall survival in single PD-1/PD-L1 inhibitor treated advanced NSCLC-A retrospective cohort study. Lung Cancer. (2019) ;134: :59–65. doi: 10.1016/j.lungcan.2019.05.033. |
[10] | Moritz R , Muller M , Korse CM , van den Broek D , Baas P , van den Noort V , et al. Diagnostic validation and interpretation of longitudinal circulating biomarkers using a biomarker response characteristic plot. Clinica Chimica Acta; International Journal of Clinical Chemistry. (2018) ;487: :6–14. doi: 10.1016/j.cca.2018.09.015. |
[11] | Muller M , Hoogendoorn R , Moritz RJG , van der Noort V , Lanfermeijer M , Korse CM , et al. Validation of a clinical blood-based decision aid to guide immunotherapy treatment in patients with non-small cell lung cancer. Tumor Biology. (2021) ;43: :115–27. doi: 10.3233/TUB-211504. |
[12] | Jiang J , Jin Z , Zhang Y , Peng L , Zhang Y , Zhu Z , et al. Robust prediction of immune checkpoint inhibition therapy for non-small cell lung cancer. Frontiers in Immunology. (2021) ;12: (940). doi: 10.3389/fimmu.2021.646874. |
[13] | Schouten RD , Muller M , de Gooijer CJ , Baas P , van den Heuvel M . Real life experience with nivolumab for the treatment of non-small cell lung carcinoma: Data from the expanded access program and routine clinical care in a tertiary cancer centre-The Netherlands Cancer Institute. Lung Cancer. (2018) ;126: :210–6. doi: 10.1016/j.lungcan.2017.11.012. |
[14] | Rizvi H , Sanchez-Vega F , La K , Chatila W , Jonsson P , Halpenny D , et al. Molecular determinants of response to anti-programmed cell death (PD)-1 and anti-programmed death-ligand 1 (PD-L1) blockade in patients with non-small-cell lung cancer profiled with targeted next-generation sequencing. Journal of Clinical Oncology: Official Journal of the American Society of Clinical Oncology. (2018) ;36: (7):633–41. doi: 10.1200/JCO.2017.75.3384. |
[15] | Eisenhauer EA , Therasse P , Bogaerts J , Schwartz LH , Sargent D , Ford R , et al. New response evaluation criteria in solid tumours: Revised RECIST guideline (version 1. 1).. European Journal of Cancer (Oxford, England: 1990). (2009) ;45: (2):228–47. doi: 10.1016/j.ejca.2008.10.026. |
[16] | Robin X , Turck N , Hainard A , Tiberti N , Lisacek F , Sanchez J-C , et al. pROC: An open-source package for R and S+ to analyze and compare ROC curves. BMC Bioinformatics. (2011) ;12: (1):77. doi: 10.1186/1471-2105-12-77. |
[17] | Harrell FE Jr, Lee KL , Mark DB . Multivariable prognostic models: Issues in developing models, evaluating assumptions and adequacy, and measuring and reducing errors. Statistics in Medicine. (1996) ;15: (4):361–87. doi: 10.1002/(sici)1097-0258(19960229)15:4<361::Aid-sim168>3.0.Co;2-4. |
[18] | Trapé J , Filella X , Alsina-Donadeu M , Juan-Pereira L , Bosch-Ferrer Á , Rigo-Bonnin R . Increased plasma concentrations of tumour markers in the absence of neoplasia. Clinical Chemistry and Laboratory Medicine. (2011) ;49: (10):1605–20. doi: 10.1515/cclm.2011.694. |
[19] | James G , Witten D , Hastie T , Tibshirani R . Statistical Learning. In: James G,Witten D, Hastie T, Tibshirani R, editors. An Introduction to Statistical Learning: With Applications in R. New York, NY: Springer US; (2021) , pp. 15–57. |


