
β-Catenin is reduced in membranes of human prolactinoma cells and it is inhibited by temozolomide in prolactin secreting tumor models
Abstract
INTRODUCTION:
Prolactinomas are the most frequent pituitary tumor subtype. Despite most of them respond to medical treatment, a proportion are resistant and become a challenge in clinical management. Wnt/β-Catenin pathway has been implicated in several cancers including pituitary tumors and other sellar region malignancies. Interestingly, Wnt/β-Catenin inhibition augments the cytotoxicity of the chemotherapeutic agent Temozolomide (TMZ) in different cancers. TMZ is now being implemented as rescue therapy for aggressive pituitary adenoma treatment. However, the molecular mechanisms associated with TMZ action in pituitary tumors remain unclear.
OBJECTIVES:
Our aims in the present study were to evaluate differential β-Catenin expression in human resistant prolactinomas and Wnt/β-Catenin signaling activation and involvement in Prolactin (PRL) secreting experimental models treated with TMZ.
RESULTS:
We first evaluated by immunohistochemistry β-Catenin localization in human resistant prolactinomas in which we demonstrated reduced membrane β-Catenin in prolactinoma cells compared to normal pituitaries, independently of the Ki-67 proliferation indexes. In turn, in vivo 15 mg/kg of orally administered TMZ markedly reduced PRL production and increased prolactinoma cell apoptosis in mice bearing xenografted prolactinomas. Intratumoral β-Catenin strongly correlated with Prl and Cyclin D1, and importantly, TMZ downregulated both β-Catenin and Cyclin D1, supporting their significance in prolactinoma growth and as candidates of therapeutic targets. When tested in vitro, TMZ directly reduced MMQ cell viability, increased apoptosis and produced G2/M cell cycle arrest. Remarkably, β-Catenin activation and VEGF secretion were inhibited by TMZ in vitro.
CONCLUSIONS:
We concluded that dopamine resistant prolactinomas undergo a β-Catenin relocalization in relation to normal pituitaries and that TMZ restrains experimental prolactinoma tumorigenicity by reducing PRL production and β-Catenin activation. Together, our findings contribute to the understanding of Wnt/β-Catenin implication in prolactinoma maintenance and TMZ therapy, opening the opportunity of new treatment strategies for aggressive and resistant pituitary tumors.
1Introduction
Pituitary tumors are one of the most frequent neoplasms of all intracranial tumors [1]. Among them, prolactinomas are the most frequent [2]. Despite the majority of prolactinomas respond to dopamine agonists, a proportion are or turn resistant and require other treatments including surgery and/or radiotherapy [3], which may also fail in aggressive or recurrent tumors. Hence, alternative or salvage therapies to control resistant prolactinoma growth become a constant challenge [4].
Several signaling pathways have been found hyperactivated and linked to tumor aggressiveness and drug resistance [4–8]. Wnt/β-Catenin signaling participates in development and homeostasis of embryonic and adult tissues in normal conditions. It is involved in crucial cell processes such as proliferation, cell adhesion, morphogenesis and self-renewal, among others [9, 10]. It also shows aberrant activation in many types of cancers included pituitary tumors [11–14], in which several components of canonical and non canonical Wnt pathways have been associated with tumor development [15–17]. Interestingly, Wnt/β-Catenin has been implicated in the chemoresistance of different types of cancer [18–20]. In particular, its inhibition augments the cytotoxicity of the alkylating agent Temozolomide (TMZ) in colon carcinoma, glioblastoma, medulloblastoma and neuroblastoma cell lines [21].
TMZ, widely employed to treat malignant neoplasms [22–24], has more recently been used as salvage therapy of aggressive pituitary adenomas and carcinomas [25–27]. Until December 2020, there were 267 publications involving 429 patients with pituitary adenoma or carcinoma treated with TMZ [28], most of them clinical case reports or systematic reviews of TMZ reported experiences which associate tumor volume and hormone secretion reduction to TMZ effectiveness [29–32]. Interestingly, TMZ becomes an opportunity for treatment of cabergoline resistant prolactinomas as a salvage therapy after all conventional modalities of treatment have failed.
It is documented that lower levels of expression of the O6-methylguanine-DNA methyltransferase (MGMT) that counteracts the alkylating effect of TMZ, correlated with favorable response to this drug in some cases but not in others [30, 33–35]. However, deeper preclinical and clinical studies of the molecular mechanisms that mediate TMZ action in pituitary tumors are needed.
In this work, we evaluated β-Catenin expression and localization in human resistant prolactinomas, and Wnt/β-Catenin signaling performance in PRL secreting models under in vivo and in vitro TMZ treatment. We found that human resistant prolactinomas would undergo a potential Wnt pathway activation through membrane β-Catenin reduction, and that TMZ compromised Wnt/β-Catenin signaling activation together with PRL production in murine pituitary tumor models. Together, our results point to the canonical Wnt/β-Catenin signaling involvement in prolactinoma tumorigenesis and in TMZ pituitary tumor treatment.
2Materials and methods
2.1Tumor specimens
Resistant prolactinoma samples were obtained from eight patients who underwent neurosurgery at La Pequeña Familia Clinic in Junín, and Fleni Institute and Santa Isabel Clinic in Buenos Aires, Argentina. Characteristics of patients with prolactinomas are summarized in Supplementary figure 1. None of the patients showed identifiable CNS or systemic metastases after an exhaustive clinical evaluation, which, according to the current concept, excludes the entity of pituitary carcinoma [36]. Immediately after transsphenoidal surgery, prolactinoma tissues that exceeded from routine pathologic studies were preserved in 4% neutral buffered formalin, dehydrated in graded ethanol and embedded in paraffin. Sections of 4 μm thickness were cut for subsequent immunohistochemical (IHC) studies. Ki-67 index of tumors (%) was determined at the pathological service from FLENI clinic. Approximately 1,000 cells in the areas with the highest staining were counted manually with the hot spot method. The project and procedures were approved by the Ethical Committee of participant Institutions and were conducted according to the principles stated in the Declaration of Helsinki by the World Medical Association. In all cases, patients were informed about the studies to be undertaken by neurosurgeons and signed the respective written consent. Patient identity was always kept anonymous. Normal pituitary tissues used in this study were obtained commercially (Biochain).
2.2Cell lines and culture conditions
Prolactinoma MMQ cell line, which was originated from a 7315a tumor of a female rat [37, 38], was kindly provided by Dr. Rodolfo Goya from INIBIOLP, National University of La Plata, Buenos Aires, Argentina. Cells were cultured in suspension in DMEM medium (Gibco) supplemented with 10% horse serum (Microvet SRL, Argentina), 5% fetal bovine serum (Gibco), 1% glutamine and 1% penicillin/streptomycin, and maintained at 37°C and 5% CO2. For drug treatment, cells were plated at a suitable density in DMEM medium with reduced serum conditions. Temozolomide (TMZ, PubChem CID 5394; obtained from Raffo Laboratories) was added at a final concentration of 200 μM (or DMSO as control) and cells were cultured for 12, 24, 48 or 72 hours (h) depending on the subsequent studies. During each cell culture, cell morphology and growing (in suspension, as clumps of cells) and PRL production were checked for cell line authentication. Cell line passages were under standard control (cells at more than 5–10th passages were not used for the experiments). In addition, cells were periodically analyzed by PCR to discard the presence of mycoplasma contamination.
2.3Animals
Animals were housed in groups of 5 in a light and temperature-controlled room with free access to tap water and laboratory chow. Experimental procedures were carried according to the National Institutes of Health guide for the care and use of Laboratory animals (NIH Publications No. 8023, revised 1978), complying with the ARRIVE guidelines and the guidelines of the institutional animal care and use committee of the National University of the Northwest of Buenos Aires Province (UNNOBA).
A total of twenty female 4 week old N:NIH Nu/Nu mice (10 animals per group of treatment, divided in 3 independent experimentation series) were used for xenogenic tumor generation by subcutaneous injection of 500,000 MMQ cells at the left flank. Tumors developed and became visible after approximately 20 days. TMZ treatment schedule was as follows: when tumors reached approximately 100 mm3, 15 mg/kg TMZ were administered by oral gavage, five times a week along two weeks with a rest period of two days after each cycle.
Control animals received vehicle (DMSO) in the same scheme. Tumor size was recorded with caliper every two days and tumor volume was calculated with the following formula: large side x (small side)2 x 0.52. Animal body weight was registered, treatment and blood samples were periodically obtained from facial vein for hormone evaluation. At the end of treatment, animals were euthanized by decapitation following accepted standards; individual tumors were excised and collected in RNA later solution (Invitrogen) for RNA isolation, in formalin for immunohistochemistry procedures and in lysis buffer for protein extraction.
2.4RNA extraction and cDNA synthesis
Total RNA extraction from xenogenic tumors and MMQ cell lysates was recovered using TRI reagent (Molecular Research Center, Inc), as we previously described [39]. RNA concentration was determined based on absorbance at 260 nm, its purity was evaluated by the ratio of absorbance at 260/280 nm (∼2.0 was considered appropriate, otherwise sample was discarded), and its integrity was evaluated by agarose gel electrophoresis. Two μg of RNA were reverse transcribed in 20 μl final volume in the presence of 3 mM MgCl2, 50 mM Tris·HCl (pH 8.3), 75 mM KCl, 1 mM deoxy-NTPs, 0.01 mM DTT, 1 pM oligo(dT)15–18 primer (Biodynamics, Buenos Aires, Argentina), and 10 U MMLV reverse transcriptase (Invitrogen, CA, USA). The reverse transcriptase enzyme or the RNA sample was omitted in control negative reactions.
2.5Real time PCR
Quantitative PCR was performed as we previously described [40]. Sense and antisense oligonucleotide primers were designed with PrimerBlast application (http://www.ncbi.nlm.nih.gov/tools/primer-blast/ [primer-blast/]). Oligonucleotides were synthesized by Biodynamics SRL and their sequences and annealing temperatures are described in Supplementary Table 1.
Quantitative PCR was performed using 7.5 μl FastStart SYBR Green Master Mix, (04673492001, Roche Laboratories), 2–150 ng cDNA (depending on the gene of interest), and specific primers in a final volume of 15 μl. After denaturation at 95°C during 15 minutes, the cDNA products were amplified for 40 cycles (20 seconds at 95°C, 60 seconds at 53.5–59°C depending on the primer pair, and 40 seconds at 72°C). The accumulating DNA products were monitored by the LineGene 9600 (Bioer, Binjiang, China). Results were validated based on the quality of dissociation curves and target gene expression relative to Actin mRNA was calculated as previous published work [40].
2.6Western blot (WB)
Xenografted tumor homogenates and MMQ cells lysates were prepared with a motor microtissue mixer in 100 to 300 μL of lysis buffer (50 mM HEPES [pH 7.4], 140 mM NaCl, 10% glycerol, 1 mM EDTA, 1 mM sodium orthovanadate, 10 mM sodium pyrophosphate, 100 mM sodium fluoride (NaF), and 10 μg/mL 1% Triton X-100) and 1 mM phenymethylsulfonyflouride (PMSF). Protease cocktail inhibitor (Roche Diagnostic, Mannheim, Germany) was added to the buffer just before use. The homogenate was centrifuged at 12,000 rpm for 30 min at 4°C. Extracted proteins were quantified by the Bradford method.
Forty to fifty micrograms of proteins were electrophoresed and blotted as described previously [8]. Treated and respective control samples were always transferred together to the same membrane. Rabbit polyclonal anti-total β-Catenin [1:1000, #06-734 Millipore, RRID:AB_310231], mouse monoclonal anti-active β-Catenin antibody [1:1000, 8E7 #05-665 Millipore, RRID:AB_309887], rabbit polyclonal anti-PRL [1:10000, A1618 Neobiolab, RRID:AB_2763630], mouse monoclonal anti-Proliferating Cell Nuclear Antigen [1/1000, sc-56, RRID:AB_628110], mouse monoclonal anti-JNK [1/1000, sc-7345, RRID:AB_675864], goat polyclonal anti-pGsK3β [1/1000, sc-11758, RRID: AB_2279469], goat polyclonal anti-CD31 [1/1000, sc-1506, RRID: AB_2161037] from Santa Cruz Biotechnology, and rabbit polyclonal anti-pERK [1/50000, #4370 Cell Signaling, RRID:AB_2315112] antibodies were used. Rabbit polyclonal anti-G3PDH antibody [1/1500, AC001 Neobiolab, RRID: AB_2619673] was used to validate equal amount of loaded protein.
Membranes were incubated with the corresponding horseradish peroxidase (HRP)-conjugated secondary antibody [1/2000, sc-2357, RRID:AB_628497; sc-2318, RRID:AB_641171; or sc-2384, RRID:AB_634814, Santa Cruz Biotechnology Inc], and protein bands were visualized after luminol, p-coumaric and hydrogen peroxide reaction on ImageQuant LAS 4000 Mini (G&E). Band intensities were quantified using ImageJ software (National Institutes of Health, Bethesda, MD).
2.7Immunohistochemistry
Immunohistochemistry (IHC) of paraffin embedded human tumor samples or xenografted tumors was performed as previously described [41]. The following primary antibodies were used: Rabbit Polyclonal anti-β-Catenin [1/300, Millipore #06-734], rabbit monoclonal anti-Ki-67 [1/50, ab16667 Abcam, RRID: AB_302459], rabbit polyclonal anti-PRL [1/300, A1618 Neobiolab, RRID: AB_2763630], rabbit polyclonal anti-cleaved (active) Caspase-3 [1/100, #229 Biocare Medical, RRID: AB_2737391] and rabbit monoclonal anti α-SMA [1/100, #19245 Cell Signaling, RRID: AB_2734735]. Replacement of the primary antibody with PBS was employed as negative control.
Biotin-conjugated goat anti-rabbit IgG antibody [dilution 1:200, sc-2491 Santa Cruz Biotechnology Inc, RRID: AB_628495] was used as secondary antibody.
Analysis was performed using a Carl Zeiss transmitted light microscope provided with an Axiocam digital camera, at 400 and 1000 total magnification. To quantify β-Catenin positive cells in human prolactinoma tissues, immunopositive cells for β-Catenin at cell membranes, cytoplasms and nuclei were counted, relativized to total nuclei of the image and expressed as percentages. At least 3 images from 3 different experiments were analyzed.
For Ki-67 immunostaining, Ki-67 expressing nuclei over a total of 2000 nuclei were quantified per animal. For α-SMA 25-100 pictures were analyzed per sample. For both markers, at least 3 separate experiments were analyzed using the image processing and analysis software: Image J (http://rsbweb.nih.gov/ij/). In detail, for the angiogenic marker α-SMA we calculated the vascular area, the microvessel density (MVD) and vessel size as follows: the vascular area was determined quantifying the cumulative area of TMZ treated or not treated prolactinomas occupied by α-SMA + vessels in relation to the total area (α-SMA+area/total area). MVD was determined by counting the number of α-SMA + vessels per millimetre2, and the size of vessels was measured as the average of total vessels’ size.
2.8Immunocytochemistry (ICC)
We determined β-Catenin expression in membranes, cytoplasms and nuclei of control and TMZ treated MMQ cells. The technique is already described by us in [39]. Cells were collected after 48 h of treatment, washed with PBS, fixated with PFA 4% and let dry on a positive charged slide (60,000 cells/slide approximately). Then, they were permeabilized with 0.3% Triton -PBS and blocked with 5% non-fat milk in 0.3% Triton-PBS for 1 h. Anti total β-Catenin [1/100, #A2064, ABclonal, RRID:AB_2764087] and Anti-rabbit Alexa Fluor® 488 Conjugate [1/200, #4412 Cell Signaling, RRID:AB_1904025] were employed. Replacement of the primary antibody with 0.3% Triton-PBS was used as negative control. DAPI was used for nuclei counterstaining, and slides were mounted with Mowiol mounting media. Slides were examined with an Axio Imager A2 microscope (ZEISS). Photos were taken with ZEISS Axiocam 503 mono at 40 X magnification and images were processed with Zen digital imaging software (ZEISS). Fifteen photos per each condition of three different experiments were analyzed. β-Catenin positive membranes, cytoplasms and nuclei were counted, relativized to total nuclei and expressed as percentages.
2.9Active β-Catenin detection by flow cytometry
Active β-Catenin expression was evaluated by flow cytometry in the MMQ cell line in vitro. After TMZ or control treatment, 3.5×10⁵ cells were harvested, washed with PBS and fixed with 4% PFA for 20 min in ice, then washed twice with permeabilization buffer (PB: 0.5 % saponin in PBS-10% FBS). Cells were permeabilized with PB for 15 minutes and incubated with a specific anti-active β-Catenin antibody [8E7, #05-665 Millipore, RRID:AB_309887] used at 1 μg per 1×10⁶ cells for 30 min in ice, then washed twice with PB and detected using 1 μg per 1×10⁶ Alexa Fluor® 647-conjugated Goat anti-mouse IgG [#405322, Biolegend, RRID: AB_2563045]. Isotype control was always used. Data (50,000 events) were acquired on a flow cytometer (FACSCantoII, BD Biosciences). The representative gates of analysis are shown in Supplementary Figure 6A. Experiments were analyzed with FlowJo software. β-Catenin activation was determined both by the median cell fluorescence (MFI) and the percentage of stained cells.
2.10Radioimmunoassay
Serum PRL of xenografted mice was measured by RIA using a kit provided by the National Institute of Diabetes and Digestive and Kidney Diseases [NIDDK; Dr. A. F. Parlow, National Hormone and Pituitary Program (NHPP), Torrance, CA, RRID: AB_2629220]. Assays were performed as kit instructions, using 10 μl of serum in duplicate. Results are expressed in terms of reference preparation RP3 PRL standard. Assay sensitivity threshold was 0.02 ng/mL and intra-assay coefficient of variation was 8.1%.
2.11VEGF determination by ELISA
The VEGF DuoSet ELISA Development kit [R&DSystems, RRID: AB_2800364] was used to evaluate VEGF production. For intratumoral VEGF detection, 60 μg of total tumor proteins in a final volume of 50 μl were employed. For in vitro VEGF secretion determination, 50 μl of an appropriate dilution of the culture supernatant were used.
Manufacturer’s instructions were followed, and determinations were performed by duplicate. The optical density was read at 450 nm in an ELISA microplate reader (BioRad), immediately after the addition of the reaction stop solution.
2.12Cell viability study
MMQ cell viability was colorimetrically determined at 595 nm using a commercial kit (CellTiter 96 AQueous non radioactive cell proliferation assay; Promega). 5×10³ cells were plated in a 96-well plate and incubated with TMZ for 12, 24, 48 or 72 h (or DMSO in controls). MTT was added along 4 h and solubilized as manufacturer’s instructions. Determinations were done by triplicate. The absorbance at 595 nm was measured by an ELISA microplate reader (BioRad).
2.13Apoptosis analysis
In order to assess apoptotic rates caused by TMZ in in vivo prolactinomas, immunohistochemistry of active Caspase 3 (1/100) was performed on prolactinomas tissue sections (as described in section 3.7). Positive cells per field were counted in the whole section. At least 3 separate experiments were analyzed using the image processing and analysis software, Image J (http://rsbweb.nih.gov/ij/). The direct effect of TMZ on MMQ lactotroph death in vitro was analyzed as follows: cells were treated for 12, 24, 48 and 72 h with the drug (or DMSO) and subsequently harvested and centrifuged at 1,600 r.p.m for 10 minutes to separate and discard supernatants. After washing with PBS and Binding Buffer “BB” (NaCl 150 mM, HEPES 10 mM, KCl 5 mM, CaCl2 4mM), pellets were resuspended in BB and incubated with anti-AnnexinV APC conjugated antibody (#31490016, Immunotools). Propidium Iodide (PI-Sigma) staining was performed in order to discriminate necrotic cells. Subsequently, cells were acquired on a flow cytometer (FACSCantoII, BD Biosciences) and analyzed with FlowJo software.
2.14Cell cycle analysis
To analyze cell cycle progression, MMQ cells were plated into 24-well plates at a density of 1.8×10⁵ cells/well, and synchronized in G0 for 24 h in 500 μl of DMEM medium without serum (1% glutamine and 1% P/S). After that, a control of synchronization was harvested and fixed, and 500 μl of complete medium (10% HS, 5% SFB, 1% glutamine and 1% P/S) was added to the rest of cells to achieve a final concentration of 5% HS and 2.5 % FBS for growth and stimuli. Afterwards, TMZ was added to treat cells for 12, 24, 48 or 72 h and then the cells were harvested. Pellets were recovered after centrifugation at 1,600 r.p.m for 10 minutes and fixed overnight in 70% ethanol. Ethanol was then eliminated and cells were re-hydrated in PBS at 4°C for 20 minutes. Subsequently, cells were centrifuged and pellets were resuspended in staining buffer (Tris 100 mM pH 7.4, NaCl 150 mM, CaCl2 1 mM, MgCl2 0.5 mM, NP40 0.1%), and after adding 60 μg/ml RNAse A (GE101-01-Transgene Biotech) and 10 μg/ml Propidium Iodide (PI-Sigma), cells were left for 30 minutes on ice in dark. After that, flow cytometry was used for PI positive cells detection (FACSCantoII, BD Biosciences). Doublet discrimination was performed and a subsequent analysis was done with the FlowJo Cell Cycle tool, determining the percentages of cells at different cell cycle phases, according to the Dean-Jett-Fox model.
2.15Wound healing assay
The pro-angiogenic capability of MMQ cells after TMZ treatment was studied through their supernatants’ capacity of promoting endothelial cells migration in vitro. Briefly, 2.5×10⁵ HMEC endothelial cells were plated into 24 well plates in growth medium (DMEM High Glucose + 10% FBS + 1% P/S + 1% Glutamine) until 90% of confluency. Cells were then serum deprived for 24 h and two parallel wounds per well were done with micropipette tip. MMQ conditioned media (MMQ supernatant mixed 1/2 with HMEC control media) or control media were added to HMEC cells. Pictures of the same section of each wound were taken at 0, 4, 8 y 24 h post-stimuli with an inverted microscope-coupled camera. Free migration area was quantified with ImageJ software. Controls with TMZ or DMSO on HMEC without MMQ supernatants were always performed.
2.16Statistical analysis
Normal data distribution and variance homogeneity were tested in all cases. When human normal and prolactinoma samples were compared, Student’s t-test or Mann-Whitney test were applied depending on statistical assumption test outcomes. For in vivo experiments, gene and protein expression levels of TMZ treated vs. control animals were analyzed by Student’s t-test. Tumor growth, serum PRL and body weight were tested by ANOVA for repeated measures followed by Bonferroni post test. Correlations between β-Catenin, Cyclin D1 and Prl were tested by Pearson’s correlation test.
In vitro experiments were performed in at least three separate repetitions and each condition was evaluated in duplicate or triplicate. ANOVA test followed by LSD Fisher test was used to evaluate differences when more than two groups were compared. Results are expressed as means±SEM. p < 0.05 was considered significant (*p < 0.05), (**p < 0.01), (***p < 0.001), “ns” was used to indicate no significance (p > 0.05). The number of repetitions of each experiment is always detailed in figures.
3Results
3.1 β-Catenin is reduced in membranes of resistant PRL-secreting pituitary tumor cells compared to normal pituitaries
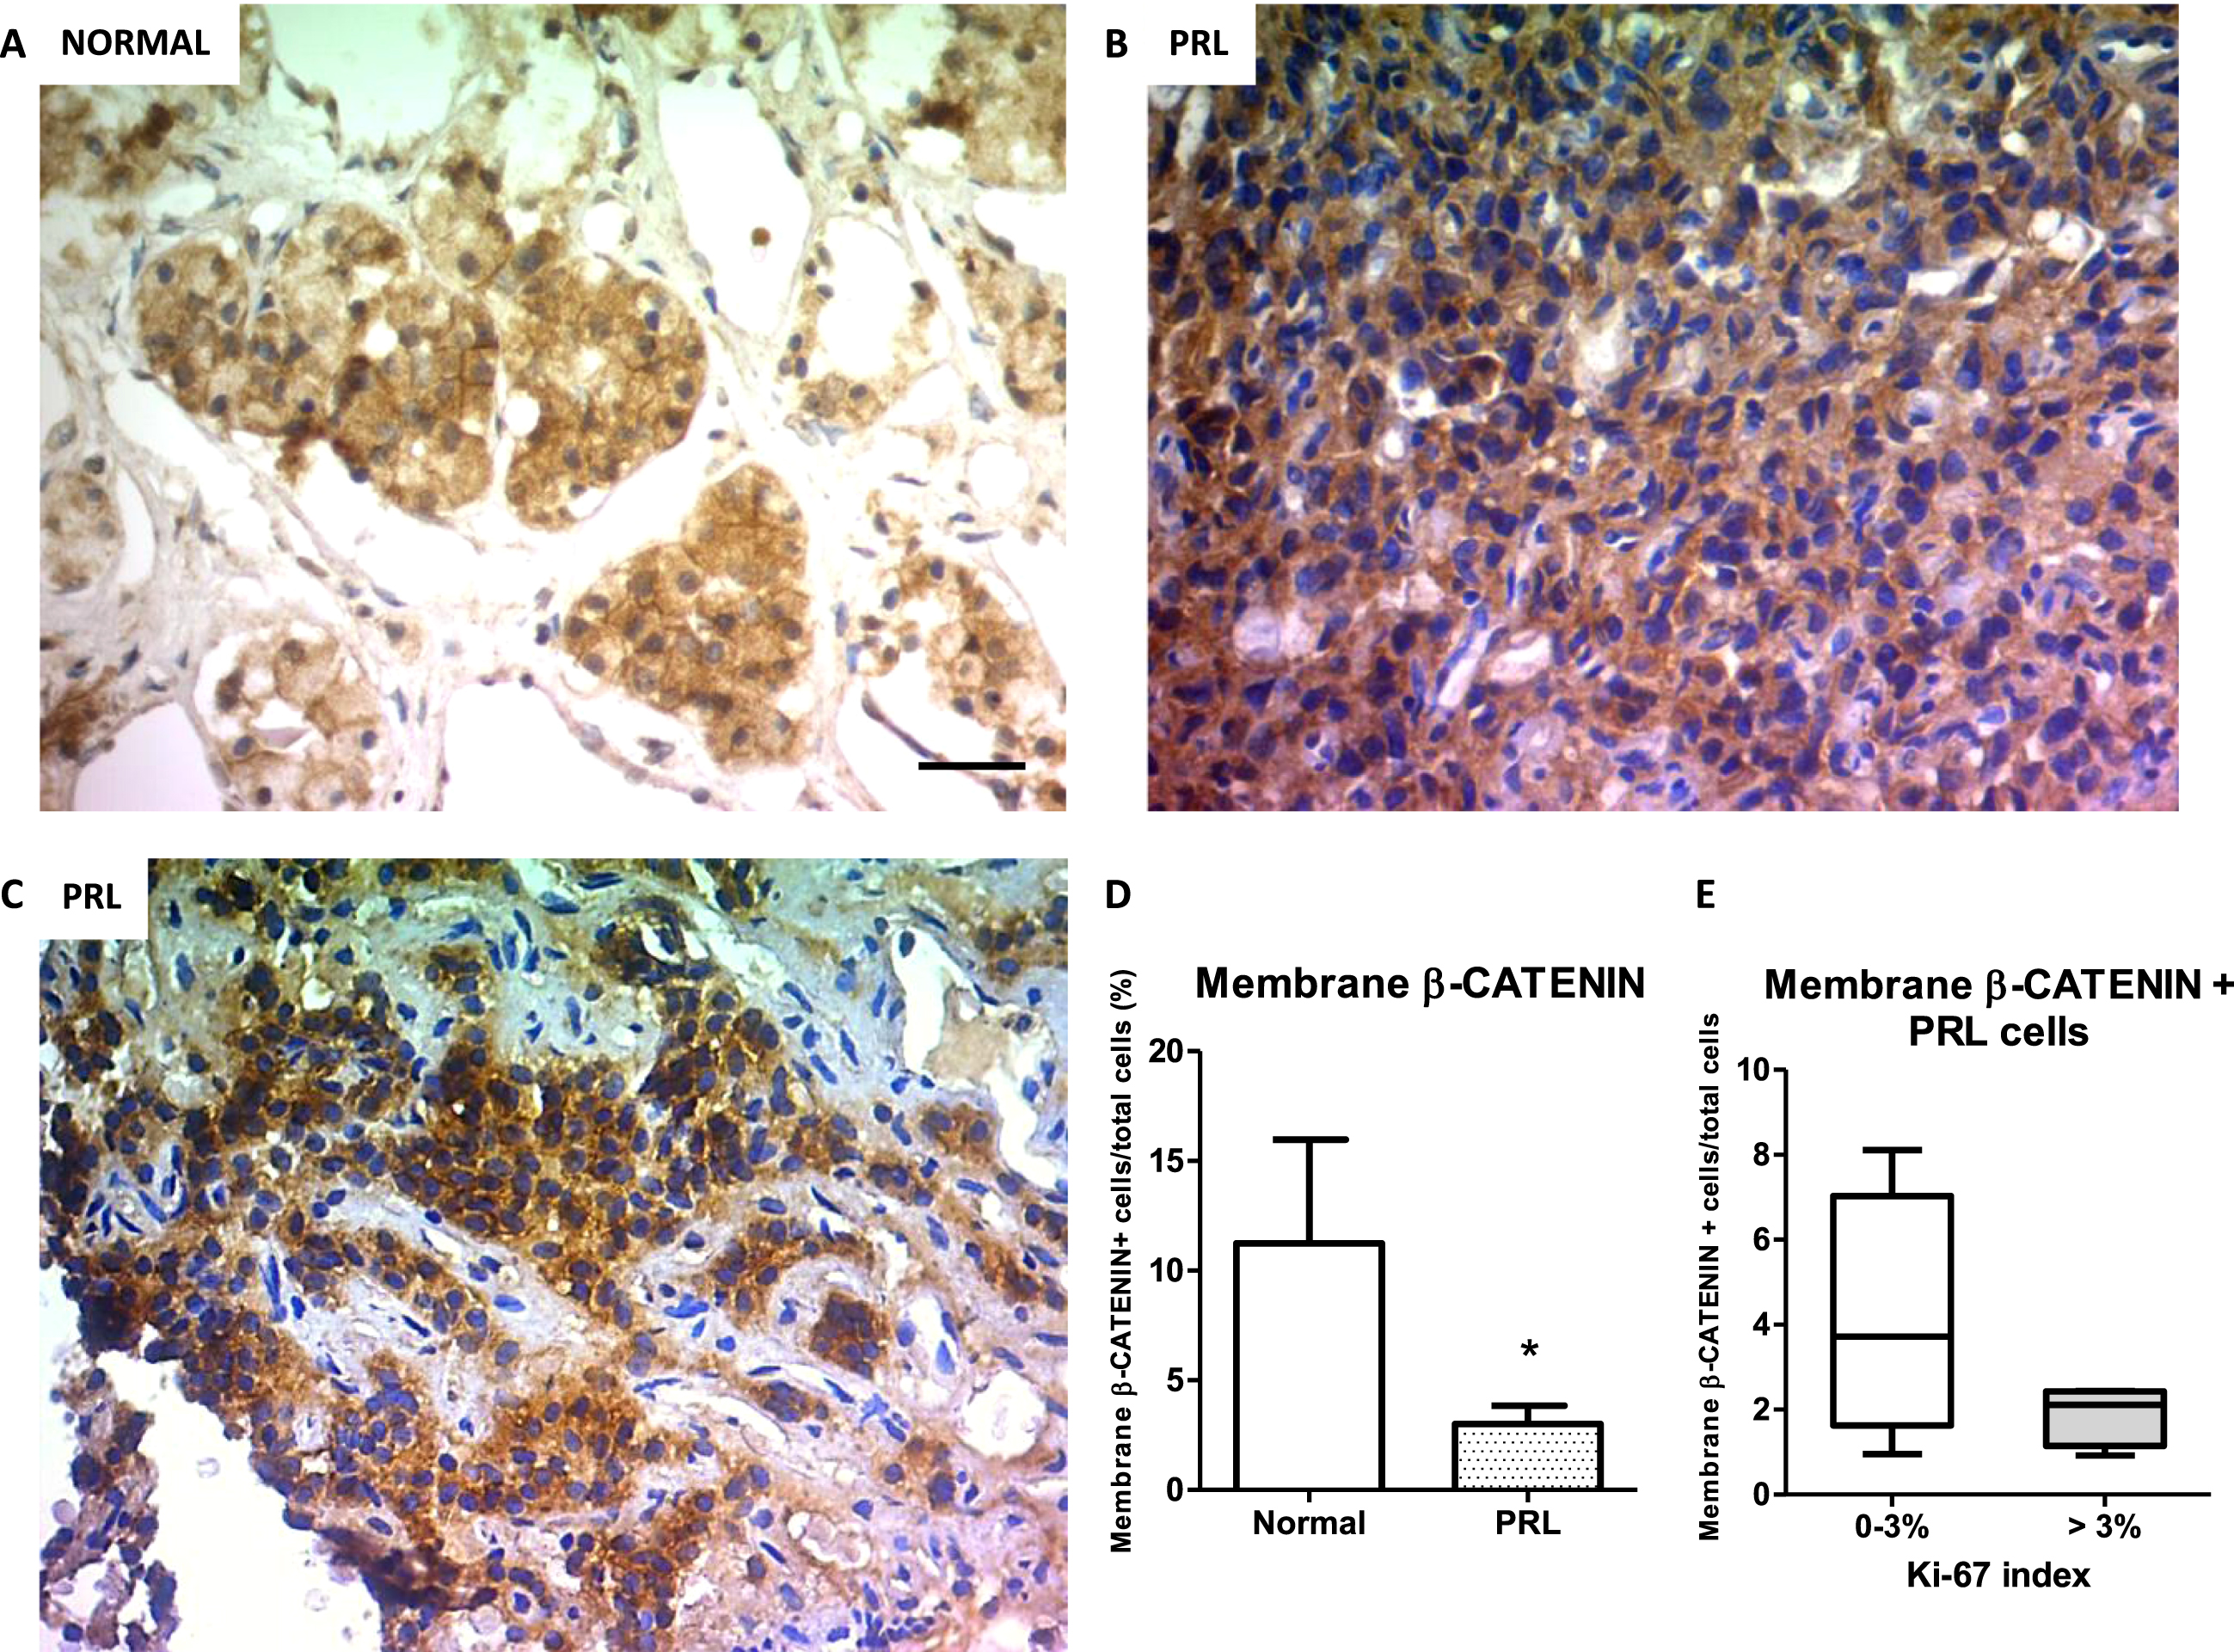
The expression of β-Catenin has been associated with tumor development and chemoresistance, mainly when the protein translocates from the membrane to the nucleus. In pituitary tumors, and in particular in prolactinomas, data is still controversial and scarce. In the group of human prolactinomas and the normal pituitaries we used here (Supplementary Figure 1A), we identified by IHC the expression of β-Catenin at cell membrane, cytoplasm and nucleus of tumor cells (Fig. 1 A-C). Interestingly, the prolactinoma group had lower percentage of membrane β-Catenin-expressing cells compared with control pituitaries (Fig. 1 D). On the other hand, we did not find any statistical difference in the percentage of nuclear and cytoplasmic β-Catenin-expressing cells between PRL secreting tumors and normal samples (Supplementary Figure 1B). Of note, low membrane β-Catenin expression in prolactinomas was found independent of Ki-67 proliferation index of the tumors (Fig. 1E). These findings place β-Catenin as an interesting target of study in the understanding the mechanisms of PRL secreting tumor maintenance and treatment.
Fig. 1
β-Catenin immunolocalization in human prolactinoma samples and normal pituitaries. Representative images of β-Catenin IHC in normal (A), low % Ki-67 prolactinoma (B) and high % Ki-67 prolactinoma (C). D. Membrane β-Catenin quantification in normal and resistant prolactinoma tissues. Values are expressed as percentage of total nuclei (n = 3; and n = 8 for normal and prolactinomas, respectively, *p = 0.019). E. Percentages of prolactinoma cells with positive β-Catenin staining at membrane in low (0–3%) and high (> 3%) proliferation index tumors (n = 4 and n = 4, respectively, ns). Boxes indicate the median and interquartile range of data. Error bars represent the minimum and maximum values.
3.2Temozolomide treatment reduces PRL production, which correlates with β-Catenin in prolactinomas in vivo
Tumor masses with high PRL expression developed after three weeks that lactotroph MMQ cells were subcutaneously injected in immunodeficient mice (Fig. 2A-B). As normalization or reduction of prl levels in patients bearing resistant prolactinomas is one of the main goals of a successful treatment in the clinic, we evaluated TMZ capability of reducing PRL production by experimental prolactinomas in vivo. The chemotherapeutic agent decreased in 60% intratumoral Prl mRNA synthesis compared to controls and produced a statistically significant inhibition of PRL protein production, highlighting TMZ effectiveness in prolactinoma treatment (Fig. 2C and Supplementary Figure 3A-B). Additionally, serum PRL levels showed a moderate normalization in TMZ treated animals related to controls (p = 0.0585; Supplementary Figure 3C).
Fig. 2
Temozolomide controls prolactinoma development by restraining PRL together with β-Catenin. A. Representative images of subcutaneous prolactinomas developed after MMQ lactotroph cell inoculation and TMZ treatment. Left: control animal; Right: TMZ treated animal. B. IHC of PRL in control and treated prolactinoma slices. Left: control animal; right: TMZ treated animal (10x, scale bar: 100 microns). Pictures were taken at the end of treatment. C. PRL mRNA and protein production in prolactinoma tissues after the administration of 15 mg/kg TMZ or DMSO. Prl mRNA expression was studied by RT-qPCR and normalized to Actin housekeeping gene expression (shown as percentages of control; n = 9 and 8, Control and TMZ, respectively; ***p = 0.0001). PRL protein levels were analyzed by WB and were normalized to G3PDH levels. Results are shown as percentages of controls (n = 10 and 10; **p = 0.0066). D. Correlations between PRL and β-Catenin at the mRNA (left; n = 9 and 8, Control and TMZ, respectively) and protein (right; n = 10 and 10 Control and TMZ) are shown. Pearson correlation and significance coefficients are indicated in the graphics (p≤0.05 denotes a significant correlation). E. Apoptotic rates of active CASPASE 3 in prolactinoma tissue sections were analyzed by IHC (n = 7 and 6; *p = 0.03). Representative images of the IHC of Caspase 3 in control and treated prolactinoma slices are shown (40x, Scale bar: 30 microns). F. Tumor volume of control and TMZ treated mice was registered with caliper along treatment and it is expressed as mm3 (n = 10 and 10; ns).
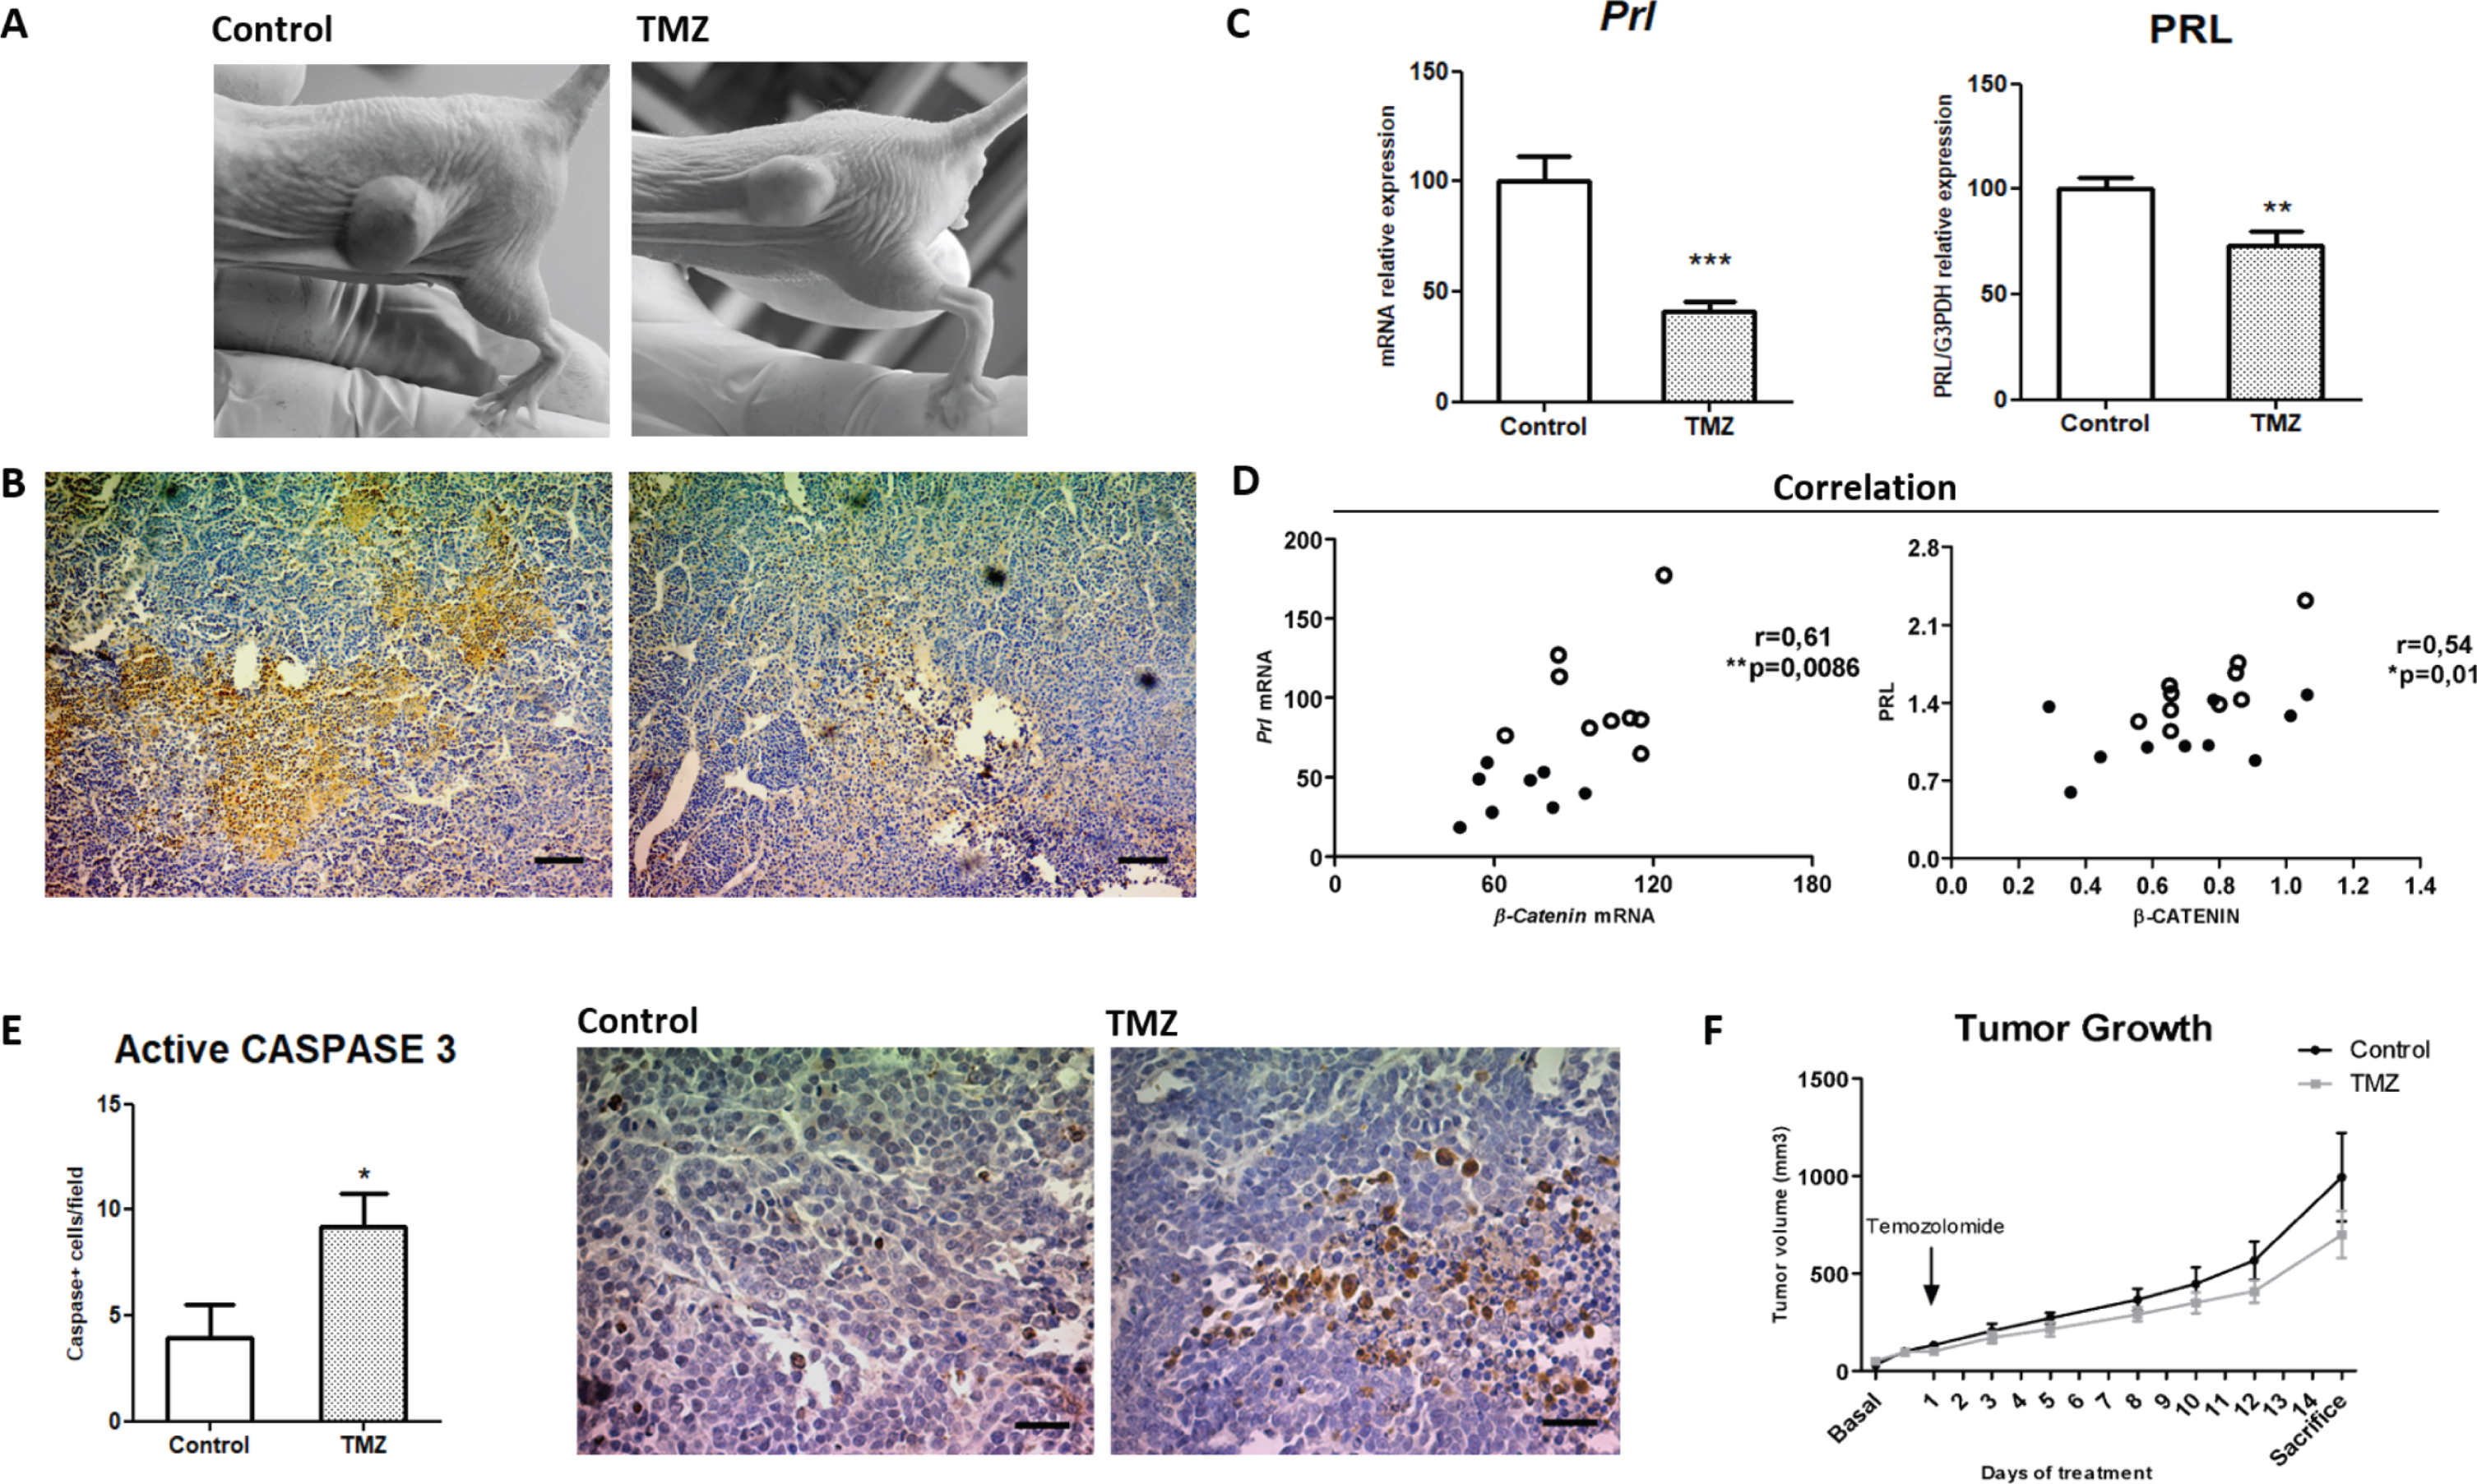
We next investigated the relationship between PRL and β-Catenin in the prolactinoma model. Importantly, we observed a strong positive correlation of β-Catenin with PRL, both at the mRNA and protein level (Fig. 2D), and that TMZ-treated prolactinomas had the lowest levels of expression of both factors (dark dots in Fig. 2D). Additionally, we determined augmented apoptotic rates by active CASPASE 3 IHC in treated tumors (Fig. 2E). Despite these augmented apoptotic levels, tumor growth did not reach any significant reduction along the whole treatment in the group of treated animals compared to controls after the two cycles of TMZ (Fig. 2F and Supplementary Figure 3D). Additionally, neither intratumoral Ki-67 proliferation index nor the PCNA levels or specific proliferation-associated signals were modulated by TMZ treatment (Supplementary Figure 4A-B).
Importantly, TMZ did not affect body weight in the dose and scheme practiced denoting animal good tolerance to the drug (Supplementary Figure 3E).
3.3 β-Catenin and Cyclin D1 are associated in MMQ prolactinomas and they are both reduced by TMZ
Different components of the canonical Wnt pathway have been related with various tumor development. In our model, Cyclin D1 but not c-Myc nor Pitx2 Wnt target genes correlated with Prl synthesis (Fig. 3A and not shown). Moreover, Cyclin D1 correlated with β-Catenin synthesis (Fig. 3B), which resulted strictly associated with Prl as we showed above (Fig. 2D), together suggesting the association between canonical Wnt pathway activation and hormone production in PRL secreting tumors.
Fig. 3
TMZ inhibits Cyclin D1 and β-Catenin components of canonical Wnt signaling. Correlation between Prl and Cyclin D1 mRNA levels (A; n = 10 and 8 Control and TMZ, respectively) and β-Catenin with Cyclin D1 mRNA levels (B; n = 9 and 8) are shown. Pearson correlation and significance coefficients are shown in the graphics (p≤0.05 denotes a significant correlation). C. β-Catenin and the target gene Cyclin D1 mRNA expression levels were reduced after treatment (n = 9,8; **p = 0.0025 and ***p = 0.0001 respectively). β-Catenin protein levels were not modified with TMZ (n = 10 and 10; ns). D. The expression of c-Myc (n = 9 and 8; ns) and Pitx2 (n = 9 and 9; ns) target genes was quantified by RT-qPCR, and pGSK3-β protein levels were analyzed by WB (n = 6 and 6; ns). In all cases, mRNA and protein expression were normalized to a housekeeping expression levels. Data are shown as percentages of controls.
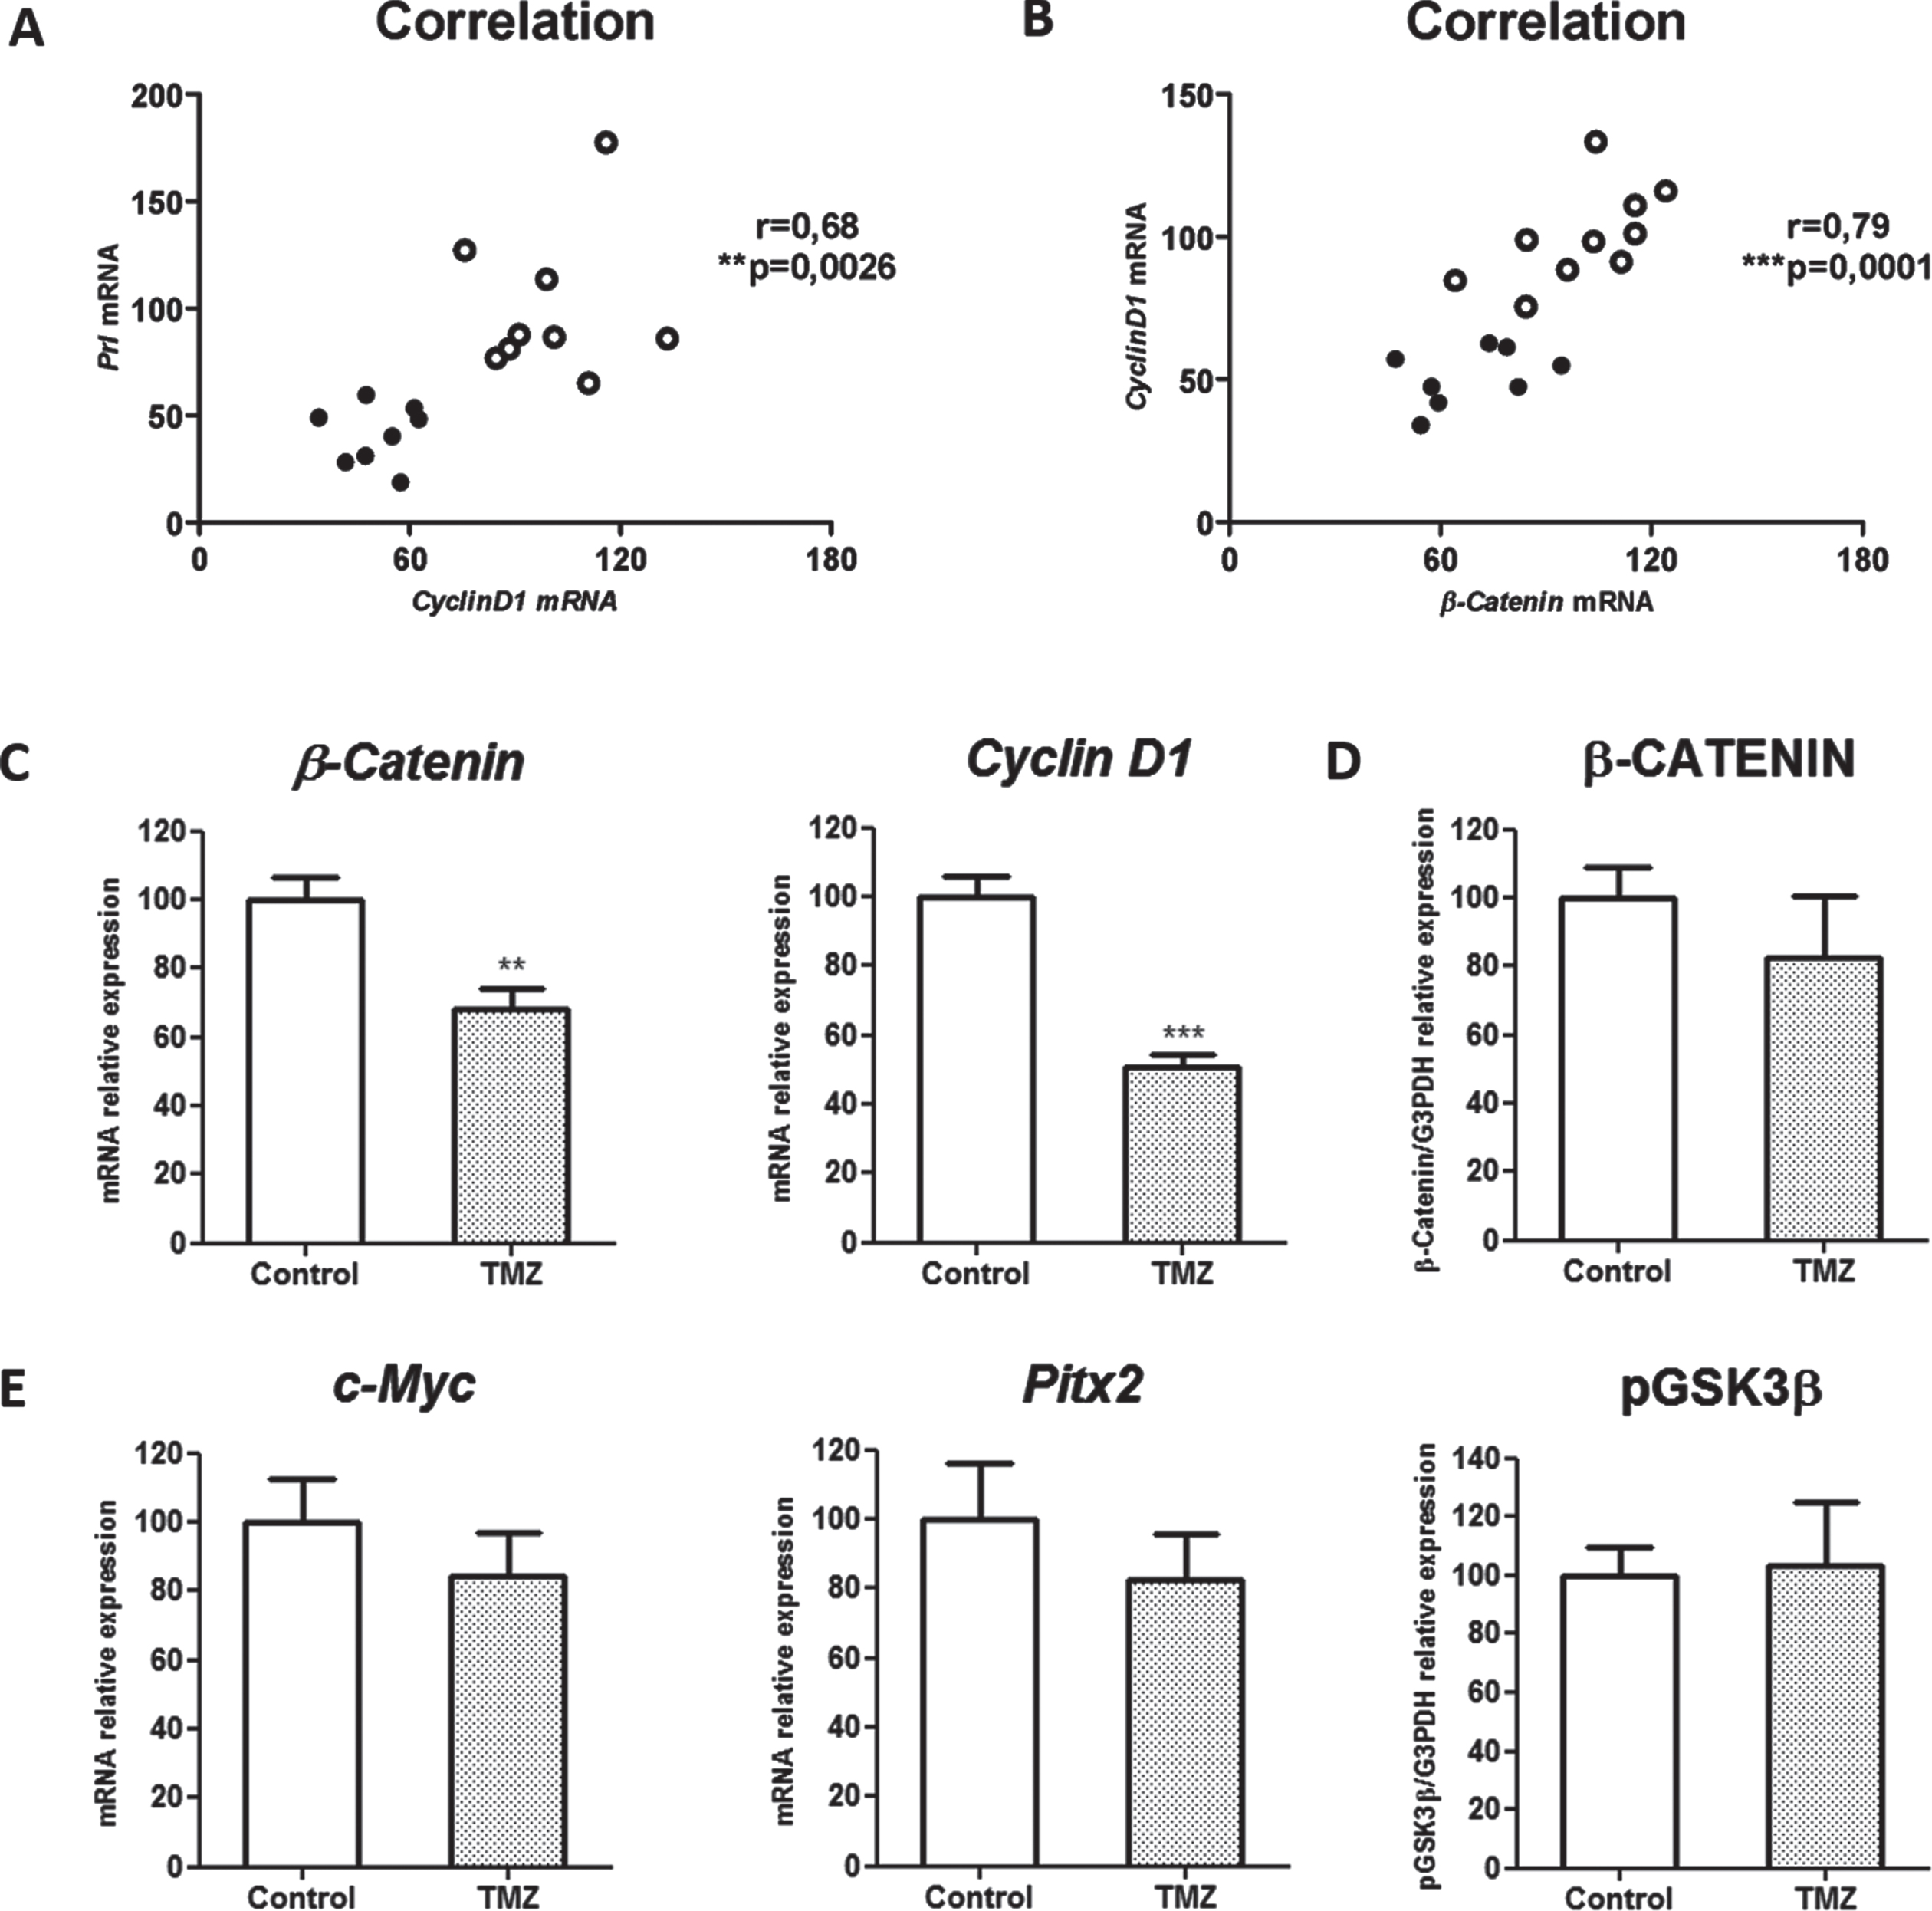
Interestingly, among the Wnt canonical components evaluated (Fig. 3C-E), β-Catenin and Cyclin D1, the ones found associated to PRL production, were both transcriptionally downregulated by TMZ treatment (Fig. 3C). Instead, β-Catenin protein expression did not reach a significant reduction under treatment (Fig. 3D).
Taken together our data presented here support the importance of Wnt/β-Catenin signaling both in prolactinoma development and in the effectiveness of the chemotherapeutic drug TMZ action on prolactinoma control.
3.4TMZ inhibits cell viability and induces apoptosis and cell cycle arrest in MMQ PRL secreting cells in vitro
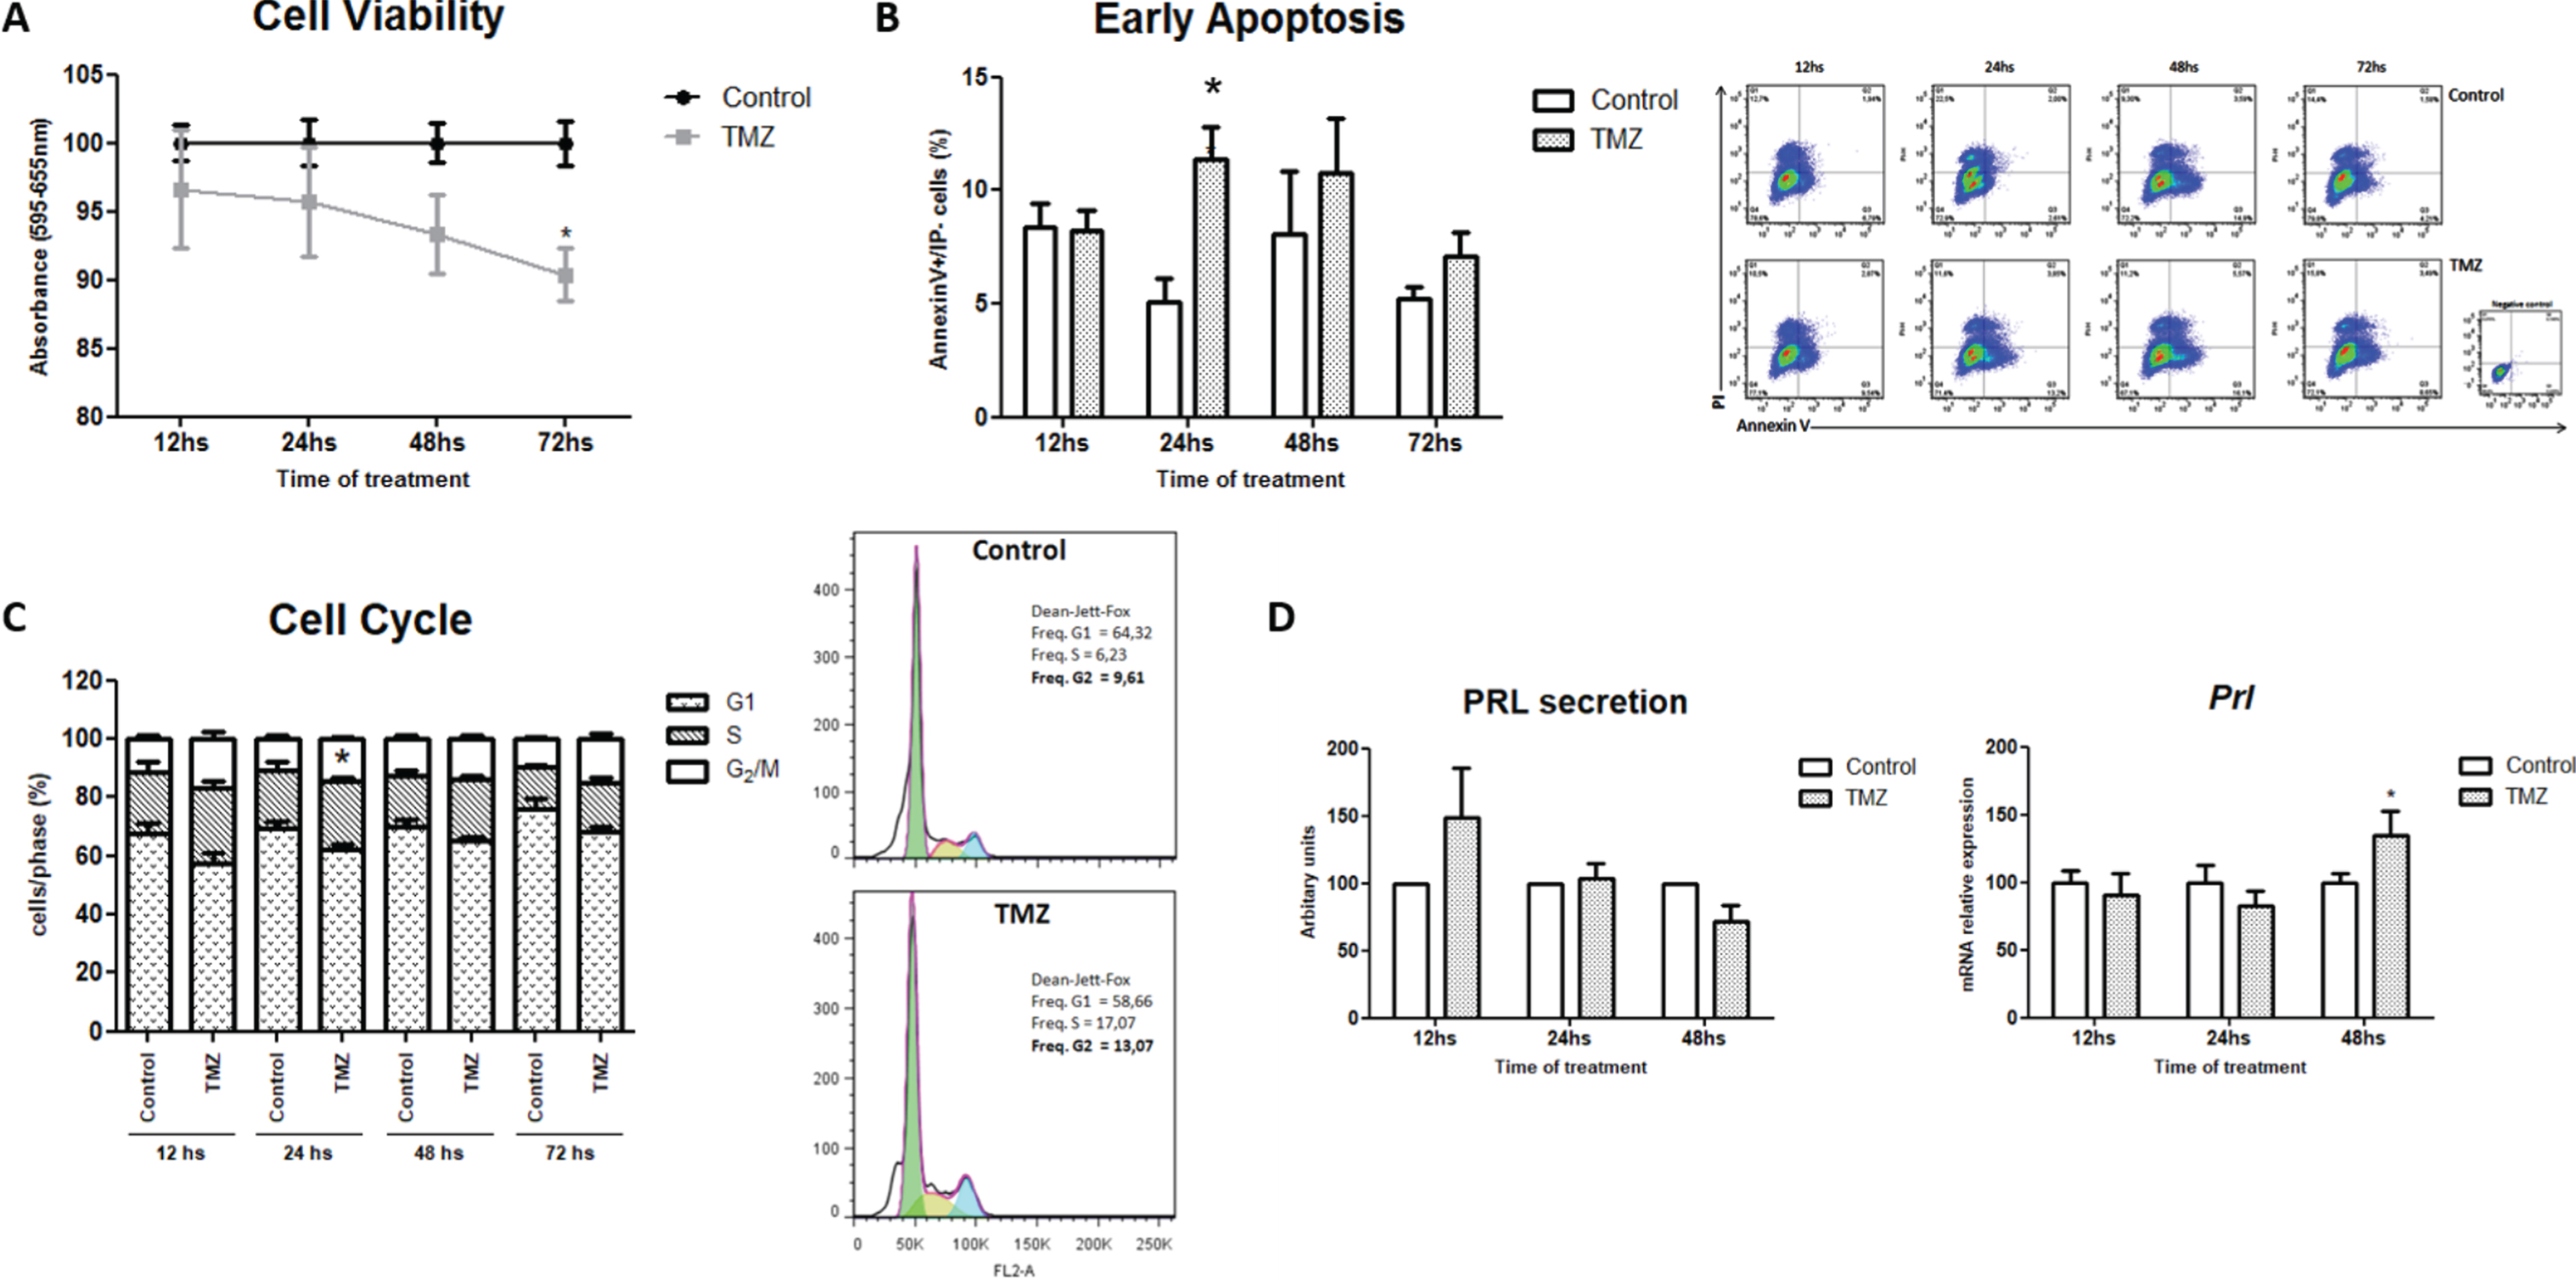
To determine the direct effect of TMZ on prolactinoma cells, MMQ lactotroph viability was evaluated in vitro by the colorimetric MTT assay. TMZ significantly decreased tumor cell viability after 72 h of treatment (Fig. 4A). In concordance with this, TMZ incremented the apoptotic rate of tumor cells when compared to controls (Fig. 4B) as we have also found in the in vivo treatment (Fig. 2E). These effects might be a consequence of the arrest in the G2/M cell cycle phase observed at 24 h of TMZ treatment; a well-documented mechanism triggered by this agent in other tumors but not fully demonstrated in pituitary tumor models before (Fig. 4C. p = 0.09; *p = 0.013 and p = 0.07 for 12; 24 and 72 h, respectively). These results demonstrate that the alkylating agent has antitumoral effects directly on prolactinoma cell growth and survival. On the other hand, we did not detect in vitro any changes in PRL protein production as we did in vivo. Instead, Prl mRNA synthesis was increased after 48 h of TMZ treatment, probably as a compensatory mechanism on the specific tumor cell function (Fig. 4D).
Fig. 4
TMZ decreases tumor lactotroph viability, causes apoptosis and cell cycle arrest. A. TMZ was added directly to MMQ cell culture during 12, 24, 48 or 72 h and cell viability was determined by the MTT assay. Data are shown as percentages of controls (n = 5 and 7; *p = 0.005). B. Apoptotic cells after TMZ treatment were analyzed by Flow Cytometry through Annexin V expression and PI staining. Representative dot-plots are shown (n = 4; *p = 0.042). C. The percentages of control and treated cells in the different cell cycle phases were evaluated by Flow Cytometry and analyzed according to Dean-Jett-Fox model (n = 6 and 3; *p = 0.013 for 24 h). Representative histograms of cell cycle arrest after 24 h of TMZ treatment are shown. D. PRL expression levels were assessed by WB and RT-qPCR in TMZ and control cells. Data are shown as percentages of controls. Secreted PRL levels are expressed in arbitrary units, Prl levels were related to Actin mRNA expression (n = 4; ns and n = 4, respectively; *p = 0.027).
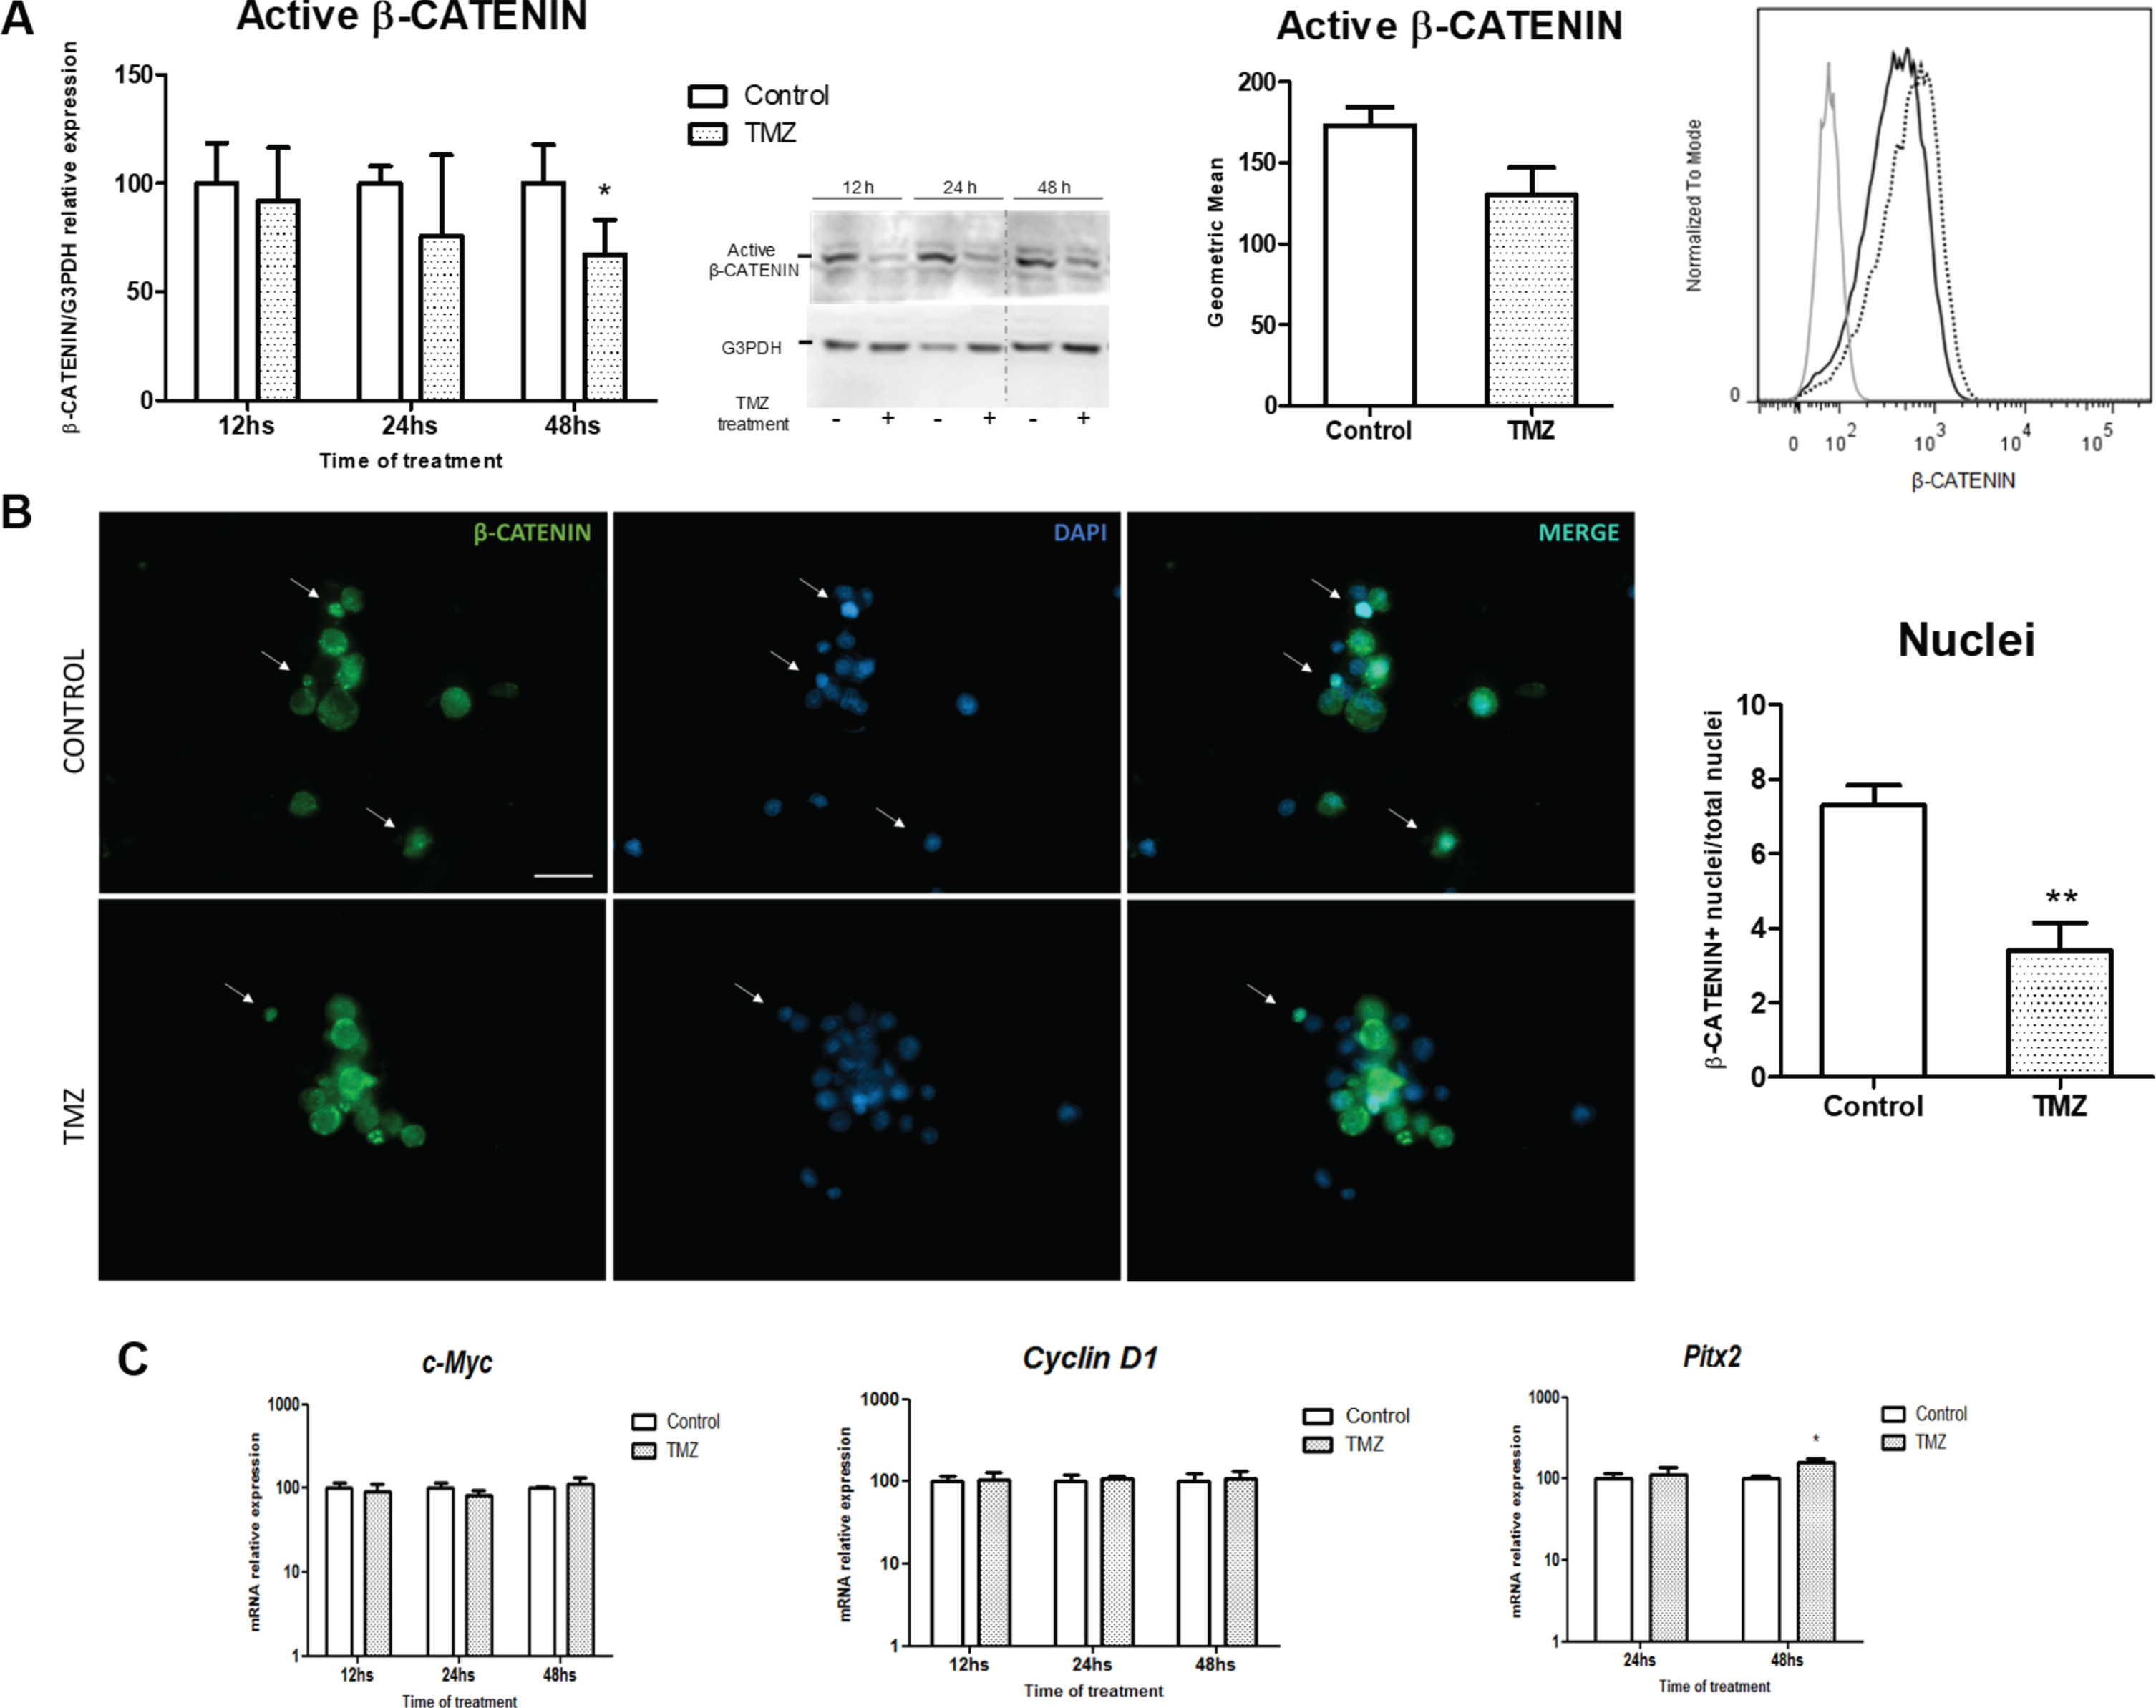
3.5TMZ prevents β-Catenin activation in prolactinoma MMQ cells
TMZ treatment reduced β-Catenin protein activation at 48 h as we determined by WB and Flow Cytometry in prolactinoma cells in vitro (Fig. 5A). In concordance, a reduction in β-Catenin positive nuclei was found after treatment (Fig. 5B and supplementary Figure 6B). This effect occurs after the previous trend of reduction of β-Catenin mRNA levels observed at 12 and 24 h of TMZ treatment (Supplementary Figure 6C). On the other hand, the expression of Cyclin D1 and c-Myc did not show any modification in spite of the differences we found in the in vivo model. Otherwise, the mRNA levels of Pitx2 increased after TMZ treatment (Fig. 5C).
Fig. 5
TMZ treatment inhibits β-Catenin in vitro. A. Active β-Catenin was analyzed by WB (left; n = 4-5; *p = 0.048) and Flow Citometry (right; 48 h, n = 5; ns) in MMQ treated cells. Representative WB image is shown. The dividing line shows the point where the two parts of the gel were joined together. MFI histograms show the expression of β-Catenin exposed to TMZ (black) or Control (dashed). Unstained control is also represented in the graph (grey). B. The effect of TMZ on β-Catenin (green) subcellular localization is represented (40X, scale bar = 20 microns). β-Catenin positive cells were quantified. Positive nuclei (white arrows) were relativized to total nuclei of the image (blue) and expressed as percentages (n = 3; **p = 0.013). C. mRNA levels of the Wnt target genes c-Myc (n = 3; ns), Cyclin D1 (n = 2; ns) and Pitx2 (n = 3; *p = 0.009) were assessed by RT-qPCR. mRNA levels were normalized to Actin housekeeping gene expression and are shown as percentages of controls. Protein levels in WB were normalized to G3PDH expression and were also calibrated to controls.
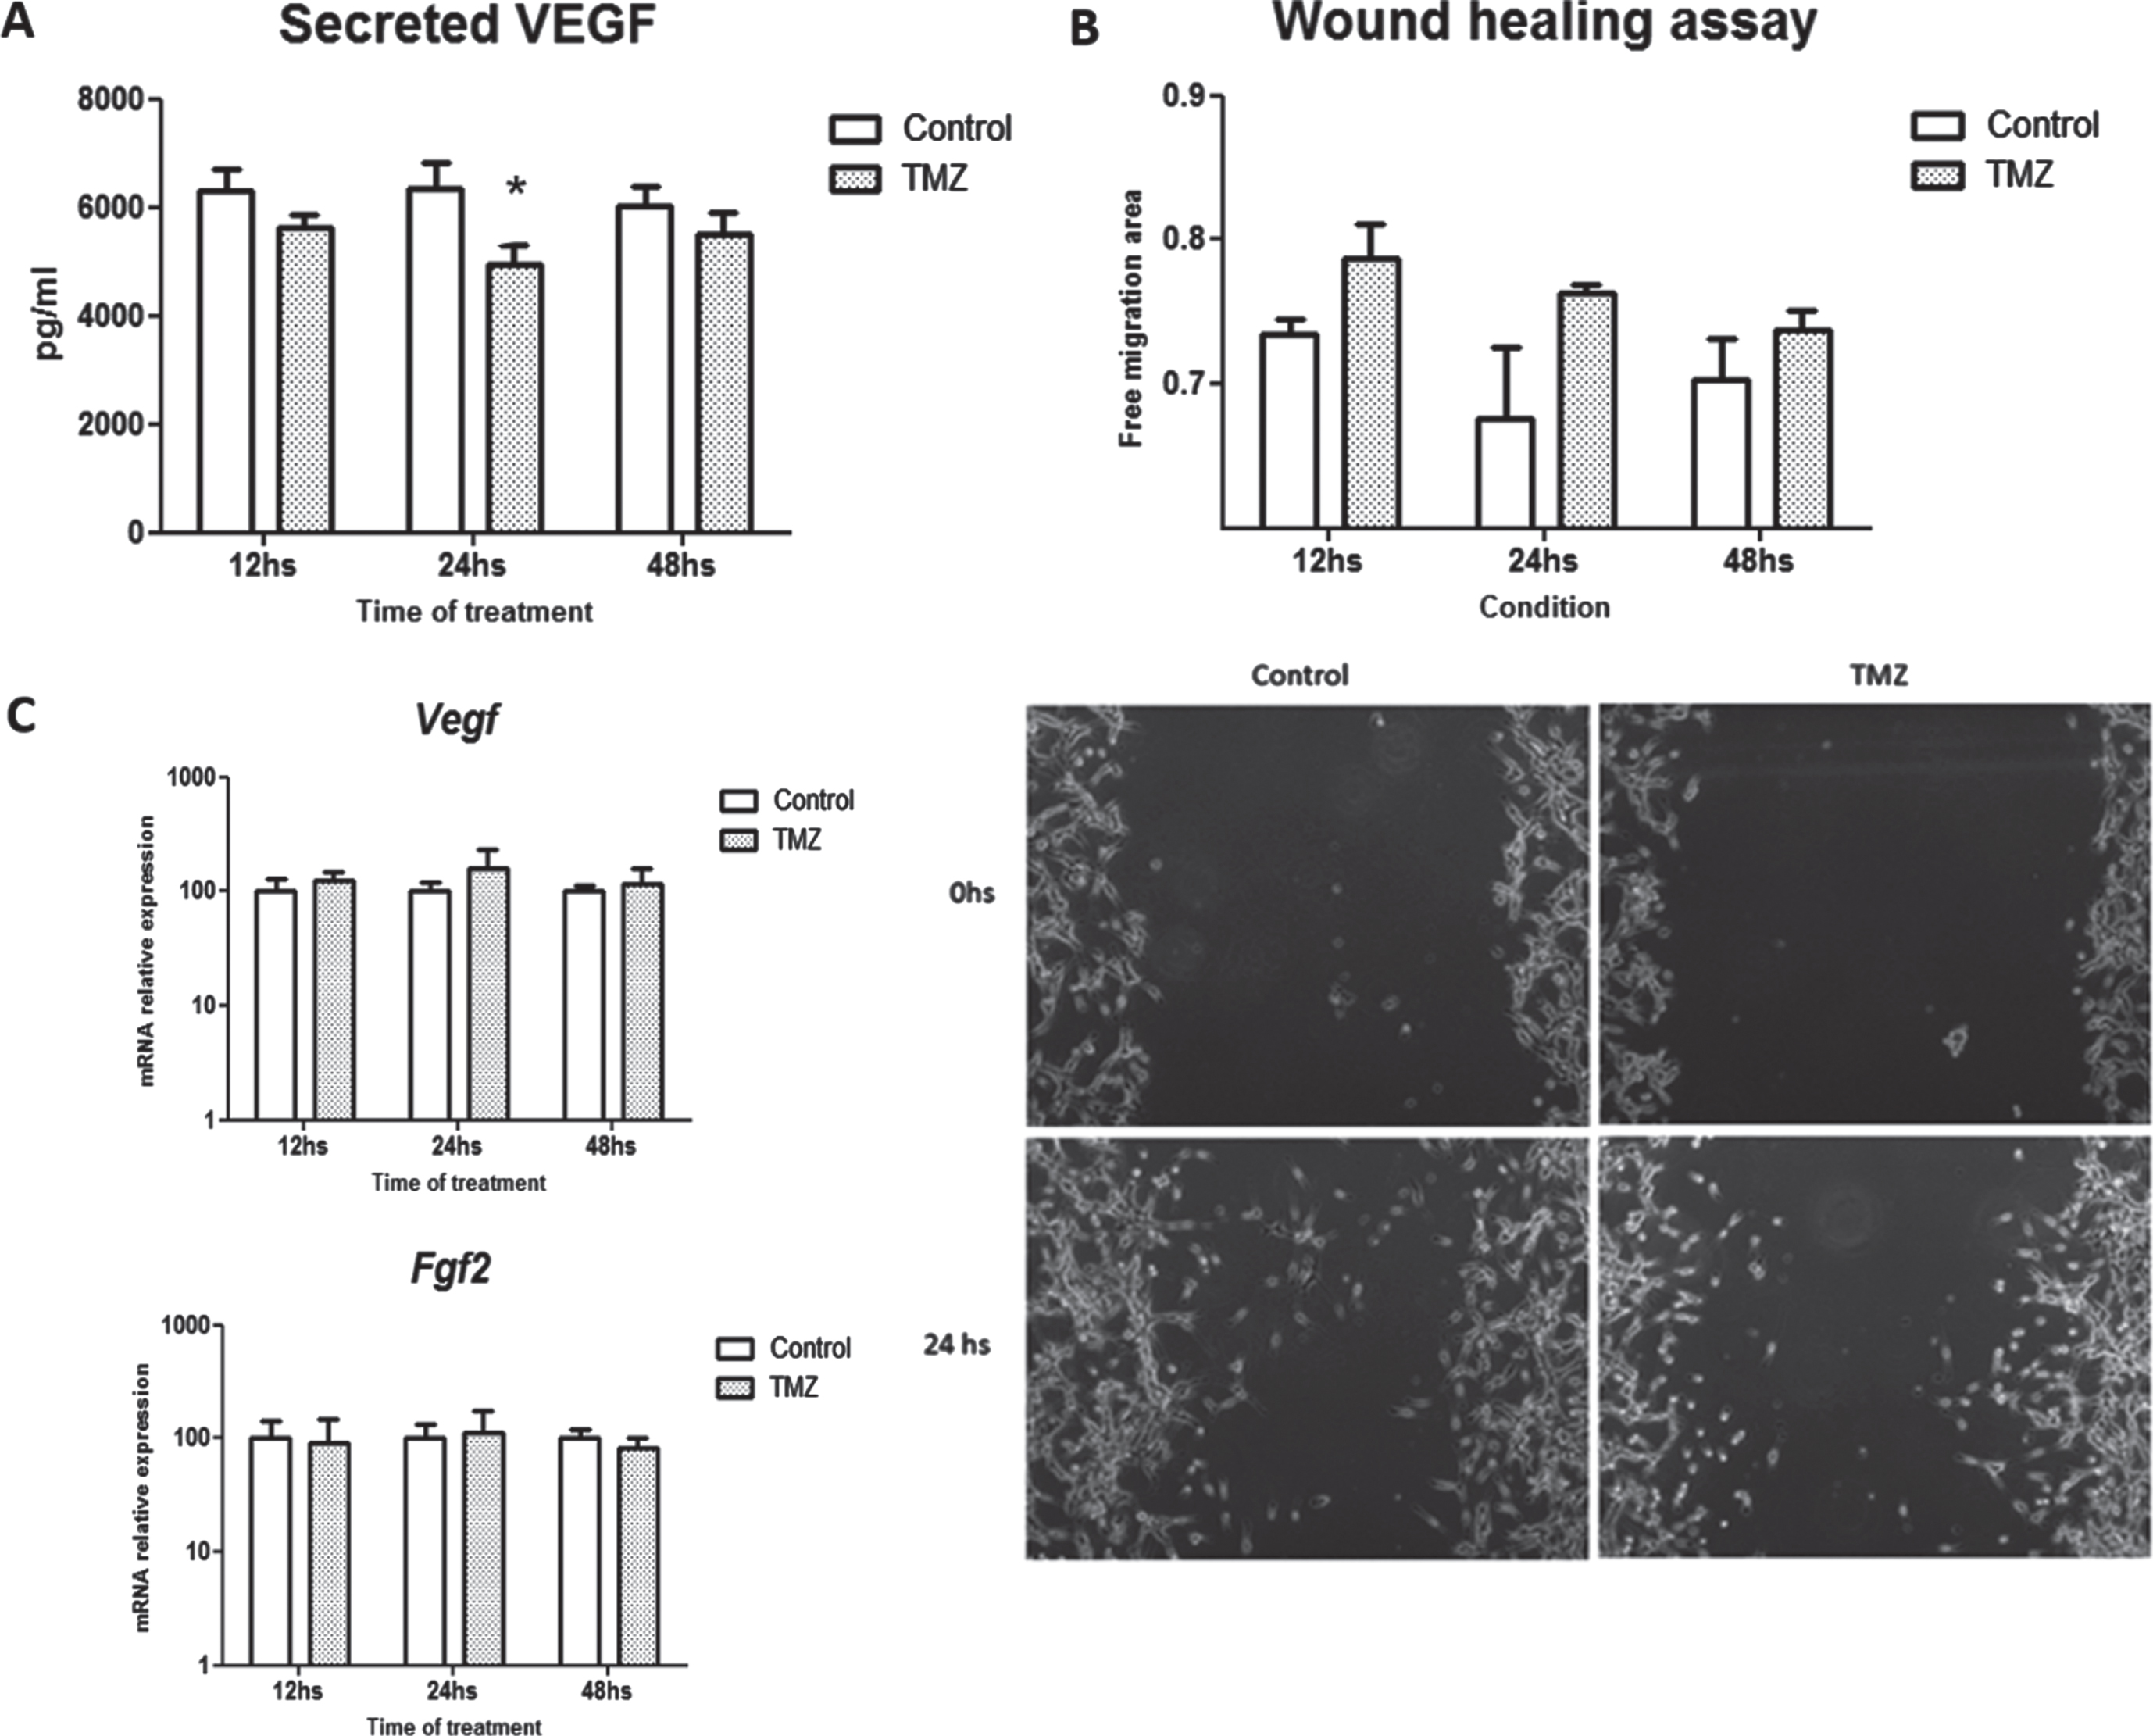
3.6TMZ inhibits VEGF secretion of tumor lactotroph cells in vitro
Finally, we assessed the effect of the chemotherapeutic drug on angiogenic factor production and release by MMQ cells in vitro. A significant inhibition of VEGF secretion by MMQ cells was detected by ELISA demonstrating the direct inhibitory role of TMZ in their angiogenic response (Fig. 6A). Moreover, when the angiogenic capacity was functionally tested by the conditioned media action of MMQ cells on HMEC endothelial cell migration, we found that TMZ attempted to inhibit the migration of these cells preventing wound closure (Fig. 6B). On the other hand, we found no differences in mRNA synthesis of Vegf nor Fgf2 in TMZ treated compared to control cells (Fig. 6C).
Fig. 6
VEGF secretion is inhibited in MMQ cells after TMZ treatment. A. VEGF release to cell culture supernatants in response to TMZ was measured by ELISA (n = 9; *p = 0.04, pg/ml). B. Angiogenic capability of supernatants from TMZ-treated and control MMQ lactotrophs was studied by endothelial cells migration in a wound healing assay. Free migration area after 24 h of culturing is shown in the graphic (n = 2 and 5; ns). Representative images of the wound healing assay are shown. C. Vegf (n = 4; ns) and Fgf2 (n = 2 and 3; ns) mRNA expression levels were evaluated by RT-qPCR after TMZ treatment. mRNA levels were normalized to Actin housekeeping gene expression and are shown as percentages of controls.
Otherwise, we did not detect any changes in Vegf, Fgf2, CD31 or angiogenic parameters mediated by TMZ in the MMQ xenograft in vivo model (Supplementary Figure 5). This discrepancy between in vivo and in vitro results could be related to microenvironmental factors present in the in vivo model that may be masking VEGF inhibition in MMQ by TMZ.
4Discussion
Wnt/β-Catenin pathway has been implicated in different human neoplasias [9, 42, 43]. Within the sellar region, β-Catenin mutations are involved in craniopharyngioma development [44] as well as in pituitary tumors in which higher β-Catenin expression compared to normal pituitary was described [45]. Moreover, by proteomic and transcriptomic analysis, this group also demonstrated that Wnt/β-Catenin and mTOR signaling are associated to the pathogenesis of non-functioning pituitary tumors [45]. However, β-Catenin subcellular localization and its implications in pituitary tumorigenesis are controversial. There are some reports that did not find differences neither in β-Catenin expression nor in other Wnt components’ transcription between pituitary tumors normal pituitaries [46, 47].
We found β-Catenin expressed in membrane, cytoplasm and nucleus in a group of human resistant prolactinomas as well as in normal pituitary tissues. Other authors, despite finding transcriptional activity of Wnt signaling, determined membrane-bound β-Catenin expression only, both in tumor and normal pituitary tissues [16].
According to the intersection of structural β-Catenin function in cell-cell adhesion and the canonical Wnt pathway activation reported by Kam & Quaranta [48], our results of reduced β-Catenin in membrane of cell prolactinomas would suggest a relocalization of the protein in PRL-secreting tumors. In this sense, Semba and colleagues also showed a differential localization of β-Catenin in half of the pituitary samples they analyzed, while normal glands had only membrane β-Catenin expression [49].
The prolactinomas we used in the present work are part of a heterogeneous Ki-67 index group in which differential localization β-Catenin was effectively not dependent on cell proliferation. Nevertheless, although with no statistical significance, low Ki-67 tumors may represent an intermediate subgroup between normal and high Ki-67 tissues, in terms of membrane β-Catenin expression. In the field, numerous studies have been performed on Ki-67 and the clinical presentation of pituitary tumors, with inconsistent results [50, 51]. Remarkably, there is one study conducted in a huge cohort of 123 Japanese prolactinoma patients that found no association between Ki-67 index and clinical parameters, such us tumor size or invasion [50]. Indeed, the refraction to dopamine agonists’ therapy represents per se a sign of aggressiveness. Thus, our present results in the human resistant prolactinoma group may point to the loss of membrane β-Catenin expression and potential Wnt activation as a marker of resistance. Our work can stimulate future studies of this marker in bigger cohorts such as the Japanesse [50] or Chinese ones [52].
In the pituitary tumor field, the management of patients with aggressive tumors still represents one of the main challenges. In salvage treatment, aggressive pituitary adenomas and pituitary carcinomas respond to TMZ in some cases [26, 30, 33]. TMZ resulted in inhibition of PRL secretion and remarkable shrinkage of tumor mass in patients harboring refractory prolactinomas, improving their general clinical condition [53, 54]. Other groups reported in several previously treated prolactinoma cohorts, that some but not all tumors respond to TMZ with a decrement in serum PRL [29, 30, 55]. We found in the present study that TMZ, when administered orally as unique treatment, significantly reduced intratumoral PRL of in vivo prolactinomas. This intratumoral PRL reduction could anticipate a subsequent serum PRL reduction after TMZ administration. TMZ treatment of in vivo pituitary tumor models has been scarcely studied [56]. Moreover, reduction of PRL mRNA synthesis and protein expression in in vivo prolactinomas has not been reported before.
The molecular targets involved in pituitary hormone normalization in response to TMZ have not been deeply studied. In this sense, the β-Catenin and PRL correlation we determined in the prolactinoma models, both with or without TMZ treatment, may let us hypothesize that under TMZ treatment, prolactin is getting down via β-Catenin inactivation. Wnt/β-Catenin activation was also associated to TMZ reduced effectiveness as chemotherapeutic agent in gliomas [57]. Additionally, Riganti et al. reported that TMZ causes Wnt3a downregulation and Wnt/β-Catenin signaling disruption in human glioblastoma stem cells, sensitizing the cells to other chemotherapeutic drugs [58].
Certainly, the β-Catenin inhibition we observed in the TMZ response may point to β-Catenin and associated signals modulation in pituitary tumor management. Moreover, the association between β-Catenin and Cyclin D1 mRNA levels we found supports the relevance of canonical Wnt pathway in experimental prolactinoma development. Still, published data in GH3 rat somatolactotroph tumor cells also suggest the participation of a Wnt4 independent β-Catenin mechanism in the lactotroph proliferation and secretion [15].
Additionally, our results show that TMZ increased apoptotic cell levels within the prolactinoma, supporting a classic effect of TMZ on prolactinoma cells in vivo. Our novel findings suggest that TMZ could cause cell death through β-Catenin inhibition. Other authors showed augmented apoptosis related to Wnt/β-Catenin inhibition in other tumor types and in human pituitary cell lines [59, 60]. However, tumor volume was not significantly restrained by TMZ treatment. These results correlated with clinical data, where partial but not complete regression of tumor mass was reported in locally invasive pituitary tumors and pituitary carcinomas treated with TMZ [34]. Furthermore, that study reported another patient with a prolactinoma who experienced a 71% decrease in PRL levels after TMZ therapy without any changes in tumor volume. Surely, tumor response to the chemotherapeutic agent might depend on the particular specimen and its unique microenvironment.
Some authors showed a moderate, not significant decrement of Ki-67 positive cells after TMZ treatment in the somatolactortroph GH3 in vivo tumors [56]. Contrary to our present study, Ki-67 proliferation index did not show any differences between treated and control prolactinomas at the end of treatment. Instead, Kovacs and colleagues found a reduction of Ki-67 index from 40-60% to 5% when they compared the pretreated and post TMZ-treated specimens of a human PRL secreting tumor [61]. Finally, the inhibition of proliferation pathways has been postulated to participate in the chemosensitivity to TMZ in other malignancies [62]. In MMQ prolactinomas treated with TMZ, instead, we determined neither a decrement in pERK- nor in JNK-associated proliferation pathways. Together, our data from the in vivo model suggest a stronger action of TMZ on hormone production inhibition than on the proliferation capacity of prolactinoma cells.
In our study, β-Catenin activation was also reduced in TMZ-treated lactotrophs in vitro concomitantly with decreased β-Catenin nuclear localization as a direct action of the drug, an effect not described before in the literature. However, and contrary to our in vivo results, Cyclin D1 Wnt target gene was not reduced after TMZ treatment. In vitro and in vivo differences may be related to the tumor microenvironment influence on transcriptional activity or could be model-dependent as it was already reported by other authors [63]. Moreover, MMQ cell viability was reduced by TMZ, concordantly with the results previously obtained by other group with the same TMZ dose and time [56]. Instead, Sheehan and colleagues published an earlier inhibition of MMQ and GH3 cell proliferation by TMZ in vitro, a discrepancy probably related to the higher doses of TMZ they used in their study [64]. Moreover, the increased levels of apoptosis that the MMQ cells achieved in culture with TMZ, in addition to the G2/M cell cycle arrest we observed, assure the expected cytotoxicity produced by TMZ in this endocrine tumor cells [65]. The lack of reduction in the proliferation index or in proliferation cell signal activation such as ERK or JNK, in vitro, and the decrement in the viability with TMZ in vitro we found, probably point to the protective and/or compensatory effect produced by the microenvironment of the experimental prolactinoma. This effect may resemble the human disease, with low proliferation index and absence of metastasis, peculiar characteristics surely influenced by a “benign” pituitary adenoma microenvironment. These aspects need further investigation both in animal pituitary tumor models as well as in human tumors. In this regard our previous publications on angiogenesis in the prolactinoma model of the dopaminergic D2 receptor knockout female mice and in human pituitary tumors [39, 41, 66] indicate that prolactinomas harbor an extracellular matrix which could confer the special properties of angiogenesis, such as increased VEGF expression with a mild effect on tumor vaculature as we previously described and also show here.
Not many studies in the literature of pituitary tumorigenesis describe the molecular mechanisms associated to the inhibitory effects of TMZ, or the moment of the tumor management it should be administered. PI3K/AKT/mTOR pathways and Hif1α have been postulated as responsible of TMZ chemoresistance in pituitary tumor models in vivo [56]. And, to our knowledge, this was the only group that worked with pituitary tumor cell xenografts on in vivo TMZ treatment [56, 67].
The present study for the first time provides a clear evidence of Wnt/β-Catenin signaling activation in MMQ prolactinomas and its inhibition under TMZ treatment both in vivo and in vitro. It highlights an important relation between β-Catenin, Cyclin D1 and PRL in these prolactinomas, all being strongly reduced by TMZ treatment resulting in a significant cell death promotion. Importantly, we show β-Catenin activation in human prolactinomas and its association with pituitary tumor resistance and aggressiveness (Fig. 7 summarizes the addressed findings).
Fig. 7
TMZ effects on pituitary tumor cells. Schematic Wnt/β-Catenin approach on pituitary tumor processes. Double-line arrow indicates findings in human prolactinoma samples. Arrowhead and regular arrow show the findings in prolactinoma models after TMZ treatment (in vitro and in vivo respectively). Direction of the arrows indicate the sense of the modulation.
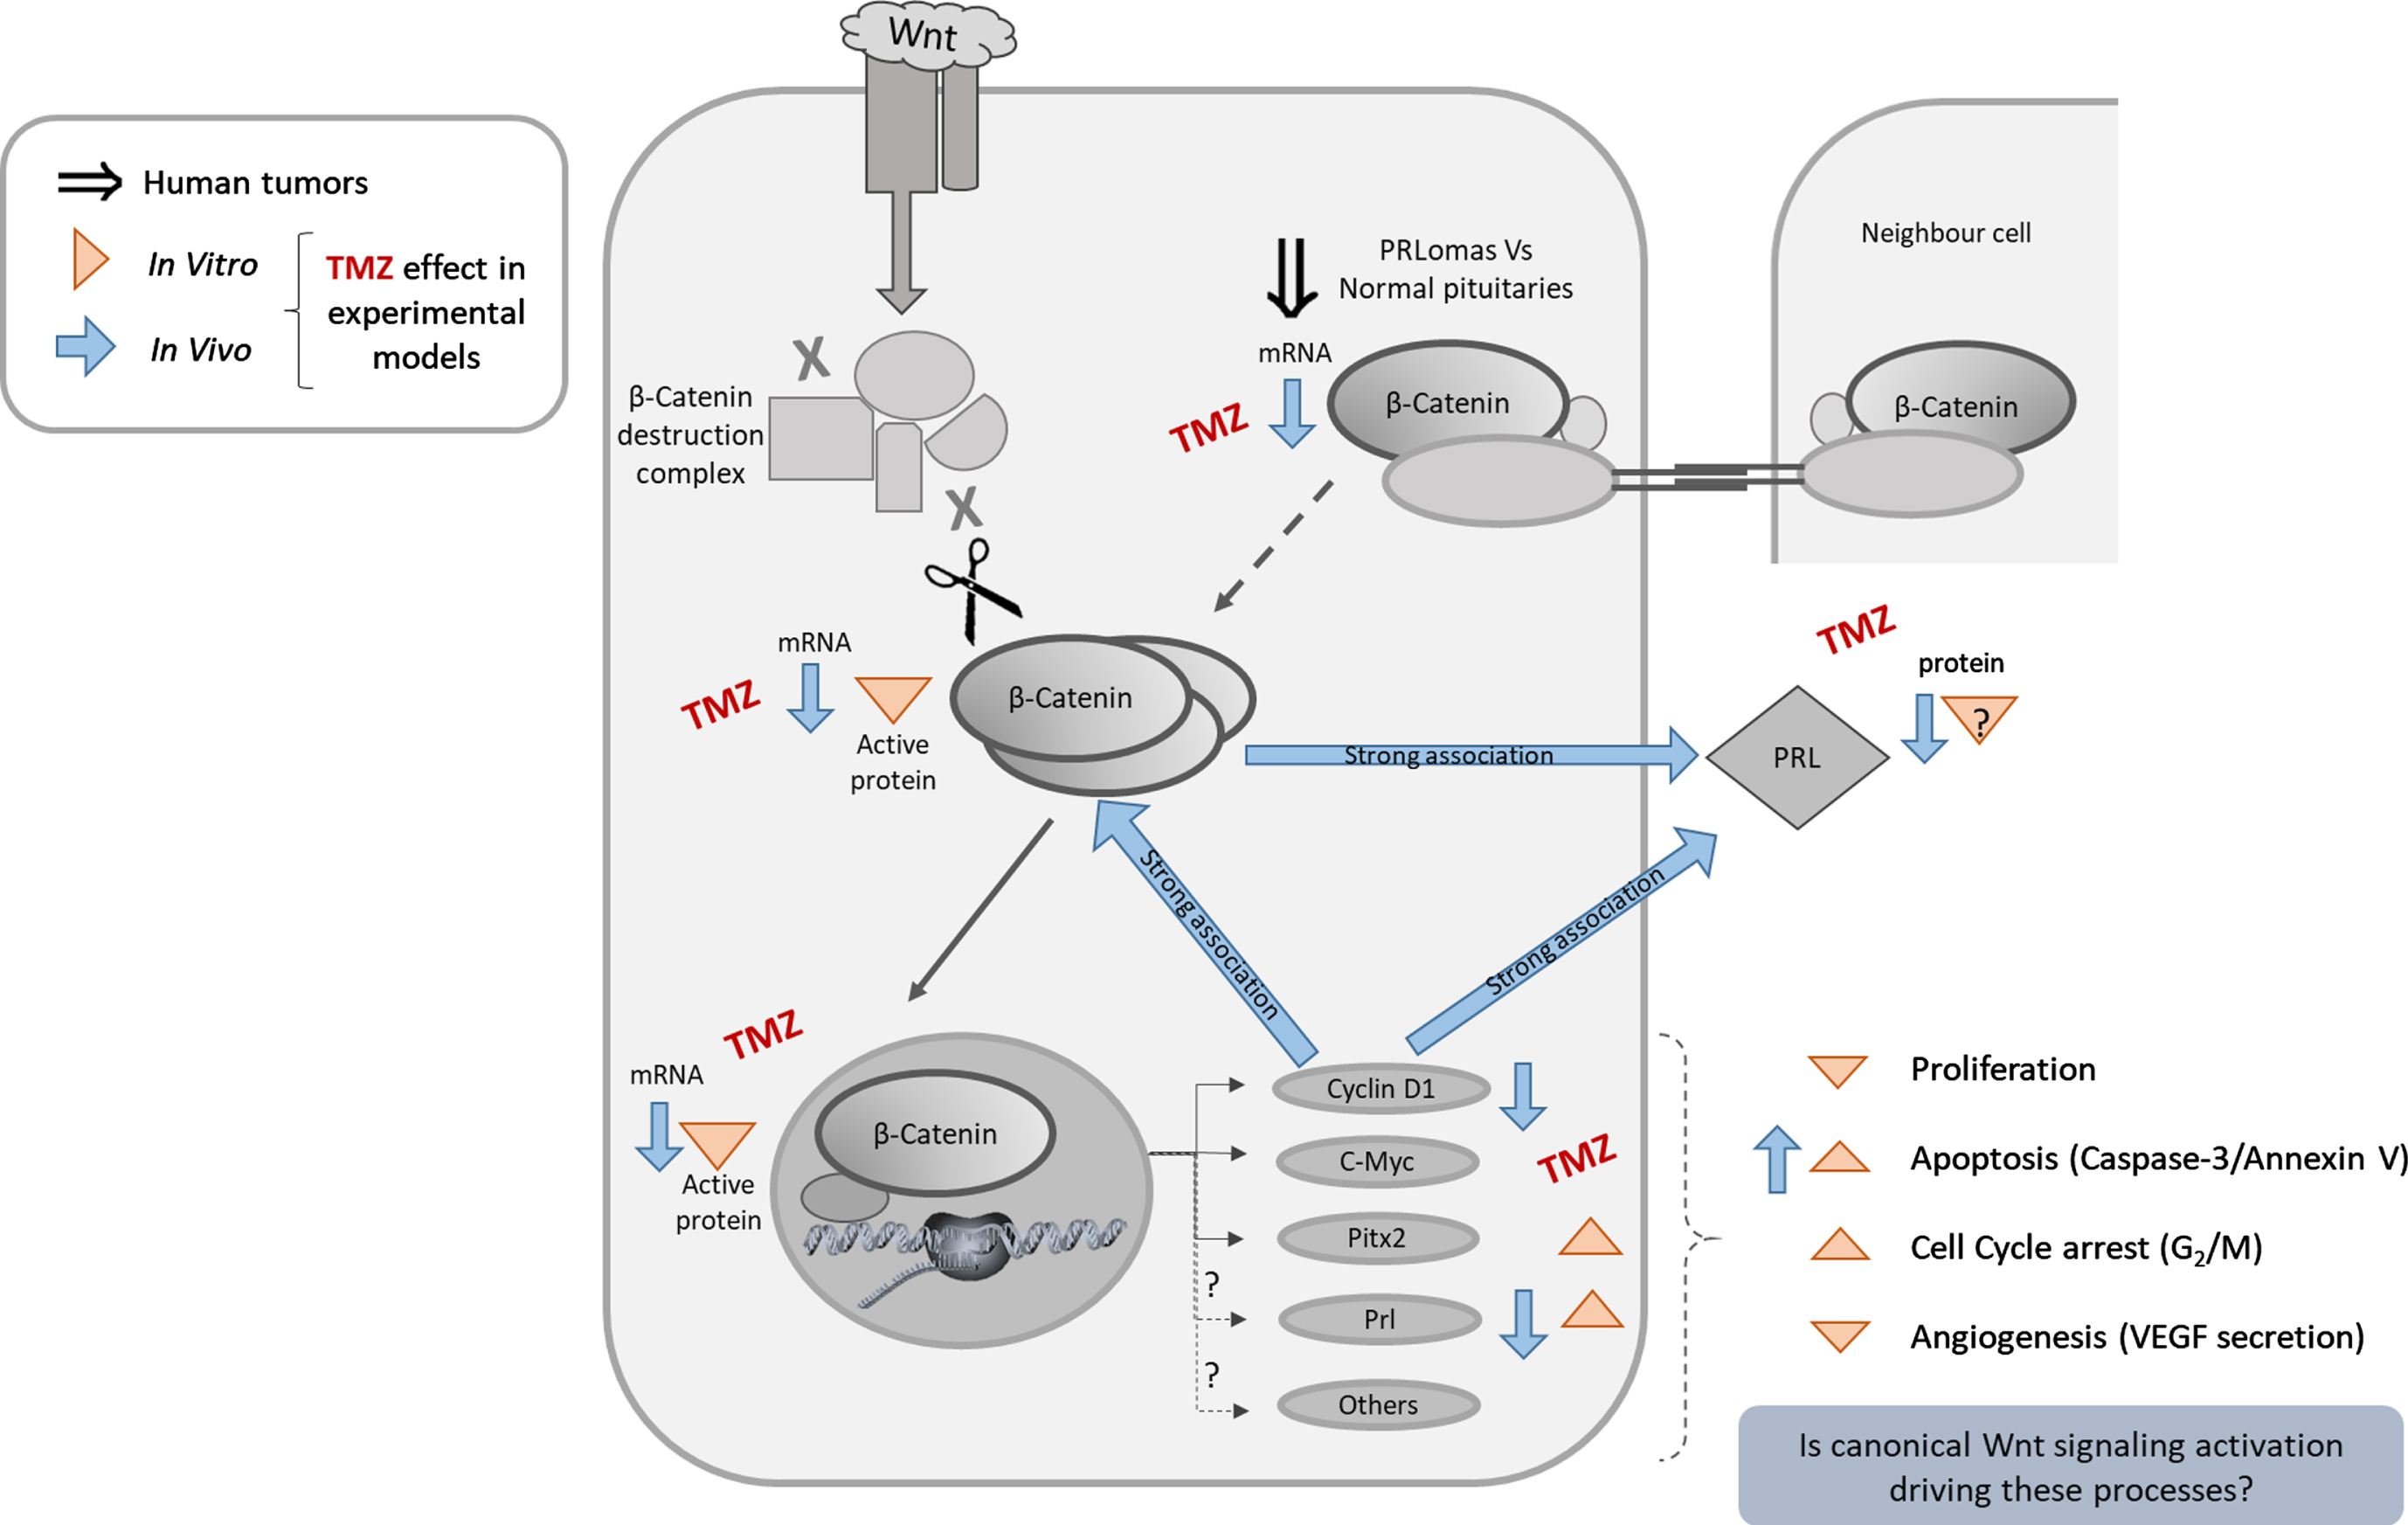
In conclusion, our work highlights the possibility of targeting Wnt/β-Catenin pathway as a combined therapy for TMZ resistant pituitary tumors, opening novel opportunities, in particular, for aggressive, dopamine refractory prolactinomas. We want to specially thank Dr. Damasia Becú Villalobos and Dr. Rodolfo Goya for their kindness with laboratory supplies. We also thank Dr. Virginia Pasquinelli and Mrs. Natalia Menite for their expert flow cytometry technical assistance; Biochem. Lucía Romano for her advices and expertise in specific biochemical techniques, Mr. Gaston Villafañe for his helpful mice handling and care and Dr. Licina Tessone for her special assistance with human tissue evaluation.
Acknowledgments
We thank the Institutions that financially supported our work, Agencia Nacional de Promoción Científica y Tecnológica, Argentina [PICT 901-2013]; Consejo Nacional de Investigaciones Científicas y Técnicas and Universidad Nacional del Noroeste de la Provincia de Buenos Aires [PIO CONICET-UNNOBA 2015-2016 15720150100010CO] and SIB UNNOBA [#0241/2017]. The three grants were awarded to Dr. Carolina Cristina.
Author contributions
CONCEPTION: CC
PERFORMING OF EXPERIMENTS: DG, VS, PS, CA and BN
ANALYSIS OF DATA: CC, DG, VS and PS
PREPARATION OF THE MANUSCRIPT: CC and DG
REVISION FOR IMPORTANT INTELLECTUAL CONTENT: VDL, SFM, CA, SG, AL, BS and CC
SUPERVISION: CC
Conflict of interest
D.G has no conflict of interest to report.
V.S has no conflict of interest to report.
P.S has no conflict of interest to report.
C.A has no conflict of interest to report.
B.N has no conflict of interest to report.
V.D.L has no conflict of interest to report.
S.F.M has no conflict of interest to report.
C.A has no conflict of interest to report.
S.G has no conflict of interest to report.
A.L has no conflict of interest to report.
B.S has no conflict of interest to report.
C.C has no conflict of interest to report.
Ethical considerations
The project and procedures were approved by the Ethical Committee of participant Institutions (FLENI Research Ethics Committee, #04-2918, March 2018; and Santa Isabel Clinic Ethics Committee, 1905/18, January 2018) and were conducted according to the principles stated in the Declaration of Helsinki by the World Medical Association. In all cases, patients were informed about the studies to be undertaken by neurosurgeons and signed the respective written consent.
Supplementary material
[1] The supplementary material is available in the electronic version of this article: https://dx.doi.org/10.3233/TUB-211500.
References
[1] | Trouillas J , Roy P , Sturm N , Dantony E , Cortet-Rudelli C , Viennet G , et al. A new prognostic clinicopathological classification of pituitary adenomas: a multicentric case-control study of 410 patients with 8 years post-operative follow-up. Acta Neuropathol. (2013) ;126: (1):123–35. doi: 10.1007/s00401-013-1084-y |
[2] | Sari R , Altinoz MA . Treatment Strategies for Dopamine Agonist-Resistant and Aggressive Prolactinomas: A Comprehensive Analysis of the Literature. Horm Metab Res. (2021) ;53: (7):413–24. doi: 10.1055/a-1525-2131 |
[3] | Buchfelder M , Zhao Y , Schlaffer SM . Surgery for Prolactinomas to Date. Neuroendocrinology. (2019) ;109: (1):77–81. doi: 10.1159/000497331 |
[4] | Lamb LS , Sim HW , McCormack AI . Exploring the Role of Novel Medical Therapies for Aggressive Pituitary Tumors: A Review of the Literature-“Are We There Yet?”. Cancers (Basel). (2020) ;12: :(2). doi: 10.3390/cancers12020308 |
[5] | Dworakowska D , Wlodek E , Leontiou CA , Igreja S , Cakir M , Teng M , et al. Activation of RAF/MEK/ERK and PI3K/AKT/mTOR pathways in pituitary adenomas and their effects on downstream effectors. Endocr Relat Cancer. (2009) ;16: (4):1329–38. doi: 10.1677/ERC-09-0101 |
[6] | Cakir M , Grossman AB . Targeting MAPK (Ras/ERK) and PI3K/Akt pathways in pituitary tumorigenesis. Expert Opin Ther Targets. (2009) ;13: (9):1121–34. doi: 10.1517/14728220903170675 |
[7] | West KA , Castillo SS , Dennis PA . Activation of the PI3K/Akt pathway and chemotherapeutic resistance. Drug Resist Updat. (2002) ;5: (6):234–48. doi: 10.1016/s1368-7646(02)00120-6 |
[8] | Perrone S , Zubeldia-Brenner L , Gazza E , Demarchi G , Baccarini L , Baricalla A , et al. Notch system is differentially expressed and activated in pituitary adenomas of distinct histotype, tumor cell lines and normal pituitaries. Oncotarget. (2017) ;8: (34):57072–88. doi: 10.18632/oncotarget.19046 |
[9] | Clevers H , Nusse R . Wnt/beta-catenin signaling and disease. Cell. 149: (6):1192–205. doi: 10.1016/j.cell.2012.05.012 |
[10] | Widelitz R . Wnt signaling through canonical and non-canonical pathways: Recent progress. Growth Factors. (2005) ;23: (2):111–6. doi: 10.1080/08977190500125746 |
[11] | Nusse R , Clevers H . Wnt/beta-Catenin Signaling, Disease, and Emerging Therapeutic Modalities. Cell. (2017) ;169: (6):985–99. doi: 10.1016/j.cell.2017.05.016 |
[12] | Koval A , Katanaev VL . Dramatic dysbalancing of the Wnt pathway in breast cancers. Sci Rep. (2018) ;8: (1):7329. doi: 10.1038/s41598-018-25672-6 |
[13] | Polakis P . Drugging Wnt signalling in cancer. EMBO J. (2012) ;31: (12):2737–46. doi: 10.1038/emboj.2012.126 |
[14] | Lugli A , Zlobec I , Minoo P , Baker K , Tornillo L , Terracciano L , et al. Prognostic significance of the wnt signalling pathway molecules APC, beta-catenin and E-cadherin in colorectal cancer: a tissue microarray-based analysis. Histopathology. (2007) ;50: (4):453–64. doi: 10.1111/j.1365-2559.2007.02620.x |
[15] | Giles A , Madec F , Friedrichsen S , Featherstone K , Chambers T , Harper CV , et al. Wnt signaling in estrogen-induced lactotroph proliferation. J Cell Sci. (2011) ;124: (Pt 4):540–7. doi: 10.1242/jcs.078642 |
[16] | Formosa R , Gruppetta M , Falzon S , Santillo G , DeGaetano J , Xuereb-Anastasi A , et al. Expression and clinical significance of Wnt players and survivin in pituitary tumours. Endocr Pathol. (2012) ;23: (2):123–31. doi: 10.1007/s12022-012-9197-8 |
[17] | Ren J , Jian F , Jiang H , Sun Y , Pan S , Gu C , et al. Decreased expression of SFRP2 promotes development of the pituitary corticotroph adenoma by upregulating Wnt signaling. Int J Oncol. (2018) ;52: (6):1934–46. doi: 10.3892/ijo.2018.4355 |
[18] | Stefanski CD , Prosperi JR . Wnt-Independent and Wnt-Dependent Effects of APC Loss on the Chemotherapeutic Response. Int J Mol Sci. (2020) ;21: (21). doi: 10.3390/ijms21217844 |
[19] | Nguyen VHL , Hough R , Bernaudo S , Peng C . Wnt/beta-catenin signalling in ovarian cancer: Insights into its hyperactivation and function in tumorigenesis. J Ovarian Res. (2019) ;12: (1):122. doi: 10.1186/s13048-019-0596-z |
[20] | Li L , Liu HC , Wang C , Liu X , Hu FC , Xie N , et al. Overexpression of beta-Catenin Induces Cisplatin Resistance in Oral Squamous Cell Carcinoma. Biomed Res Int. (2016) );2016: :5378567. doi: 10.1155/2016/5378567 |
[21] | Wickstrom M , Dyberg C , Milosevic J , Einvik C , Calero R , Sveinbjornsson B , et al. Wnt/beta-catenin pathway regulates MGMT gene expression in cancer and inhibition of Wnt signalling prevents chemoresistance. Nat Commun. (2015) ;6: :8904. doi: 10.1038/ncomms9904 |
[22] | Pietrantonio F , Perrone F , de Braud F , Castano A , Maggi C , Bossi I , et al. Activity of temozolomide in patients with advanced chemorefractory colorectal cancer and MGMT promoter methylation. Ann Oncol. (2014) ;25: (2):404–8. doi: 10.1093/annonc/mdt547 |
[23] | Hart MG , Garside R , Rogers G , Stein K , Grant R . Temozolomide for high grade glioma. Cochrane Database Syst Rev. (2013) (4):CD007415. doi: 10.1002/14651858.CD007415.pub2 |
[24] | Li RH , Hou XY , Yang CS , Liu WL , Tang JQ , Liu YQ , et al. Temozolomide for Treating Malignant Melanoma. J Coll Physicians Surg Pak. (2015) ;25: (9):680–8. doi: 09.2015/JCPSP.680688 |
[25] | Dworakowska D , Grossman AB . Aggressive and malignant pituitary tumours: state-of-the-art. Endocr Relat Cancer. (2018) ;25: (11):R559–R75. doi: 10.1530/ERC-18-0228 |
[26] | Syro LV , Rotondo F , Ortiz LD , Kovacs K . 65 YEARS OF THE DOUBLE HELIX: Treatment of pituitary tumors with temozolomide: an update. Endocr Relat Cancer. (2018) ;25: (8):T159–T69. doi: 10.1530/ERC-18-0015 |
[27] | Ilie MD , Jouanneau E , Raverot G . Aggressive Pituitary Adenomas and Carcinomas. Endocrinol Metab Clin North Am. (2020) ;49: (3):505–15. doi: 10.1016/j.ecl.2020.05.008 |
[28] | Luo M , Tan Y , Chen W , Hu B , Wang Z , Zhu D , et al. Clinical Efficacy of Temozolomide and Its Predictors in Aggressive Pituitary Tumors and Pituitary Carcinomas: A Systematic Review and Meta-Analysis. Front Neurol. (2021) ;12: :700007. doi: 10.3389/fneur.2021.700007 |
[29] | Hagen C , Schroeder HD , Hansen S , Hagen C , Andersen M . Temozolomide treatment of a pituitary carcinoma and two pituitary macroadenomas resistant to conventional therapy. Eur J Endocrinol. (2009) ;161: (4):631–7. doi: 10.1530/EJE-09-0389 |
[30] | Raverot G , Sturm N , de Fraipont F , Muller M , Salenave S , Caron P , et al. Temozolomide treatment in aggressive pituitary tumors and pituitary carcinomas: a French multicenter experience. J Clin Endocrinol Metab. (2010) ;95: (10):4592–9. doi: 10.1210/jc.2010-0644 |
[31] | Lasolle H , Raverot G . Therapeutic innovations in endocrine diseases - part 3 : temozolomide and future therapeutics for aggressive pituitary tumors and carcinomas. Presse Med. (2016) ;45: (6 Pt 2):e211–6. doi: 10.1016/j.lpm.2016.05.008 |
[32] | Santos-Pinheiro F , Penas-Prado M , Kamiya-Matsuoka C , Waguespack SG , Mahajan A , Brown PD , et al. Treatment and long-term outcomes in pituitary carcinoma: a cohort study. Eur J Endocrinol. (2019) ;181: (4):397–407. doi: 10.1530/eje-18-0795 |
[33] | Syro LV , Ortiz LD , Scheithauer BW , Lloyd R , Lau Q , Gonzalez R , et al. Treatment of pituitary neoplasms with temozolomide: a review. Cancer. (2011) ;117: (3):454–62. doi: 10.1002/cncr.25413 |
[34] | Bengtsson D , Schroder HD , Andersen M , Maiter D , Berinder K , Feldt Rasmussen U , et al. Long-term outcome and MGMT as a predictive marker in 24 patients with atypical pituitary adenomas and pituitary carcinomas given treatment with temozolomide. J Clin Endocrinol Metab. (2015) ;100: (4):1689–98. doi: 10.1210/jc.2014-4350 |
[35] | Bruno OD , Juarez-Allen L , Christiansen SB , Manavela M , Danilowicz K , Vigovich C , et al. Temozolomide Therapy for Aggressive Pituitary Tumors: Results in a Small Series of Patients from Argentina. Int J Endocrinol. (2015) :587893. doi: 10.1155/2015/587893 |
[36] | Mete O , Lopes MB . Overview of the 2017 WHO Classification of Pituitary Tumors. Endocr Pathol. (2017) ;28: (3):228–43. doi: 10.1007/s12022-017-9498-z |
[37] | JuddAM, LoginIS, KovacsK, RossPC, SpangeloBL, JarvisWD, et al. Characterization of the MMQ Cell, A Prolactin-Secreting Clonal Cell Line That Is Responsive to Dopamine*. Endocrinology. (1988) ;123: (5):2341–50. doi: 10.1210/endo-123-5-2341 |
[38] | Cristina C , Diaz-Torga G , Baldi A , Gongora A , Rubinstein M , Low MJ , et al. Increased pituitary vascular endothelial growth factor-a in dopaminergic D2 receptor knockout female mice. Endocrinology. (2005) ;146: (7):2952–62. doi: 10.1210/en.2004-1445 |
[39] | Garcia-Tornadu I , Diaz-Torga G , Risso GS , Silveyra P , Cataldi N , Ramirez MC , et al. Hypothalamic orexin, OX1, alphaMSH, NPY and MCRs expression in dopaminergic D2R knockout mice. Neuropeptides. (2009) ;43: (4):267–74. doi: 10.1016/j.npe2009.06.002 |
[40] | Perez-Millan Ms , Berner Ss , Luque G , Bonis C , Sevlever G , Becu-Villalobos D , et al. Enhanced nestin expression and small blood vessels in human pituitary adenomas. Pituitary. (2013) ;16: (3):303–10. doi: 10.1007/s11102-012-0421-9 |
[41] | Zhan T , Rindtorff N , Boutros M . Wnt signaling in cancer. Oncogene. (2017) ;36: (11):1461–73. doi: 10.1038/onc.2016.304 |
[42] | Najafi SMA . The Canonical Wnt Signaling (Wnt/beta-Catenin Pathway): A Potential Target for Cancer Prevention and Therapy. Iran Biomed J. (2020) ;24: (5):269–80. doi: 10.29252/ibj.24.5.264 |
[43] | Sekine S , Shibata T , Kokubu A , Morishita Y , Noguchi M , Nakanishi Y , et al. Craniopharyngiomas of adamantinomatous type harbor beta-catenin gene mutations. Am J Pathol. (2002) ;161: (6):1997–2001. doi: 10.1016/s0002-9440(10)64477-x |
[44] | Long Y , Lu M , Cheng T , Zhan X , Zhan X . Multiomics-Based Signaling Pathway Network Alterations in Human Non-functional Pituitary Adenomas. Front Endocrinol (Lausanne). (2019) ;10: :835. doi: 10.3389/fendo.2019.00835 |
[45] | Colli LM , Saggioro F , Serafini LN , Camargo RC , Machado HR , Moreira AC , et al. Components of the canonical and non-canonical Wnt pathways are not mis-expressed in pituitary tumors. PLoS One. (2013) ;8: (4):e62424. doi: 10.1371/journal.pone.0062424 |
[46] | Bai J , Wang Y , Li C , Zhang Y . Effects of fulvestrant on biological activity and Wnt expression in rat GH3 cells. Neural Regen Res. (2012) ;7: (4):283–9. doi: 10.3969/j.issn.1673-5374.2012.04.008 |
[47] | Kam Y , Quaranta V . Cadherin-Bound Î2-Catenin Feeds into the Wnt Pathway upon Adherens Junctions Dissociation: Evidence for an Intersection between Î2-Catenin Pools. PLoS ONE. (2009) ;4: (2):e4580. |
[48] | Semba S , Han SY , Ikeda H , Horii A . Frequent nuclear accumulation of beta-catenin in pituitary adenoma. Cancer. (2001) ;91: (1):42–8. doi: 10.1002/1097-0142(20010101)91:1<42::AID-CNCR6>3.0.CO;2-7 [pii]. |
[49] | Ma W , IkedaH, YoshimotoT. Clinicopathologic study of 123 cases of prolactin-secreting pituitary adenomas with special reference to multihormone production and clonality of adenomas. Cancer. (2002) ;95: :166. doi: 10.1002/cncr.10676 |
[50] | Gurlek A , Karavitaki N , Ansorge O , Wass JAH . What are the markers of aggressiveness in prolactinomas? Changes in cell biology, extracellular matrix components, angiogenesis and genetics. European Journal of Endocrinology. (2007) ;156: (2):143–53. doi: 10.1530/eje.1.02339 |
[51] | Feng J , Wang J , Liu Q , Li J , Zhang Q , Zhuang Z , et al. DAPT, a γ-Secretase Inhibitor, Suppresses Tumorigenesis, and Progression of Growth Hormone-Producing Adenomas by Targeting Notch Signaling. Frontiers in Oncology. (2019) ;9. doi: 10.3389/fonc.2019.00809 |
[52] | Whitelaw BC , Dworakowska D , Thomas NW , Barazi S , Riordan-Eva P , King AP , et al. Temozolomide in the management of dopamine agonist-resistant prolactinomas. Clin Endocrinol (Oxf). (2012) ;76: (6):877–86. doi: 10.1111/j.1365-2265.2012.04373.x |
[53] | Chen C , Yin S , Zhang S , Wang M , Hu Y , Zhou P , et al. Treatment of aggressive prolactinoma with temozolomide: A case report and review of literature up to date. Medicine (Baltimore). (2017) ;96: (47):e8733. doi: 10.1097/MD.0000000000008733 |
[54] | Almalki MH , Aljoaib NN , Alotaibi MJ , Aldabas BS , Wahedi TS , Ahmad MM , et al. Temozolomide therapy for resistant prolactin-secreting pituitary adenomas and carcinomas: a systematic review. Hormones (Athens). (2017) ;16: (2):139–49. doi: 10.14310/horm.2002.1729 |
[55] | Dai C , Zhang B , Liu X , Ma S , Yang Y , Yao Y , et al. Inhibition of PI3K/AKT/mTOR pathway enhances temozolomide-induced cytotoxicity in pituitary adenoma cell lines in vitro and xenografted pituitary adenoma in female nude mice. Endocrinology. (2013) ;154: (3):1247–59. doi: 10.1210/en.2012-1908 |
[56] | Yi GZ , Liu YW , Xiang W , Wang H , Chen ZY , Xie SD , et al. Akt and beta-catenin contribute to TMZ resistance and EMT of MGMT negative malignant glioma cell line. J Neurol Sci. (2016) ;367: :101–6. doi: 10.1016/j.jns.2016.05.054 |
[57] | Riganti C , Salaroglio IC , Caldera V , Campia I , Kopecka J , Mellai M , et al. Temozolomide downregulates P-glycoprotein expression in glioblastoma stem cells by interfering with the Wnt3a/glycogen synthase-3 kinase/beta-catenin pathway. Neuro Oncol. (2013) ;15: (11):1502–17. doi: 10.1093/neuonc/not104 |
[58] | Jiang Z , Zhang Y , Chen X , Wu P , Chen D . Inactivation of the Wnt/beta-catenin signaling pathway underlies inhibitory role of microRNA-129-5p in epithelial-mesenchymal transition and angiogenesis of prostate cancer by targeting ZIC2. Cancer Cell Int. (2019) ;19: :271. doi: 10.1186/s12935-019-0977-9 |
[59] | Shen DW , Li YL , Hou YJ , Xu ZD , Li YZ , Chang JY . MicroRNA-543 promotes cell invasion and impedes apoptosis in pituitary adenoma via activating the Wnt/beta-catenin pathway by negative regulation of Smad7. Biosci Biotechnol Biochem. (2019) ;83: (6):1035–44. doi: 10.1080/09168451.2019.1591260 |
[60] | Kovacs K , Horvath E , Syro LV , Uribe H , Penagos LC , Ortiz LD , et al. Temozolomide therapy in a man with an aggressive prolactin-secreting pituitary neoplasm: Morphological findings. Hum Pathol. (2007) ;38: (1):185–9. doi: 10.1016/j.humpath.2006.07.014 |
[61] | Wang Y , Gao S , Wang W , Liang J . Temozolomide inhibits cellular growth and motility via targeting ERK signaling in glioma C6 cells. Mol Med Rep. (2016) ;14: (6):5732–8. doi: 10.3892/mmr.2016.5964 |
[62] | Voskoglou-Nomikos T , Pater JL , Seymour L . Clinical Predictive Value of the in Vitro Cell Line, Human Xenograft, and Mouse Allograft Preclinical Cancer Models. Clinical Cancer Research. (2003) ;9: (11):4227–39. |
[63] | Sheehan J , Rainey J , Nguyen J , Grimsdale R , Han S . Temozolomide-induced inhibition of pituitary adenoma cells. J Neurosurg. (2011) ;114: (2):354–8. doi: 10.3171/2010.4.JNS1024 |
[64] | Syro LV , Rotondo F , Camargo M , Ortiz LD , Serna CA , Kovacs K . Temozolomide and Pituitary Tumors: Current Understanding, Unresolved Issues, and Future Directions. Front Endocrinol (Lausanne). (2018) ;9: :318. doi: 10.3389/fendo.2018.00318 |
[65] | Cristina C , Luque GM , Demarchi G , Lopez Vicchi F , Zubeldia-Brenner L , Perez Millan MI , et al. Angiogenesis in pituitary adenomas: human studies and new mutant mouse models. Int J Endocrinol. (2014) ;2014: :608497. doi: 10.1155/2014/608497 |
[66] | Dai C , Zhang B , Liu X , Guo K , Ma S , Cai F , et al. Pyrimethamine sensitizes pituitary adenomas cells to temozolomide through cathepsin B-dependent and caspase-dependent apoptotic pathways. Int J Cancer. (2013) ;133: (8):1982–93. doi: 10.1002/ijc.28199 |


