
Multimodal imaging in urea cycle-related neurological disease – What can imaging after hyperammonemia teach us?
Abstract
BACKGROUND:
Urea cycle-related brain disease may take on variable neuroimaging manifestations, ranging from normal to abnormal with or without a signature appearance. In the past, we have described the usefulness of multimodal imaging in identifying biomarkers of neuronal injury in UCD patients. In this study, we report unique findings in an adolescent male with neonatal-onset OTC deficiency after an episode of hyperammonemia.
MATERIALS AND METHODS:
Multiplanar, multisequence MR imaging (T1WI, T2WI, T2 FLAIR, diffusion weighted images and gradient echo) of the brain was performed on seven separate occasions over the course following the acute illness; first five exams were performed within 28 days of admission and the final two exams were performed approximately 3 and 5 months later.
RESULTS:
1.The initial MR revealed increased signal on T2WI in the basal ganglia, claustrum and frontoparietal white matter; which remained stable over time. By the 5th exam, signal changes had developed in frontal cortex; reflecting permanent injury. 2. DTI tractography of the corticospinal tracts displayed revealed diminution of the number of projectional and commissural fibers over time. 3. Blood flow measurements demonstrated hypoperfusion on the fifth exams followed by hyperperfusion on the final two studies. 4. MR spectroscopy demonstrated that glutamine was elevated during hyperammonemia with myoinositol reduction, reflecting osmotic buffering.
CONCLUSION:
This particular multimodal magnetic resonance neuroimaging showed novel, temporally specific manifestations over the disease course in OTC deficiency. This prospective imaging study expands our understanding of the effect of hyperammonemia on the structure and biochemistry of the nervous system.
1Introduction
Ornithine Transcarbamylase (OTC) deficiency is the most common among the six enzyme deficiencies in urea cycle disorders (UCD). OTC is a proximal enzyme of the urea cycle which is involved in the conversion of ammonia to urea. Ammonia is a highly neurotoxic moiety and its accumulation may have neurological repercussions ranging from seizures and coma to subtle changes in behavior [1, 2]. In the long term, recurrent hyperammonemic events can lead to varying degrees of intellectual disability and aberrations in executive functioning [3]. Experimental models and neuroimaging studies in the past decades have elucidated the pathologic mechanism of hyperammonemia (HA) on the nervous system. The detrimental effects are thought to be due to a cascade of energy scarcity, failure of cerebral osmotic regulation (leading to edema) and excitotoxic injury from glutamate [4, 5].
The initial neuroimaging literature in UCDs consisted of small case series pertaining to patients who were survivors of severe HA [6]. Cortical atrophy and ventriculomegaly were seen almost universally in such patients. Initial MR spectroscopy data recognized elevated glutamine in the internal milieu of the brain as the harbinger of acute encephalopathy [7]. Our group has reported the usefulness of multimodal imaging in identifying biomarkers of neuronal injury as well as anatomical and functional peculiarities in UCD patients. Our research involving Diffusion Tensor Imaging (DTI) has shown that there is a correlation between motor tract injuries (as denoted by functional anisotropy values) and worsening of executive attention and working memory [8]. Functional MRI data has demonstrated that UCD patients have white matter disconnection leading to deterioration in visuospatial performance and attention [9, 10]. MRS studies distinguish low myoinositol as a surrogate marker for prior neurological insult [11].
What is not known is the rapidity with which these changes occur and subsequently resolve after an acute metabolic crisis with hyperammonemia. This paper describes the distinctive neuroimaging findings in an adolescent OTC patient after a metabolic crisis.
2Case presentation
Patient is currently an 18-year-old male who had initially presented with HA, lethargy and respiratory distress at 30 hours of life. Subsequent biochemical (undetectable citrulline and elevated glutamine with orotic aciduria) and genetic testing (pathogenic variant in exon 9 of OTC gene) confirmed a diagnosis of OTC deficiency. Treatment was started with oral ammonia scavengers and protein restricted diet. His clinical course remained relatively well controlled without any known hyperammonemic crisis. He did develop seizure disorder for which he was continued on levetiracetam. He had mild developmental challenges as a child and was also diagnosed with attention deficit hyperactivity disorder at 8 years of age.
In the admission pertaining to our study, he presented with acute alteration in mental status after a few days of upper respiratory symptoms. Ammonia level at presentation at an outside facility was greater than 400 millimoles/L. Therapy was initiated with intravenous sodium benzoate and sodium phenylbutyrate infusion. He was also started on fluids containing 10% dextrose and intralipids. There was no other evidence of metabolic perturbations at transfer such as hypoglycemia, metabolic acidosis or liver dysfunction. Plasma amino acid profile showed glutamine to be raised at 627 millimoles/L. After 2 days of intravenous ammonia scavenger therapy, patient’s mentation improved significantly and ammonia level was trending down. He then started experiencing dysarthria and dysphagia. Etiology of these symptoms was attributed to post-influenza encephalitis based on CSF studies. Treatment was attempted with intravenous methylprednisone and immunoglobulin. There was a steep rise in ammonia level (up to 229 millimoles/L) after starting him on methylprednsione. Steroid treatment was discontinued and sodium benzoate and sodium phenylbutyrate were restarted. Ammonia level stabilized eventually and once he was at his neurological baseline, he was transferred to a rehabilitation center.
3Methods
Multiplanar, multisequence MR imaging of the brain was performed on seven separate occasions over the course of and following the acute illness using either a 3T (n = 5) or 1.5T (n = 2) magnet (General Electric, Milwaukee, WI). The first five exams were performed within 28 days of admission (initial at day 10), and the final 2 follow-up MR exams were performed approximately 3 months and 5 months later. The following pulse sequences were acquired in all cases: T1WI, T2WI, T2 FLAIR, diffusion weighted images (DWI or DTI) and gradient echo sequences. The 3rd and 5th scan were performed without and with gadolinium (0.1 mmol/kg IV gadoterate meglumine); post-contrast axial and coronal T1WI were acquired. All other exams were performed without contrast material.
3.1Perfusion
Pseudo-continuous Arterial Spin Labeling (ASL) with background suppression and a segmented 3D fast spin-echo (FSE) readout was performed as part of the final 3 MR exams using the following parameters: FA 111, IT/post-label delay 1025–1525 msec, labeling duration 1500–2000 msec, TR 4300–4548 msec, TE 11 msec, ETL 1, 3 NEX, matrix 5128, FOV 24×53–57 cm, 3 mm slice thickness, 3 mm spacing. Grayscale ASL perfusion images and pseudo-color images were generated and displayed with the following scale: 0–100 ml/100 g tissue/min. Quantitative ASL values (in ml/100 g tissue/min) were measured using an AW workstation with FuncTool software (GE Healthcare). The T1 value of arterial blood was calculated using patient specific hematocrit levels, oxygen saturation at or around the time of imaging, and the magnetic field strength according to previously published guidelines. [12] Mean whole brain perfusion was estimated in each exam by averaging cerebral blood flow (CBF) values from each cerebral hemisphere at the basal ganglia level.
3.2Diffusion tensor imaging/tractography
DTI with 15 non-collinear directions of encoding was performed on the 1st and final two scans. Quantitative apparent diffusion coefficient (ADC) values (in mm2/s) and corresponding fractional anisotropy values (FA) were measured using 4 mm circular regions of interest placed manually in the following areas: Callosal genu, callosal body, callosal splenium, right and left cingulum, right and left frontal centrum semiovale, and right and left pontine corticospinal tracts. Tractography was performed on the first and last scans to display the 1) Corticospinal tracts (seed placements: medial pre-central gyri, internal capsules posterior limb, cerebral peduncles, and pontine corticospinal tracts) and 2) Corpus callosum. Seed regions of interest were manually drawn on the DTI directionally encoded color map using AW software (GE Healthcare). Tracking termination criteria were set to the following: FA < 0.2 (CST and corpus callosum), turning angle >10 degrees (CST), and turning angle >180 degrees (corpus callosum).
3.3Spectroscopy
Single voxel proton MR spectroscopy (MRS) was acquired concurrently with the 1st, 2nd, and final 3 brain MRIs. 2×2×2 cm voxels of interest were placed over the left basal ganglia (1st–3rd MRS) or left parietal white matter (4th and 5th MRS). PRESS MRS was performed on all exams (TR 1500; TE 35, 144, and/or 288 msec). Ultrashort TE MRS was additionally acquired on the final 3 exams (STEAM; TR 1500, TE 14 msec). Quantitative MR spectroscopy was performed in all cases where raw data was available (n = 4; 1st and final 3 exams). Ferromagnetic artifact from the patient’s dental braces limited the 1st MR spectrum and rendered the second MRS non-diagnostic.
This study was exempted by institutional review board and did not require a specific patient consent.
4Results
The initial brain MR performed 10 days after admission revealed increased signal on T2WI in the basal ganglia, claustrum, frontoparietal white matter, pontine tegmentum, and left brachium pontis; these changes remained stable over time on all follow-up exams (Fig. 1). The first follow-up MR performed 2 days later demonstrated early symmetric, focally hyperintense lateral putamen signal on T2WI. These were more conspicuous on the second follow-up study performed 5 days later, then faded on later exams ultimately to the point of very subtle residual signal alteration (Fig. 2). By the 5th MR exam performed 28 days after admission, signal changes had developed in the frontal cortex, primarily the motor strip, supplemental motor area (SMA), and premotor area (Fig. 2). Later, the postcentral cortex was similarly involved. Post contrast enhancement was visible on the 5th MR exam in much of the involved cortical regions. There was no abnormally reduced diffusion on any exam. The overall brain volume remained normal over time.
Fig. 1
Initial brain MRI performed 10 days after admission. Axial T2WI (TR/TE msec, 3200/102) demonstrating increased signal in the frontoparietal white matter (arrows; a), basal ganglia (arrows; b), claustrum (curved arrows; b), pontine tegmentum (arrow; c), and left brachium pontis (curved arrow; c).
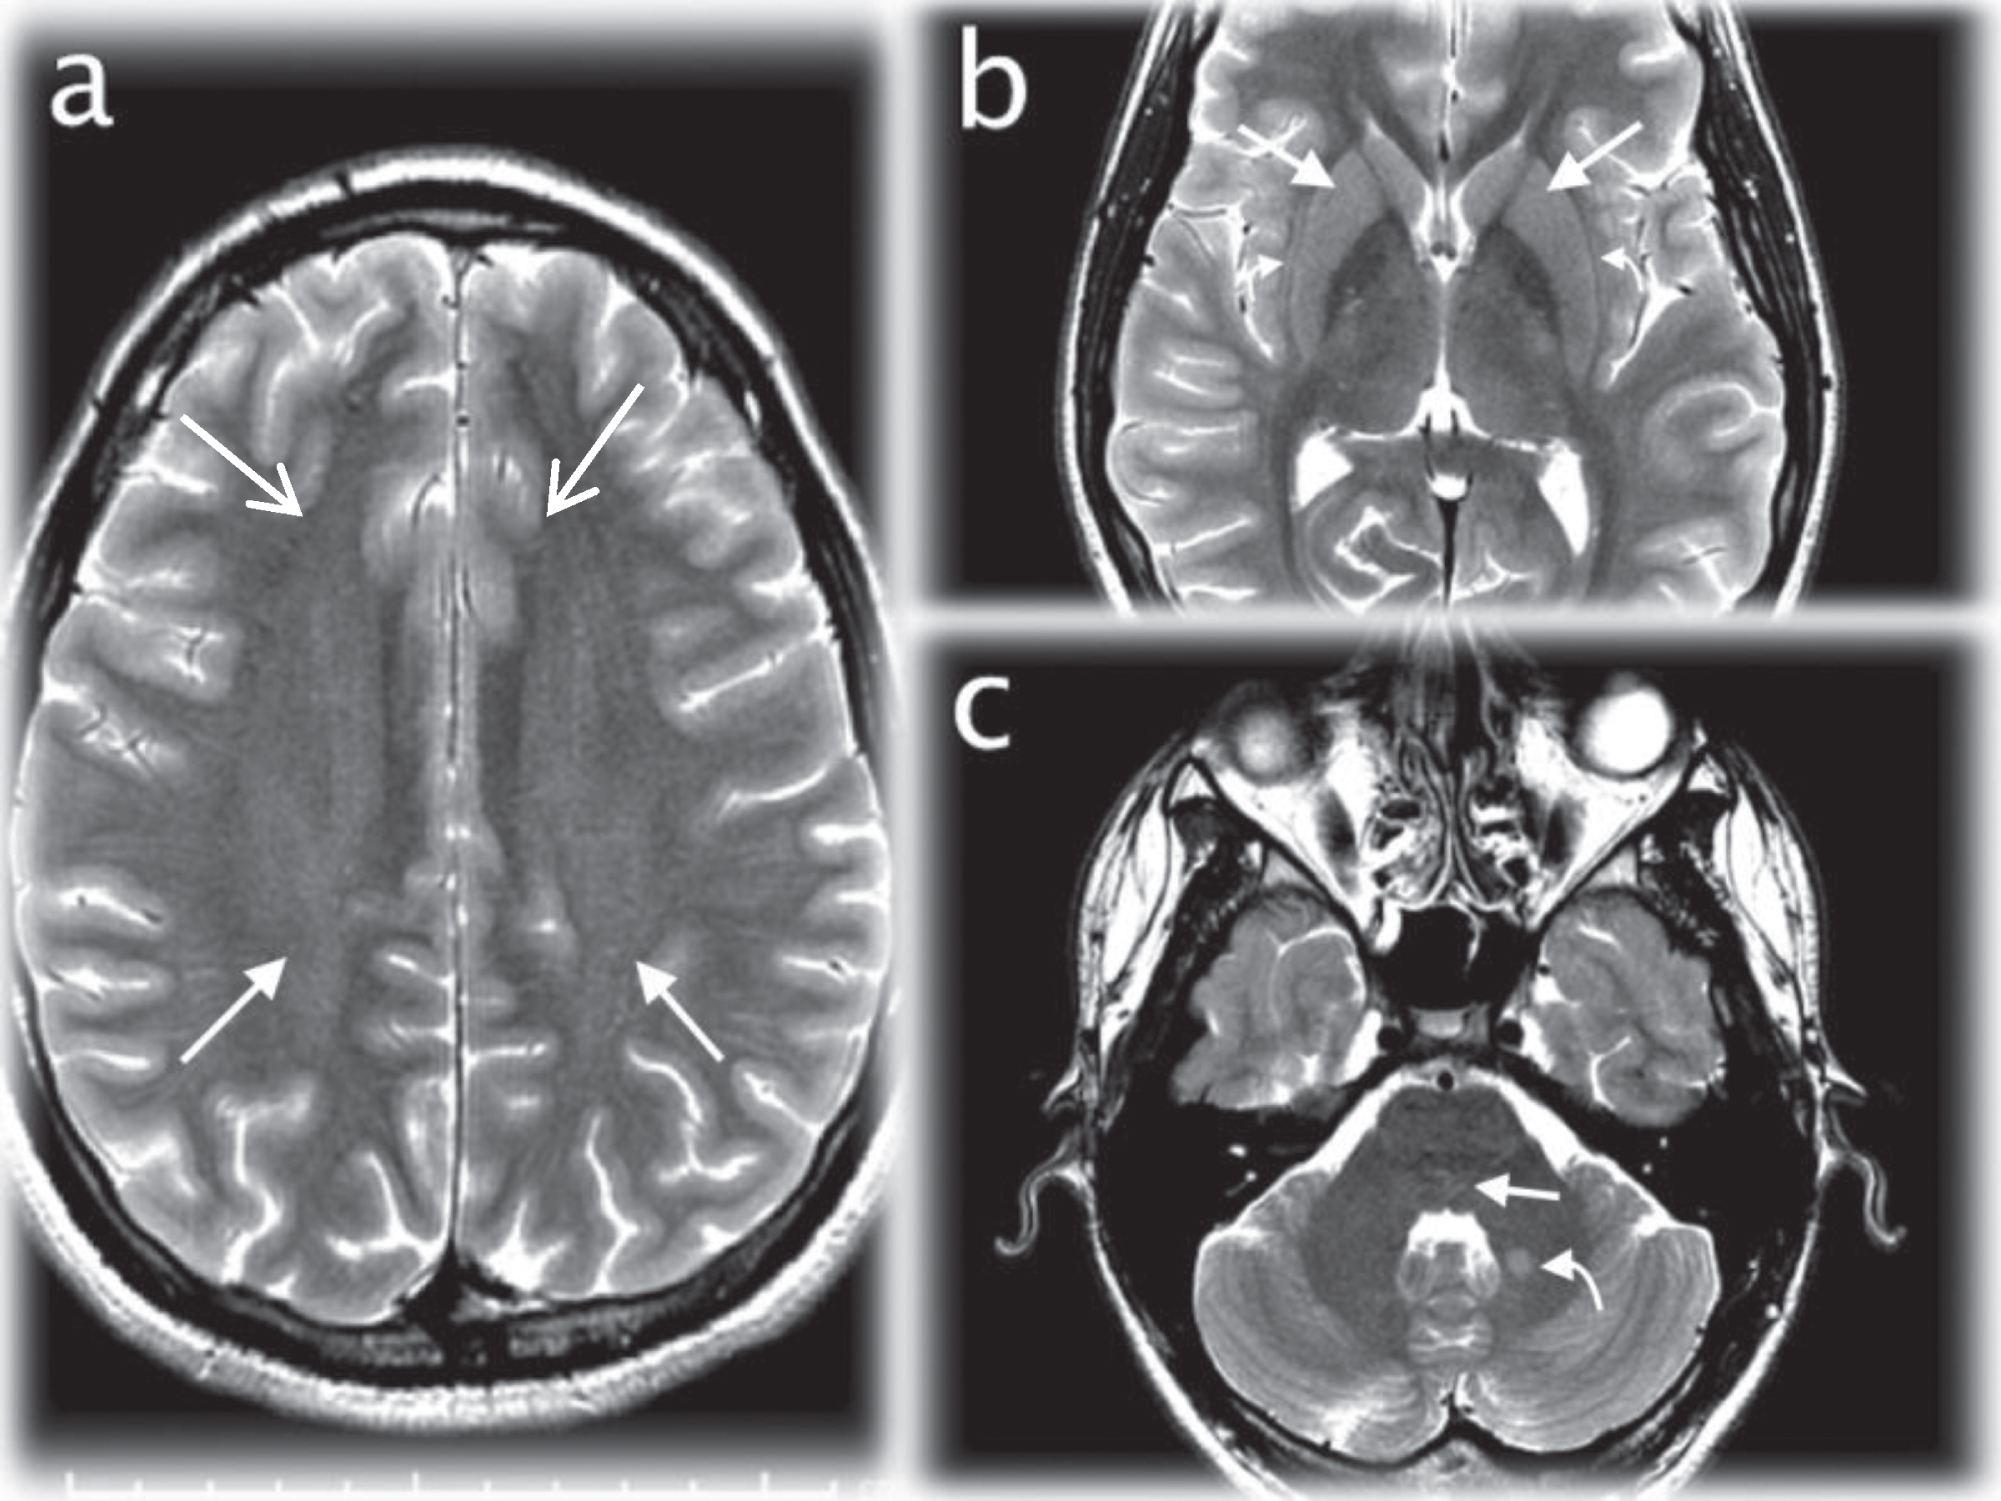
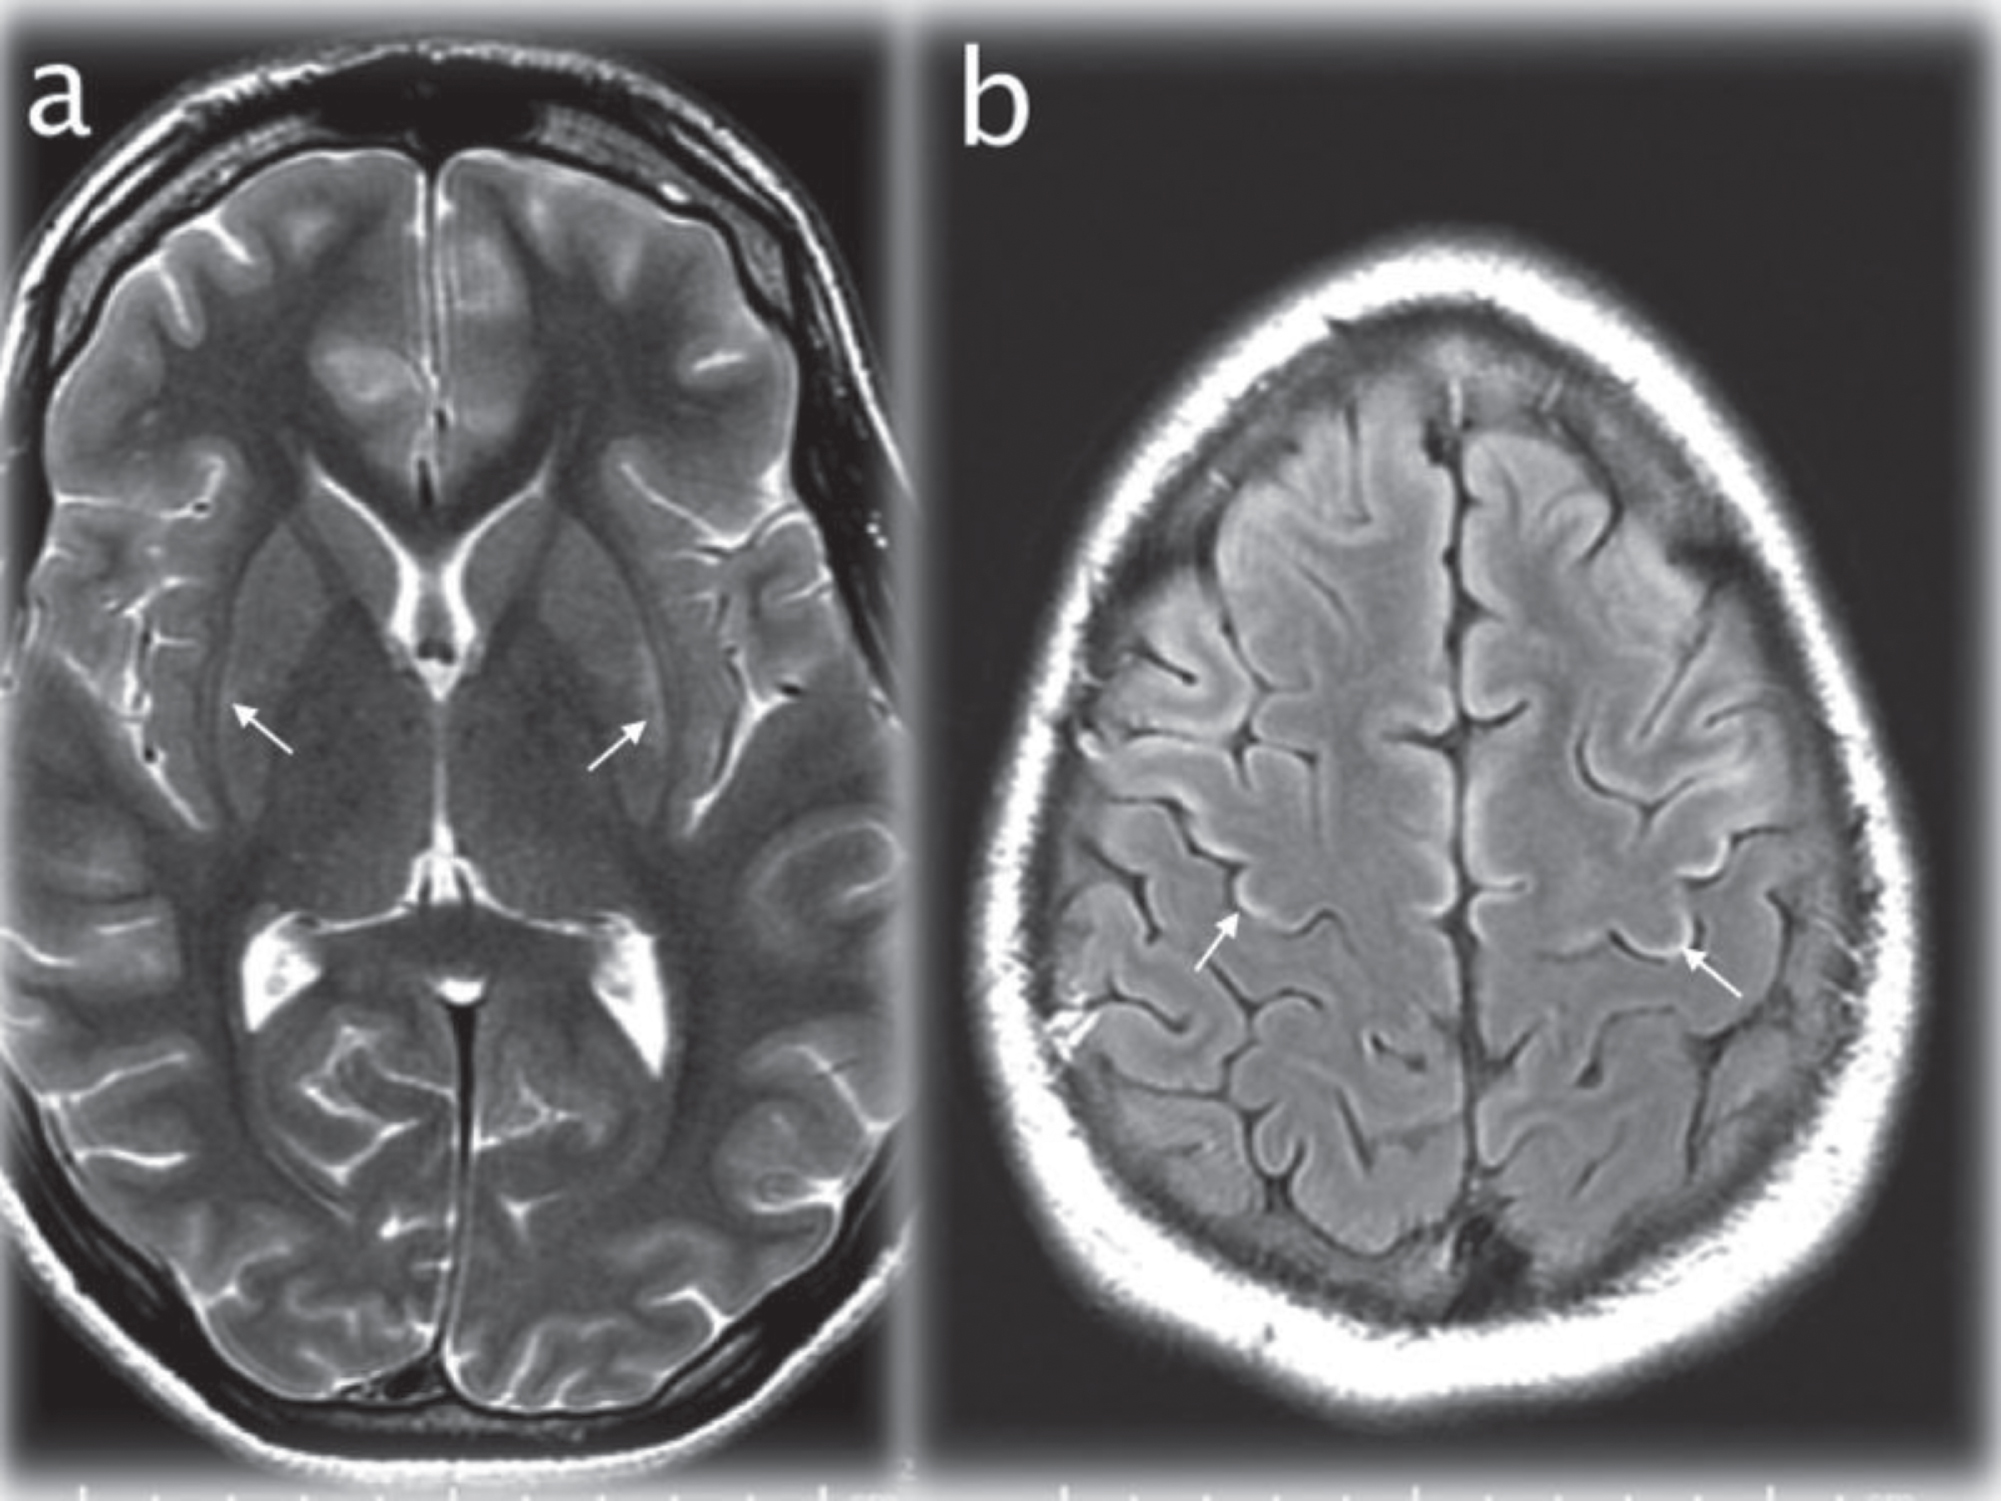
Fig. 2
Axial T2WI (TR/TE msec, 4228/98) through the basal ganglia (a) showing maximal signal changes in the lateral putamen at 17 days after admission (arrows). Axial T2 FLAIR image (IT/TR/TE msec, 2250/10000/144) at the cerebral vertex (b) demonstrating cortical hyperintensity in parts of the frontal lobes (for instance the motor strip, arrows) that developed at 28 days after admission.
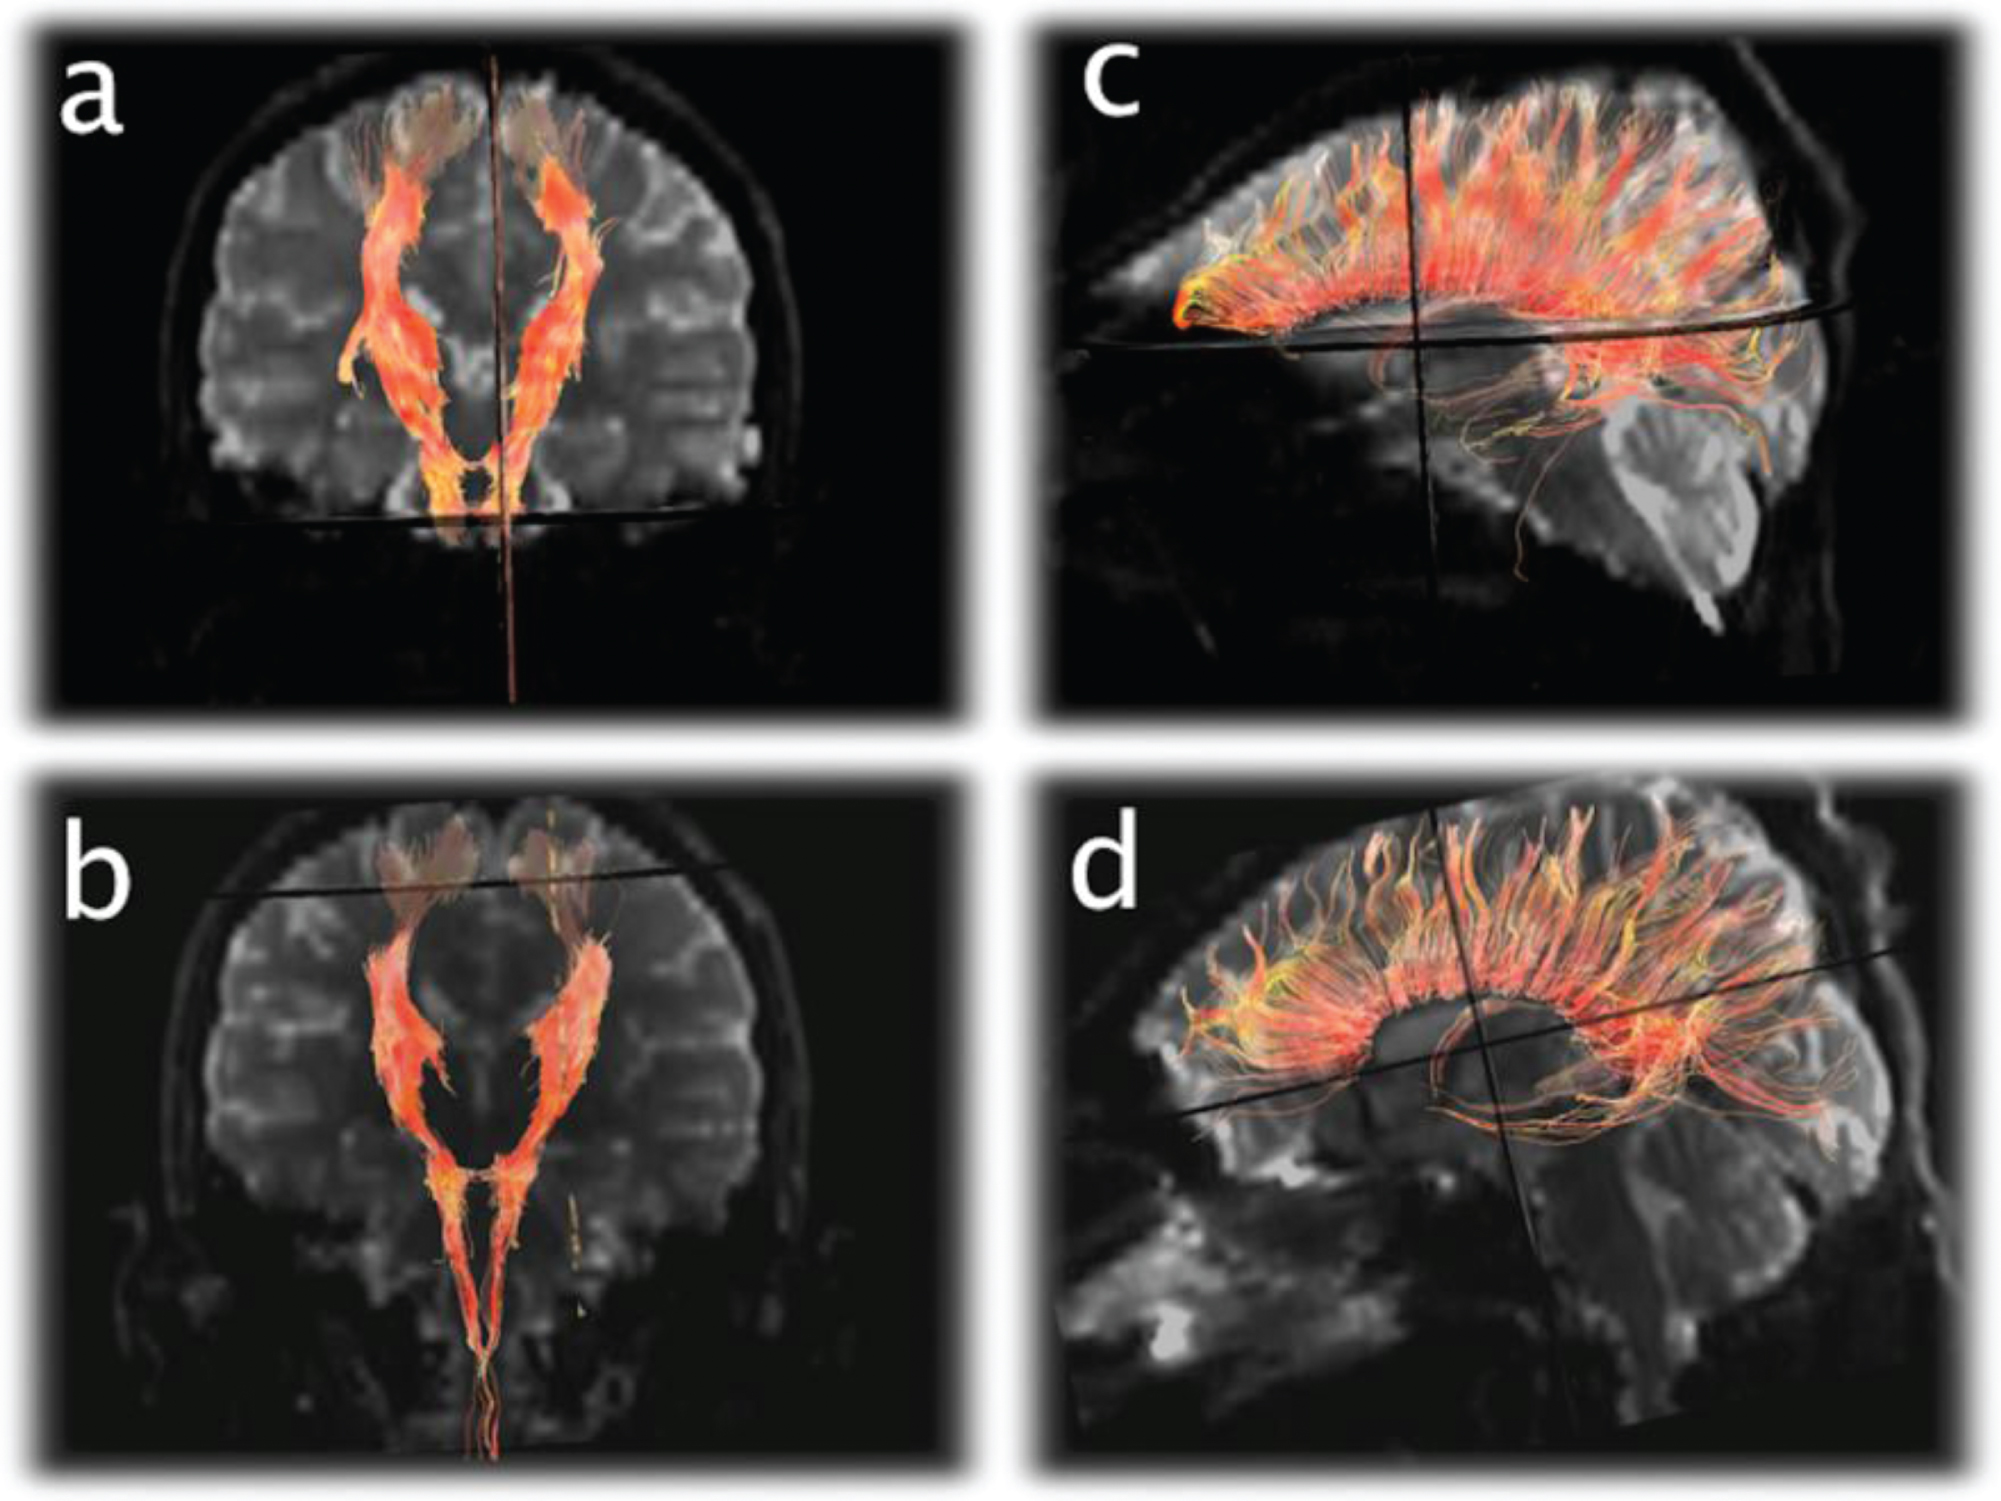
Quantitative FA and ADC values extracted from the corpus callosum, cingulum, centrum semiovale, and corticospinal tracts are shown in Table 1. In most of these brain regions, ADC increased while FA decreased over time. Corticospinal and corpus callosum tractography revealed a decrease in number of visible projectional and commissiural white matter fibers from the 1st to last scan (Fig. 4).
Table 1
Table1
| Location | 1st MRI | 3 months | 6 months | |||
| ADC | FA | ADC | FA | ADC | FA | |
| Genu CC | 7.1 | 0.88 | 8 | 0.88 | 8.7 | 0.83 |
| Body CC | 7.6 | 0.57 | 9.8 | 0.39 | 9.9 | 0.46 |
| Splenium CC | 6.7 | 0.77 | 8.6 | 0.74 | 9.6 | 0.78 |
| Centrum Semiovale (R) | 8 | 0.4 | 9.1 | 0.34 | 9.9 | 0.29 |
| Centrum Semiovale (L) | 8 | 0.4 | 9.3 | 0.36 | 9.5 | 0.34 |
| Cingulum (R) | 8.7 | 0.51 | 9 | 0.48 | 9.5 | 0.45 |
| Cingulum (L) | 8.1 | 0.57 | 9 | 0.49 | 9.2 | 0.49 |
| Corticospinal tract (R) | 7.3 | 0.64 | 7.4 | 0.62 | 7.9 | 0.62 |
| Corticospinal tract (L) | 7.2 | 0.66 | 8 | 0.59 | 7.6 | 0.6 |
CC = corpus callosum, R = right, L = left, ADC = apparent diffusion coefficient (×10–10 mm2/s), FA = fractional aniosotropy.
Fig. 3
Arterial Spin Labeling (ASL) perfusion images on the final 3 exams demonstrate cerebral hypoperfusion (a) evolving to hyperperfusion (b and c).
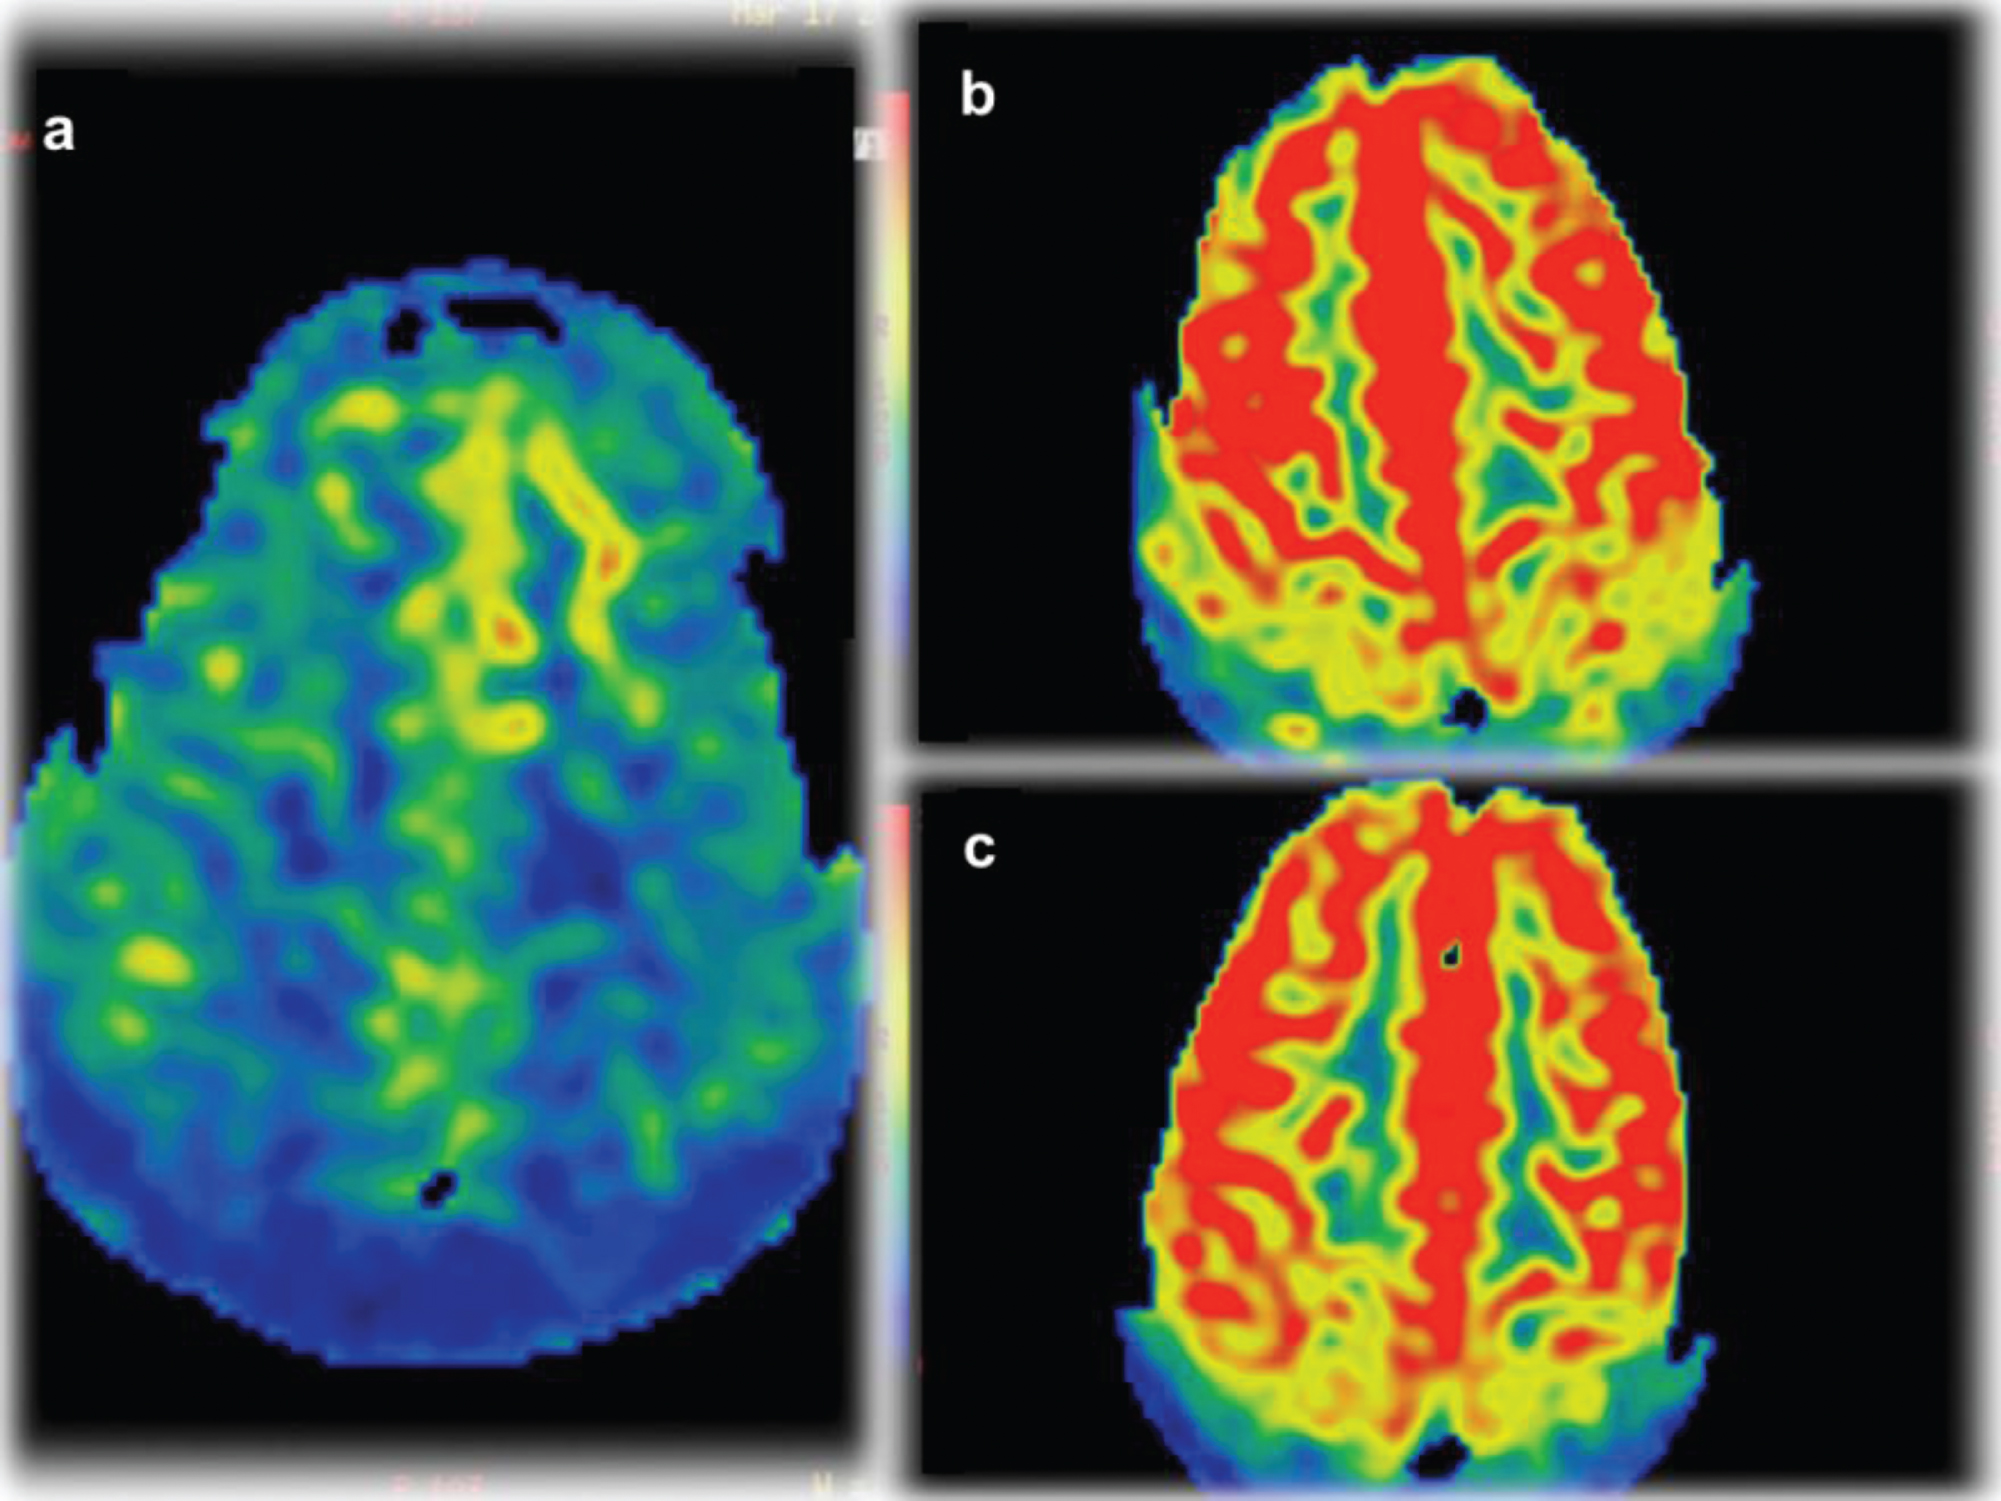
Fig. 4
Diffusion Tensor Imaging (DTI) tractography of the corticospinal tracts displayed in the anterioroposterior plane (a and b) and corpus callosum displayed laterally (c and d) from the 1st exam (a and c) and final exam (b and d) demonstrating subtle diminution of the number of projectional and commissural fibers over time.
ASL perfusion sequences performed as part of the final 3 exams showed diffusely decreased CBF on the 5th exam (41 ml/100 g tissue/min) and increased CBF on the 6th scan (80 ml/100 g tissue/min) and 7th scan (79 ml/100 g tissue/min) (Fig. 3).
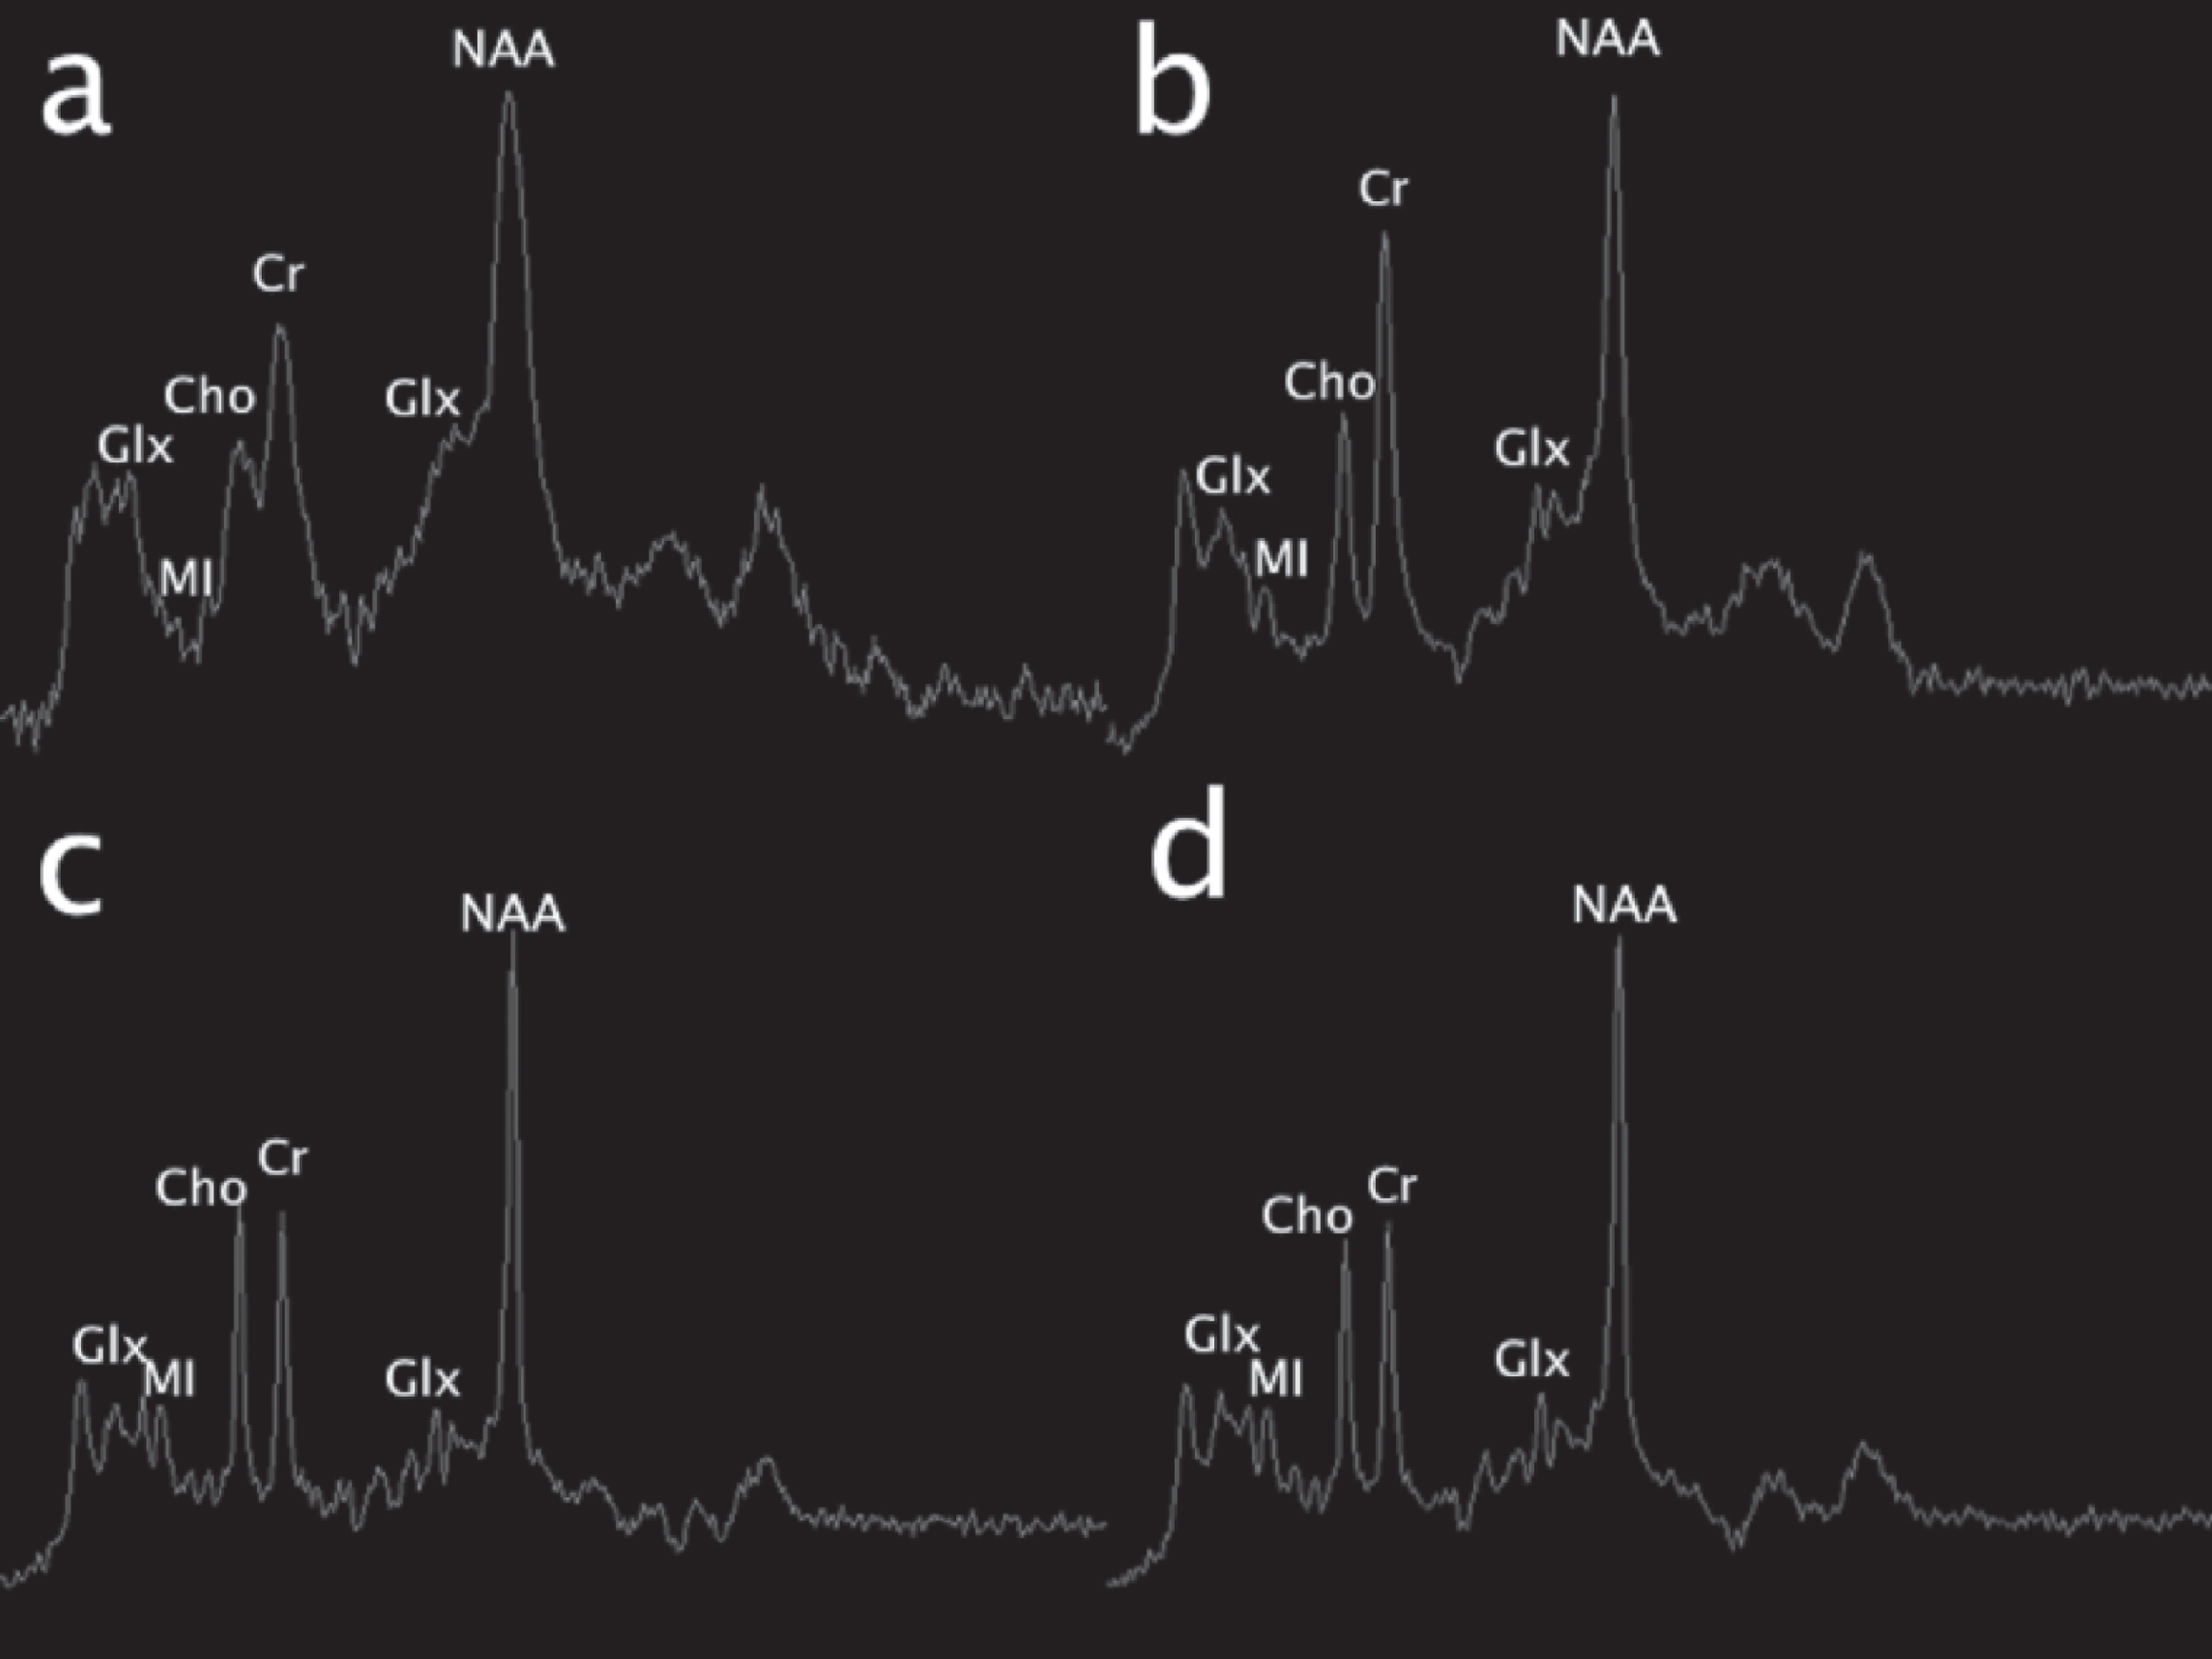
MR spectroscopy demonstrated variable degrees of glutamine and glutamate elevation and myoinositol and choline reduction (Fig. 5). Elevated glutamine was strongly suggested at the outset, though the spectra were limited by metallic ferromagnetic artifact causing peak broadening. The second MRS performed 2 days later was non-diagnostic. The 3rd MRS performed 28 days after admission demonstrated elevated glutamine and glutamate and reduced myoinositol and choline. Follow-up MRS 3 months after discharge showed glutamine and glutamate to be within normal range, and myoinositol to be mildy depressed. The final MRS performed 5 months after discharge shows a similar reduction in myoinositol, but slightly increasing glutamine and glutamate (still within normal range). Choline was mildly decreased.
Fig. 5
Single voxel MR spectroscopy (MRS) (TR/TE msec, 1500/35). Initial exam (a; left basal ganglia voxel) shows an elevated glutamine and glutamate peak complex at 2–2.5 ppm and 3.8 ppm (Glx) and reduction of myoinositol (MI). 19 days later, similar changes were present in the same area (b), though subtle differences cannot be discerned due to ferromagnetic artifact on the first study. On the pentultimate MRS performed 3 months later, no significant glutamine or glutamate elevation was present in the left parietal white matter; however, myoinositol was mildly depressed. On the final MRS performed at 6-month follow-up over the left basal ganglia, similar changes are noted; glutamine remains well-controlled and myoinositol and choline (Cho) were mildly depressed.
5Discussion
Serial MR examinations performed shortly after symptom onset and during waxing and waning metabolic decompensation depicted the development of focal lesions in the posterolateral putamen, followed by the motor strip, SMA, and premotor cortex, and ultimately, the postcentral gyral cortex. No parenchymal restricted diffusion was captured at any point. In the context of influenza related metabolic decompensation, these lesions could reflect regional brain injury secondary to HA and its effects on the brain and/or post-infectious sequela. Although seizure-related edema could have contributed to some of the cortical signal changes, lack of lesional regression on follow-up exams reflects permanent injury.
Background signal changes in the frontoparietal white matter, claustrum, basal ganglia, pontine tegmentum, and left brachium pontis that remained stable over time were probably chronic sequeala of one or more prior HA events. Many of these signal changes were quite subtle, and given the symmetry, would be easily overlooked by readers less familiar with the age-related normal upper bounds of substructure specific signal. Hence, there is great value of a normal aged-matched brain MRI for direct comparison and contrast. Going forward, quantitative techniques using multidynamic multiecho sequences will be useful to measure absolute R1 (1/T1), R2 (1/T2), and proton density values in order to determine deviations from normal with greater precision and accuracy [13].
This particular lesional pattern has not been previously described to our knowledge. Urea cycle-related brain disease may take on variable imaging manifestations, ranging from normal to abnormal with or without a signature appearance. In early onset neonatal presentations, there are two main forms of brain involvement: diffuse (more severe) and central [14]. In the diffuse form, generalized brain edema and swelling is present culminating in herniation in inadequately treated severe metabolic crises. The central pattern involves more specific sites that may include the insular and periinsular regions, perirolandic areas, the cingulate gyrus, and basal ganglia [8, 14–16]. The thalami are often spared except in severe or prolonged metabolic decompensation, which can help to distinguish from HIE [16]. Cortical laminar necrosis often develops in the subacute phase of disease in patients with HA of sufficient severity and duration. Bireley and colleagues have postulated a locational gradient of increasing severity involving the following brain regions: insula, frontal, parietal, temporal, and occipital [9]. Although late onset OTC can present with the diffuse or central MR pattern, milder brain involvement is more common compared with early onset OTC. Several case reports have shown peculiar imaging features in some patients with OTC, including asymmetric cerebral edema mimicking thromboembolic ischemia/infarction, borderzone arterial territory cortical edema mimicking borderzone ischemia, and primary or predominant involvement of the occipital lobes with secondary visual changes [17–22]. However, these were female patients with presumed phenotypic differences. It is interesting to note that many case reports describe “normalization” of lesions following appropriate therapy. However, selected images from most of these reports depict evolutionary changes into regional atrophy with residual signal alteration representing encephalomalacia and laminar necrosis in areas of prior injury, calling into question therapy-related lesional regression proposed by some.
FA values in the frontal white matter, among other regions, have been shown to be decreased in OTC deficiency relative to normal control subjects, correlating with cognitive defects. [23] Quantitative diffusion tensor sequences revealed temporal alterations in ADC and FA values, with corresponding tractography changes from the initial to final MR scan. In most of the interrogated brain regions, ADC increased while FA decreased over time, representing progressive facilitated diffusion and diminished axonal concentrations after metabolic decompensation.
Cerebral blood flow disturbances were found in our patient on the final 3 exams, initially hypoperfusion followed by hyperperfusion. Cerebral perfusion is altered in patients with HA [24]. Though ammonia induced hypometabolism blunts cerebral blood flow, hyperperfusion may alternatively be present due to activation of the arachidonic acid cascade and nitric oxide elevation causing vasodilatation and dysautoregulation [24]. Therefore, it may be difficult to predict blood flow changes at any one point in time in patients with urea cycle disorders. Furthermore, seizure activity is another potentially confounding variable that increases brain blood flow in the acute phase. Further study is warranted regarding temporal blood flow changes in UCD patients.
With regards to the MR spectroscopy, temporal metabolic changes corresponded to the clinical picture. As expected, glutamine was elevated during HA, with corresponding myoinositol reduction, presumably reflecting osmotic buffering [11, 25]. OTC disease severity has been shown to directly correlate with glutamine and inversely correlate with myoinositol concentrations [11]. Choline was decreased, a finding that has been described in longstanding states of HA [25]. Follow-up MR spectroscopy after return to clinical baseline showed normalization of glutamine. Myoinositol remained depressed. Interpretation of temporal MRS changes were hindered by inconsistent voxel placement, including the left basal ganglia (n = 4) and left parietal white matter (n = 1). Nonetheless, generalities can be gathered from these changes in the brain over time.
6Conclusion
This prospective imaging study in a patient recovering from a HA episode demonstrates that brain metabolic aberrations may persist longer than appreciated even with normal plasma glutamine levels and well after ammonia has normalized. This is consistent with the fact that patients report continued cognitive slowing despite documented normal plasma ammonia levels. Focal lesion development in the posterolateral putamen, followed by the motor strip, SMA, premotor cortex, and ultimately, the postcentral gyral cortex and cerebral hypoperfusion evolving to hyperperfusion represent temporally specific imaging patterns not previously described. Apparent diffusion coefficient values increased while fractional anisotropy decreased in the corpus callosum, cingulum, and projectional fibers over time reflecting reduction in volume of white matter fibers. A future research question to address is the impact of an initial significant HA insult on the brain biochemistry as compared to multiple, recurrent events, and the impact on cognition and executive function.
Funding statement
The authors are grateful to the O’Malley Family Foundation for supporting this research. A.G. is also funded by NIH 5U54HD061221-17.
References
[1] | Msall M. , Batshaw M.L. , Suss R. , Brusilow S.W. , Mellits E.D. , et al., Neurologic outcome in children with inborn errors of urea synthesis. Outcome of urea-cycle enzymopathies, N Engl J Med 310: (23) ((1984) ), 1500–1505. |
[2] | Batshaw M.L. , Tuchman M. , Summar M. , Seminara J. , et al., Members of the Urea Cycle Disorders Consortium. A longitudinal study of urea cycle disorders, Mol Genet Metab 113: (1-2) ((2014) ), 127–130. |
[3] | Gropman A.L. and Batshaw M.L. , Cognitive outcome in urea cycle disorders, Mol Genet Metab (2004) ;81 Suppl 1:S58–S62. |
[4] | Felipo V. and Butterworth R.F. , Neurobiology of ammonia, Prog Neurobiol 67: (4) ((2002) ), 259–279. |
[5] | Willard-Mack C.L. , Koehler R.C. , Hirata T. , et al., Inhibition of glutamine synthetase reduces ammonia-induced astrocyte swelling in rat, Neuroscience 71: (2) ((1996) ), 589–599. |
[6] | Mamourian A.C. , du Plessis A. , Urea cycle defect: A case with MR and CT findings resembling infarct, Pediatr Radiol 21: (8) ((1991) ), 594–595. |
[7] | Connelly A. , Cross J.H. , Gadian D.G. , Hunter J.V. , Kirkham F.J. , Leonard J.V. , et al., Magnetic resonance spectroscopy shows increased brain glutamine in ornithine carbamoyl transferase deficiency, Pediatr Res 33: (1) ((1993) ), 77–81. |
[8] | Gropman A. , Brain imaging in urea cycle disorders, Mol Genet Metab ((2010) ) 100: , S20–S30. |
[9] | Bireley W.R. , Van Hove J.L. , Gallagher R.C. , Fenton L.Z. , et al., Urea cycle disorders: Brain MRI and neurological outcome, Pediatr Radiol 42: (4) ((2012) ), 455–462. doi: 10.1007/s00247-011-2253-6 |
[10] | Gropman A.L. , Shattuck K. , Prust M.J. , et al., Altered neural activation in ornithine transcarbamylase deficiency during executive cognition: An fMRI study, Hum Brain Mapp 34: (4) ((2013) ), 753–761. doi: 10.1002/hbm.21470 |
[11] | Gropman A.L. , Seltzer R.R. , Yudkoff M. , Sawyer A. , VanMeter J. , Fricke S.T. , et al., 1H MRS allows brain phenotype differentiation in sisters with late onset ornithine transcarbamylase deficiency (OTCD) and discordant clinical presentations, Mol Genet Metab 94: (1) ((2008) ), 52–60. |
[12] | Hales P.W. , Kirkham F.J. , Clark C.A. , et al., A general model to calculate the spin-lattice (T1) relaxation time of blood, accounting for haematocrit, oxygen saturation and magnetic field strength, J Cereb Blood Flow Metab 36: (2) ((2016) ), 370–374. |
[13] | Tanenbaum L.N. , Tsiouris A.J. , Johnson A.N. , et al., Synthetic MRI for Clinical Neuroimaging: Results of the Magnetic Resonance Image Compilation (MAGiC) Prospective, Multicenter, Multireader Trial, AJNR Am J Neuroradiol 38: (6) ((2017) ), 1103–1110. |
[14] | Gunz A.C. , Choong K. , Potter M. , Miller E. , et al., Magnetic resonance imaging findings and neurodevelopmental outcomes in neonates with urea-cycle defects, Int Med Case Rep J ((2013) ) 6: , 41–48. |
[15] | Takanashi J. , Barkovich A.J. , Cheng S.F. , et al., Brain MR imaging in neonatal hyperammonemic encephalopathy resulting from proximal urea cycle disorders, AJNR Am J Neuroradiol 24: (6) ((2003) ), 1184–1187. |
[16] | Barkovich J.A. , Patay Z. , Metabolic, toxic, and inflammatory brain disorders. In: A.J. Barkovich, C. Raybaud, editors. Pediatric neuroimaging. 5th ed. Philadelphia: Lippincott Williams & Wilkins; 2012. |
[17] | de Grauw T.J. , Smit L.M. , Brockstedt M. , Meijer Y. , vd Klei-von Moorsel J. , Jakobs C. , et al., Acute hemiparesis as the presenting sign in a heterozygote for ornithine transcarbamylase deficiency. Neuropediatrics. (1990) ;21(3):133–135. doi: 10.1055/s-2008-1071479 |
[18] | Snebold N.G. , Rizzo J.F. 3rd , Lessell S. , Pruett R.C. , et al., Transient visual loss in ornithine transcarbamoylase deficiency, Am J Ophthalmol 104: (4) ((1987) ), 407–412. |
[19] | Kim S.H. , Lee J.S. , Lim B.C. , et al., A female carrier of ornithine carbamoyltransferase deficiency masquerading as attention deficit-hyperactivity disorder, Brain Dev 36: (8) ((2014) ), 734–737. |
[20] | Prasun Y. , Altinok D. , Misra V.K. , et al., Ornithine transcarbamylase deficiency presenting with acute reversible cortical blindness, J Child Neurol 30: (6) ((2015) ), 782–785. |
[21] | Okanishi T. , Ito T. , Nakajima Y. , et al., Parieto-occipital encephalomalacia in neonatal hyperammonemia with ornithine transcarbamylase deficiency: A case report, Brain Dev 32: (7) ((2010) ), 567–570. |
[22] | Anderson J.M. and Brodsky M.C. , Protracted cortical visual loss in a child with ornithine transcarbamylase deficiency, J Neuroophthalmol 30: (1) ((2010) ), 99–101. |
[23] | Gropman A.L. , Gertz B. , Shattuck K. , et al., Diffusion tensor imaging detects areas of abnormal white matter microstructure in patients with partial ornithine transcarbamylase deficiency, AJNR Am J Neuroradiol 31: (9) ((2010) ), 1719–1723. |
[24] | Larsen F.S. , Cerebral blood flow in hyperammonemia: Heterogeneity and starling forces in capillaries, Metab Brain Dis 17: (4) ((2002) ), 229–235. |
[25] | Gropman A.L. , Fricke S.T. , Seltzer R.R. , et al., 1H MRS identifies symptomatic and asymptomatic subjects with partial ornithine transcarbamylase deficiency, Mol Genet Metab 95: (1-2) ((2008) ), 21–30. |

