
An automatic measurement method for the response of Caenorhabditis elegans to chemicals
Abstract
BACKGROUND:
Caenorhabditis elegans is a widely used model animal. Chemotaxis assay is one of the experiments that study the effects of different chemicals on nematodes. It is mainly used to study the effects of different chemicals on the perception behavior of nematodes. By conducting this experiment, not only can the neurotoxicity of chemicals be reflected, but also the impact of chemicals on physiological functions regulated by the nervous system, such as nematode feeding behavior and basic motor ability.
OBJECTIVE:
The experiment of detecting the response of nematode to chemicals is also a common method of chemical toxicity testing based on nematode models. In the analysis of worm tendency behavior, manual operations are generally used. Manually processing a large number of worms under a microscope is very time-consuming and labor-intensive. The current quantitative methods for nematode chemotaxis experiments are not only time-consuming and labor-intensive, but also biased in experimental results due to differences in judgment standards among experimenters. The automatic and efficient quantification method for nematode chemotaxis experiments is a very important technical difficulty in the field of nematode experiments.
METHODS:
Here, we have designed an automatic quantification method for nematode chemotaxis experiments by incorporating image acquisition and processing techniques into the nematode experiment.
RESULTS:
The experimental results show that the Pearson correlation coefficient between manual and automatic counting results is 0.978.
CONCLUSION:
This proves the effectiveness of our method. Applying the automatic measurement method to replace manual counting by the experimenter can improve work efficiency, and reduce errors in human counting operations.
1.Introduction
Caenorhabditis elegans is a model animal with many applications [1, 2]. It is small in size, about 1 millimeter in length, and easy to cultivate. The average lifespan of common Caenorhabditis elegans cultured at 20∘C in the laboratory is about two or three weeks, and the development time is about three days. In 1974, Brenner chose to use Caenorhabditis elegans as a model organism to study development and neuroscience [3]. Now it is an important model organism in research fields such as aging and development [4, 5, 6].
In worm behavior analysis, manual operations are generally used. Manually processing a large number of worms under a microscope is very time-consuming and labor-intensive [7, 8]. Many high-throughput screening tasks using nematodes involve image acquisition and processing [9]. The image data produced in high-throughput screening experiments far exceeds the ability of manual inspection and analysis, making it necessary for researchers to rely on image processing technology [10, 11, 12]. The purpose of image processing in biological experiments is to utilize advanced computer science and analytical methods to process large-scale biological image data, thereby providing assistance in solving biological problems. Through experimental image and video processing, a large number of quantifiable phenotypes can be quickly and efficiently obtained. It can provide more quantitative phenotypes besides survival rate. These phenotypes can be used for chemical toxicity assessment [13, 14] and aging related research [6]. Compared with other model animals, the cultivation and experimental costs of nematodes are relatively lower. This has led to many applications of nematodes in the pre assessment of chemical toxicity [15, 16, 17].
Nematodes exhibit different responses to different odors, such as attraction and aversion. The response of nematodes to chemicals is called chemotaxis. Chemotaxis can enable worms to escape from environments that are toxic and harmful to themselves and stay in favorable environments. Experiments have shown that lactic acid bacteria have a strong attraction to nematodes [18]. Yoshida’s studies show that the odor concentration-dependent behavior is primarily generated by klinokinesis, a behavioral strategy in C. elegans [19]. Experiments that study the effects of different chemicals on nematodes are called chemotaxis experiments. It is used to study the effects of different chemicals on the perception behavior of nematodes. By conducting this experiment, not only can the neurotoxicity of chemicals be reflected, but also the impact of chemicals on physiological functions regulated by the nervous system, such as nematode feeding behavior and basic motor ability. The experiment of detecting tendency is a common method of chemical toxicity testing based on nematode models. In our previous study, we used the chemotaxis tests to explore the correlation between chemical toxicity grade and nematode chemotactic index, as well as 24 h LC50 of C. elegans. However, the current quantitative methods for the response of nematode to chemicals are not only time-consuming and labor-intensive, but also biased in experimental results due to differences in judgment standards among experimenters.
The automatic and efficient quantification method for nematode chemotaxis experiments is a very important technical difficulty in the field of nematode experiments. We have designed an automatic quantification method for nematode chemotaxis experiments by incorporating image acquisition and processing techniques into the nematode experiment. Compared with existing methods, our method combines experimental image automatic processing technology. This greatly saves the workload of experimental operations.
2.Methods
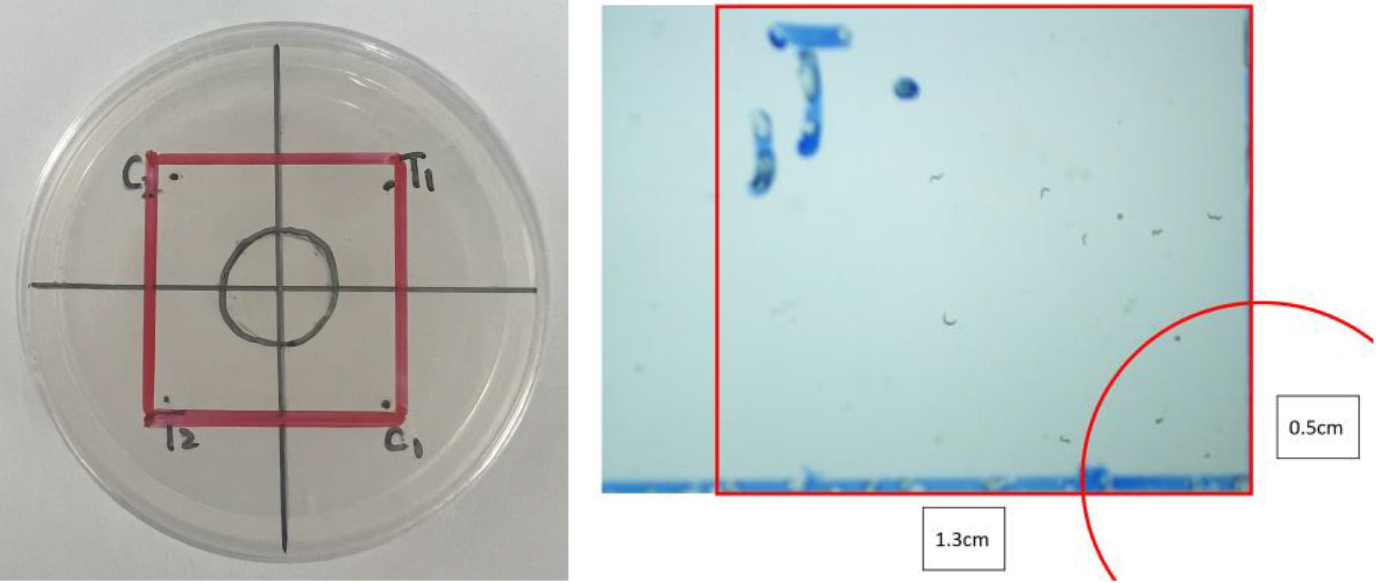
In order to facilitate and quickly detect the tendency of nematodes towards chemicals, we have designed corresponding experimental devices and automatic quantification methods. As shown in Fig. 1, we divided different regions on the Nematode Growth Medium (NGM) of model organism nematode, and added volatile chemicals attractive to nematode in some regions. Then place the nematodes in the designated area of the prepared culture medium. We observed and captured experimental images of freely moving nematodes in the culture medium. To ensure inter-group consistency, we observed and captured the number of free-moving nematodes within a square area with a side length of 1.3 cm on each experimental image. We automatically processed the experimental images by designed image processing method and obtained the number of nematodes residing in different areas to analyze the attractiveness of different chemicals to nematodes and the effects of different chemicals on their neural sensing system.
Figure 1.
Examples of division of different areas in a NGM plate, examples of images taken and descriptions of each part of the image.
The specific techniques and steps of this method are as follows.
2.1Division of experimental areas
The NGM medium of Model organism nematode was divided into different regions and volatile chemicals were added in different regions. The method of regional division referred to the methods designed in other studies [20, 21]. First, we draw a circle with a diameter of 1 cm in the center of the NGM plate. Then divide the whole NGM plate into four quadrants on average, and draw a point 1.5 cm away from the center of NGM plate in each quadrant. Mark the two quadrants opposite each other with “T” (T1 and T2, respectively) and “C” (C1 and C2, respectively). Add volatile chemicals in the area marked “T”, and add solvent (water) as the control group in the area marked “C”. Figure 1 shows an example of the division of different areas in a nematode NGM plate.
2.2Placement of nematodes and experimental image shooting
Place approximately 50–100 chemically treated nematode adults in the center of the measurement board. After being placed in dark for 1 hour, experimental images were taken on the tablet for automatic identification and analysis of the number of nematodes in each quadrant. Considering that some chemicals cause nematodes to lose their mobility, nematodes within a 1 cm circle near the center are not counted. Take an image for each quadrant, which is a 24-bit RGB image with 800 * 600 pixels. Figure 2 shows an example of the captured image, as well as the size, location, and explanation of each region that needs to be identified from the image.
Figure 2.
The left panel is an example of the results of automatically identifying different regions in the captured experimental image; The right panel is an example of the results of identifying nematodes from experimental images.

2.3Parameters of microscope and camera
The microscope used to take the pictures is OLYMPUS MVX 10. The microscope’s camera is the OLYMPUS DP73, and lens are the OLYMPUS MV PLALO 1X and MVX-TV0.63XC.
2.4Preparation of nematodes
The wild-type (N2) Caenorhabditis elegans and Escherichia coli (OP50) were both purchased from Caenorhabditis Genetics Center (CGC). Wild-type (N2) strain of C. elegans was cultured on NGM agar plates supplemented with E. coli OP50 at 20∘C. When the worms are gestational, rinse them into a 15 ml centrifuge tube with S-basal. After the nematode precipitation, discard the supernatant, then dissolve with Bleach solution, centrifuge at 20∘C for 3 minutes to obtain eggs. The eggs were cultivated in S-basal solution in 15 ml centrifuge tube flatly on a shaking bed at 20∘C and 100 rpm overnight to obtain L1-stage nematodes. The L1 stage nematodes were dropped on the NGM plate covered with bacteria and cultured for about 40 hours. When they were at L4 stage, the nematodes were washed with K-medium solution into a 50 ml centrifuge tube. The nematodes were washed immediately with 20 ml K-medium solution for three times. The number of nematodes was adjusted under stereomicroscope, so that the density of nematodes was about 50 per 20
2.5The used chemicals and concentrations
The drug used to attract nematodes are butane-2,3-dione (1% v/v, CAS: 431-03-8) and pentanal (0.1%, 1% and 10% v/v, CAS: 110-62-3). The substance used to treat nematodes is 0.32 mg/mL cadmium chloride (2
2.6Chemical treatment
In a 24-well plate, about 250 L4 stage worms (100
2.7Experimental image preprocessing
Smooth, denoise, and remove uneven background brightness in different areas of the image, and then perform image segmentation.
2.8Experimental image processing steps
Identify the actual experimental areas that need to be analyzed from the experimental images: To meet the needs of the experimental design itself, first identify the right square area in each image. Then, it is necessary to identify the fan-shaped area in the lower right corner within the square area, in order to count the nematodes located in different areas separately. Figure 2 shows an example of the results of automatically identifying different regions in the captured experimental images using our automatic processing method. The black and white regions correspond to the right square region in Fig. 1, and the white region in the lower right corner corresponds to the inner region of the center circle in Fig. 1. This counting method can also bring the following advantages: nematodes crawl from the center as the origin, from the fan-shaped area to the marked points with volatile substances, and stay near the marked points. We delineate a square area with cross markings as the boundary and only calculate the nematodes within the square area to ensure standardization of counting. At the same time, calculating the nematodes in the different areas separately can further identify nematodes that die or have impaired mobility due to chemical toxicity and cannot crawl.
2.9Automatic identification and counting of nematodes
Nematode recognition is performed on the segmented image to automatically process the experimental image and automatically quantify the number of nematodes: (1) The actual nematodes in the foreground object are recognized by the size, shape, length, width and aspect ratio of the foreground object obtained from image segmentation; (2) During the experiment, the fan-shaped area in the lower right corner of each image is the area within a circle near the previously designated center. The nematodes inside and other experimental areas except for the fan-shaped area are automatically recognized and counted by the program. Figure 2 shows an example of the results of identifying nematodes from experimental images. By combining the identified nematodes with the regions identified in Fig. 2, the number of nematodes in different regions can be obtained.
2.10Automatically calculate the trend index of nematodes
We define the response of nematodes to chemicals as a trend index. The definition of this indicator refers to methods designed in other studies [20, 21]. Calculate the trend index automatically based on the number of nematodes in different regions: trend index (TI)
2.11Determination of nematode trend index results
TI
3.Results
We conducted experiments on multiple chemicals. And we use the designed automated analysis methods to quantify and study the nematode tendency index in different experiments.
3.1Automatic identification and counting results of nematodes
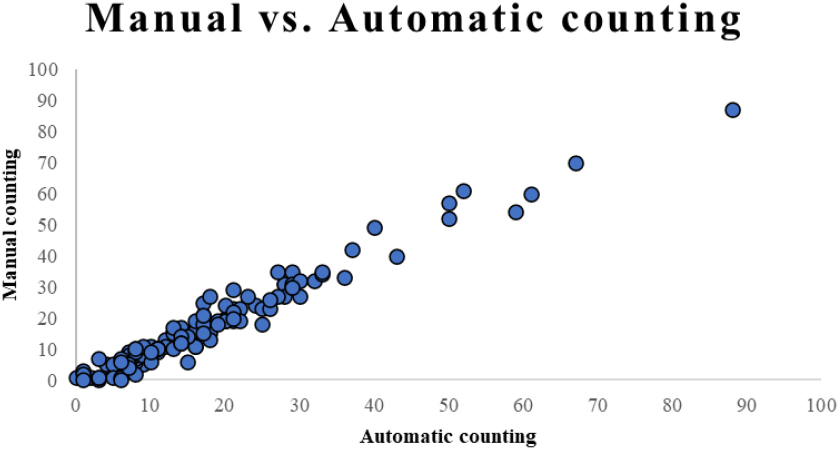
The comparison between the results of automatic program counting and manual counting by the experimenter is shown in Fig. 3. From the figure, it can be seen that the results of automatic identification and quantitative counting of nematodes are very close to those of manual counting, achieving good results in automatic identification and quantitative counting of nematodes. The Pearson correlation coefficient between manual and automatic counting results is 0.978 (
Figure 3.
Comparison of results between program automatic counting and manual counting by experimenters.
3.2Automatic quantification and research of trend index
We used different concentrations of pentanal and Butane-2,3-dione to test their attractiveness to nematodes. In addition, we also used low concentration of Cadmium chloride to treat the nematode, and observed whether the sensory ability of the nematode was affected.
Figure 4.
The results of attractiveness of different chemicals to nematodes. A–C: Different concentrations of pentanal have different attractiveness to nematodes; D: Nematodes are more sensitive to butane-2,3-dione; E: The nematodes pretreated with cadmium chloride showed a decrease in sensitivity to butane-2,3-dione.
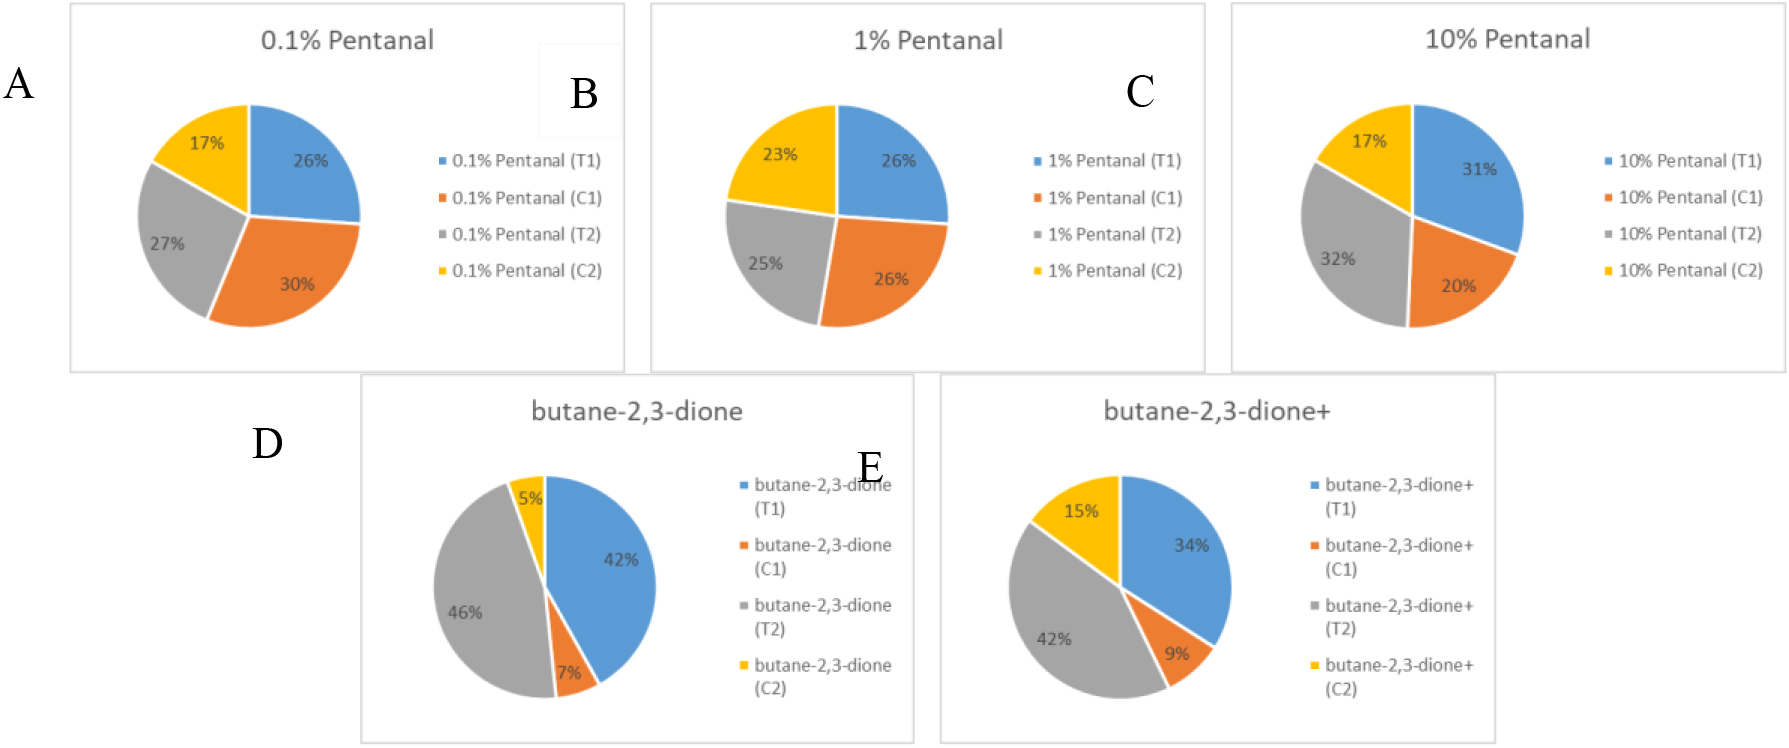
Figure 5.
Calculation results of TI index for different chemicals.
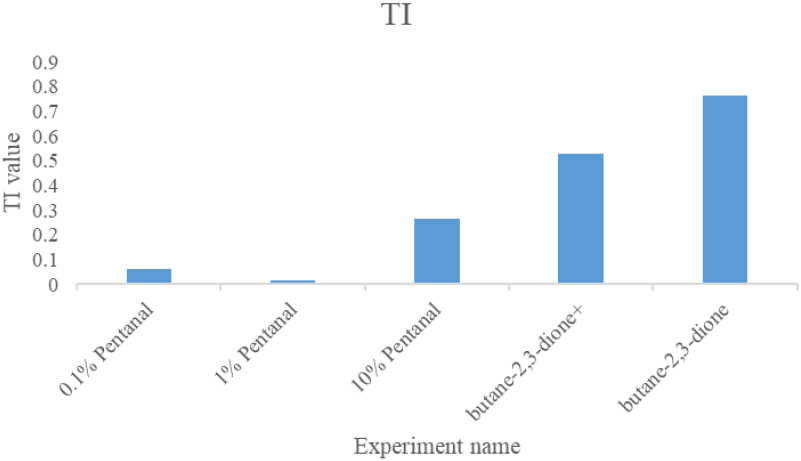
Figure 4 shows the results of automatic counting of nematodes under different experimental conditions. The areas marked by T1 and T2 are areas where chemicals have been added. The areas marked by C1 and C2 are the areas with water added as the control group. These percentages on each pie chart represent the distribution of nematodes under each given experimental condition. From the figure, we can see that low concentrations of pentanal have very little attraction to nematodes. But when the concentration of pentanal reaches 10%, the attraction to nematodes becomes high, and most nematodes tend to crawl towards the position where pentanal is located.
Cadmium chloride has certain neurotoxicity to nematode. We treated nematodes with low concentration of Cadmium chloride and observed whether their sensitivity to chemicals was affected. We tested the nematode’s ability to sense butane-2,3-dione. ‘Butane-2,3-dione
The tendency of nematodes towards chemicals can be measured using quantitative indicators. The calculation formula for the index of nematode tendency towards chemicals is as follows.
(1)
T1, T2, C1, and C2 represent the number of nematodes that remain in these areas, respectively. TI
Figure 5 shows the quantitative results of nematode tendency index under different experimental conditions. The chemicals used have a certain attraction to nematodes. When the concentration is low, pentanal has little attraction to nematodes. When the concentration reaches 10%, pentanal’s attraction to nematodes increases. Butane-2,3-dione has great attraction to nematodes. Although Cadmium chloride has weakened the perception ability of nematodes to a certain extent, the concentration used is very low, so it does not completely destroy the perception ability of nematodes. From the figure, it can be seen that the de tendency index of nematodes in the ‘Butane 2,3-dione
4.Discussion and conclusion
Conducting experiments on different chemicals and testing their attractiveness and impact on nematodes is a huge task. The previous studies mainly relied on manual counting [20, 21, 22]. At the same time, in the existing method, in order to ensure the consistency of the movement time of nematodes in the same batch, sodium azide is added. The use of this anesthetic can cause damage to nematodes and even lead to death of nematodes. In our experimental method, the distribution of nematodes in different regions on multiple plates under the same exposure period can be quickly obtained without sodium azide by means of microscope image acquisition technology. After the experiment, nematodes can be transferred to ordinary NGM plates for further culture and observation. Additionally, it is difficult to complete such a difficult task solely relying on manual operation. In our previous experiments, we measured the chemotactic index of 21 chemicals, each chemical set 4 concentration gradients, each concentration gradient has 4 parallel, which makes manual counting difficult. The main differences between our method and existing methods are as follows. The first difference is that the existing methods mainly use young adult stage nematodes, while we use L4 stage nematodes that are more sensitive to substance toxicity. The second difference is that butanedione is used as an attractant in the literature. We tested different concentrations of pentanal as an attractant and confirmed through experiments that 10% of pentanal can be used as an attractant. The third difference is that the method used in the literature for nematode statistics involves counting all nematodes on the culture dish. However, we designated a square area with a side length of 1.3 cm as the counting area, which improved inter group consistency. The fourth difference is that the method in literature uses sodium azide as an anesthetic and manually counts the number of nematodes. However, we use a method of capturing images under the microscope and automatically analyzing them through image processing algorithms to eliminate errors caused by manual counting and the use of anesthetics, as well as differences in the timing of the experimenter’s counting between different repetition groups.
Designing automated phenotypic quantification and behavioral analysis methods can improve the efficiency of data analysis and reduce the repetitive physical labor of experimenters. The trend index of model organism nematode is a useful quantitative index. It can reflect the impact of chemicals with different levels of toxicity on the perception and behavior of nematodes, and to some extent, it can also reflect the feeding ability, exercise activity, health status, aging degree, and so on of nematodes. However, the counting work of current experiments using nematodes is not only time-consuming and labor-intensive, but also biased due to differences in judgment standards among experimenters. There is currently no automatic quantification method for trend indices. Automatic and efficient quantification of nematode behavior to chemicals is a very important technical challenge in the field of nematode experiments. We have designed an automatic quantification method for nematode tendency behavior by incorporating experimental image acquisition and processing techniques into the worm experiment. This method will provide assistance for conducting toxicological experiments using nematodes and study the response of nematodes to different chemicals.
Acknowledgments
This work was supported by the National Key Research and Development Program of China (No. 2019YFC1604901) and the Talent Development Plan for High-level Public Health Technical Personnel Project (Leading Talents-02-03 Project of Beijing).
Conflict of interest
None to report.
References
[1] | Wilson IBH, Paschinger K, Cummings RD, Aebi M. Nematoda. (2022) . |
[2] | Ha NM, Tran SH, Shim Y-H, Kang K. Caenorhabditis elegans as a powerful tool in natural product bioactivity research. Appl Biol Chem. (2022) ; 65: : 18. |
[3] | Brenner S. The genetics of caenorhabditis elegans. Genetics. (1974) ; 77: : 71-94. |
[4] | Bairakdar MD, Tewari A, Truttmann MC. A meta-analysis of RNA-Seq studies to identify novel genes that regulate aging. Exp Gerontol. (2023) ; 173: : 112107. |
[5] | Parish AJ, Swindell WR. Metformin has heterogeneous effects on model organism lifespans and is beneficial when started at an early age in Caenorhabditis elegans: A systematic review and meta-analysis. Aging Cell. (2022) ; 21: : e13733. |
[6] | Xian B, Shen J, Chen W, Sun N, Qiao N, Jiang D, et al. WormFarm: A quantitative control and measurement device toward automated Caenorhabditis elegans aging analysis. Aging Cell. (2013) ; 12: : 398-409. |
[7] | Goodman MB, Klein M, Lasse S, Luo L, Mori I, Samuel A, et al. Thermotaxis navigation behavior. WormBook. (2014) ; 1-10. |
[8] | Hart AC, Chao MY. From Odors to Behaviors in Caenorhabditis elegans. (2010) . |
[9] | Chen W, Liao B, Li W, Dong X, Flavel M, Jois M, et al. Segmenting microscopy images of multi-well plates based on image contrast. Microsc Microanal. (2017) ; 23: : 932-7. |
[10] | Zhang H, Gao S, Chen W. Automated recognition and analysis of head thrashes behavior in C. elegans. BMC Bioinformatics. (2022) ; 23: : 87. |
[11] | Zhang H, Chen W. Automated recognition and analysis of body bending behavior in C. elegans. BMC Bioinformatics. (2023) ; 24: : 175. |
[12] | Zhang N, Zhang W, Wang M, Li G, Ning J, Nie Y, et al. An automatic recognition method of nematode survival rate based on bright field and dark field experimental images. Technol Health Care. (2023) ; 31: : 199-208. |
[13] | Gao S, Chen W, Zhang N, Xu C, Jing H, Zhang W, et al. A High-throughput Assay for the Prediction of Chemical Toxicity by Automated Phenotypic Profiling of Caenorhabditis elegans. JoVE. (2019) ; e59082. |
[14] | Gao S, Chen W, Zeng Y, Jing H, Zhang N, Flavel M, et al. Classification and prediction of toxicity of chemicals using an automated phenotypic profiling of Caenorhabditis elegans. BMC Pharmacol Toxicol. (2018) ; 19: : 18. |
[15] | Chen H, Wang C, Li H, Ma R, Yu Z, Li L, et al. A review of toxicity induced by persistent organic pollutants (POPs) and endocrine-disrupting chemicals (EDCs) in the nematode Caenorhabditis elegans. J Environ Manage. (2019) ; 237: : 519-25. |
[16] | Li H, Li H, Zuo N, Liu Y, Lang D, Steinberg C, et al. Direct toxicity of environmentally persistent free radicals to nematode Caenorhabditis elegans after excluding the concomitant chemicals. Sci Total Environ. (2022) ; 839: : 156226. |
[17] | Queirós L, Marques C, Pereira JL, Gonçalves FJM, Aschner M, Pereira P. Overview of chemotaxis behavior assays in caenorhabditis elegans. Curr Protoc. (2021) ; 1: : e120. |
[18] | Choi JI, Yoon K-H, Subbammal Kalichamy S, Yoon S-S, Il Lee J. A natural odor attraction between lactic acid bacteria and the nematode Caenorhabditis elegans. ISME J. (2016) ; 10: : 558-67. |
[19] | Yoshida K, Hirotsu T, Tagawa T, Oda S, Wakabayashi T, Iino Y, et al. Odour concentration-dependent olfactory preference change in C. elegans. Nat Commun. (2012) ; 3: : 739. |
[20] | Thompson M, Sarabia Feria N, Yoshioka A, Tu E, Civitci F, Estes S, et al. A Caenorhabditis elegans behavioral assay distinguishes early stage prostate cancer patient urine from controls. Biol Open. (2021) ; 10. |
[21] | Margie O, Palmer C, Chin-Sang I. C. elegans chemotaxis assay. J Vis Exp. (2013) ; e50069. |
[22] | Lee J, Jee C, McIntire SL. Ethanol preference in C. elegans. Genes Brain Behav. (2009) ; 8: : 578-85. |


