
Myocardial ischemia simulation based on a multi-scale heart electrophysiology model
Abstract
BACKGROUND:
Myocardial ischemia, caused by insufficient myocardial blood supply, is a leading cause of human death worldwide. Therefore, it is crucial to prioritize the prevention and treatment of this condition. Mathematical modeling is a powerful technique for studying heart diseases.
OBJECTIVE:
The aim of this study was to discuss the quantitative relationship between extracellular potassium concentration and the degree of myocardial ischemia directly related to it.
METHODS:
A human cardiac electrophysiological multiscale model was developed to calculate action potentials of all cells simultaneously, enhancing efficiency over traditional reaction-diffusion models.
RESULTS:
Contrary to the commonly held view that myocardial ischemia is caused by an increase in extracellular potassium concentration, our simulation results indicate that level 1 ischemia is associated with a decrease in extracellular potassium concentration.
CONCLUSION:
This unusual finding provides a new perspective on the mechanisms underlying myocardial ischemia and has the potential to lead to the development of new diagnostic and treatment strategies.
1.Introduction
Myocardial ischemia, the leading cause of death worldwide according to the World Health Organization (WHO) [1], significantly affects the normal functioning of the heart due to the occurrence of myocardial ischemia and hypoxia. In clinical practice, electrocardiography (ECG) is widely used to diagnose and monitor various cardiovascular diseases, including arrhythmias, ischemia, and myocardial infarction [2, 3]. Abnormal ECG manifestations of myocardial ischemia are classified into three grades [2, 3]: Grade 1 ischemia (G1I) shows T wave changes, Grade 2 ischemia (G2I) exhibits ST segment changes, and Grade 3 ischemia (G3I) displays terminal QRS distortions. The severity of ischemia increases with the higher grades. The T wave to R wave amplitude ratio and the Q wave and S wave cut-off values are essential indicators to evaluate the normalcy of T waves and ST segments in ECG. The ECG changes resulting from myocardial ischemia hold significant clinical value in terms of early diagnosis, treatment guidance, and prognosis assessment.
Over the past few decades, mathematical models have been extensively applied in the study of cardiac electrophysiology [4]. There has been much progress in the study of the underlying mechanisms of myocardial ischemia. Researchers have explored potential causes of myocardial ischemia using established cell models such as LR91 [5], TNNP06 [6], and Ord [7]. They have demonstrated that hyperkalemia, acidosis, and hypoxia [8, 9] are biochemical factors that contribute to ischemic changes observed on ECG. Through investigation, researchers have found that myocardial ischemia leads to a reduction in inter-cellular electrical coupling [10], an increase in inter-cellular electrical heterogeneity [8], and a slowing down of intertissued conduction [11] in surrounding tissues. These abnormal changes may result in phenomena such as superconductivity, inhibition of conduction, and conduction blocking [12, 13]. Researchers have used multi-scale heart electrophysiological models to simulate Electrocardiographs that are consistent with clinical ischemic Electrocardiographs [14]. They were able to simulate elevation or depression of ST-segments [15] and terminal QRS distortion [16] in areas [17] where myocardial ischemia occurred, as well as the degree of myocardial ischemia [11, 18].
Previous studies on the leading pathological causes of myocardial ischaemia [8, 9, 15, 19] have shown that, in contrast to acidosis and hypoxia, hyperkalaemia is a decisive factor affecting the performance of myocardial ischemia on the ECG. This is because hyperkalemia reduces the ability of sodium ion channels to pass through the cell membrane and the potassium equilibrium potential. This leads to changes in the action potential and decreased excitability of myocardial cells. The changes in the action potential can be transmitted to the body surface via fluid conduction and recorded by ECG. Therefore, changes in the action potential of cells can cause corresponding ECG changes. However, there is no quantitative analysis of the relationship between extracellular potassium concentration ([K + ]o) and the grade of myocardial ischemia.
The goal of the present study is to explore the relationship between [K + ]o and ECG ischaemic grade. A multi-scale heart electrophysiological model was established. Using this model, we simulated action potentials and Electrocardiographs under various [K + ]o conditions and analyzed the relationship between [K + ]o and the grade of myocardial ischemia based on established clinical diagnostic criteria.
2.Method
2.1The algorithm of multi-scale heart electrophysiological modelling
This study utilized a multi-scale cardiac electrophysiological model to simulate abnormal ECG resulting from myocardial ischemia. The multi-scale model comprises cell-scale, tissue-scale, and torso-scale models [20].
2.1.1The cellular-scale model
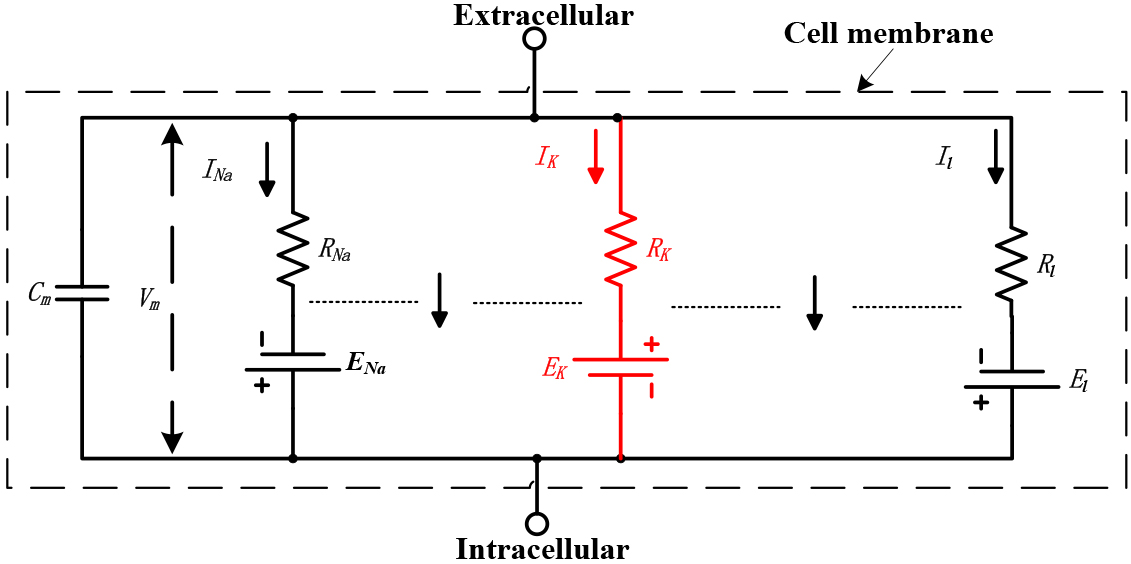
The electrical circuit, as shown in Fig. 1, represents the physical structure of the electrophysiological model of the myocardial membrane [21]. The ionic current in the myocardial membrane is determined by the driving force, which can be measured as an electrical potential difference, and a permeability coefficient with the dimensions of a conductance. The equation of the potassium ion channel of the cell membrane is
(1)
Figure 1.
The equivalent circuit of the cell membrane. All values are constant except for
Where,
Ion channels enable the movement of ions between the cell’s interior and exterior, causing alterations in the potential difference across the cell membrane. The homogenized equation of the ion exchange [21] of the cell membrane is
(2)
Where,
The atrial myocyte model used in this article is the CRN model [22]. The total membrane ionic current of the CRN model is given by
(3)
The ventricle myocyte model used in this article is the ORd model [7]. Endo, M and Epi are three sub-models of the ORd model that differ in their membrane conductances. The total membrane ionic current of the CRN model is given by
(4)
Where,
2.1.2The tissue-scale model
The cardiac tissue electrophysiological model can simulate the propagation of action potentials among different regions of the tissue. A new tissue model was developed based on the existing one [23]. This new model includes the heart’s four-chamber structure, different types of cardiomyocytes, and an algorithm for action potential propagation.
Figure 2.
Simplified two-dimensional cross-sectional structure of the heart, with non-cardiomyocytes occupying the white part and cardiomyocytes in the colored part. Each integer coordinate (
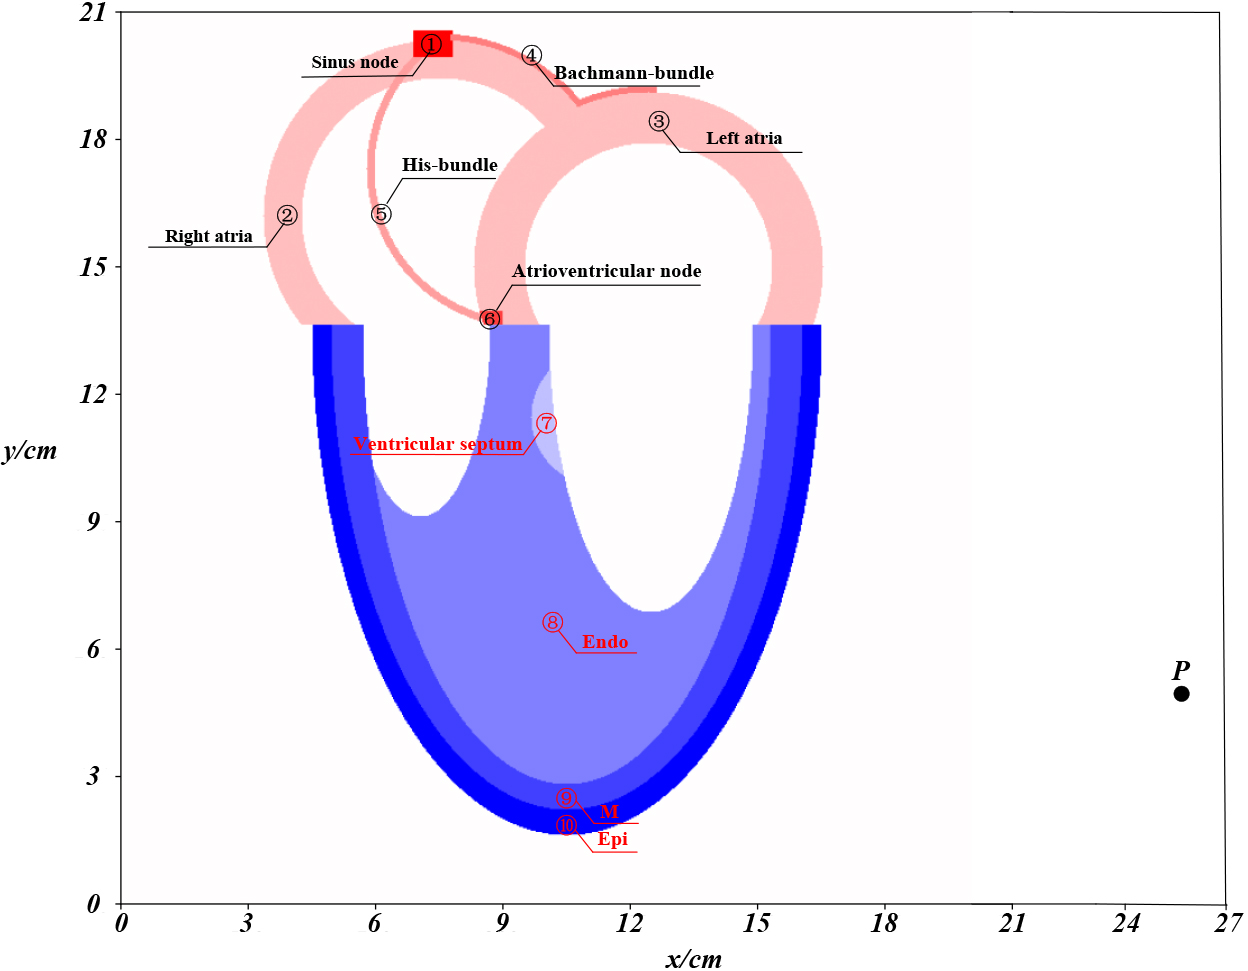
The four-chamber structure in Fig. 2 represents the frontal view of the heart [24] and contains a total of 103,786 cardiomyocytes, divided into ten different types.
The chosen AP propagation algorithm in this study is the cellular automaton (CA) [25]. In this model, the individual cells serve as the fundamental units of the system, and their states evolve in a spatially distributed manner over time according to the locally defined rules [26]. The AP propagation algorithm is given by
(5)
Where,
2.1.3The torso-scale model
The aim of the troso-scale model is to calculate the electric potential at a specific location on the surface of the body, which is then represented as a time series known ECG. The unipolar electrogram is a simplified model of ECG computation wich assumes that the human body is a conductor with a constant conductivity [26]. It is based on the concept that the electrical potential difference between a single point on the body surface and a virtual point at the center of the heart is proportional to the activation wavefront of the heart. The model utilizes only one electrode, denoted as
(6)
Where
2.1.4The model for the multi-scale heart electrophysiological model
After developing models at the cellular, tissue, and torso scales, they were integrated to form a multiscale cardiac electrophysiological model. This model establishes a connection between ECG signals and the electrical activity of myocardial cells. The multi-scale heart electrophysiological modelling algorithm can be broken down into four steps: parameter initialization, computation of the four action potentials, simulation of action potential propagation, and computation of virtual electrocardiogram.
1) Parameters initialization.
The main parameters of the computational models such as Table 1.
Table 1
The main parameters
| Parameters | Value |
| Parameters of cell-scale model | |
| CL: Action potential duration of the cell | 500 ms |
| Nao: Extracellular sodion concentration | 140 mM |
| Cao: Extracellular calcium concentration | 1.8 mM |
| Ko: Extracellular potassium concentration | 5.4 mM |
| Paramaters of tissue-scale model | |
| Moore_SN: Moore radius of sinus node cells | 0.05 m |
| Moore_Atr: Moore radius of left and right atrial cells | 1 m |
| Moore_BB: Moore radius of Bachmann-bundle cells | 1.7 m |
| Moore_HB: Moore radius of His-bundle cells | 1.7 m |
| Moore_AVN: Moore radius of atrioventricular node cells | 0.05 m |
| Moore_VS: Moore radius of ventricular septum cells | 1 m |
| Moore_Endo: Moore radius of Endo cells | 4 m |
| Moore_M: Moore radius of M cells | 1.5 m |
| Moore_Epi: Moore radius of Epi cells | 1 m |
| | 2 pieces |
| T_VP: Ventricular septum activation time | 190 ms |
| Parameters of torso-scale model | |
| P: Coordinates of the virtual electrode | [26 cm, 5 cm] |
| | 0.74 S |
| | 1.28 S |
| | 100 |
| Cells: A coordinate set of all cardiomyocytes | Coloured in Fig. 3b |
| HB_Period: Duration of a single heartbeat | 700 ms |
2) Computation of the four action potentials.
We stimulated the CRN and the ORd models with an external current of
3) Simulation of the AP propagation.
To simulate the propagation of action potentials (AP), two three-dimensional matrices are defined: State [t, x, y] and MP [t, x, y]. The State matrix represents the cell states at time t, and the MP matrix reflects the membrane potential of each cell at time t. These matrices are initialized as a zero matrix. Over time, they are updated to simulate the propagation of the AP through the tissue. The initial value of
4) Computation of virtual ECG.
Since an ECG is essentially a time series, the sequence Virtual_ECG is represented by [
2.2The simulation for ventricular ischaemia
It is widely accepted that the extent and location of myocardialare closely related to the ischemic grade of an ECG [11, 17, 18]. With this understanding, we aim to adjust [
Table 2
The Relationship between AR_TR, CV_SQ and the shape of ECG
| Shapes of ECG | CV_SQ/mV | AR_TR |
|---|---|---|
| Normal | 0.1 | |
| T wave elevation |
| |
| T wave depression |
| 0 |
| T wave inversion |
| |
| ST-segment elevation |
| |
| ST-segment depression |
| |
| Terminal QRS distortion |
| Nonexistent |
To simulate the three stages in the exacerbation process of Epi ischaemia and Endo ischaemia, we carefully selected the appropriate Epi_Ko and Endo_Ko. These concentrations were chosen through a rigorous process and were used in the multi-scale model, along with other parameters set as described in Table 1.
3.Results
3.1Normal model
Using the algorithm of multi-scale heart electrophysiological modeling, we performed simulations to capture the occurrence and propagation of AP, as well as the corresponding virtual ECG.
Figure 3.
The simulation of normal conditions. (a) Four action potentials; (b) AP propagation in the heart; (c) virtual ECG.
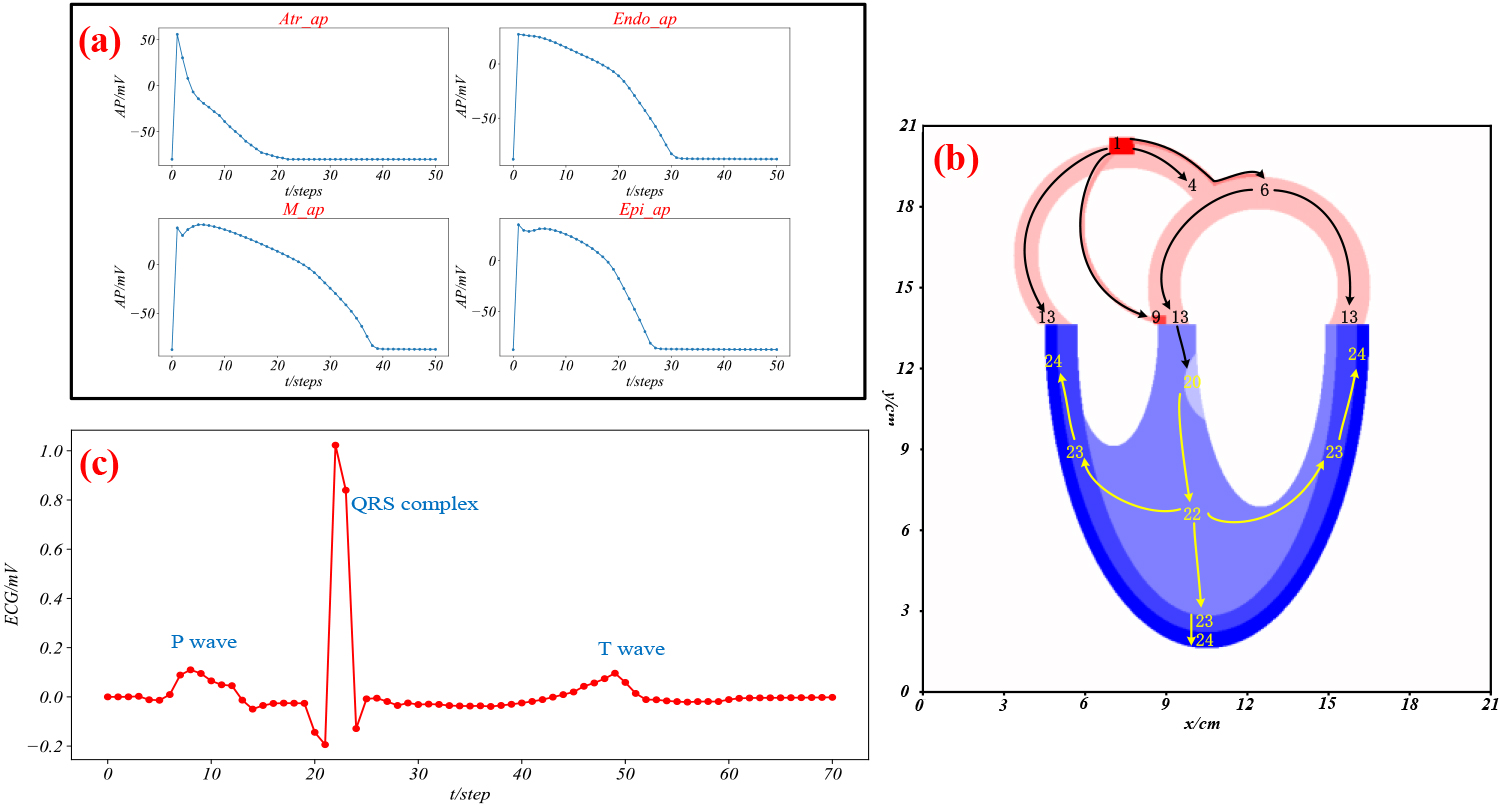
Figure 3a represents the action potentials generated in the atrium, Endo, M, and Epi when stimulated. Figure 3b illustrates the spatiotemporal dynamics of the AP propagation, where the arrows represent the direction of propagation, and the numbers indicate the time in steps when the cells at that location start to depolarize in a single heartbeat cycle. Figure 3c shows a simulated ECG in lead V6, exhibiting P, QRS, and T waves.
3.2Ventricular ischemia
Next, we simulated the action potentials and ECG of ventricular ischemia by adjusting the values of Epi_Ko or Endo_Ko. The results are shown in Fig. 4.
Figure 4a displays the trends of Epi_AP and ECG for different values of Epi_Ko.
As Epi_Ko increases from 3.3 to 11.0, APD90 decreases, RP increases, CV_SQ and AV_TR increase. The duration of Epi_AP shortens, resting potential of Epi_AP elevates, and ST-T of ECG elevates. As Epi_Ko increases from 3.3 to 11.0, the 90% repolarization time (APD90) of steps drops, RP (resting potential) increases, S wave and Q wave cutoff value (CV_SQ) and amplitude ratio of the T wave to the R wave (AV_TR) increase. The duration of Epi_AP shortens, the resting potential of Epi_AP elevates, and ST-T of ECG elevates. However, when Epi_Ko equals 11.1, there is a significant decrease in APD90 and PP, an increase in CV_SQ, and AV_TR becomes non-existent. The Epi_AP depolarization potential decreases, and ECG shows elevated ST-segment and terminal QRS. As Epi_Ko increases from 11.1 to 12.0, the APD90 shortens, PP decreases, CV_SQ slowly increases, and AV_TR is non-existent. Simultaneously, the ST-segment of ECG elevates, and terminal QRS of ECG distorts. Figure 4b shows the general changes trend of Endo_AP and ECG when Endo_Ko increases from 3.3 to 12.0. The changes trend of Endo_AP is the same as that of the Epi_AP, while the changes trend of ECG is the opposite. Based on the simulation results of Epi_Ko or Endo_Ko at different values, we have summarized the ischemia grades in Table 3.
Table 3
The Relationship between Epi_Ko, Endo_Ko and the ischemia grade
| Ischemia grade | Endo_Ko/mM | Epi_Ko/mM |
|---|---|---|
| G1I | 3.3 | 5.4 |
| 5.4 | 3.3 | |
| Normal | 5.0 | 5.4 |
| 5.4 | 3.7 | |
| G2I | 7.6 | 5.4 |
| 5.4 | 6.0 | |
| G3I | 11.1 | 5.4 |
| 5.4 | 10.5 |
Figure 4.
The simulation of Ventricular ischemia. (a) Epi ischemia; (b) Endo ischemia. The arrows illustrate the general trend of changes in action potentials and ECGs when Epi_Ko and Endo_Ko range from 3.3 to 12.0. Both the AP graph and the ECG graph have the horizontal axis representing time in milliseconds (ms), and the vertical axis representing membrane potential and electrode potential in millivolts (mV), respectively. The APD90 graph and the Rp, PP graph have Epi_Ko (mM) on the horizontal axis and 90% repolarization time in steps (ms), resting potential, and peak potential (mV) on the vertical axis, respectively. The CV_SQ graph and the AV_TR graph have Epi_Ko (mM) on the horizontal axis and the cutoff value at the end of the S wave and the start of the Q wave (mV) and the amplitude ratio of the T wave to the R wave (unitless) on the vertical axis, respectively. The axes of (b) are the same as those in (a).
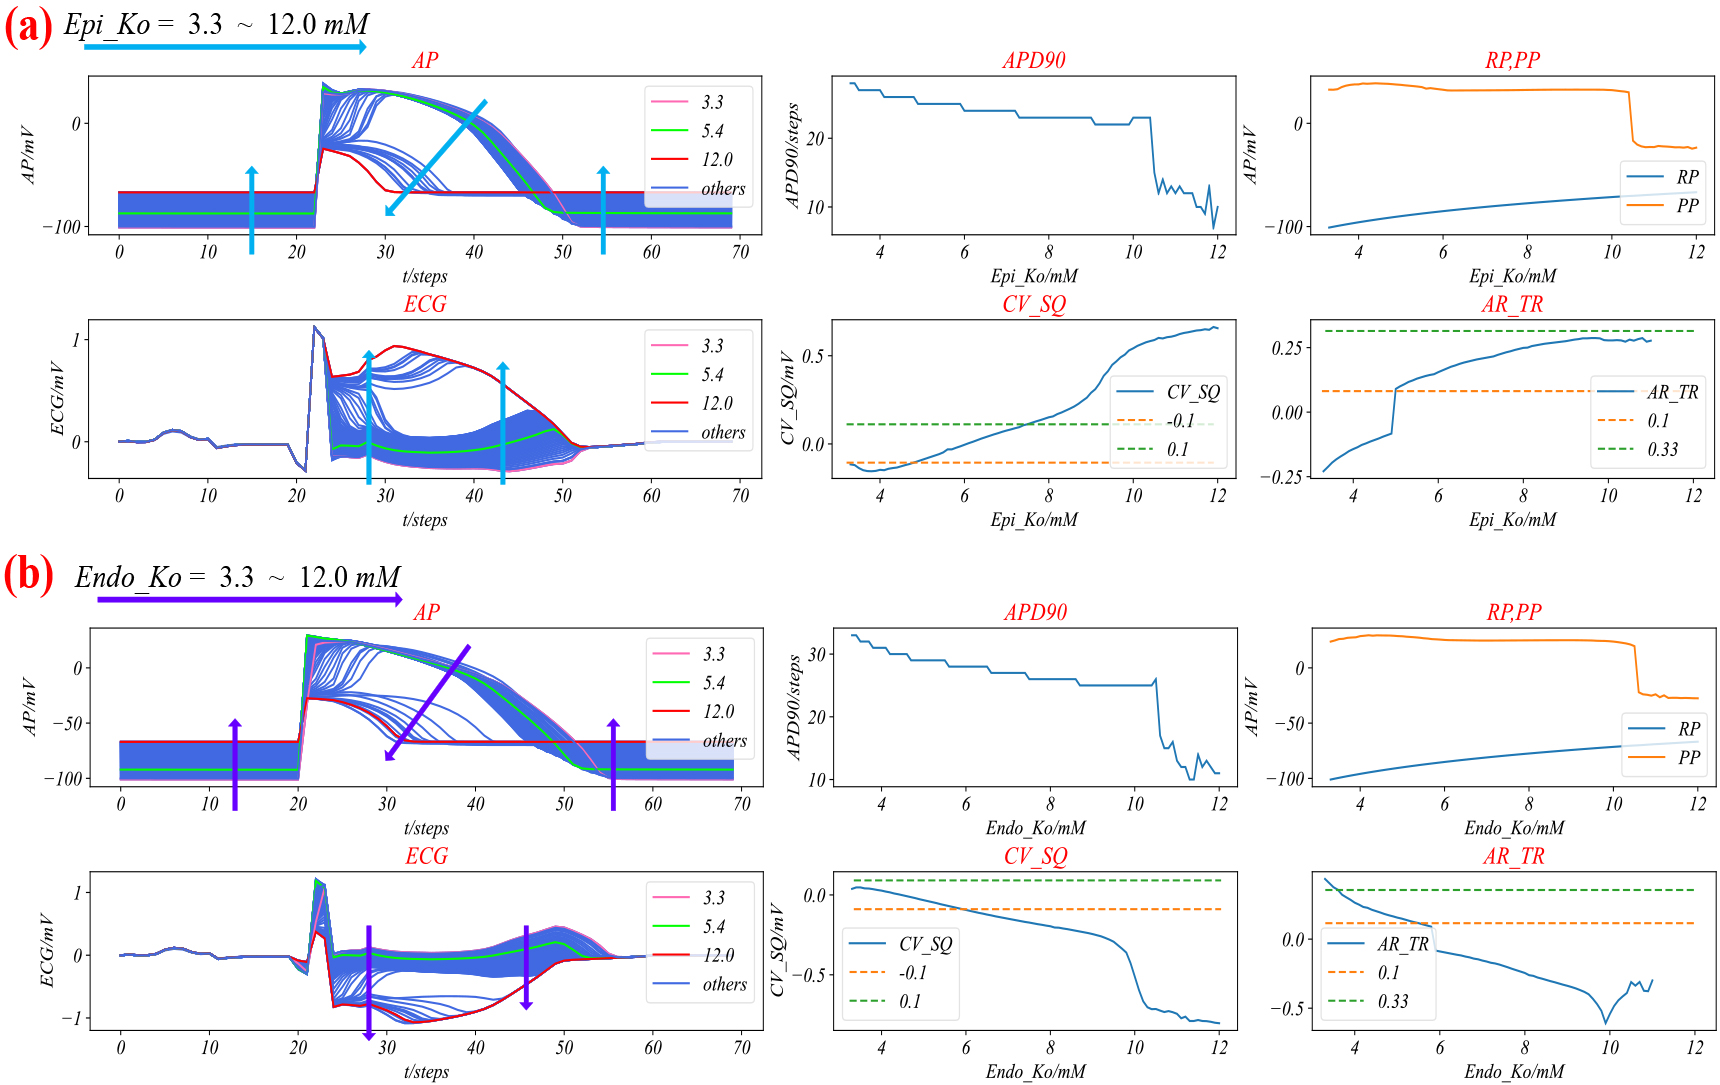
Figure 5.
Three grades of Epi or Endo ischemia. (a) Three grades of Epi ischemia, where Endo_Ko is equal to 5.4 always, and that Epi_Ko is equal to 5.4, 3.3, 8.0 and 12.0, respectively; (b) Three grades of Endo ischemia, where Epi_Ko is equal to 5.4 always, Endo_Ko is equal to 5.4, 3.3, 8.0 and 12.0, respectively.
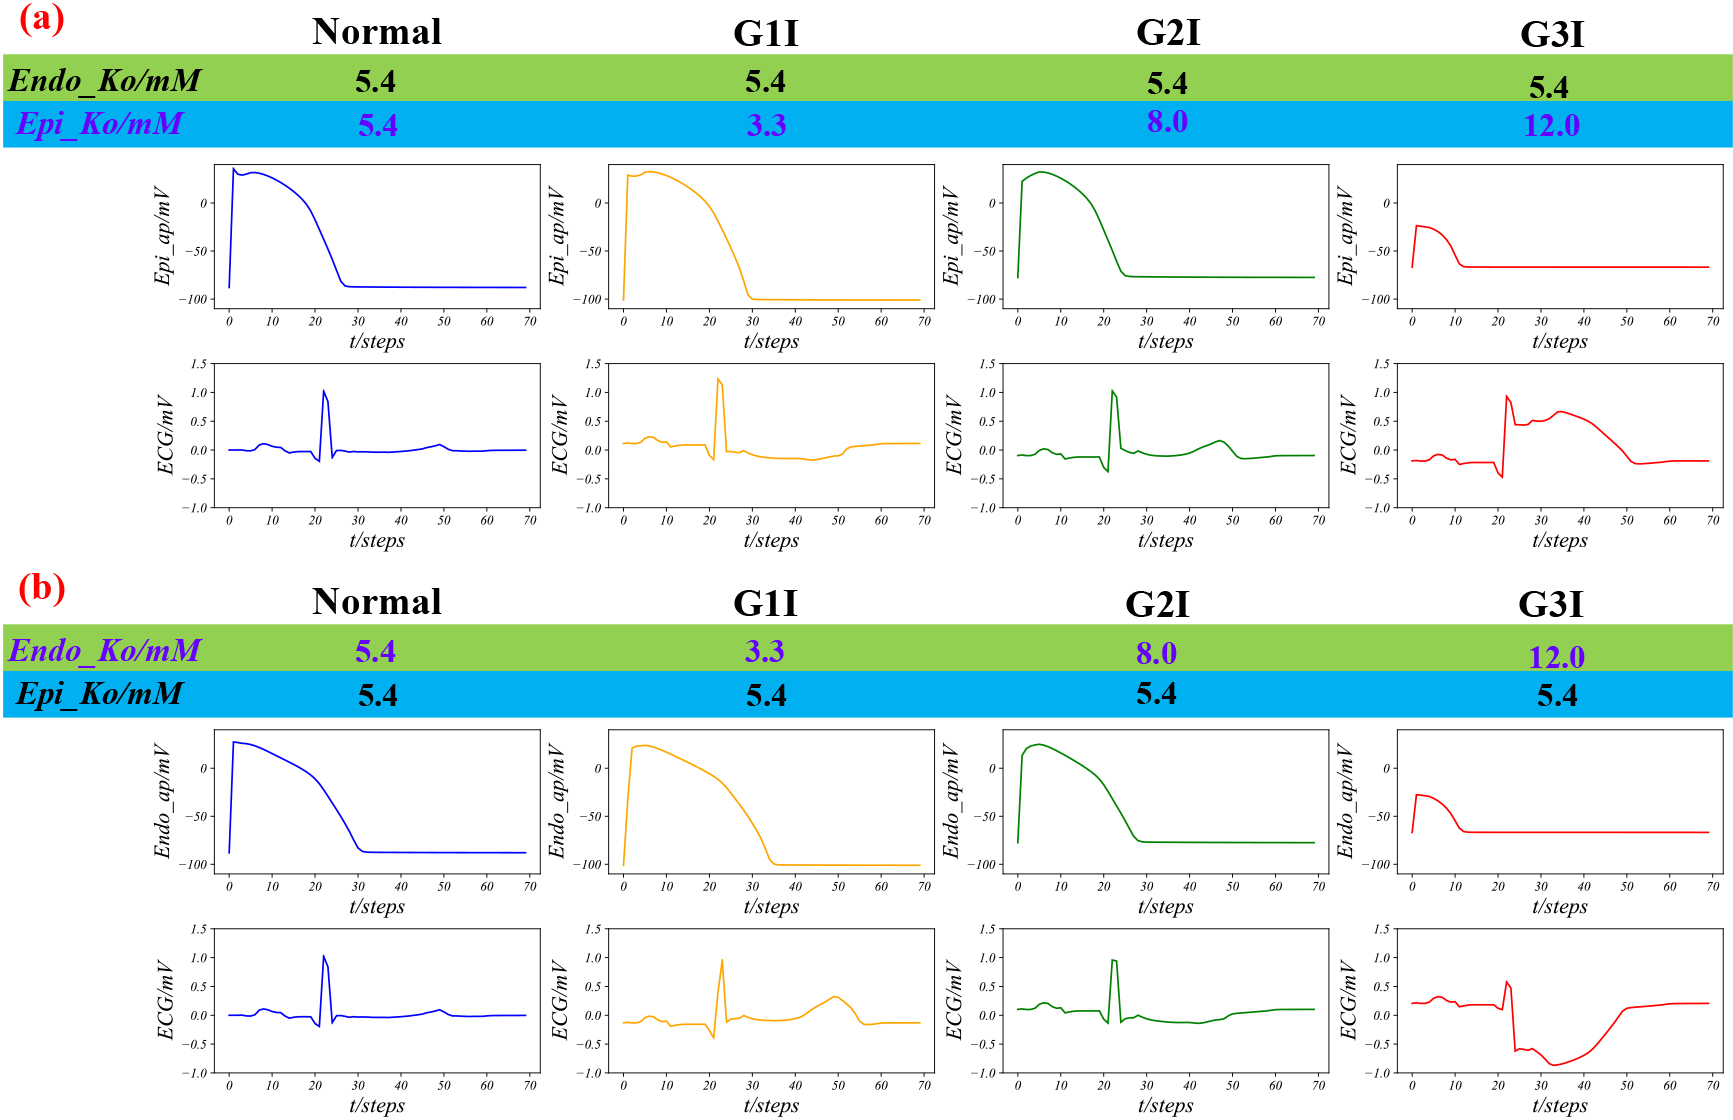
We simulated three grades of Epi ischaemia and Endo ischaemia, by adjusting suitable Epi_Ko and Endo_Ko based on Table 3, as shown in Fig. 5. As shown in Fig. 5a, from left to right, the duration of AP slowly extends and then abruptly shortens with the decrease of depolarizing potential from left to right. Meanwhile, the T wave and the ST-segment of the ECG first elevate and then decrease, and finally, the terminal QRS shows low distortion. Similarly, in Fig. 5b, the variation of AP is the same as that of Fig. 5a, while the trend of changes in the ECG is opposite. The T wave and the ST-segment of the ECG are depressed and elevated, respectively, and finally, the terminal QRS shows high distortion.
4.Discussions
In this study, we used the established multi-scale cardiac electrophysiological model to simulate the process of generating ECG under normal conditions. The action potentials depicted in Fig. 3a are consistent with experimental data [7]. Figure 3b illustrates the AP the propagation of the action potential (AP) in the heart [27]. The virtual ECG shown in Fig. 3c displays trends of the Q wave, QRS complex, and T wave consistent with real ECG recordings.
Next, we used the model to simulate abnormal ECG resulting from myocardial ischemia. As shown in Fig. 4, as [K + ]o increases, the APD90 for Epi_AP and Endo_AP decreases, RP increases. When Epi_Ko equals 10.5 or Endo_Ko equals 11.1, the APD90 and PP decrease dramatically. This is due to the massive inactivation [28] of sodium ion channels in the Epi and Endo cell membranes. Despite their physiological similarities, the conductivity of [K + ]o ion channels in Epi cells is 1.3 times higher than that of Endo cells [7], leading to distinct electrical properties and responses to stimuli.
Furthermore, with increasing Epi_Ko, the CV_SQ and AV_TR of the ECG increase, while with increasing Endo_Ko, the CV_SQ and AV_TR of the ECG decrease. This is due to the V6 lead used in the ECG simulation. The distance between Endo, M and Epi cells to V6 increases sequentially. When Epi cells are ischemic, t their low membrane potential creates a positive potential between them and M cells, resulting in an elevated ST-T segment of the ECG. When Endo cells are ischemic, a negative potential is formed between them and M cells, depressing the ST-T segment of the ECG. This is consistent with findings based on data from clinical trials [29, 30].
The study results indicate that the degree of ischemia can be classified into three categories: G1I, G2I, and G3I, depending on the level of [K + ]o. Specifically, G1I occurred when [K + ]o was lower than normal, G2I occurred when [K + ]o was slightly higher than normal, and G3I occurred when there was significant inactivation of sodium channels. The present discovery establishes a direct relationship between [K + ]o levels and the severity of ischemia. The study results reveal that [K + ]o levels decrease initially and then gradually increase during the ischemic process, which challenges the common belief that ischemia is primarily caused by elevated [K + ]o levels [15, 29]. One reason for the difference in our findings from what is commonly believed about the role of [K + ]o in ischemia could be that [K + ]o levels are not regularly monitored in the early stages of acute heart problems. Additionally, the T wave in ECG is not commonly regarded as a direct marker of myocardial ischemia, which may lead to the underestimation of [K + ]o levels and the oversight of their relationship with the severity of ischemia [30, 31]. As a result, [K + ]o levels may go undetected, and their relationship with the severity of ischemia may be overlooked.
5.Conclusions
The finding that the abnormal [K + ]o levels can lead to ischemia, and that the more [K + ]o deviates from normal, the more severe the ischemia. We classified the grade of ischemia into three categories based on [K + ]o levels: G1I, G2I, and G3I. In particular, we propose a new viewpoint that [K + ]o levels may be lower than normal during grade 1 ischemia, which differs from the commonly held belief that myocardial ischemia is caused by an increase in extracellular potassium concentration. This unusual finding provides a new perspective on the mechanisms underlying myocardial ischemia and has the potential to lead to the development of new diagnostic and treatment strategies.
Acknowledgments
This research was supported by the Shanghai 2021 “Science and Technology Innovation Action Plan” Biomedical Science and Technology Support Special Project (Nos. 21S31907100 and 21S31908000).
Conflict of interest
None to report.
References
[1] | WHO. The top 10 causes of death. (2020) . Available from: https://www.who.int/news-room/fact-sheets/detail/the-top-10-causes-of-death. |
[2] | Birnbaum Y, Sclarovsky S. The grades of ischemia on the presenting electrocardiogram of patients with ST elevation acute myocardial infarction. Journal of Electrocardiology. (2001) ; 34: (4, Part B): 17-26. doi: 10.1054/jelc.2001.28819. |
[3] | Birnbaum GD, Birnbaum I, Birnbaum Y. Twenty years of ECG grading of the severity of ischemia. Journal of Electrocardiology. (2014) ; 47: (4): 546-555. |
[4] | Mihalef V, Passerini T, Mansi T. Multi-scale models of the heart for patient-specific simulations. In: Mansi T, Passerini T, Comaniciu D, editors. Artificial Intelligence for Computational Modeling of the Heart. Academic Press. (2020) . pp. 3-42. |
[5] | Luo CH, Rudy Y. A model of the ventricular cardiac action potential. Depolarization, repolarization, and their interaction. Circulation Research. (1991) ; 68: (6): 1501-1526. doi: 10.1161/01.RES.68.6.1501. |
[6] | Ten Tusscher KHWJ, Bernus O, Hren R, Panfilov AV. Comparison of electrophysiological models for human ventricular cells and tissues. Progress in Biophysics and Molecular Biology. (2006) ; 90: (1): 326-345. doi: 10.1016/j.pbiomolbio.2005.05.015. |
[7] | O’Hara T, Virag L, Varro A, Rudy Y. Simulation of the undiseased human cardiac ventricular action potential: Model formulation and experimental validation. Plos Computational Biology. (2011) ; 7: (1). doi: 10.1371/journal.pcbi.1002061. |
[8] | Dutta S, Mincholé A, Quinn TA, Rodriguez B. Electrophysiological properties of computational human ventricular cell action potential models under acute ischemic conditions. Progress in Biophysics and Molecular Biology. (2017) ; 129: : 40-52. doi: 10.1016/j.pbiomolbio.2017.02.007. |
[9] | González-Ascaso A, Olcina P, Garcia-Daras M, Rodriguez-Matas JF, Ferrero JM. Why Does Extracellular Potassium Rise in Acute Ischemia? Insights from Computational Simulations. IEEE. (2019) ; 1-4. |
[10] | Whiteley JP, Bishop MJ, Gavaghan DJ. Soft tissue modelling of cardiac fibres for use in coupled mechano-electric simulations. Bulletin of Mathematical Biology. (2007) ; 69: (7): 2199-2225. doi: 10.1007/s11538-007-9213-1. |
[11] | King DR, Entz M, Blair GA, Crandell I, Hanlon AL, Lin J, et al. The conduction velocity-potassium relationship in the heart is modulated by sodium and calcium. Pflügers Archiv-European Journal of Physiology. (2021) ; 473: (3): 557-571. |
[12] | Jæger KH, Edwards AG, McCulloch A, Tveito A. Properties of cardiac conduction in a cell-based computational model. Plos Computational Biology. (2019) ; 15: (5): e1007042. |
[13] | Huang C, Song Z, Di Z, Qu Z. Stability of spatially discordant repolarization alternans in cardiac tissue. Chaos: An Interdisciplinary Journal of Nonlinear Science. (2020) ; 30: (12): 123141. |
[14] | Zemzemi N, Bernabeu MO, Saiz J, Cooper J, Pathmanathan P, Mirams GR, et al. Computational assessment of drug-induced effects on the electrocardiogram: from ion channel to body surface potentials. British Journal of Pharmacology. (2013) ; 168: (3): 718-733. doi: 10.1111/j.1476-5381.2012.02200.x. |
[15] | Okada J, Fujiu K, Yoneda K, Iwamura T, Washio T, Komuro I, et al. Ionic mechanisms of ST segment elevation in electrocardiogram during acute myocardial infarction. The Journal of Physiological Sciences. (2020) ; 70: (1): 1-14. |
[16] | Madias JE. The ‘giant R waves’ ECG pattern of hyperacute phase of myocardial infarction. A case report. Journal of Electrocardiology. (1993) ; 26: (1): 77-82. doi: 10.1016/0022-0736(93)90068-o. |
[17] | Baum OV, Voloshin VI, Popov LA. Computer simulation for localization and extensiveness of myocardial ischemia. Biophysics. (2014) ; 59: : 814-819. |
[18] | Wang Y, Rudy Y. Action potential propagation in inhomogeneous cardiac tissue: Safety factor considerations and ionic mechanism. American Journal of Physiology-Heart and Circulatory Physiology. (2000) ; 278: (4): H1019-H1029. doi: 10.1152/ajpheart.2000.278.4.H1019. |
[19] | Ferrero JM Jr, Sáiz J, Ferrero JM, Thakor NV. Simulation of action potentials from metabolically impaired cardiac myocytes: Role of ATP-sensitive K+ current. Circulation Research. (1996) ; 79: (2): 208-221. |
[20] | Ahmadbakir A, Al Abed A, Lovell NH, Dokos S. Multiphysics computational modelling of the cardiac ventricles. IEEE Reviews in Biomedical Engineering. (2021) . |
[21] | Hodgkin AL, Huxley AF. A quantitative description of membrane current and its application to conduction and excitation in nerve. The Journal of physiology. (1952) ; 117: (4): 500. |
[22] | Courtemanche M, Ramirez RJ, Nattel S. Ionic mechanisms underlying human atrial action potential properties: Insights from a mathematical model. American Journal of Physiology-Heart and Circulatory Physiology. (1998) ; 275: (1): H301-H321. |
[23] | Zhang X, Tan H, Tang G, Deng M. A cellular automaton model for electrocardiogram considering the structure of heart. Chinese Journal of Physics. (2017) ; 66: (20): 24-32. |
[24] | Nan J, Sugrue A, Ladas TP, Mehra N, Asirvatham SJ. Anatomic considerations relevant to atrial and ventricular arrhythmias. Cardiac Electrophysiology Clinics. (2019) ; 11: (3): 421-432. |
[25] | Greenberg JM, Hastings SP. Spatial patterns for discrete models of diffusion in excitable media. SIAM Journal on Applied Mathematics. (1978) ; 34: (3): 515-523. doi: 10.1137/0134040. |
[26] | Zhu H, Sun Y, Rajagopal G, Mondry A, Dhar P. Facilitating arrhythmia simulation: The method of quantitative cellular automata modeling and parallel running. BioMedical Engineering OnLine. (2004) ; 3: (1): 29. doi: 10.1186/1475-925X-3-29. |
[27] | Anderson RH, Yanni J, Boyett MR, Chandler NJ, Dobrzynski H. The anatomy of the cardiac conduction system. Clinical Anatomy: The Official Journal of the American Association of Clinical Anatomists and the British Association of Clinical Anatomists. (2009) ; 22: (1): 99-113. |
[28] | Ulbricht W. Sodium channel inactivation: Molecular determinants and modulation. Physiological Reviews. (2005) ; 85: (4): 1271-1301. |
[29] | Di Diego JM, Antzelevitch C. Acute myocardial ischemia: Cellular mechanisms underlying ST segment elevation. Journal of Electrocardiology. (2014) ; 47: (4): 486-490. doi: 10.1016/j.jelectrocard.2014.02.005. |
[30] | Chung MJ, Brown DL. Diagnosis of acute myocardial infarction. Cardiac Intensive Care-E-Book. (2018) ; 90. |
[31] | Thygesen K, Alpert JS, Jaffe AS, Chaitman BR, Bax JJ, Morrow DA, et al. Fourth Universal Definition of Myocardial Infarction (2018). Journal of the American College of Cardiology. (2018) ; 72: (18): 2231-2264. doi: 10.1016/j.jacc.2018.08.1038. |


