
Study of foot support during gait in healthy children from neighbouring countries
Abstract
BACKGROUND:
Healthy children’s gait support patterns play a critical role in their development and overall well-being. Therefore, in order to develop a correct gait, it is necessary to constantly update knowledge.
OBJECTIVE:
To identify differences in gait support among children in neighbouring countries.
METHODS:
44 healthy children from Poland and Lithuania (4–11 years old) participated in the study. The spatiotemporal and plantar pressure parameters of 88 neutrally aligned feet were analysed and compared.
RESULTS:
Statistically significant differences between stance, single-limb support, double support, swing duration, cadence, and velocity, max. force and pressure in the forefoot, as well as in the times of occurrence of max. forces in all three zones. Defined that age is related (
CONCLUSION:
The results can help caregivers, as well as clinicians and researchers, understand how gait mechanics change with development and the growth course of the children of that country. Also, the results are important for the analysis and comparison of children’s gait, as control reference data from the same country.
1.Introduction
In children, the development of proper foot support and gait (walking pattern) is crucial for their overall growth and movement [1]. During gait, healthy children can exhibit a variety of foot support patterns, which can vary based on their age, developmental stage, and physical activity level [2, 3, 4, 5, 6, 7, 8]. The normal support pattern during gait typically goes through several stages as they grow and develop. Infants start by lying on their back and gradually progress to rolling, crawling, and eventually standing and walking. Infants rely on the support of their whole foot, including the heels, as they begin to take their first steps. Toddlers continue to refine their walking skills. By around 18 months, most toddlers develop a heel-to-toe walking pattern, where the heel strikes the ground first, followed by the midfoot and toes. The arches of the feet start to develop during this stage, and the foot becomes more flexible. During the preschool years, children’s gait becomes more coordinated and efficient [9]. They refine their walking pattern and exhibit a more natural heel-to-toe gait. The arches of the feet continue to develop, and the foot becomes more rigid, providing better support and stability. School-age children generally have a well-established and mature walking pattern. They have developed fully formed arches and a more adult-like gait. Their foot structure and support are similar to that of adults, allowing for efficient and stable walking and running [10].
Some of the most common foot support patterns seen in healthy children during gait include heel strike, when the heel of the foot touches the ground first during the initial contact phase of gait. It is the most common foot support pattern in healthy children [11, 12, 13, 14]. The midfoot strike is when the middle of the foot touches the ground first during the initial contact phase of gait. This foot support pattern is more common in children who are barefoot or wearing minimalist footwear. Further, a forefoot strike when the ball of the foot touches the ground first during the initial contact phase of gait is more common in children who are running or sprinting. Flatfooted is when the entire sole of the foot makes contact with the ground at the same time during the initial contact phase of gait. Flat feet, also known as pes planus, is a condition where the arches of the feet appear flattened, causing the entire foot to make contact with the ground. Flat feet are relatively common in infants and young children and usually resolve naturally as they grow [15]. However, in some cases, flat feet may persist and lead to other foot-related issues, requiring medical attention. Toe walking, when the child walks on their toes, without making contact with their heels or midfoot is toe walking. It is common in toddlers who are still developing their gait pattern [5, 16, 17, 18], but if it persists beyond the age of three, it may indicate underlying neurological or musculoskeletal issues. It’s important to note that children can exhibit different foot support patterns during different phases of gait, and variations in foot support patterns are not necessarily a cause for concern. Several factors can influence support patterns in children and are broadly categorized into intrinsic factors and extrinsic factors. Intrinsic are growth and development, foot structure, muscle tone and strength [15, 19, 20]. And extrinsic stand for footwear, surface conditions and environmental factors [12, 21]. There are several gait parameters that can affect foot support patterns during gait in healthy children. Some of these parameters include walking speed. The speed at which a child walks can affect the timing and amplitude of their foot support patterns. Another one is step length, which can influence the amount of time each foot spends in contact with the ground during gait. The cadence at which a child takes steps can also impact the timing and coordination of their foot support patterns. Additionally, body weight: the weight of a child can influence the distribution of forces on their feet during gait, which may affect foot support patterns [22]. Very important seems to be foot posture, muscle strength and control and joint range of motion. They can impact the mechanics of their gait and the support patterns they use. Understanding how these gait parameters affect foot support patterns can help clinicians and researchers identify potential problems or deviations from typical gait patterns in healthy children, and design interventions to address them if necessary. Gait support patterns refer to the different ways in which individuals distribute their body weight during walking [23]. It is influenced by various factors such as age, gender, body weight, height, and cultural background [24, 25]. There may be some differences in gait support patterns between different populations [26, 27, 28]. There have been studies examining gait support patterns in children from different countries, but there have been no studies comparing healthy Polish and Lithuanian children.
Gait studies of foot support patterns of healthy children from different countries can help parents and medical professionals understand what changes in gait parameters occur as children develop and grow. With such data, it is possible to adapt a supportive environment for children, encourage physical activity or develop strong and effective movement support. Also, for the analysis and comparison of children’s gait results, it is important to have control reference data from children of the same country.
The purpose of this study is to better understand differences in gait support among children in neighbouring countries, which may influence the development of interventions or treatment methods tailored to specific populations. In order to achieve this goal, the work compares demographic, spatiotemporal, and plantar pressure parameters, as well as finds related indicators to support patterns in kids.
2.Methods
2.1Subjects
Eighty-eight neutrally aligned feet from Poland (PL) and Lithuania (LT) (aged 4–11 years) were examined. Healthy children (26 from PL and 18 from LT) were defined as individuals having no known musculoskeletal disease or abnormality and having not had any prior musculoskeletal manipulation, such as a surgical procedure. All subjects’ parents gave written consent to participate in the study. The protocols were approved by the local ethical committees.
2.2Measurement protocol
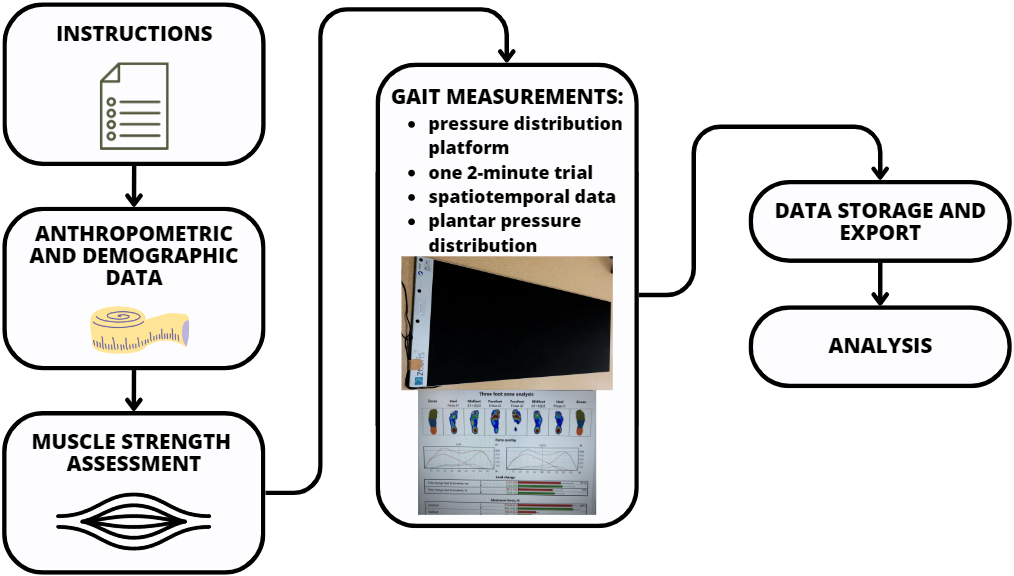
Before the measurement phase of plantar pressure distribution and spatiotemporal parameters, all subjects were introduced to the gait analysis measurement system and the course of the study. Next, the subjects’ anthropometric and demographic data were determined, and lower limb muscle strength (must be at least 5 points according to the Lovett scale) was assessed. Gait measurements were performed barefoot using the Zebris FDM-T (Zebris Medical GmbH, Germany) pressure distribution measurement platform with a sensor area of 149
Figure 1.
Flowchart of the investigation procedure.
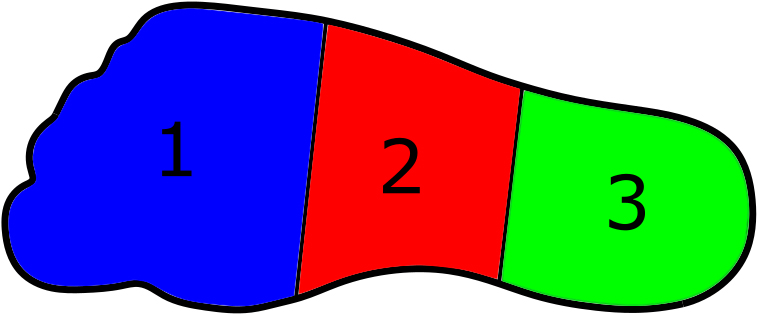
Two groups of gait parameters were analysed in this study: (1) Spatiotemporal gait parameters and (2) the maximum force, maximum pressure, and time of maximum force measured per each individual step under three anatomical foot zones. These zones represent the following anatomical plantar regions: forefoot, midfoot, and heel (Fig. 2).
Before the comparative analysis, spatiotemporal data (step length, stride length, cadence and velocity) were normalized based on the methodologies of other researchers [29, 30], and maximum force were normalized to body weight (i.e., dimensionless quantities were compared).
2.3Statistical analysis
Data allocation was verified by Shapiro-Wilk test. All results are expressed and represented as mean
3.Results
3.1Demographic data
The mean age of both children groups was 8.43
Table 1
Demographic and anthropometric data (mean
| Parameters | LT children ( | PL children ( |
|---|---|---|
| Gender, boys/girls | 6/12 | 13/13 |
| Age (years) | 8.17 | 8.62 |
| Height (m) | 1.32 | 1.36 |
| Weight (kg) | 29.19 | 33.15 |
| BMI (kg/m | 16.42 | 18.20 |
| Leg length (m) | 0.71 | 0.70 |
Figure 2.
Definitions of different regions used in this study: 1– forefoot, 2 – midfoot, 3 – heel.
Firstly, the difference between the left and right-side parameters was calculated and there was no statistical difference observed. That’s why the spatiotemporal parameters (Table 2) and plantar loading during walking (Table 3) were assessed as an average value for both legs.
Table 2
Spatiotemporal gait parameters for PL and LT children (mean
| Parameters | LT children ( | PL children ( | ||
|---|---|---|---|---|
| Step length | 0.71 | 0.78 | ||
| Stride length | 1.42 | 1.56 | ||
| Step width (m) | 0.08 | 0.10 | ||
| Stance phase (%) | 61.34 | 60.76 | ||
| Load response (%) | 11.49 | 11.63 | ||
| Single limb support (%) | 38.35 | 36.73 | ||
| Pre-swing (%) | 11.51 | 12.40 | ||
| Double phase (%) | 22.97 | 21.46 | ||
| Swing-phase (%) | 38.66 | 39.16 | ||
| Cadence | 0.53 | 0.58 | ||
| Velocity | 0.38 | 0.45 | ||
Table 3
Assessing plantar loading during walking at a habitual speed (mean
| Parameters | LT children ( | PL children ( | ||
|---|---|---|---|---|
| Normalised max. force forefoot | 1.01 | 0.81 | ||
| Normalised max. force midfoot | 0.20 | 0.19 | ||
| Normalised max. force heel | 0.76 | 0.82 | ||
| Max. pressure forefoot (N/cm | 21.01 | 31.34 | ||
| Max. pressure midfoot (N/cm | 7.93 | 6.96 | ||
| Max. pressure heel (N/cm | 26.14 | 26.72 | ||
| Time max. force forefoot (% of stance time) | 74.59 | 67.14 | ||
| Time max. force midfoot (% of stance time) | 44.83 | 48.41 | ||
| Time max. force heel (% of stance time) | 18.46 | 17.83 | ||
When comparing the temporal parameters, there were significant differences between stance, single limb support, double support, and swing duration. No differences were observed only in the duration of the load response and pre-swing phases (
There were no significant differences between the parameters of pressure distribution and max. force in midfoot and heel (
3.2Correlation coefficient investigation
Gait parameters were analysed using the correlation coefficient. As a result, age and some gait parameters have been found to be related. Age correlates with the leg length (
3.3A model fitting results
A relationship between the dependent and independent variables can be approximately represented within the second-degree polynomial [31]:
(1)
where:
Statistical analysis of the model’s coefficients showed that the model coefficient
(2)
The results suggest that the model could accurately fit the measured values (goodness of fit:
4.Discussion
Table 4
Comparison of our spatiotemporal results with those presented in the literature
| Parameters | LT children | PL children | Literature [10] | ||
|---|---|---|---|---|---|
| Step length | 0.71 | 0.78 | 0.79–0.84 | ||
| Stride length | 1.42 | 1.56 | 1.58–1.68 | ||
| Step width (m) | 0.08 | 0.10 | 0.07–0.09 | ||
| Stance phase (%) | 61.34 | 60.76 | 55.8–58.9 | ||
| Single limb support (%) | 38.35 | 36.73 | 41.7–44.0 | ||
| Double phase (%) | 22.97 | 21.46 | 11.8–17.5 | ||
| Cadence | 0.53 | 0.58 | 0.58–0.62 | ||
| Velocity | 0.38 | 0.45 | 0.46–0.52 | ||
Understanding gait support patterns in children from neighbouring countries enhances cross-cultural understanding, promotes inclusive healthcare practices, and contributes to the development of more effective interventions and services. It enables healthcare professionals, researchers, and educators to address the unique needs of diverse populations and work towards improving the mobility and well-being of children worldwide [26, 27, 28]. Various biomechanical parameters can be used to describe gait support models in children. The choice of parameters depends on the specific objectives of the analysis and the context in which it is performed. Spatiotemporal parameters are commonly used in combination with others to capture various aspects of gait and to assess the overall quality of gait support in children. These parameters are particularly useful for assessing gait abnormalities, monitoring rehabilitation progress, and evaluating the impact of interventions or treatments on locomotion [12, 17, 32]. Comparing our results with Lythgo et al. [10] according to the average age of LT and PL children, Polish is closer to Lythgo et al. results than LT in almost all spatiotemporal parameters (Table 4). It turns out that PL children are closer to other parameters found in the literature than Lithuanians. On the other hand, another scientific source on children’s gait and stance characteristics indicates that gait speed can influence stance patterns [33]. Therefore, based on these results, it can be said that LT results could be related to walking speed. Since walking speed was not limited in this study, perhaps the LT children simply walked more slowly.
Studies [10, 34] have shown that healthy children tend to have a longer stance phase, double support, and cadence than adults due to a shorter stride length. They generally spend a shorter duration in single limb support and typically exhibit shorter swing duration compared to adults. Cadence can vary among healthy children from different countries. Cultural and environmental factors, including lifestyle, physical activity levels, and walking surfaces, may influence cadence. As they develop, there is a gradual increase in the duration of single limb support and swing, reaching adult values by adolescence [10]. In children with typical support pattern, gait velocity falls within the expected range for their age and developmental stage. Normal gait speed reflects and efficient and coordinated walking pattern with appropriate weight transfer and support. Decreased gait velocity might be present due to (1) weakness and poor muscle control, or (2) balance or stability issues. Often higher velocity in children provide insights into support patterns. Kids with support issues, such as toe walking or other abnormal gait patterns, may adopt compensatory strategies, i.e., increasing gait velocity to enhance stability and minimize time spent on one foot. Gait velocity may differ between children from various countries due to variations in walking habits, physical activity levels, and environmental factors [25].
Other extremely important indicators of gait support model analysis are plantar pressure parameters [7, 8], which assess how forces are distributed on the sole surface of the foot during walking. Our study revealed significant differences between LT and PL children in plantar pressure parameters: the max. force in the forefoot and the duration of occurrence of max. forces in all three zones (
These differences could be influenced by factors such as walking habits, body weight, and foot biomechanics. Higher max. force in forefoot for LT children (
Correlation analysis confirmed that every age we studied is related to gait parameters: cadence (
It is important to note that these differences in gait support among healthy children from different countries are based on limited research, and more detailed studies are needed to identify clear patterns, as well as the underlying factors contributing to the observed differences. In addition, differences in gait support patterns may also be influenced by factors such as gender and individual biomechanics. Cultural, environmental, or similar differences between countries that may affect gait parameters were not fully assessed in our study.
5.Conclusions
Studying foot support patterns during gait in healthy children can help clinicians and researchers understand how gait mechanics change with development and may inform interventions or treatments for gait abnormalities. Seeing the differences in our results, it can be said that the characteristics of each country determine the characteristics of the gait support pattern and the growth course of the children of that country. Therefore, for analysis and comparison of children’s gait results, it is important to have control reference data from children from the same country, and to ensure similar walking speeds.
Acknowledgments
The study was supported by grant no. W/WM-IIB/2/2021.
Conflict of interest
None to report.
References
[1] | Hillman SJ, Stansfield BW, Richardson AM, et al. Development of temporal and distance parameters of gait in normal children. Gait Posture (2009) ; 29: : 81-85. |
[2] | Alderson LM, Joksaite SX, Kemp J, et al. Age-related gait standards for healthy children and young people: The GOS-ICH paediatric gait centiles. Arch Dis Child (2019) ; 104: : 755-760. |
[3] | Dusing SC, Thorpe DE. A normative sample of temporal and spatial gait parameters in children using the GAITRite electronic walkway. Gait Posture (2007) ; 25: : 135-139. |
[4] | Rygelová M, Uchytil J, Torres IE, et al. Comparison of spatiotemporal gait parameters and their variability in typically developing children aged 2, 3, and 6 years. PLoS One (2023) ; 18: : e0285558. |
[5] | Bach MM, Daffertshofer A, Dominici N. The development of mature gait patterns in children during walking and running. Eur J Appl Physiol (2021) ; 121: : 1073-1085. |
[6] | Gouelle A, Leroux J, Bredin J, et al. Changes in gait variability from first steps to adulthood: Normative data for the gait variability index. http://dx.doi.org/101080/0022289520151084986 (2015) ; 48: : 249-255. |
[7] | Dulai S, Ramadi A, Lewicke J, et al. Functional characterization of plantar pressure patterns in gait of typically developing children using dynamic pedobarography. Gait Posture (2021) ; 84: : 267-272. |
[8] | McKay MJ, Baldwin JN, Ferreira P, et al. Spatiotemporal and plantar pressure patterns of 1000 healthy individuals aged 3–101 years. Gait Posture (2017) ; 58: : 78-87. |
[9] | Verbecque E, Vereeck L, Van de Heyning P, et al. Gait and its components in typically developing preschoolers. Gait Posture (2017) ; 58: : 300-306. |
[10] | Lythgo N, Wilson C, Galea M. Basic gait and symmetry measures for primary school-aged children and young adults whilst walking barefoot and with shoes. Gait Posture (2009) ; 30: : 502-506. |
[11] | Evans AM. Pediatric Flat Feet: A 2020 Guide for Clinicians to Identify the Boomerangs. J Am Podiatr Med Assoc; 112. Epub ahead of print 1 May 2022. doi: 10.7547/20-103. |
[12] | Cranage S, Perraton L, Bowles KA, et al. A comparison of young children’s spatiotemporal gait measures in three common types of footwear with different sole hardness. Gait Posture (2021) ; 90: : 276-282. |
[13] | Liu W, Mei Q, Yu P, et al. Biomechanical Characteristics of the Typically Developing Toddler Gait: A Narrative Review. Children (Basel); 9. Epub ahead of print 1 March 2022. doi: 10.3390/CHILDREN9030406. |
[14] | Hallemans A, De Clercq D, Otten B, et al. 3D joint dynamics of walking in toddlers: A cross-sectional study spanning the first rapid development phase of walking. Gait Posture (2005) ; 22: : 107-118. |
[15] | Carr JB, Yang S, Lather LA. Pediatric pes planus: A stateofthe-art review. Pediatrics; 137. Epub ahead of print 1 March 2016. doi: 10.1542/PEDS.2015-1230/81376. |
[16] | Banwell HA, Paris ME, Mackintosh S, et al. Paediatric flexible flat foot: how are we measuring it and are we getting it right? A systematic review. J Foot Ankle Res; 11. Epub ahead of print 30 May 2018. doi: 10.1186/S13047-018-0264-3. |
[17] | Rerucha CM, Dickison C, Baird DC. Lower extremity abnormalities in children. Am Fam Physician (2017) ; 96: : 226-233. |
[18] | Schulz JF, Molho DA, Sylvia SM, et al. Parental understanding of intoeing gait – A preliminary study. Foot (Edinb) (2019) ; 41: : 39-43. |
[19] | Scott G, Menz HB, Newcombe L. Age-related differences in foot structure and function. Gait Posture (2007) ; 26: : 68-75. |
[20] | Tveter AT, Holm I. Influence of thigh muscle strength and balance on hop length in one-legged hopping in children aged 7–12 years. Gait Posture (2010) ; 32: : 259-262. |
[21] | Cranage S, Perraton L, Bowles KA, et al. The impact of shoe flexibility on gait, pressure and muscle activity of young children. A systematic review. J Foot Ankle Res (2019) ; 12: : 1-7. |
[22] | Mickle KJ, Steele JR, Munro BJ. Does excess mass affect plantar pressure in young children? International Journal of Pediatric Obesity (2006) ; 1: : 183-188. |
[23] | Ivanenko YP, Dominici N, Cappellini G, et al. Development of pendulum mechanism and kinematic coordination from the first unsupported steps in toddlers. Journal of Experimental Biology (2004) ; 207: : 3797-3810. |
[24] | Pierrynowski MR, Galea V. Enhancing the ability of gait analyses to differentiate between groups: Scaling gait data to body size. Gait Posture (2001) ; 13: : 193-201. |
[25] | Müller J, Müller S, Baur H, et al. Intra-individual gait speed variability in healthy children aged 1–15 years. Gait Posture (2013) ; 38: : 631-636. |
[26] | Smith Y, Louw Q, Brink Y. The three-dimensional kinematics and spatiotemporal parameters of gait in 6–10 year old typically developed children in the Cape Metropole of South Africa – a pilot study. BMC Pediatr (2016) ; 16: : 1-10. |
[27] | Moreno-Hernández A, Rodríguez-Reyes G, Quiñones-Urióstegui I, et al. Temporal and spatial gait parameters analysis in non-pathological Mexican children. Gait Posture (2010) ; 32: : 78-81. |
[28] | Thevenon A, Gabrielli F, Lepvrier J, et al. Collection of normative data for spatial and temporal gait parameters in a sample of French children aged between 6 and 12. Ann Phys Rehabil Med (2015) ; 58: : 139-144. |
[29] | Hof AL. Scaling gait data to body size. Gait Posture (1996) ; 4: : 222-223. |
[30] | Stansfield BW, Hillman SJ, Hazlewood ME, et al. Normalisation of gait data in children. Gait Posture (2003) ; 17: : 81-87. |
[31] | Allen MP. Regression analysis with standardized variables. Understanding Regression Analysis. (1997) ; 46-50. |
[32] | Nesi B, Taviani A, D’Auria L, et al. The Relationship between Gait Velocity and Walking Pattern in Hemiplegic Patients. Applied Sciences (2023) ; 13: : 934. |
[33] | Lythgo N, Wilson C, Galea M. Basic gait and symmetry measures for primary school-aged children and young adults. II: Walking at slow, free and fast speed. Gait Posture (2011) ; 33: : 29-35. |
[34] | Gieysztor E, Kowal M, Paprocka-Borowicz M. Gait parameters in healthy preschool and school children assessed using wireless inertial sensor. Sensors (2021) ; 21: : 6423. |


