
NOP16 promotes hepatocellular carcinoma progression and triggers EMT through the Keap1-Nrf2 signaling pathway
Abstract
BACKGROUND:
Nucleolar protein 16 (NOP16) is present in the protein complex of the nucleolus. The NOP16 promoter contains a c-Myc binding site, and the transcriptional regulation by c-Myc directly regulates NOP16 expression levels.
OBJECTIVE:
Dysregulation of NOP 16 is currently reported in only a small number of cancers. In this study, the expression profile of NOP 16 in hepatocellular carcinoma (LIHC) and its clinical significance were analyzed.
METHODS:
NOP16 expression in hepatocellular carcinoma (LIHC) and its relationship with the clinical characters of LIHC were examined using the Cancer Genome Atlas (TCGA), the Gene Expression comprehensive database (GEO), Kaplan-Meier survival analysis, univariate Cox analysis, multivariate Cox analysis, ROC curve analysis of KEGG enrichment, GSEA enrichment, in vitro experiments (e.g., siRNA interference of NOP16 expression in hepatoma cells, Keap1-Nrf2 pathway, cell cycle, cell apoptosis and Transwell assays), and LIHC single-cell sequencing (scRNA).
RESULTS:
Pan-cancer analysis revealed that NOP16 was highly expressed in 20 cancer types, including LIHC, and high NOP16 expression was an independent adverse prognostic factor in LIHC patients. The expression levels of NOP16 mRNA and protein were significantly increased in tumour tissues of LIHC patients compared to normal tissues. The functions of co-expressed genes were primarily enriched in the cell cycle and reactive oxygen species metabolism. The experimental results showed that knockdown of NOP16 activated the Keap/Nrf2 signalling pathway and inhibited the invasion, migration, and EMT progression of LIHC cells. LIHC scRNA-seq data showed that NOP16 was primarily expressed in T lymphocytes.
CONCLUSIONS:
NOP16 promoted cancer development in LIHC and caused an imbalance in Keap/Nrf2 signalling, which subsequently caused the aberrant expression of genes typical for EMT, cell cycle progression and apoptosis. NOP16 is a potential prognostic marker and therapeutic target for hepatocellular carcinoma progression.
1.Introduction
Primary liver cancer is one of the most common malignant tumours in humans and the third leading cause of cancer death worldwide (8.3%). It is primarily divided into three mixed types, LIHC, cholangiocytic carcinoma (ICC) and LIHC-ICC, which account for approximately 90% of all liver cancer cases [1]. There is no obvious specific shape of LIHC in the early stage, and greater than 50% of patients have reached the middle and late stages at the time of diagnosis. Due to the influence of postoperative recurrence and cancer metastasis, the mortality rate related to hepatocellular cancer has increased annually [2, 3, 4]. Therefore, it is very important to identify reliable LIHC biomarkers and therapeutic targets for the clinical diagnosis and treatment of LIHC patients.
NOP16, also known as HSPC111, exists in the intracellular protein complex. It is a nucleolar protein that is transcriptionally regulated by the oncogene c-Myc [5, 6]. NOP16 may be involved in the completion of ribosome synthesis [7]. It also regulates ribosome synthesis by interacting with RNA 3’-phosphocyclase (RTCD1) [8]. However, its specific mechanism of action is not clear. Tumour development is associated with related oncogenes and tumour suppressors affecting ribosome biosynthesis. The protein biosynthesis of tumour cells is determined by the assembly process of ribosome-sized subunits and regulated by ribosomal protein synthesis, which is associated with tumour development and invasion [9, 10, 11, 12]. Therefore, a reduction in NOP16 expression in cancer cells may block many biological processes. Therefore, the present study used siRNA to disturb the expression of NOP16 to examine its biological function in HCC. The underlying mechanism of the activation of oxidative stress signalling pathways attracted our attention.
The imbalance of redox levels in the body is the pathophysiological basis of many diseases [13]. New endogenous antioxidant signalling pathways have been discovered in recent years, such as the epoxy chloropropane Kelch sample related protein-1 (Keap1)-nuclear factor erythroid-2 related factor 2 (Nrf2) signalling pathway. Because the oxidative stress response caused by internal and external oxidation and chemical substances plays a very important role in the body’s defence against various external injuries, it is the most important endogenous antioxidant signalling pathway in the body, and it is a hot topic in the field of antioxidant research [14]. Imbalance in the Keap1-Nrf2 signalling pathway changed the expression of some canonical genes, such as EMT, cell cycle, and apoptosis [15], and the abnormal expression of the PTEN/PI3K/AKT/mTOR signalling pathway (a typical tumour-forming pathway) affected the formation of liver cancer. However, no study demonstrated that NOP16 mediated the Keap1/Nrf2 signalling pathway to cause an imbalance in the oxidative stress response that leads to the development of tumours.
The present study evaluated NOP16 expression using bioinformatics techniques and found some prognostic value in LIHC. We examined the effect of NOP16 expression in HepG2 cells using small interfering RNA (siRNA) targeting of NOP16 expression. The mechanism of action of NOP16 on the typical antioxidant signalling pathway (Keapl-Nrf2 signalling pathway) was preliminarily examined, and NOP16 may play a regulatory role in the development of tumours via this signalling pathway. Therefore, our study revealed a possible mechanism of action of NOP16 in LIHC and provides a potential therapeutic target for LIHC.
2.Materials and methods
2.1Public database
TCGA database: We used the TCGA (https://portal.gdc.cancer.gov/) website to download the LIHC transcriptomic data and the corresponding clinical information. The TCGA database contains Illumina RNA-seq gene expression data, including tumour grade and survival data, expression profile data and clinical data. A total of 424 LIHC patients were screened.
HPA database: We performed immunohistochemical experiments using a NOP16 histochemical antibody on normal hepatic tissue and liver cancer tissue. We entered the keyword “NOP16” in the Human Protein Atlas database (http://www.proteinatlas.org/) and selected “Pathology” and “liver cancer”.
2.2Analysis of the differentially expressed genes
NOP16 (cut-off value of 50%) was divided into low expression and high expression groups, and the RNAseq data in the level 3 HTSeq-Counts format in the project were integrated. The R package DESeq2 (version 1.26.0) was used to identify DEGs, and the heatmap was visualised using ggplot2 (version 3.3.3). We performed an unpaired analysis of NOP16 mRNA expression in 33 cancers in the TCGA and GTEx databases, including liver cancer.
2.3Functional enrichment analysis
Differentially expressed genes in the NOP16 high and low expression groups to explore the effect of differential NOP16 expression levels on cell signaling pathways. In this study, the KEGG.v7.4 data set was used for enrichment analysis according to the default reference settings, and
2.4Cell culture and transfection
Cells were seeded into 6-well cell culture plates 1 d before transfection at 6
2.5Apoptosis and the cell cycle measurement using flow cytometry
For conventional culture-negative control and NOP16-siRNA cells at 70% confluence, a single cell suspension was collected without EDTA pancreatic enzyme digestion or centrifugation, and the cells were washed twice via PBS centrifugation. The cell apoptosis kit and cell cycle kit were used, and the cell apoptosis rate and cell cycle of each group were determined using flow cytometry.
2.6Cell wound scratch assay
Cells of the negative control and NOP16-siRNA groups were seeded in 6-well plates and cultured at 37∘C in a 5% CO2 incubator on the cell surface. Cell fragments were removed by washing with PBS, and serum-free culture medium was removed from the same field at 0 h, 24 h, and 48 h. Cell migration was calculated.
2.7Transwell assays
The treated cells were washed twice with PBS and treated with serum-free DMEM starvation for 12 h. The treated cells were collected using trypsin digestion, and a single-cell suspension was prepared and seeded in the Transwell upper chamber (8
2.8Western blotting
Total intracellular protein was extracted using RIPA lysis buffer. The total protein concentration was determined using BCA. SDS-PAGE loading buffer was added for 10 min using 10% PAGE gel electrophoresis. Isolated proteins were transferred onto PVDF membranes and blocked with 5% skim milk powder for 1 h. The corresponding primary antibody and
2.9Real-time qRT-PCR
Total intracellular RNA was extracted using the TRIzol method, and first-strand cDNA was synthesised using reverse transcription and used as the template for qPCR. Each reaction system included components according to the PCR kit instructions. The qPCR procedure was 95∘C pre-denaturation for 2 min, 95∘C denaturation for 15 s and 60∘C annealing for 1 min for a total of 40 cycles. Ct values were calculated for each group and compared between groups using the 2-
Table 1
Clinicopathological characteristics of high and low NOP16 expression groups
| Characteristic | Low expression of NOP16 | High expression of NOP16 |
| ||
|---|---|---|---|---|---|
|
| 187 | 187 | |||
| T stage, | 0.413 | ||||
| T1 | 97 | (26.1%) | 86 | (23.2%) | |
| T2 | 45 | (12.1%) | 50 | (13.5%) | |
| T3 | 35 | (9.4%) | 45 | (12.1%) | |
| T4 | 8 | (2.2%) | 5 | (1.3%) | |
| N stage, | 0.122 | ||||
| N0 | 125 | (48.4%) | 129 | (50%) | |
| N1 | 4 | (1.6%) | 0 | (0%) | |
| M stage, | 1.000 | ||||
| M0 | 131 | (48.2%) | 137 | (50.4%) | |
| M1 | 2 | (0.7%) | 2 | (0.7%) | |
| Pathologic stage, | 0.887 | ||||
| Stage I | 88 | (25.1%) | 85 | (24.3%) | |
| Stage II | 41 | (11.7%) | 46 | (13.1%) | |
| Stage III | 41 | (11.7%) | 44 | (12.6%) | |
| Stage IV | 3 | (0.9%) | 2 | (0.6%) | |
| Tumor status, | 0.319 | ||||
| Tumor free | 107 | (30.1%) | 95 | (26.8%) | |
| With tumor | 72 | (20.3%) | 81 | (22.8%) | |
| Gender, | 0.002 | ||||
| Female | 75 | (20.1%) | 46 | (12.3%) | |
| Male | 112 | (29.9%) | 141 | (37.7%) | |
| Age, | 0.232 | ||||
| | 95 | (25.5%) | 82 | (22%) | |
| | 92 | (24.7%) | 104 | (27.9%) | |
| Weight, | 0.767 | ||||
| | 88 | (25.4%) | 96 | (27.7%) | |
| | 81 | (23.4%) | 81 | (23.4%) | |
| BMI, | 0.421 | ||||
| | 83 | (24.6%) | 94 | (27.9%) | |
| | 83 | (24.6%) | 77 | (22.8%) | |
| Histologic grade, | 0.033 | ||||
| G1 | 35 | (9.5%) | 20 | (5.4%) | |
| G2 | 91 | (24.7%) | 87 | (23.6%) | |
| G3 | 55 | (14.9%) | 69 | (18.7%) | |
| G4 | 3 | (0.8%) | 9 | (2.4%) | |
| AFP (ng/ml), | 0.571 | ||||
| | 105 | (37.5%) | 110 | (39.3%) | |
| | 35 | (12.5%) | 30 | (10.7%) | |
| Residual tumor, | 1.000 | ||||
| R0 | 161 | (46.7%) | 166 | (48.1%) | |
| R1 | 8 | (2.3%) | 9 | (2.6%) | |
| R2 | 0 | (0%) | 1 | (0.3%) | |
| Adjacent hepatic tissue inflammation, | 0.309 | ||||
| None | 68 | (28.7%) | 50 | (21.1%) | |
| Mild | 49 | (20.7%) | 52 | (21.9%) | |
| Severe | 8 | (3.4%) | 10 | (4.2%) | |
| Albumin (g/dl), | 0.035 | ||||
| | 27 | (9%) | 42 | (14%) | |
| | 126 | (42%) | 105 | (35%) | |
|
Table 1, continued | |||||
|---|---|---|---|---|---|
| Characteristic | Low expression of NOP16 | High expression of NOP16 |
| ||
| Prothrombin time, | 0.152 | ||||
| | 101 | (34%) | 107 | (36%) | |
| | 52 | (17.5%) | 37 | (12.5%) | |
| Child-Pugh grade, | 0.733 | ||||
| A | 106 | (44%) | 113 | (46.9%) | |
| B | 11 | (4.6%) | 10 | (4.1%) | |
| C | 1 | (0.4%) | 0 | (0%) | |
| Age, median (IQR) | 60 | (51, 68) | 62.5 | (52, 69) | 0.332 |
2.10Prognostic analysis
Clinical information of LIHC patients with effective prognostic information included in the TCGA database was screened. The independent prognosis and risk score and clinical characteristics (age, sex and disease classification) by R software to plot the forest map, observe the accuracy of the survival of patients by drawing ROC curve, verify the results of independent prognostic analysis, and draw the nomogram to predict the patient survival rate
2.11Construction and validation of the nomograms
To predict the overall survival probability, we constructed a nomogram based on the independent prognostic factors in the multivariate Cox analysis. The nomogram was drawn with 1000 equal repeated samples of Bootstrap for 1 year, 3 year and 5 year calibration curves.
2.12Single-cell RNA-seq
The scRNA-seq data (GSE112271) [42] of LIHC patients were obtained from the Gene Expression Omnibus database (GEO, https://www.ncbi.nlm.nih.gov/geo/, accessed November 10, 2022). Single-cell RNA sequencing (scRNA seq) data were processed using the R package “Seurat” then further standardised data and multiple books were integrated. “Louvain” clustering was performed with 23 principal components. Some classical cell subpopulation-defined markers were obtained from previous studies and manually annotated according to marker expression.
2.13Statistical analysis
The statistical significance of cell proliferation, migration, cycle, apoptosis, invasion and gene expression was determined using Student’s
3.Results
3.1The expression level of NOP16 was increased in LIHC
Pan-cancer analysis showed that NOP16 was highly expressed in 20 cancer types, including LIHC, bladder and urothelial carcinoma, breast cancer, cervical squamous cell carcinoma, cholangiocarcinoma, colon cancer, glioblastoma, oesophageal cancer, kidney chromophobe, kidney renal clear cell carcinoma, lung adenocarcinoma, lung squamous cell carcinoma, pheochromocytoma and paraganglioma, prostate adenocarcinoma, rectum adenocarcinoma, stomach adenocarcinoma, thyroid carcinoma and uterine corpus endometrial carcinoma (Fig. 1A). NOP16 expression was significantly higher in LIHC samples than normal tissues, and NOP16 expression was more significant in paired sample tumours than normal samples (
Figure 1.
Expression levels of NOP16 in different types of tumours and LIHC. Expression of NOP16 (A) in different types of tumours compared to normal tissues in TCGA and GTEx databases, (B) in LIHC and non-matched normal tissues in the TCGA and GTEx databases, (C) in LIHC and matched normal tissues in the TCGA and GTEx databases. (D) ROC curves for classifying LIHC versus normal tissues in the TCGA database.
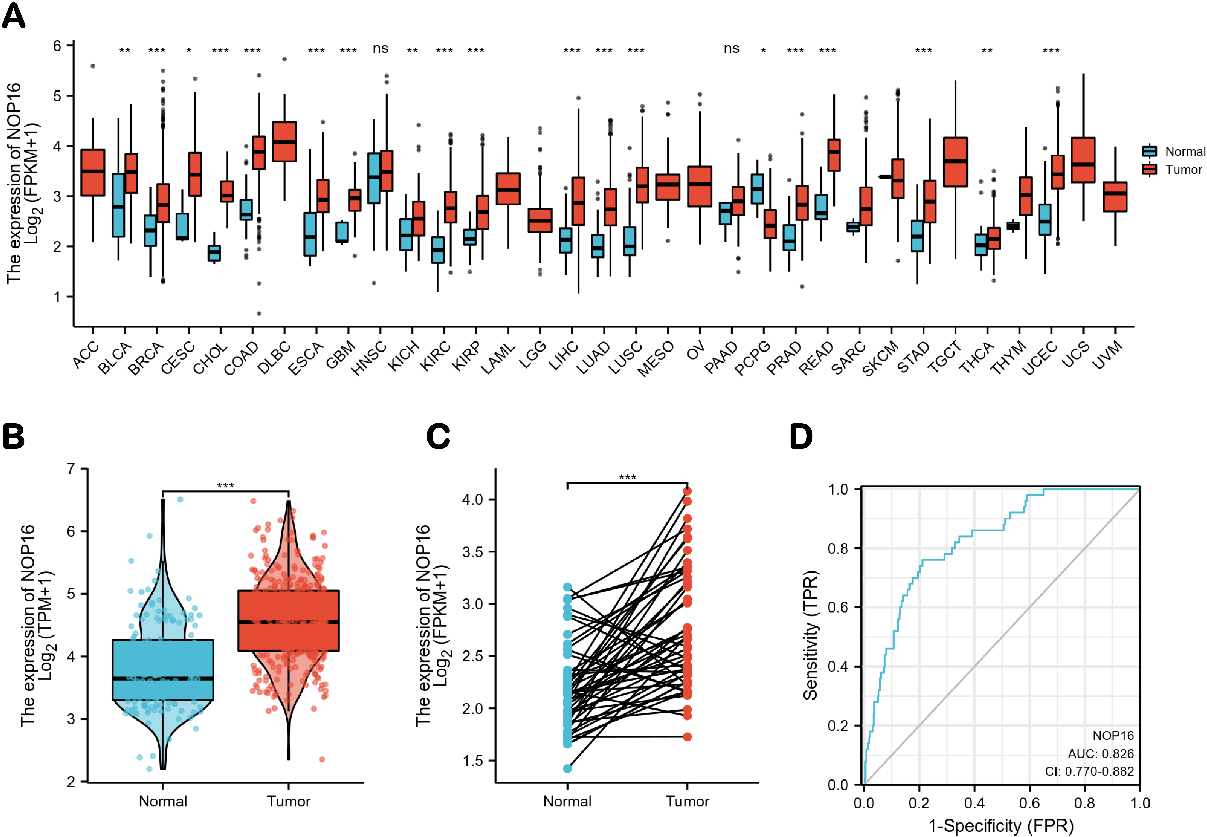
Figure 2.
Representative images of NOP16 expression in LIHC tissues and normal tissues. Images of immunohistochemistry staining for LIHC and normal tissues were collected with HPA. The greater the antigen content (representing the level of protein expression) and the higher the distribution density, the stronger the positive result color rendering. According to the degree of colorrendering of positive markers, they are classified as: blue, negative; light yellow, weaklypositive; brown, moderately positive; and dark brown, strongly positive.
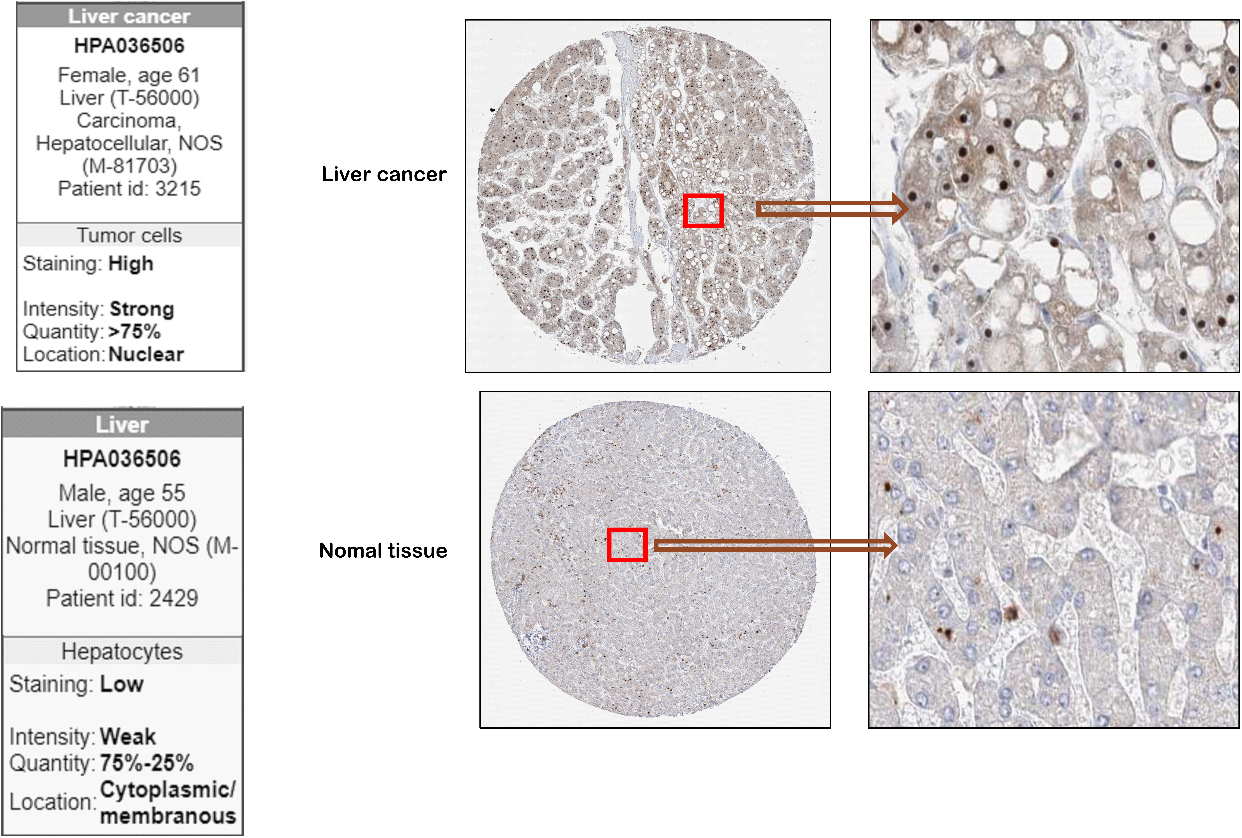
To further identify the expression of NOP16 at the LIHC protein level, we used the HPA database. The NOP16 histochemical antibody (No. HPA036506) showed primary staining in the nucleus. The results showed that the positive expression area and positive intensity of NOP16 in LIHC tissues (
3.2Association between NOP16 expression and clinicopathological variables
The 375 primary tumors collected from TCGA included clinical features and gene expression data. Patient characteristics included gender, race, differentiation, TNM stage, pathological stage, initial treatment, histological type, tumor anatomical site division, TP 53 and PIK3CA status. The analysis showed that high expression of NOP16 was significantly associated with gender (
3.3Identification of differentially expressed genes (DEGs) in LIHC and functional enrichment analysis, including GO, KEGG, and GSEA
There were 1580 significantly different genes, which were used to analyse the differential expression of NOP16 (high expression group and low expression group). A total of 758 (47.9%) genes were upregulated, and 826 (52.1%) genes were downregulated (adjusted
Figure 3.
NOP16-related differentially expressed genes (DEGs) and functional enrichment analysis of NOP16 in glioma using GO and KEGG. (A) Volcano plot of DEGs. Blue and red dots indicate the significantly downregulated and upregulated DEGs, respectively. (B) Heatmap of the coexpression of NOP16 and immune-related genes. (C) GO and KEGG analysis of DEGs. (GO, Gene Ontology; KEGG, Kyoto Encyclopedia of Genes and Genomes; DEGs, differentially expressed genes. *p < 0.05, **p < 0.01, and ***p < 0.001.)
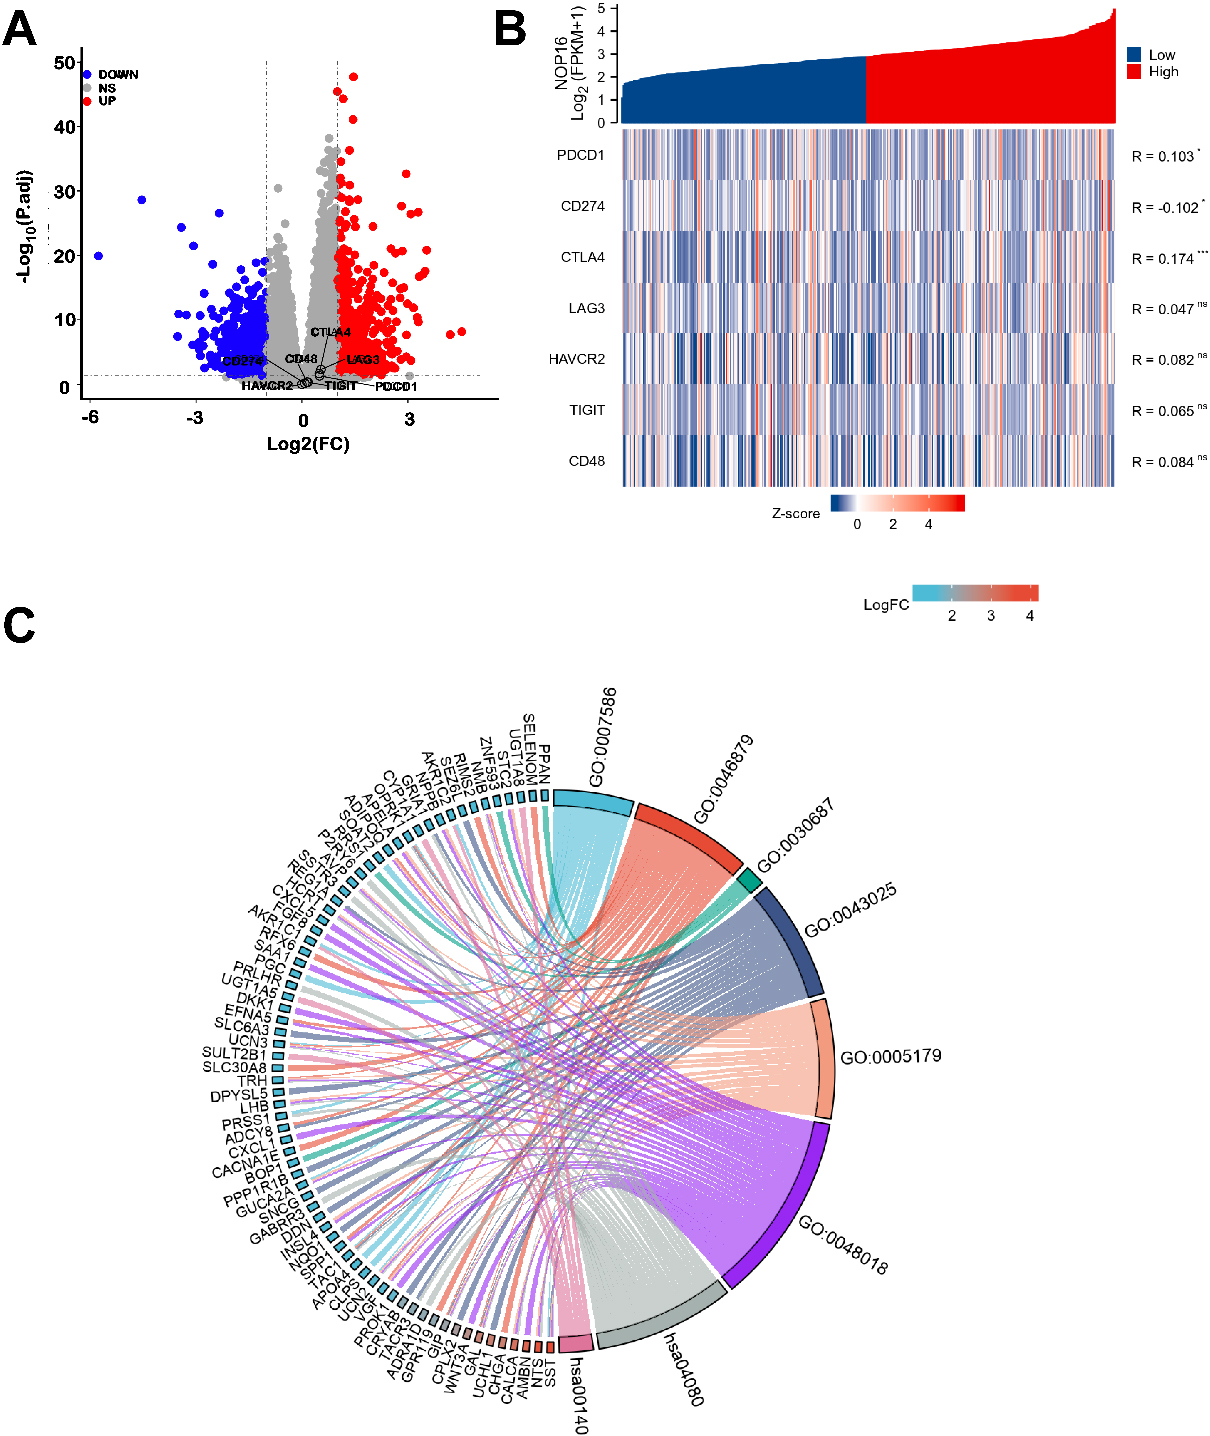
GO enrichment analysis, including biological processes, cellular compositions, and molecular functions, revealed that DEGs were enriched in different GO terms, such as extracellular matrix disassembly, chromatin assembly, nucleosome, protein-DNA complex, ion gated channel activity, and gated channel activity. KEGG pathway analysis showed that significantly DEG-enriched pathways included neuroactive ligand-receptor interaction and steroid hormone biosynthesis (Fig. 3C and Table 2). GSEA enrichment analysis between the NOP16 high and low expression groups revealed a significant enrichment of biological processes, such as the cell cycle and reactive oxygen species metabolism process, which suggest that NOP16 regulates LIHC occurrence and development via the oxidative stress pathway (Fig. 1B).
Table 2
Cox proportional hazards regression analyzed the association of NOP16 expression levels and OS prognosis in LIHC patients
| Characteristics | Total (N) | Univariate analysis | Multivariate analysis | ||
|---|---|---|---|---|---|
| Hazard ratio (95% CI) | Hazard ratio (95% CI) | ||||
| T stage | 370 | ||||
| T1 | 183 | Reference | |||
| T2 | 94 | 1.428 (0.901–2.264) | 0.129 | 0.000 (0.000–Inf) | 0.996 |
| T3 and T4 | 93 | 2.949 (1.982–4.386) |
| 0.722 (0.097–5.401) | 0.751 |
| N stage | 258 | ||||
| N0 | 254 | Reference | |||
| N1 | 4 | 2.029 (0.497–8.281) | 0.324 | ||
| M stage | 272 | ||||
| M0 | 268 | Reference | |||
| M1 | 4 | 4.077 (1.281–12.973) | 0.017 | 7.439 (0.582–95.117) | 0.123 |
| Weight | 345 | ||||
| | 184 | Reference | |||
| | 161 | 0.941 (0.657–1.346) | 0.738 | ||
| Pathologic stage | 349 | ||||
| Stage I | 173 | Reference | |||
| Stage II | 86 | 1.417 (0.868–2.312) | 0.164 | 9699232.960 (0.000–Inf) | 0.996 |
| Stage III | 85 | 2.734 (1.792–4.172) |
| 4.391 (0.572–33.718) | 0.155 |
| Stage IV | 5 | 5.597 (1.726–18.148) | 0.004 | ||
| Tumor status | 354 | ||||
| Tumor free | 202 | Reference | |||
| With tumor | 152 | 2.317 (1.590–3.376) |
| 1.961 (1.226–3.135) | 0.005 |
| Age | 373 | ||||
| | 177 | Reference | |||
| | 196 | 1.205 (0.850–1.708) | 0.295 | ||
| Histologic grade | 368 | ||||
| G1 | 55 | Reference | |||
| G2 | 178 | 1.162 (0.686–1.969) | 0.576 | ||
| G3 | 123 | 1.185 (0.683–2.057) | 0.545 | ||
| G4 | 12 | 1.681 (0.621–4.549) | 0.307 | ||
| BMI | 336 | ||||
| | 177 | Reference | |||
| | 159 | 0.798 (0.550–1.158) | 0.235 | ||
| AFP (ng/ml) | 279 | ||||
| | 215 | Reference | |||
| | 64 | 1.075 (0.658–1.759) | 0.772 | ||
| Gender | 373 | ||||
| Female | 121 | Reference | |||
| Male | 252 | 0.793 (0.557–1.130) | 0.200 | ||
| Adjacent hepatic tissue inflammation | 236 | ||||
| None | 118 | Reference | |||
| Mild&severe | 118 | 1.194 (0.734–1.942) | 0.475 | ||
| NOP16 | 373 | ||||
| Low | 187 | Reference | |||
| High | 186 | 1.462 (1.034–2.068) | 0.032 | 1.763 (1.115–2.790) | 0.015 |
3.4Effect of NOP16-siRNA interference on the Keap-Nrf2 signalling pathway in HepG2 cells
To verify the role of NOP16 in the occurrence and development of HCC, we designed three siRNAs to inhibit NOP16 expression in HepG2 cells. The interference efficiency of NOP16 was verified using real-time q-PCR and Western blotting (WB). The results showed that interference with siRNA-3 increased the NOP16 interference efficiency greater than 50% in HepG2 cells (Fig. 4A and B). Therefore, we selected siRNA-3 for the subsequent cellular function experiments.
Figure 4.
The decrease in NOP16 leads to abnormal expression of the Keap1-Nrf2 signalling pathway. (A–B)
siRNA interfered with the expression of NOP16 in HepG2 cells, and mRNA and protein levels were
measured using q-PCR (A) and WB, respectively (B). (C–D) siRNA3 interfered with the expression
of NOP16 and affected the Keap1-Nrf2 pathway. q-PCR (C) and WB (D) were used to detect its expression.
The full name of the protein involved in Fig D is as follows: Keap1 (kelch like ECH associated protein
1), Nrf2 NRF2 (Nuclear Factor erythroid 2-Related Factor 2), GCLC (Recombinant Glutamate Cysteine
Ligase, Catalytic), NQO1 (NAD (P) H: quinoneoxidoreductaseNQO1), GCLM (Recombinant Glutamate Cysteine
Ligase, Modifier Subunit), HO-1 (NAD (P) H: quinoneoxidoreductaseNQO1)
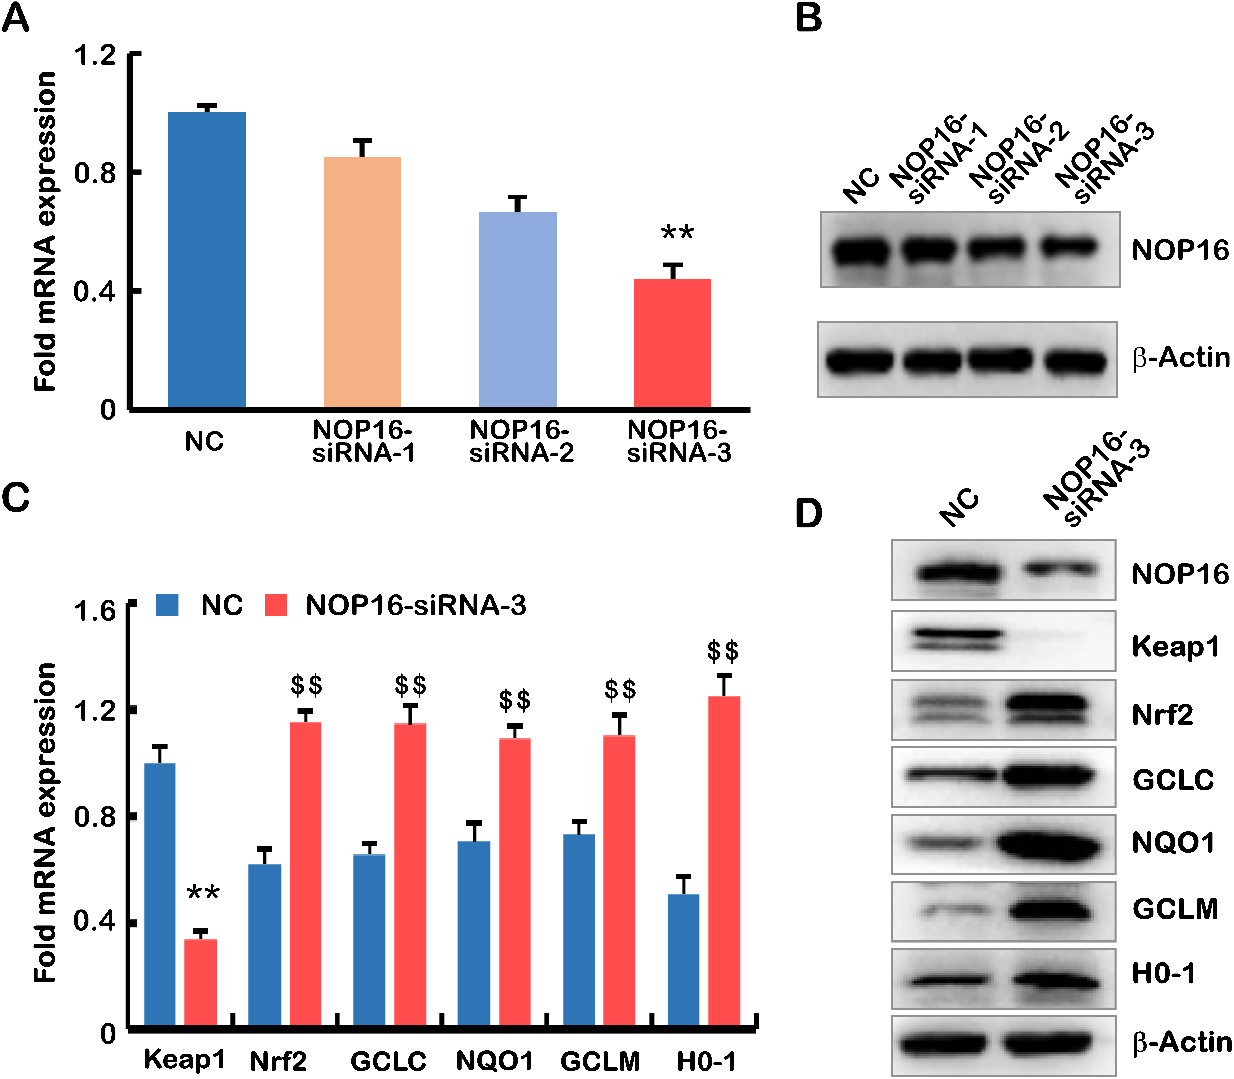
Keapl-Nrf2 is the most important endogenous antioxidative stress pathway discovered in recent years [1]. Nrf2 is a key regulator of the oxidant/antioxidant balance and is primarily activated in response to oxidative stress. Because of the enrichment of NOP16 in the oxidative stress pathway, q-PCR and WB were used to detect key genes in the Keap1-Nrf2 signalling pathway. The results showed that Keap1 decreased significantly compared to negative results, and Nrf2, GCLC, NQO1, GCLM and H0-1 were significantly higher in the NOP16-siRNA-3 group than the negative controls (
3.5Functional validation of NOP16 in HepG2 cells
The decreased expression of NOP16 caused abnormal expression of the Keap1-Nrf2 pathway (Fig. 4C and D). Abnormal expression of the Keap1-Nrf2 pathway leads to abnormalities in cell infection, migration, the cell cycle and apoptosis [15]. To define the biological function of NOP16 in HepG2 cells, Transwell and cell scratch experiments were used to examine the effect of NOP16 on cell migration. The Transwell experiments showed that decreased NOP16 expression reduced cell invasiveness (
Figure 5.
Analyses of cell migration, wound healing, cell cycle and apoptosis. (A) Transwell migration assays. The polycarbonate film stained with crystal violet was photographed on an inverted microscope. The number of cells that migrated across the membrane in NC and NOP16-siRNA-3 cells was calculated. (B) The number of infected cells in each NC and NOP16-siRNA-3 cell line was calculated according to the infected cell chart in Fig. A. (C–E) Wound healing assay. (C) NC and NOP16-siRNA-3 cells covering the bottom of the small dish were scratched with the tip of 10
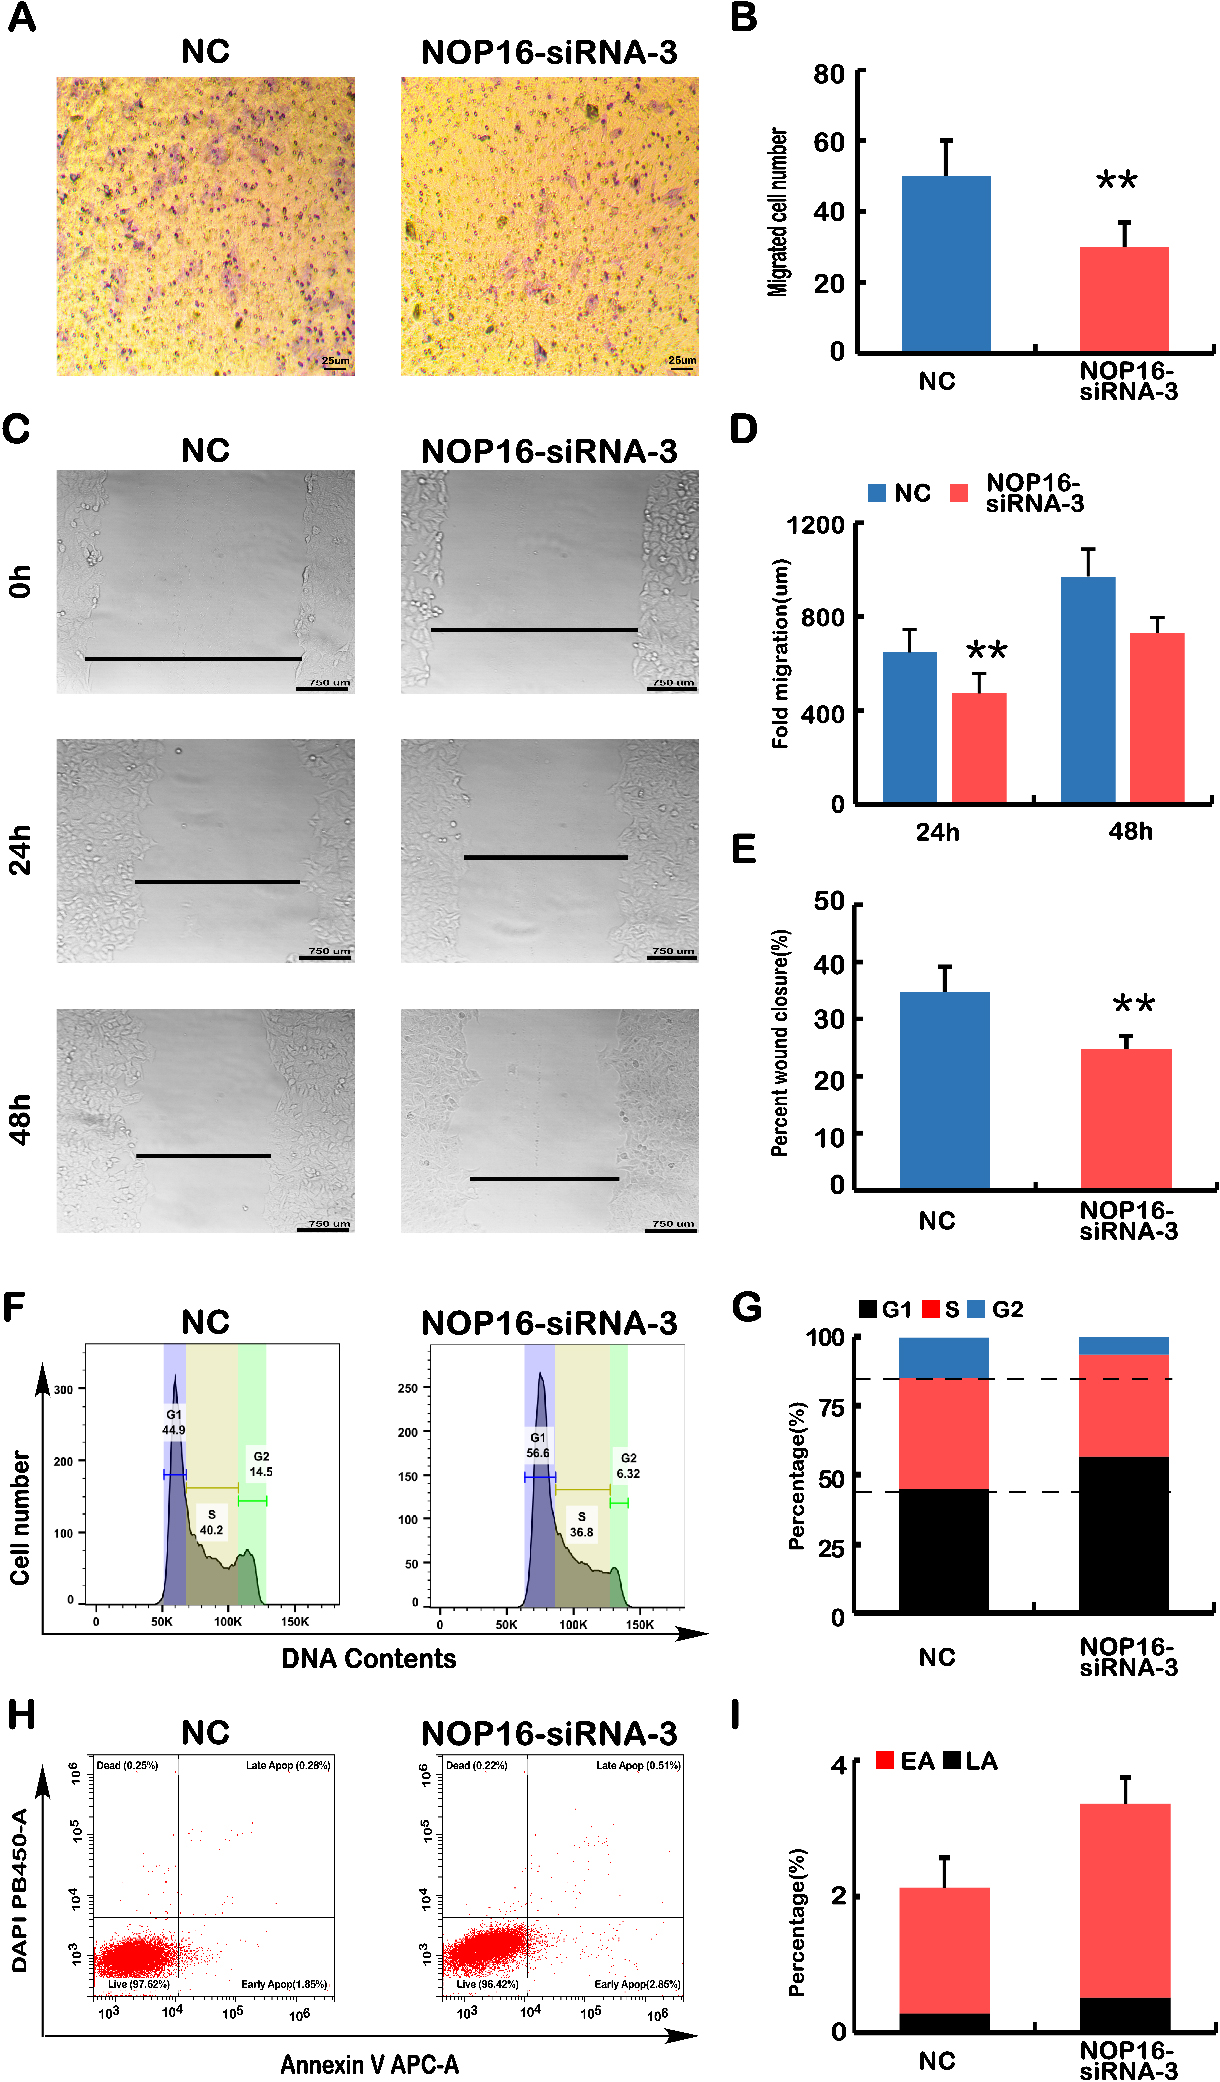
3.6NOP16-siRNA leads to the dysregulation of genes that control the cell cycle and apoptosis
The above results indicated that the silencing of NOP16 led to phenotypic changes in cell behaviour, such as the invasive capacity of the cells, migration, cell cycle, and apoptosis. Therefore, we examined key genes controlling cellular processes and behaviour using real-time q-PCR and WB.
The mRNA expression levels of key genes in EMT progression were determined using q-PCR. The results showed that the relative expression levels of CTNNA1, CTNNB1, and CDH1 were significantly higher in the NOP16-siRNA group than the negative control group. However, the relative expression levels of SNAl1, SNAl2, CDH2, FNT1, MMP17, MMP9, and vimentin were significantly higher than the negative controls (Fig. 6A) (
Figure 6.
Decreased NOP16 results in abnormal expression of genes typical for EMT, the cell cycle and
apoptosis. (A) Q-PCR was used to detect the mRNA expression of NOP16, CTNNA1, CTNNB1,
SNAI1, SNAI2, CDH1, CDH2, FN1, MMP17, MMP9 and vimentin in
NC and NOP16-siRNA-3 cells. (B) WB was used to detect the protein
expression of NOP16 SNAI2, CDH2, FN1,
MMP9 and vimentin in NC and
NOP16-siRNA-3 cells. (C) Q-PCR was used to detect the mRNA expression of
P53, P21, CDK2, CDK6 and cyclinD1 in NC and
NOP16-siRNA-3 cells. (D) Quantitative real-time PCR was used to detect the mRNA
expression of CASP3 CASP4 CASP6 BCL2 and BCL2L1 in
NC and NOP16-siRNA-3 cells.
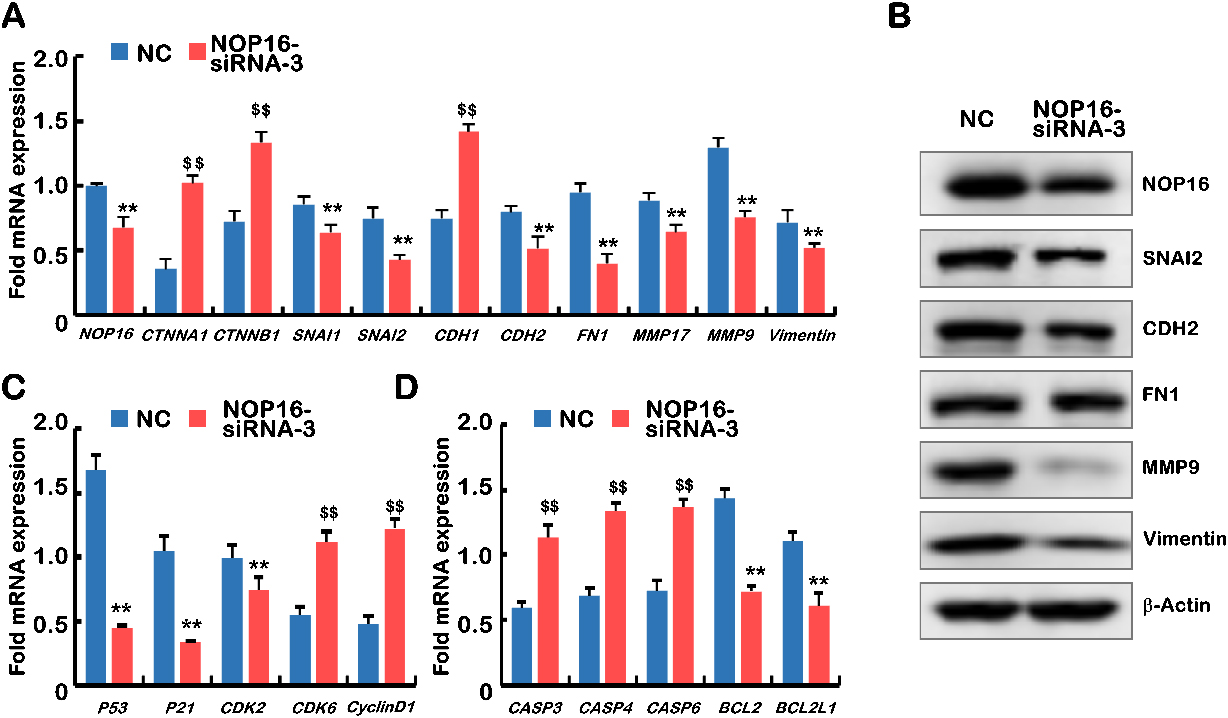
Figure 7.
Prognostic values of NOP16 expression in patients with LIHC evaluated using the Kaplan-Meier method. Overall survival (A) and disease-specific survival (B) for LIHC patients with high versus low NOP16. (C) Forest map based on multivariate Cox analysis for overall survival. HR, hazard ratio; CI, confidence interval.
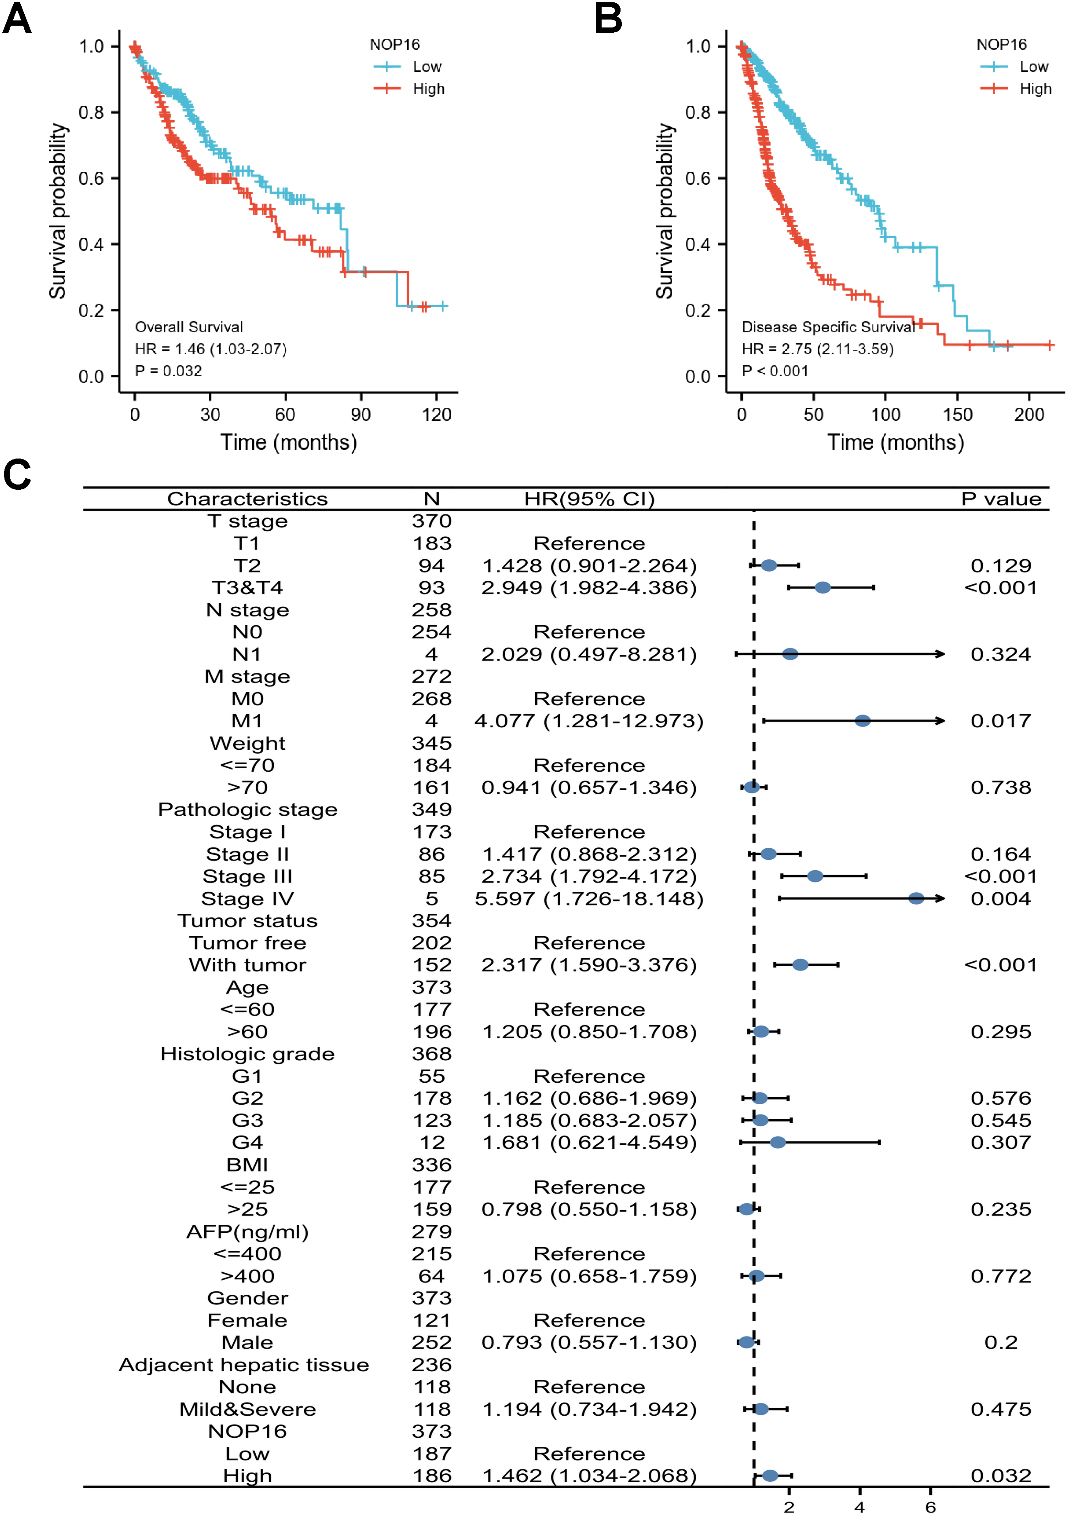
Figure 8.
A nomogram and calibration curves for prediction of one-, three-, and five-year overall survival rates of patients with LIHC. (A) A nomogram for the prediction of one-, three-, and five-year overall survival rates of patients with LIHC. (B–D) Calibration curves of the nomogram prediction of one-, three-, and five-year overall survival rates of patients with LIHC.
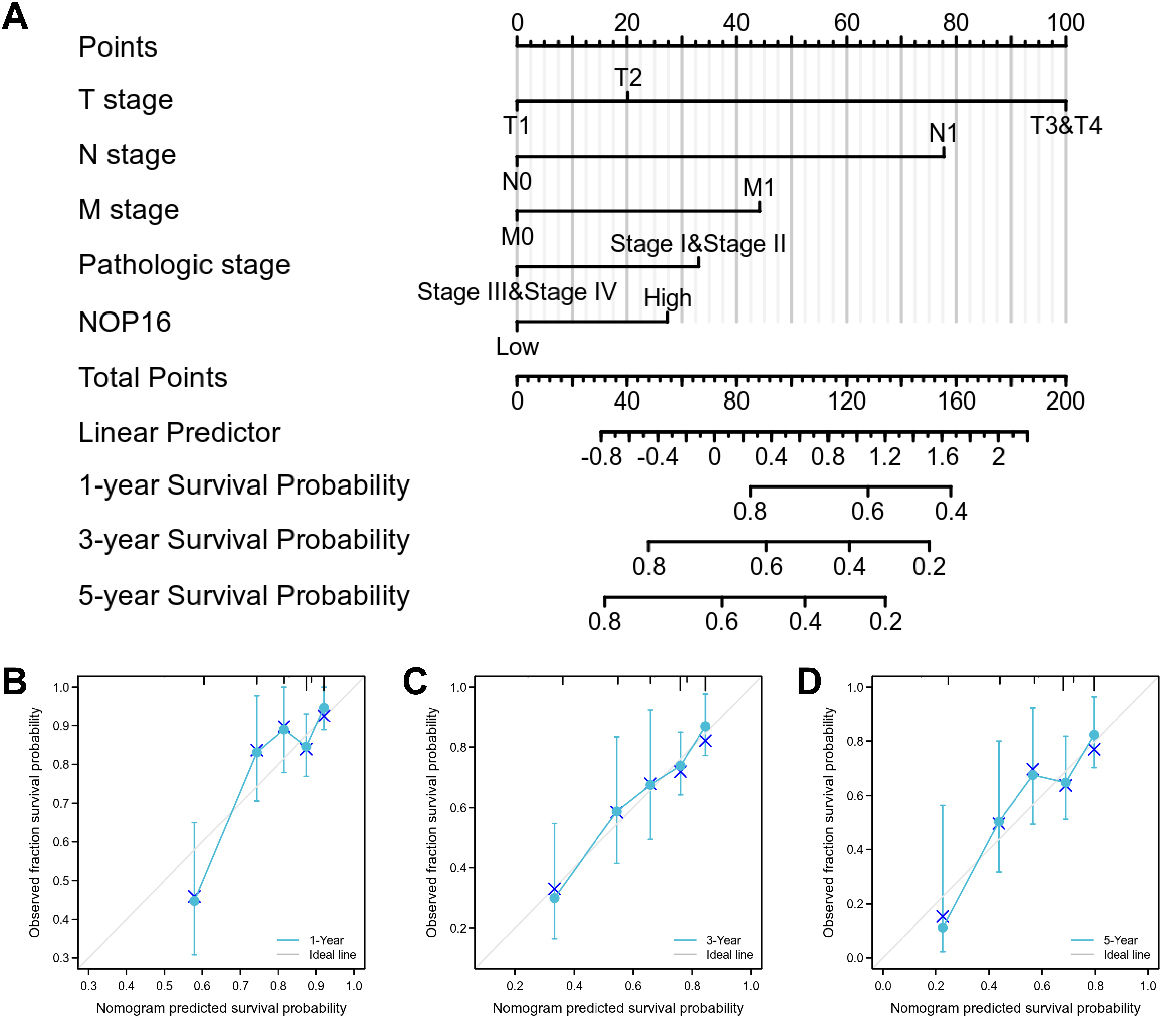
Figure 9.
Immune cell type-specific expression of NOP16 in LIHC. (A) Proportion of 12 major cell lines; (B) sorted cells in the gland-labelled set; (C–D) expression of NOP16 in different cell subsets; (E) score of the corresponding pathway for each cell subset.
The effect of NOP16 on the mRNA expression levels of cell cycle regulators was further examined. The results showed that the relative cyclinD1 expression level of cyclin-dependent kinase 6 (CDK6) in the NOP16-siRNA group was significantly higher than the negative control group. However, the relative expression levels of p53, p21 and CDK2 were significantly lower than the negative controls (
We also examined the mRNA expression levels of apoptosis-related genes, and the results suggested that the relative expression levels of Casp3, Casp4 and Casp6 in the NOP16-siRNA group were significantly higher than the negative control group. However, the expression levels of BCL-2 and BCL2L1 were significantly lower than the negative controls (all Ps
3.7The prognostic value of NOP16 in LIHC therapy
The correlation between NOP16 expression and the prognosis of LIHC patients was calculated using the Kaplan-Meier method. Patients were divided into high and low NOP16 expression groups using the median NOP16 expression as the cut-off value. OS and DSS in NOP16 showed significantly poor prognosis (OS: hazard ratio [HR]
3.8Construction and verification of the nomogram based on independent factors
Since disease stage is a golden indicator of prognosis, more accurate results would be obtained if the expression status of NOP 16 and pathological stage were combined to jointly predict the patient outcome. Different clinicopathological factors were assigned to the corresponding cut-off values, adding up to obtain the total score, and finally the 1-, 3-, and 5-year survival rate of each HCC patient were evaluated based on the total score. A higher total score on the nomogram indicates a worse prognosis. The expression level of NOP 16 had relatively little effect on the total score (Fig. 8A). Nomograms were drawn with 1000 isoback replicates by Bootstrap (Fig. 8B and C). The results showed that the bootstrap-corrected c-index of the nomogram was 0.671 (95% CI
3.9NOP16 expression correlated with T-lymphocyte infiltration in LIHC
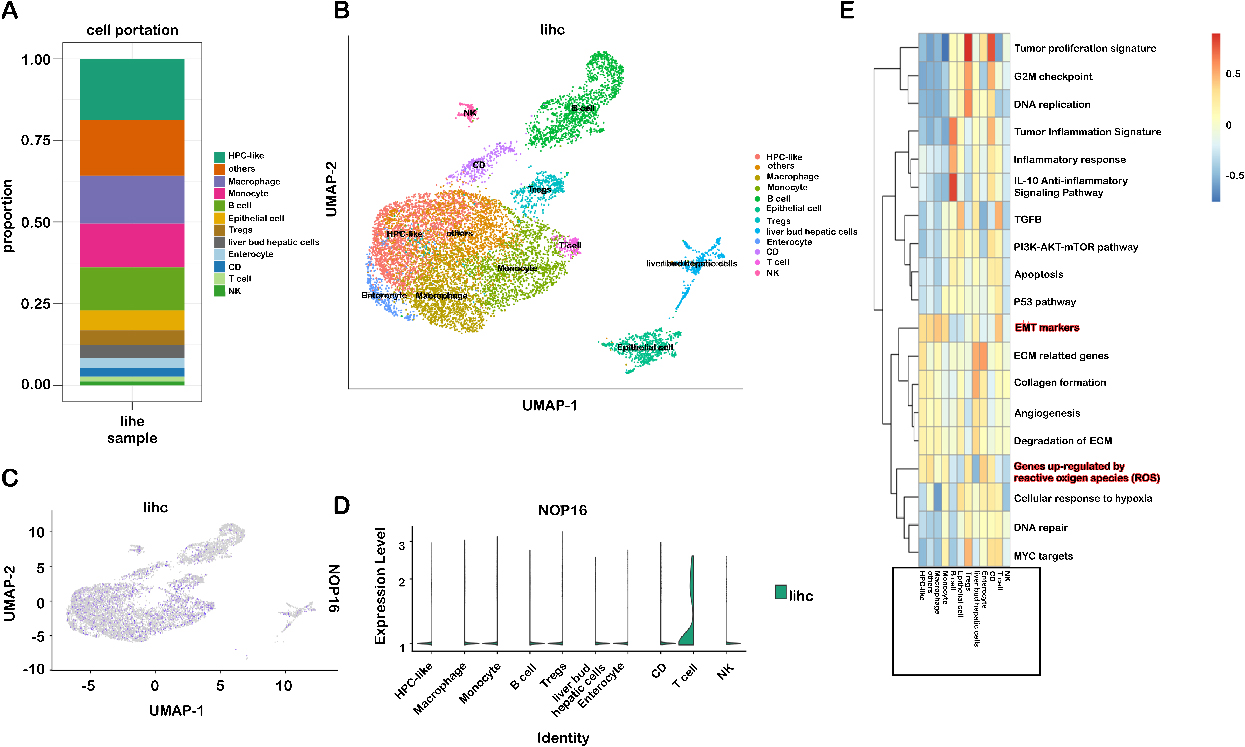
Immune cells play a role in inducing EMT and promoting tumor metastasis. The various immune cells that accumulate in the tumor stroma interact with neighboring cancer cells to activate the previously dormant EMT progression [17]. Therefore, this study further analyzed the subsets of immune cells responsible for the upregulation of NOP 16 expression. To identify cell types expressing NOP16, we used single-cell RNA sequencing data, GSE112271, from all seven hepatocellular carcinoma samples. We used a canonical marker set to classify the cells into 12 major cell lines (Fig. 9A and B), HPLC-like (e.g., tumour-associated hepatic progenitor cells, epithelial cells, liver bud hepatic cells, enterocytes and other immune cells (e.g., NK cells, B cells, CD cells, monocytes, Treg cells, and giant cells) are uncommon cell types. NOP16 was particularly highly expressed in T cells (Fig. 9C and D).
We downloaded the LlHC scRNA sequencing data and analysed the pathways enriched by NOP16. The results suggested that EMT markers and genes upregulated by reactive oxygen species (ROS) were significantly enriched (Fig. 9E). This result is highly consistent with our previous experimental results.
4.Discussion
NOP16 is a nucleolus protein that, together with many other nucleolus proteins, constitutes the ribosomal functional family that plays a role in the synthesis of the large subunit of the cellular ribosome and contains RNA [6, 7, 19]. There is a c-Myc binding site on the NOP16 promoter. The transcriptional regulation of c-Myc directly regulates the expression level of NOP16. Therefore, it is also regulated by the transcriptional regulation of the oncogene c-Myc [19].
Butt et al. [19] combined their previous study with experimental results and found that NOP 16 expression level was upregulated in breast cancer tissues, while oncogene c-Myc was also increased [20, 21], and the increased expression level of NOP16 predicted poor prognosis in breast cancer [21]. Related studies found that NOP16 expression was significantly increased in prostate cancer tissues [6, 22, 23, 24]. Further studies showed that NOP16 expression was higher in tumours with liver metastasis [25] and metastatic nasopharyngeal carcinoma [26] with other diseases. However, the biological function and prognostic correlation of the NOP16 gene in LIHC have not been reported. The present study reported the following findings for the first time: NOP16 mediated the Keapl-Nrf2 signalling pathway, which created an imbalance in the oxidative stress response and led to tumour development.
The TCGA database analysis showed that NOP16 expression was significantly upregulated in 20 species, including LIHC, which is consistent with previous studies. High NOP16 expression was associated with unfavourable clinicopathological factors, such as histological grade and sex. The univariate and multivariate Cox analysis suggested that elevated NOP16 expression served as an independent prognostic biomarker for poor OS and DSS in LIHC patients. Combined with previous study results, NOP16 may be a potential target in the treatment of LIHC.
Many studies confirmed that NOP16 interfered with ribosome biosynthesis processes, and this effect is achieved via coordination with RTCD1. RTCD1 is a phosphocyclase that acts as a catalytic enzyme involved in the biosynthesis of ribosomes [8]. The assembly process of ribosome-sized subunits determines the protein synthesis process of tumour cells, which is also related to tumour development and invasion [27]. However, these results do not fully elucidate the mechanism of NOP16 action in LIHC, and further efforts are needed to investigate the biological function of NOP16 and its signalling pathways. We performed GSEA and found that the signalling pathways significantly enriched in the high NOP16-expression group included M phase, reactive oxygen species metabolic process, ethanol oxidation, response to steroids, and regulation of reactive oxygen species metabolic process. These results suggested that NOP16 regulated LIHC occurrence and development via the oxidative stress pathway.
The Keapl-Nrf2 signalling pathway plays an important role in the response to oxidative stress [28]. In a normal physiological state, Nrf2 and Keap1 exist as a complex in the cytoplasm and maintain a low level of inactive steady-state [29]. After activation, Nrf2 dissociates from Keap1 and enters the nucleus, which activates the expression of various host genes, including genes downstream of HO-1, GCLC and COX-2 [30, 31, 32, 33]. HO-1 attenuates heme-mediated oxidative stress, and it is an important defensive factor against oxidative damage [31]. GCLC is a subunit of glutamate-cysteine ligase (GCL), which exerts its antioxidant effects by regulating the expression of GSH [32]. A NOP16 low-expression osteosarcoma cell line was successfully constructed via the transfection of HepG2 cells with siRNA and studied in vitro in the present study. After interfering with NOP16 expression, Keap1 expression levels were significantly reduced in HepG2 cells, and the levels of Nrf2, GCLC, NQO1, GCLM, and HO-1 were increased. These results indicated that the inhibition of NOP16 activated the Keap1-Nrf2 signalling pathway.
The Transwell and cell scratch assays showed that the NOP16 group-siRNA group had significantly decreased migration and invasion ability compared to the control group. The Transwell and cell scratch assays showed that the NOP16-siRNA group had a significantly reduced ability to migrate and invade compared to the control group. Flow cytometry showed that NOP16-siRNA promoted HepG2 apoptosis and arrested the cell cycle in G1. To further investigate whether NOP16 induced EMT in HepG2 cells, q-PCR and Western blot experiments showed that interference with NOP16 caused an increase in E-cadherin expression and decreased the expression of the stromal phenotype markers SNAI2, vimentin and MMP9 [34, 35, 36]. These results demonstrated an increased epithelial phenotype of the cells. Experiments confirmed that NOP16 participated in EMT in HepG2 cells. EMT is the trans-differentiation process of quiescent epithelial cells into stromal cells, and it is an irreversible cellular program. An increasing number of experiments confirmed that EMT was associated with the metastatic process of tumours [37]. A recent study found that cancer-derived exosomal HSPC111 (NOP16) promoted colorectal cancer liver metastasis by reprogramming lipid metabolism in cancer-associated fibroblasts [25]. These results suggest an important role for NOP16 in cancer cell invasion and migration, and we speculate that these roles are related to the key genes regulated by NOP16 in some EMT processes.
Kaplan Meier survival analysis found that patients with high expression of NOP16 had shorter overall survival and worse prognosis. The combination of univariate and multivariate analyses showed that NOP16 expression may be used as an independent prognostic factor for patients with LIHC.
Immune cells also play a role in inducing EMT and in promoting tumor metastasis. The various immune cells that accumulate in the tumor stroma interact by interacting with neighboring cancer cells to activate previously latent dormant EMT progression. It was shown that E-cadherin expression after in vitro co-culture with activated effector T cells is absent in pancreatic ductal epithelial cells and epithelial cells acquire a spindle-shaped interstitial morphology with concurrent expression of vimentin and ZEB1 [38]. It was also found that CD8
5.Conclusion
The present study showed for the first time that NOP16 promoted cell migration by regulating EMT-related protein expression levels in HepG2 cells. Interference with NOP16 inhibited the oxidative stress response by upregulating molecular expression and activation of the Keap1-Nrf2 pathway, including the downstream target genes antioxidant metabolic enzymes HO1 and GCLC. Regulation of NOP16 expression or other EMT transcription-related factors may help delay or reverse the metastasis or deterioration of LIHC. These results further our understanding of the pathogenesis of LIHC.
Funding
The study was supported by the Key Laboratory of Sports Medicine of Sichuan Province (Fund item and number: 2023-A008).
Data availability statement
The authors of this work agree to make data and materials supporting the results or analyses presented here available upon reasonable request.
Supplementary data
The supplementary files are available to download from http://dx.doi.org/10.3233/THC-231256.
Acknowledgments
We are grateful to Qiusi Tian (3201 Hospital) for providing guidance on this clinical data analysis.
Conflict of interest
The authors declare no conflict of interest.
References
[1] | WHO. Global Health Estimates 2020: Deaths by Cause, Age, Sex, by Country and by Region, 2000–2019. (2021) . |
[2] | Wang FS, Fan JG, Zhang Z, Gao B, Wang HY. The global burden of liver disease: Te major impact of China. Hepatology. (2014) ; 60: : 2099-2108. |
[3] | Yang JD, Hainaut P, Gores GJ, Amadou A, Plymoth A, Roberts LR. A global view of hepatocellular carcinoma: Trends, risk, prevention and management. Nature Reviews Gastroenterology & Hepatology. (2019) ; 16: : 589-604. |
[4] | Forner A, Fonseca L, Díaz-González L, Sanduzzi-Zamparelli M, Reig M, Bruix J. Controversies in the management of hepatocellular carcinoma. JHEP Reports. (2019) ; 1: : 17-29. |
[5] | Green AR, Aleskandarany MA, Agarwal D, Elsheikh S, Nolan, CC, Diez-Rodriguez M, Macmillan RD, Ball GR, Caldas C, Madhusudan S. MYC functions are specific in biological subtypes of breast cancer and confers resistance to endocrine therapy in luminal tumours. British Journal of Cancer. (2016) ; 114: : 917-928. |
[6] | Zhang C, Zhang S, Zhang Z, He J, Xu Y, Liu S. ROCK has a crucial role in regulating prostate tumor growth through interaction with c-Myc. Oncogene. (2014) ; 33: : 5582-5591. |
[7] | Gachomo EW, Jimenez-Lopez JC, Baptiste LJ, Kotchoni SO. GIGANTUS1 (GTS1), a member of Transducin/WD40 protein superfamily, controls seed germination, growth and biomass accumulation through ribosome-biogenesis protein interactions in Arabidopsis thaliana. BMC Plant Biology. (2014) ; 14: : 1-17. |
[8] | Zhang C, Yin C, Wang L, Zhang S, Qian Y, Ma J, Zhang Z, Xu Y, Liu S. HSPC111 Governs Breast Cancer Growth by Regulating Ribosomal BiogenesisHSPC111 Governs Ribosomal Biogenesis. Molecular Cancer Research. (2014) ; 12: : 583-594. |
[9] | Pelletier J, Thomas G, Volarević S. Ribosome biogenesis in cancer: New players and therapeutic avenues. Nature Reviews Cancer. (2018) ; 18: : 51-63. |
[10] | Orsolic I, Jurada D, Pullen N, Oren M, Eliopoulos AG, Volarevic, S. The relationship between the nucleolus and cancer: Current evidence and emerging paradigms. In Proceedings of the Seminars in cancer biology. (2016) . pp. 36-50. |
[11] | Bywater MJ, Poortinga G, Sanij E, Hein N, Peck A, Cullinane C, Wall M, Cluse L, Drygin D, Anderes K. Inhibition of RNA polymerase I as a therapeutic strategy to promote cancer-specific activation of p53. Cancer Cell. (2012) ; 22: : 51-65. |
[12] | Gentilella A, Kozma SC, Thomas G. A liaison between mTOR signaling, ribosome biogenesis and cancer. Biochimica et Biophysica Acta (BBA)-Gene Regulatory Mechanisms. (2015) ; 1849: : 812-820. |
[13] | Sardaro N, Della Vella F, Incalza MA, Di Stasio D, Lucchese A, Contaldo M, Laudadio C, Petruzzi M. Oxidative stress and oral mucosal diseases: An overview. in vivo. (2019) ; 33: : 289-296. |
[14] | Sajadimajd S, Khazaei M. Oxidative stress and cancer: The role of Nrf2. Current Cancer Drug Targets. (2018) ; 18: : 538-557. |
[15] | Chen F, Xiao M, Feng J, Wufur R, Liu K, Hu S, Zhang Y. Different inhibition of Nrf2 by two Keap1 isoforms α and β to shape malignant behaviour of human hepatocellular carcinoma. International Journal of Molecular Sciences. (2022) ; 23: : 10342. |
[16] | Baird L, Yamamoto M. The molecular mechanisms regulating the KEAP1-NRF2 pathway. Molecular and Cellular Biology. (2020) ; 40: : e00099-00020. |
[17] | Peña-Blanco A, García-Sáez AJ. Bax, Bak and beyond-mitochondrial performance in apoptosis. The FEBS Journal. (2018) ; 285: : 416-431. |
[18] | Lamouille S, Xu J, Derynck R. Molecular mechanisms of epithelial-mesenchymal transition. Nature Reviews Molecular Cell Biology. (2014) ; 15: : 178-196. |
[19] | Kalkavan H, Green DR. MOMP, cell suicide as a BCL-2 family business. Cell Death & Differentiation. (2018) ; 25: : 46-55. |
[20] | Butt AJ, Sergio CM, Inman CK, Anderson LR, McNeil CM, Russell AJ, Nousch M, Preiss T, Biankin AV, Sutherland RL. The estrogen and c-Myc target gene HSPC111 is over-expressed in breast cancer and associated with poor patient outcome. Breast Cancer Research. (2008) ; 10: : 1-14. |
[21] | Radvanyi L, Singh-Sandhu D, Gallichan S, Lovitt C, Pedyczak A, Mallo G, Gish K, Kwok K, Hanna W, Zubovits J. The gene associated with trichorhinophalangeal syndrome in humans is overexpressed in breast cancer. Proceedings of the National Academy of Sciences. (2005) ; 102: : 11005-11010. |
[22] | Richardson AL, Wang ZC, De Nicolo A, Lu X, Brown M, Miron A, Liao X, Iglehart JD, Livingston DM, Ganesan S. X chromosomal abnormalities in basal-like human breast cancer. Cancer Cell. (2006) ; 9: : 121-132. |
[23] | Ishkanian AS, Mallof CA, Ho J, Meng A, Albert M, Syed A, Van Der Kwast T, Milosevic M, Yoshimoto M, Squire JA. High-resolution array CGH identifies novel regions of genomic alteration in intermediate-risk prostate cancer. The Prostate. (2009) ; 69: : 1091-1100. |
[24] | Zhang C, Gao C, Xu Y, Zhang Z. CtBP2 could promote prostate cancer cell proliferation through c-Myc signaling. Gene. (2014) ; 546: : 73-79. |
[25] | Tamura K, Furihata M, Tsunoda T, Ashida S, Takata R, Obara W, Yoshioka H, Daigo Y, Nasu Y, Kumon H. Molecular features of hormone-refractory prostate cancer cells by genome-wide gene expression profiles. Cancer Research. (2007) ; 67: : 5117-5125. |
[26] | Zhang C, Wang X-Y, Zhang P, He T-C, Han J-H, Zhang R, Lin J, Fan J, Lu L, Zhu W-W. Cancer-derived exosomal HSPC111 promotes colorectal cancer liver metastasis by reprogramming lipid metabolism in cancer-associated fibroblasts. Cell Death & Disease. (2022) ; 13: : 1-14. |
[27] | Si J, Huang B, Lan G, Zhang B, Wei J, Deng Z, Li Y, Qin Y, Li B, Lu Y. Comparison of whole exome sequencing in circulating tumor cells of primitive and metastatic nasopharyngeal carcinoma. Translational Cancer Research. (2020) ; 9: : 4080. |
[28] | Crescitelli R, Lässer C, Jang SC, Cvjetkovic A, Malmhäll C, Karimi N, Höög JL, Johansson I, Fuchs J, Thorsell A. Subpopulations of extracellular vesicles from human metastatic melanoma tissue identified by quantitative proteomics after optimized isolation. Journal of Extracellular Vesicles. (2020) ; 9: : 1722433. |
[29] | Ngo V, Karunatilleke N, Song Z, Brickenden A, Krstic M, Choy W-Y, Duennwald M. Oxidative Stress-induced Aggregation of Keap1 Impairs Nrf2 Regulation. Free Radical Biology and Medicine. (2020) ; 159: : S58. |
[30] | Lyakhovich V, Vavilin V, Zenkov N, Menshchikova E. Active defense under oxidative stress. The antioxidant responsive element. Biochemistry (Moscow). (2006) ; 71: : 962-974. |
[31] | Shelton LM, Park BK, Copple IM. Role of Nrf2 in protection against acute kidney injury. Kidney International. (2013) ; 84: : 1090-1095. |
[32] | Li C, Cheng L, Wu H, He P, Zhang Y, Yang Y, Chen J, Chen M. Activation of the KEAP1NRF2ARE signaling pathway reduces oxidative stress in Hep2 cells. Molecular Medicine Reports. (2018) ; 18: : 2541-2550. |
[33] | Hasanvand D, Amiri I, Soleimani Asl S, Saidijam M, Shabab N, Artimani T. Effects of CeO2 nanoparticles on the HO-1, NQO1, and GCLC expression in the testes of diabetic rats. Canadian Journal of Physiology and Pharmacology. (2018) ; 96; 963-969. |
[34] | Aminzadeh MA, Reisman SA, Vaziri ND, Khazaeli M, Yuan J, Meyer CJ. The synthetic triterpenoid RTA dh404 (CDDO-dhTFEA) restores Nrf2 activity and attenuates oxidative stress, inflammation, and fibrosis in rats with chronic kidney disease. Xenobiotica. (2014) ; 44: : 570-578. |
[35] | Brabletz S, Schuhwerk H, Brabletz T, Stemmler MP. Dynamic EMT: A multi-tool for tumor progression. The EMBO Journal. (2021) ; 40: : e108647. |
[36] | Wang Y, Hao W, Wang H. miR-557 suppressed the malignant behaviours of osteosarcoma cells by reducing HOXB9 and deactivating the EMT process (Retraction of Vol 49, Pg 230, 2021). Artif Cells Nanomed Biotechnol. (2021) ; 49: : 230-239. |
[37] | Goossens S, Vandamme N, Van Vlierberghe P, Berx G. EMT transcription factors in cancer development re-evaluated: Beyond EMT and MET. Biochimica et Biophysica Acta (BBA)-Reviews on Cancer. (2017) ; 1868: : 584-591. |
[38] | Banyard J, Bielenberg DR. The role of EMT and MET in cancer dissemination. Connective Tissue Research. (2015) ; 56: : 403-413. |
[39] | Goebel L, Grage-Griebenow E, Gorys A, Helm O, Genrich G, Lenk L, Wesch D, Ungefroren H, Freitag-Wolf S, Sipos B, Rocken C, Schafer H, Sebens S. CD4+ T cells potently induce epithelial-mesenchymal-transition in premalignant and malignant pancreatic ductal epithelial cells-novel implications of CD4+ T cells in pancreatic cancer development. OncoImmunology. (2015) ; 4: : e1000083. |
[40] | Kmieciak M, Knutson KL, Dumur CI, Manjili MH. HER-2/neu antigen loss and relapse of mammary carcinoma are actively induced by T cell-mediated anti-tumor immune responses. European Journal of Immunology. (2007) ; 37: : 675-685. |
[41] | Santisteban M, Reiman JM, Asiedu MK, Behrens MD, Nassar A, Kalli KR, Haluska P, Ingle JN, Hartmann LC, Manjili MH, Radisky DC, Ferrone S, Knutson KL. Immune-induced epithelial to mesenchymal transition in vivo generates breast cancer stem cells. Cancer Research. (2009) ; 69: : 2887-2895. |
[42] | Chen Q, Yang D, Zong H, Zhu L, Wang L, Wang X, Zhu X, Song X, Wang J. Growth-induced stress enhances epithelial-mesenchymal transition induced by IL-6 in clear cell renal cell carcinoma via the Akt/GSK-3β/β-catenin signaling pathway. Oncogenesis. (2017) ; 6: : e375-e375. |


