
Digitizing fluid balance monitoring may offer a solution for optimizing patient care
Abstract
BACKGROUND:
Precise fluid balance monitoring is essential for patient treatment, as incorrect fluid balance can lead to disorders.
OBJECTIVE:
This study aimed to assess the accuracy of the digital technology LICENSE (LIquid balanCE moNitoring SystEm) for fluid balance charting and compare it to the standard method (SM) to determine its usability in clinical practice.
METHODS:
This prospective study included 20 patients. The results from LICENSE were compared to those from SM and a reference measurement (manual weight of fluids, RM). Three LICENSE devices were used for urine output, intravenous fluids, and oral fluid intake. The accuracy of methods was evaluated using Bland Altman plots.
RESULTS:
The mean difference between LICENSE and RM was less than 2 millilitres (
CONCLUSION:
LICENSE is comparable to or more accurate than the standard method for fluid balance monitoring. The use of LICENSE may improve the accuracy of fluid balance measurements. Further research is needed to evaluate its feasibility in daily clinical practice.
1.Introduction
Innovations in healthcare are emerging extensively, and the advancements regarding monitoring devices have increased accuracy and enabled continuous and remote monitoring [1, 2, 3, 4]. Innovations contribute to new knowledge, improve treatment options and change the work processes of nurses and physicians by introducing digital technologies demanding the development of digital skills [5]. However, many innovations are never implemented in clinical practice, and estimates of failure rates range from 30% to 90% [6]. This emphasizes that although the innovation process can be described as linear, it is often cyclical or unplanned [7].
In a hospital setting, the maintenance of fluid balance is a critical component of patient care, as disturbances in fluid balance can lead to serious medical conditions [8]. Overhydration and dehydration can have detrimental effects on a patient’s health, including increased morbidity and mortality [9, 10], prolonged hospitalization [11, 12, 13], and adverse outcomes such as falls, urinary tract infections, and constipation [14]. Thus, there is a need for precise and continuous measurement of fluid balance to ensure prompt and appropriate clinical intervention [8, 15].
However, the quality of fluid balance charting is inadequate, which is problematic. A systematic literature review highlights the persistent inaccuracy in fluid balance monitoring despite knowledge of its significance [16]. Nursing staff currently observe fluid intake and output and document it using paper-based fluid balance charts or electronic patient records, however, this practice is flawed [17, 18, 19] and prone to calculation errors [20, 21, 22].
Multiple interventions have been researched to enhance fluid balance monitoring by incorporating various components such as policies, education, equipment, visual aids, surveillance, and dissemination of results. However, most studies were unsuccessful in achieving a compliance rate of at least 75% of complete fluid balance charts [16]. The difficulty in maintaining improvements [23] highlights the need for robust solutions.
Healthcare innovations regarding fluid balance monitoring includes Bioimpedance Spectroscopy Analysis (BIA) used in fluid balance assessments [24, 25, 26] and equipment designed to measure urine output automatically [27, 28, 29], which is valuable when hourly measurement is required. However, existing systems only address one aspect of fluid balance, and knowledge of other parameters such as oral intake is essential for identifying and addressing fluid balance disturbances.
To address these challenges, we have developed a novel monitoring device, LICENSE (LIquid balanCE moNitoring SystEm), which automatically records fluid input and output and transfers data wirelessly to a computer. Our hypothesis is that automating fluid balance charting through LICENSE will reduce human errors, free up time for other nursing tasks, and optimize staff resources.
The aim of this study is to evaluate the precision of LICENSE compared to accurate manual measurements in a relevant environment under controlled conditions and determine its practical application in clinical practice.
2.Methods
This was a prospective observational study conducted between May 2020 and August 2021 in a university hospital in Denmark. The study received ethical approval from the regional Scientific Ethics Committee (ID: SJ-848) and followed all relevant regulations and guidelines, including the Declaration of Helsinki and GDPR rules. Participants were recruited during their hospital admission and met the following inclusion criteria: Catheterized patients in need of fluid balance monitoring, at least 18 years of age and able to provide informed consent.
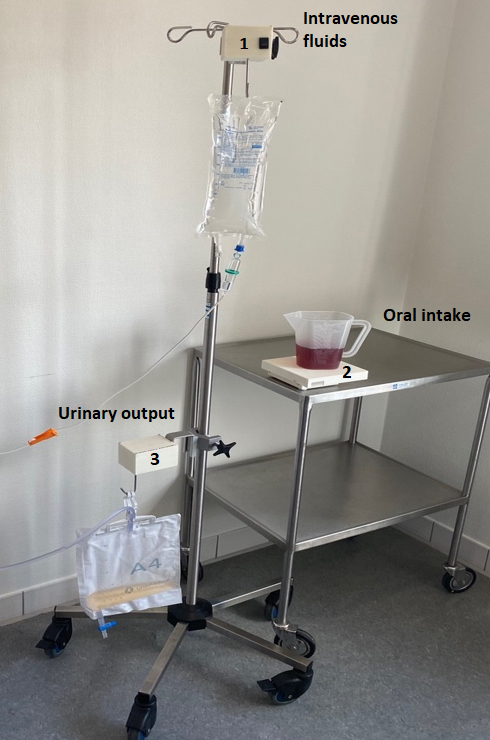
Figure 1.
LICENSE consists of three devices measuring 1) intravenous fluid, 2) oral intake and 3) urinary output.
2.1Digital technology
LICENSE was developed in an interdisciplinary collaboration between engineers, physicians and nurses and consists of three independent measuring devices and a database for storing and analyzing data. The devices include one for measuring intravenous fluids, one for measuring oral fluid intake, and one for measuring urinary output in a catheter (as shown in Fig. 1). Devices measuring intravenous fluids and urinary output are identical except for algorithms interpreting data. These devices weigh 375 g and measure 10
Figure 2.
The graphical user interface displaying data in numbers and graphs. 1) The graphs can display data for up to 10 hours, 2) the large numbers present the volumes of the last hour. 3) Further, you can type in a time period of your choice and 4) LICENSE calculates the total fluid balance for the period.
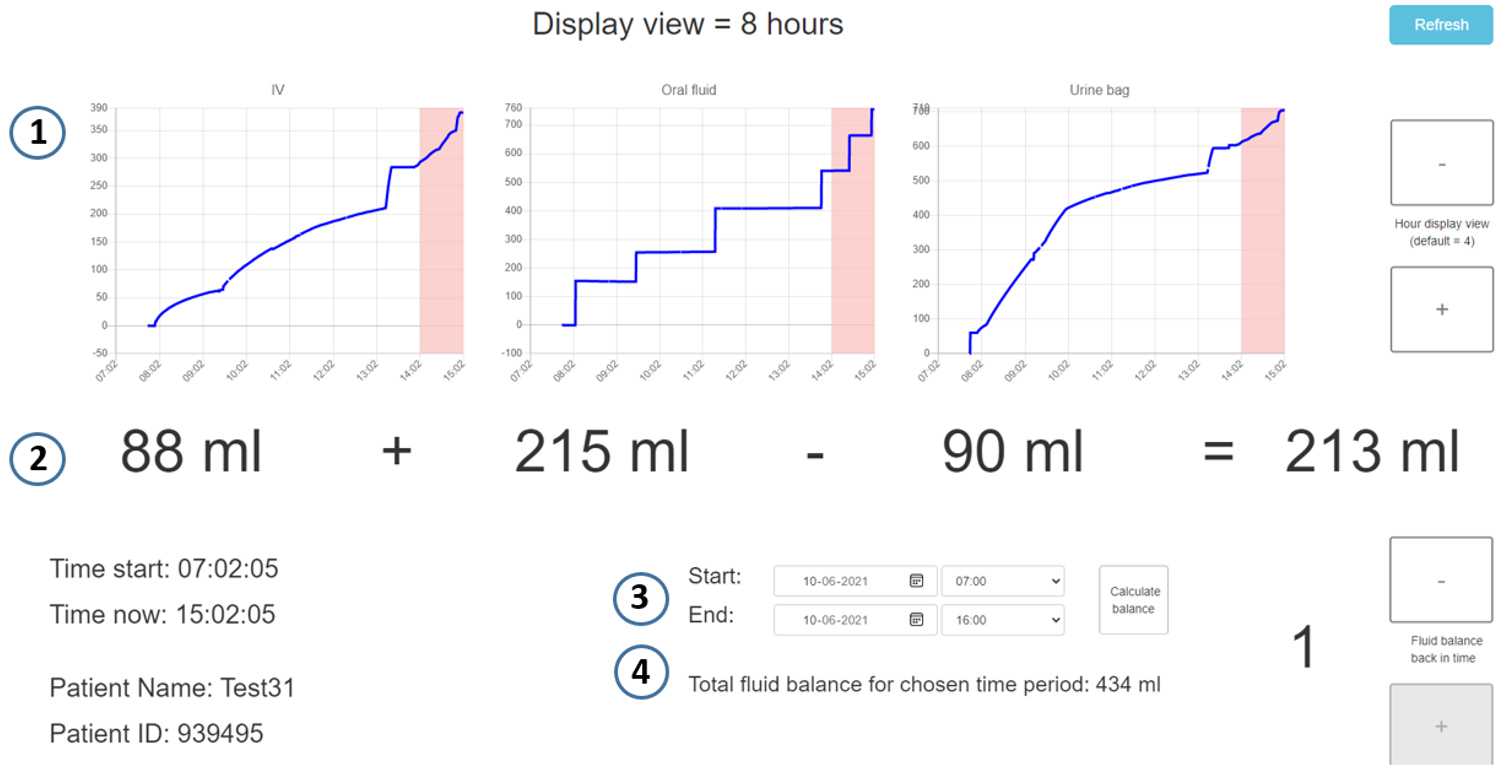
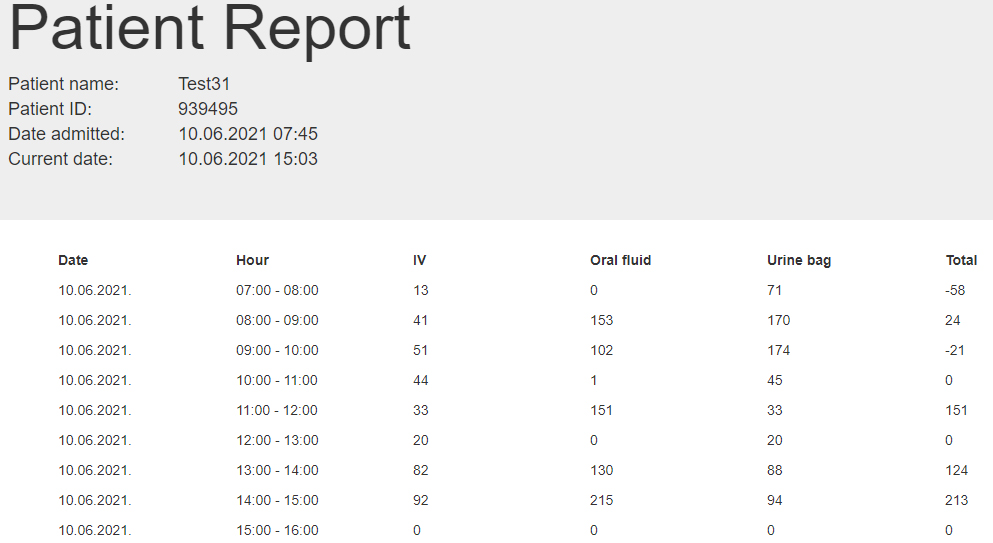
Figure 3.
The Patient Report shows an overview of the intravenous fluids, the oral fluid intake and the urinary output as well as the hourly fluid balance.
2.2Data collection and evaluation of accuracy
Both LICENSE and the standard manual procedure (SM) was compared to a reference measurement (RM). Based on the agreement with RM the accuracy of LICENSE and SM could be compared.
LICENSE was attached to each participant’s drip stand, and we placed the patient’s catheter bag and any intravenous fluid bags on the hooks of the devices. The oral device was placed on the patient’s bedside table. Devices recorded fluid intake and output, and the researchers performed manual measurements every hour. SM was defined as measuring volumes using manual reading from measuring lines on jugs or glasses. The urinary bag was emptied before performing the SM. The intravenous fluids were not measured manually, as it was considered too inaccurate due to imprecise measuring lines on intravenous fluid bags. RM was defined as the weight of the fluids and was performed by weighing fluid on a transportable scale. The exact time of SM and RM were noted, and the data from LICENSE was collected at those same time points for comparison.
The precision of LICENSE was assessed through comparative analysis with RM and SM, the latter involving manual measurements of fluid levels at hourly intervals. The concordance and discrepancies between RM and LICENSE were evaluated, along with the agreement between RM and SM, to establish the accuracy of LICENSE relative to the standard operating procedure. Additionally, LICENSE was appraised in comparison to SM. The distinct devices employed for measuring urine output, oral fluids, and intravenous fluids were subjected to individual evaluations as well.
2.3Statistical analyses
Lu et al. [35] proposed a sample size calculation method for determining the number of participants required, which was employed in this study. The sample size ranged from a required number of pairs of 21 (for intravenous fluids) to 85 (for oral intake). We planned to observe participants for a minimum of five hours, collecting a pair of measurements every hour, leading to a minimum of 20 participants deemed sufficient.
The statistical analysis was conducted using R version 4.1.0 software, and a
The agreement between LICENSE, SM, and RM was evaluated using the Bland-Altman method [32]. The mean bias and limits of agreement (including 95% confidence intervals) were calculated to describe the agreement between the methods. The Bland-Altman plot displays the pair-wise means on the x-axis and pair-wise differences on the y-axis. The mean bias represents the average difference between the methods and should be as close to zero as possible. The limits of agreement (LOA), calculated as bias
3.Results
The study included 20 patients, with a mean age of 76.3 years (SD 12.7), consisting of 18 male and 2 female patients. The patients were monitored for an average of 6.4 hours (SD 1.7). A total of 946 measurements were obtained, of which 341 were through LICENSE, 363 through RM, and 242 through SM. Each device generated between 111 to 124 paired measurements.
The distribution of the measurements was widespread, ranging from 0 to 1300 mL per measurement, with most measurements being less than 200 mL (as indicated in Table 1). The median urine output measured by RM was 72.5 mL/hour (IQR 39.5–121.2 mL) compared to 72.9 mL/hour (IQR 39.7–116.3 mL,
Table 1
Distribution of measurements by quantity
| Reference measurement (RM) | LICENSE | Standard method (SM) | |||||||
|---|---|---|---|---|---|---|---|---|---|
|
| Median (IQR) |
| Median (IQR) |
| Median (IQR) | ||||
| Urinary output | 104 | 63 ml (36.3–93) | 96 | 63.6 ml (35.8–90.2) | 98 | 70 ml (50–100) | |||
| 18 | 310 ml (232.5–349.8) | 16 | 304.8 ml (222.4–338.8) | 20 | 305 ml (237.5–362.5) | ||||
| Total | 122 | 72.5 ml (39.5–121.2) | 112 | 72.9 ml (39.7–116.3) | 0.031 | 118 | 80 ml (55–138.8) | ||
| Oral fluids | 103 | 51 ml (0–127) | 97 | 57.7 ml (0.3–127) | 101 | 50 ml (0–130) | |||
| 21 | 339 ml (294–462) | 21 | 324 ml (289.3–439.7) | 23 | 350 ml (275–465) | ||||
| Total | 124 | 91 ml (0–149.5) | 118 | 89.3 ml (0.6–155.6) | 0.031 | 124 | 100 ml (0–152.5) | ||
| Intra-venous fluids | 96 | 0 ml (0–0) | 89 | 0.1 ml ( | – | – | |||
| 23 | 125 ml (106–174.5) | 22 | 120.3 ml (103.8–177.4) | – | – | ||||
| Total | 119 | 0 ml (0–86.5) | 111 | 0.5 ml ( | 0.047 | – | – | ||
LICENSE, Liquid balance monitoring system;
Table 2
Performance parameters of LICENSE and the standard method (SM)
|
| Upper LOA | Mean bias (95% CI) | Lower LOA | ||
|---|---|---|---|---|---|
| Urinary output | LICENSE versus RM | 112 | 12.1 ml (9.8 to 14.4 ml) | ||
| SM versus RM | 118 | 23.3 ml (21.3 to 25.3 ml) | 10.8 ml (9.6 to 11.9 ml) | ||
| LICENSE versus SM | 109 | 31.5 ml (28.5 to 34.6 ml) | 13 ml (11.2 to 14.8 ml) | ||
| Oral fluids | LICENSE vs RM | 118 | 10.9 ml (8.9 to 12.8 ml) | ||
| SM versus RM | 124 | 32.5 ml (28.5 to 36.5 ml) | 6.6 ml (4.2 to 8.9 ml) | ||
| LICENSE versus SM | 118 | 38.9 ml (34 to 43.9 ml) | 8.1 ml (5.2 to 11 ml) | ||
| Intra-venous fluids | LICENSE versus RM | 111 | 7.5 ml (6.1 to 8.8 ml) |
LICENSE, Liquid balance monitoring system; SD, standard deviation;
The summary statistics regarding the Bland-Altman plots are displayed in Table 2. The mean bias of urine output measured by LICENSE was
Figure 4.
Bland-Altman plots illustrating the agreement of LICENSE with the reference measurement (RM) (left) and standard method (SM) with the reference measurement (RM) (right) in measuring urine output. Note the different scales on the y-axes.
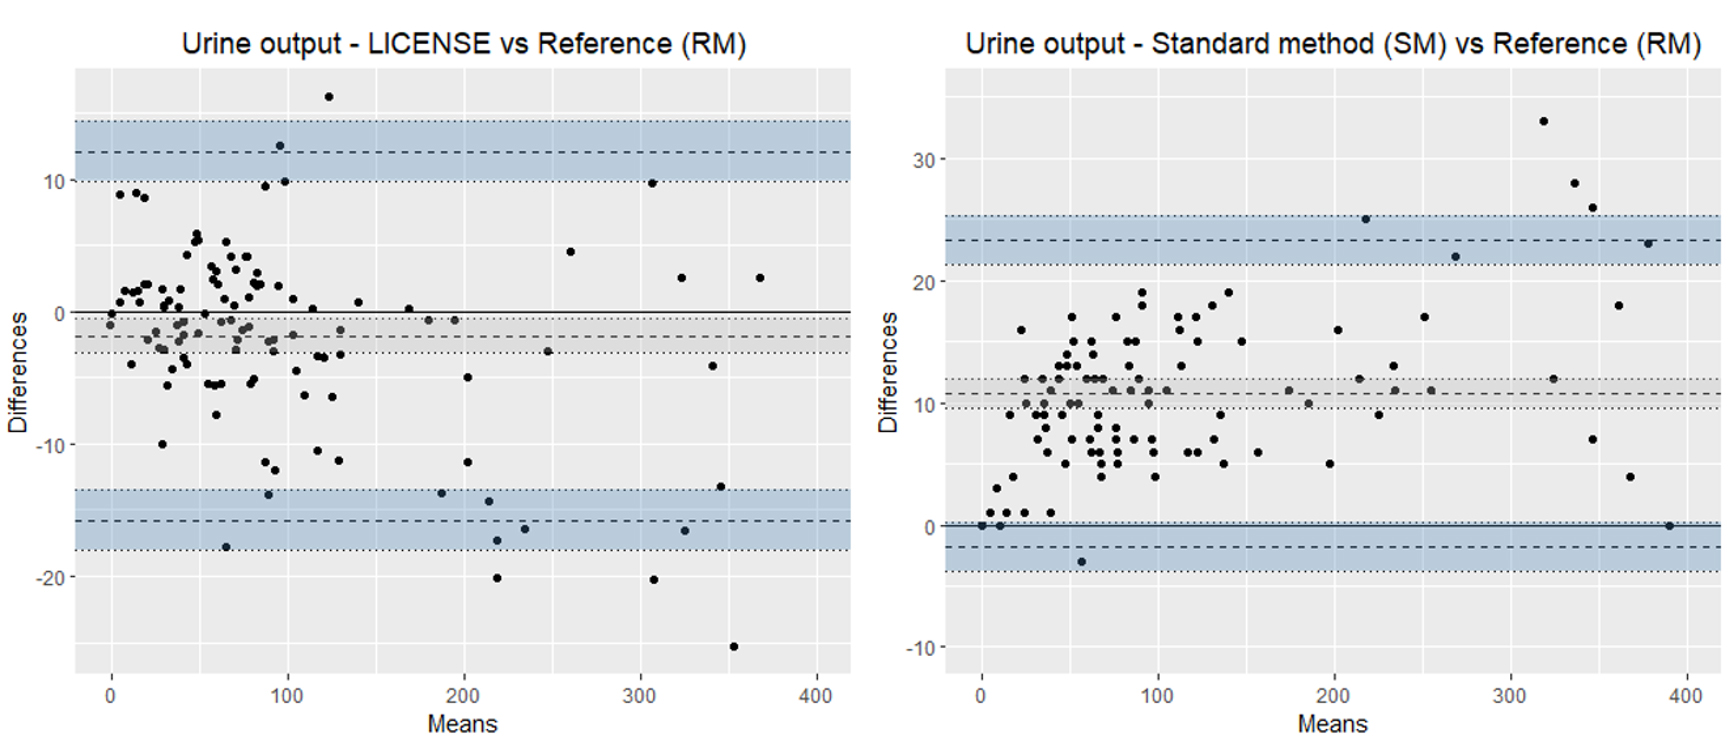
Figure 5.
Bland-Altman plots illustrating the agreement of LICENSE with the reference measurement (RM) (left) and standard method with the reference measurement (RM) (right) in measuring oral fluid intake. Note the different scales on the y-axes.
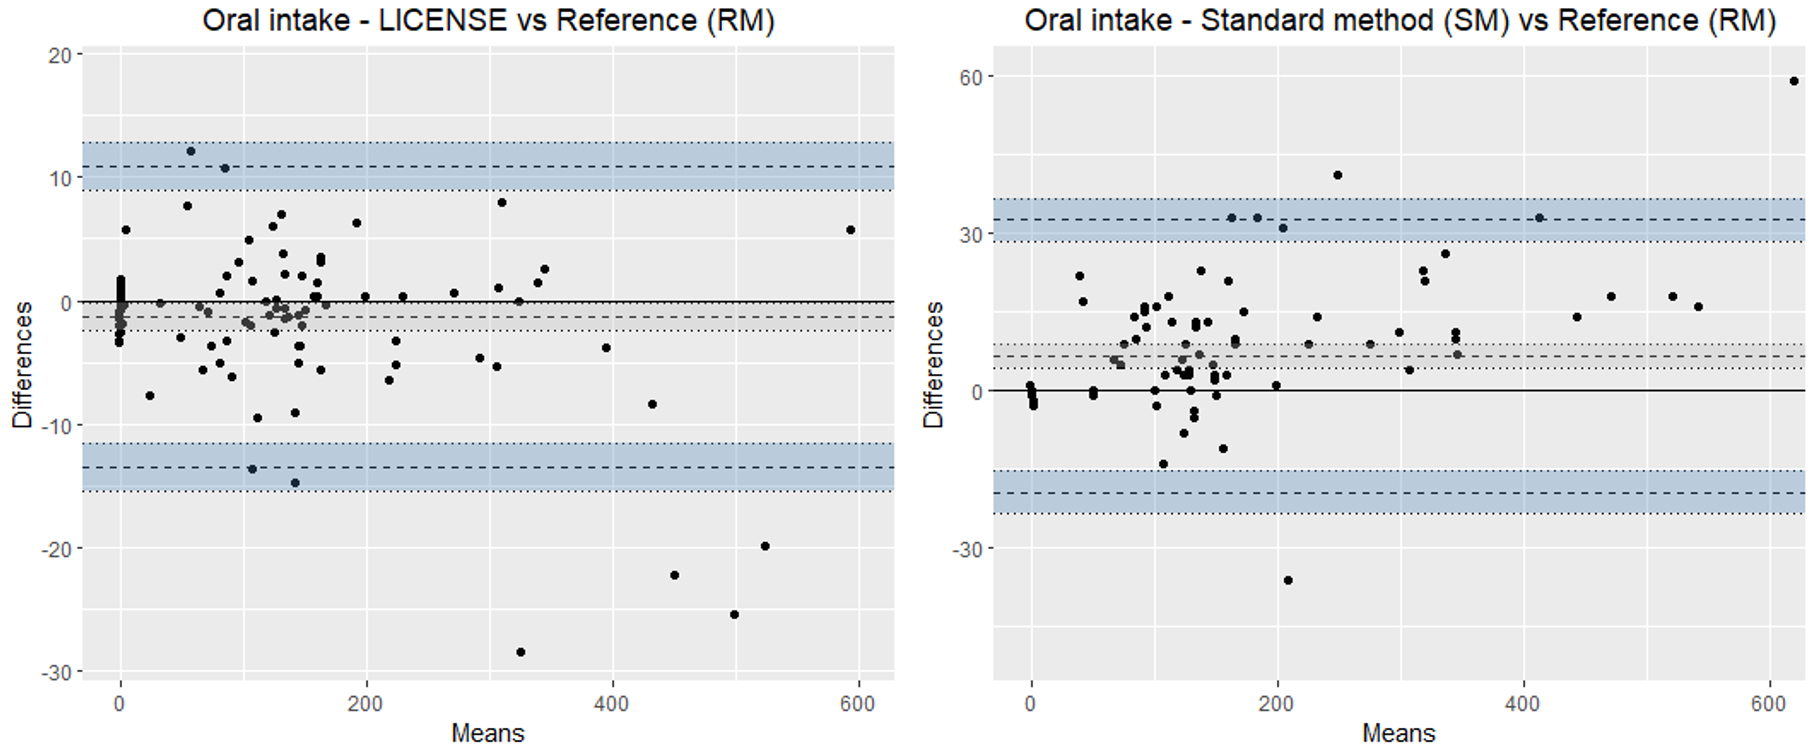
The mean bias of oral fluid intake measured by LICENSE was
Only RM and LICENSE were used to measure intravenous fluids, with a mean bias of
Figure 6.
Bland-Altman plots illustrating the agreement of LICENSE with the reference measurement (RM) in measuring intravenous fluids. On the right, the agreement is presented in a scatterplot.
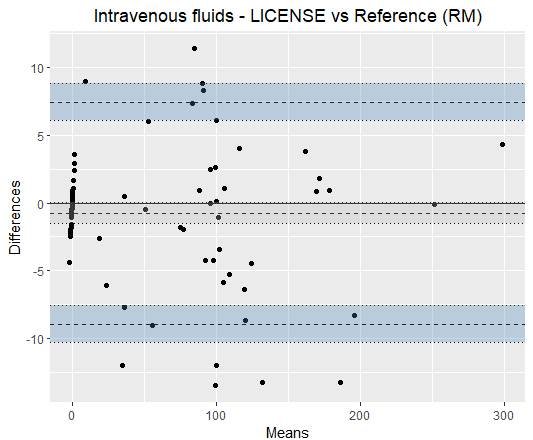
Figure 7.
Bland-Altman plots illustrating the agreement of LICENSE and the standard method (SM) in measuring oral fluid intake (left) and urinary output (right).
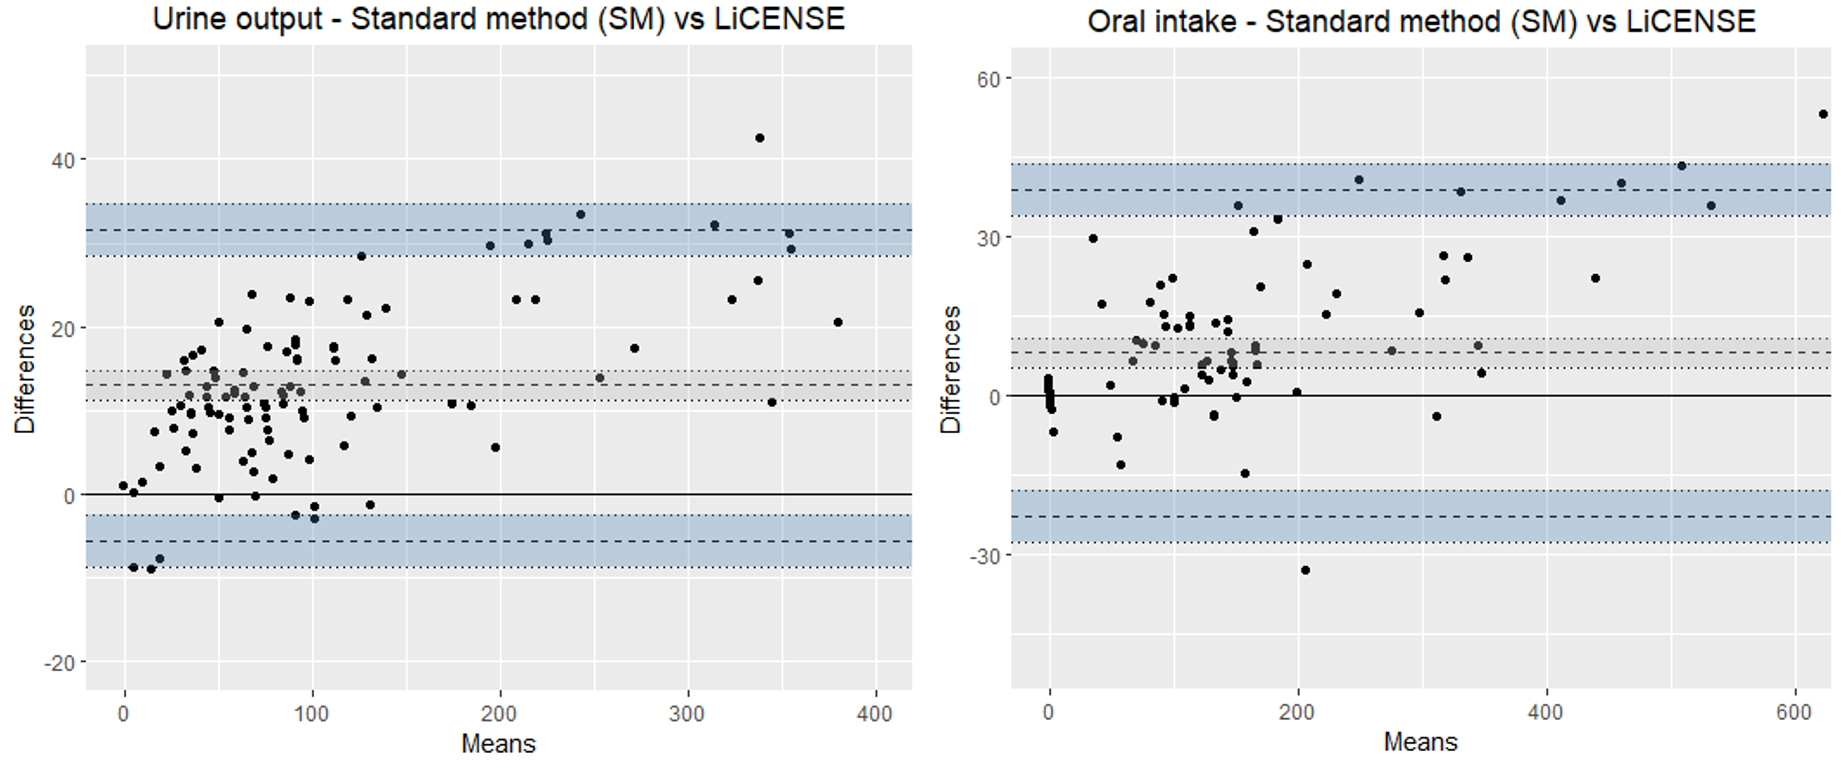
The mean bias between SM and LICENSE for oral fluids was was 8.1 mL (95% CI: 11 to 5.2), with a 95% LOA interval of 61.6 mL (as shown in Fig. 7). The mean bias between SM and LICENSE for urine output was 13 mL (95% CI: 14.8 to 11.2 mL), with a 95% LOA interval of 37.0 mL, with a trend of an increasing positive difference with increased volumes.
4.Discussion
The LICENSE device accurately measures three parameters of fluid balance, including urine output, oral intake, and intravenous fluids. Compared to the standard procedure, LICENSE shows smaller mean biases, equivalent or narrower limits of agreement (LOA), and comparable medians of measurement. LICENSE is competitive with other devices in measuring hourly urine output and has the potential to improve fluid intake measurement accuracy by weighing fluids served instead of estimating volumes. An updated version of LICENSE that includes other fluid parameters, such as feeding tubes and fluid diversions, is currently in development.
4.1Accuracy evaluation
The mean bias of LICENSE in all three parameters was less than 2 mL and, on average, LICENSE measured slightly less than the reference measurement (between
The 95% LOA intervals in the Bland-Altman plots are approximately the same for LICENSE (27.8 mL) and SM (25.2 mL) in measuring urine output. However, LICENSE has a narrower LOA (24.4 mL) in measuring oral fluids compared to SM (52 mL). The medians of measurement also show better agreement between LICENSE and the reference weight (RM) compared to SM, with LICENSE medians deviating 0.4 to 1.7 mL from RM medians, while SM medians deviate 7.5 mL to 9.0 mL from RM.
Taken together, LICENSE is more accurate than the standard procedure based on mean biases, LOA, and medians of measurement. It is important to note that precision decreases at higher volumes, and this should be taken into consideration when treating patients.
To the best of our knowledge, there is a lack of research comparing digital fluid balance monitoring with traditional methods of calculating fluid balance by evaluating various fluid intake and output measurements. However, there have been a few studies that investigate the effectiveness of other devices in measuring urine output compared to standard procedures.
4.2Measuring urine output
In the literature, several studies have been conducted to evaluate the accuracy of different devices for measuring urine output. Eklund et al. [27] compared the automatic urinometer Sippi® with a manual urinometer and found a mean bias of 1.9 ml and a range of 30.4 ml between the lower and upper limits of agreement (LOA) based on 408 measurements. Hersch et al. [28] compared a novel electronic urine output monitoring device with a manual urinometer and found a relative bias of 0.08 ml, a relative percentage deviation of 8%, and a
4.3Measuring oral fluid intake
In the clinical setting, the measurement of oral fluid intake can be unreliable. Several factors contribute to this issue, one being the lack of clear responsibility for recording fluid intake [8]. This can lead to inconsistencies and inaccuracies in fluid balance charts due to different individuals serving and removing fluids. To address this issue, it is important to adopt an interprofessional approach that involves the participation of different healthcare professionals [19].
Another factor that contributes to the inaccuracies in fluid intake measurement is the use of containers with imprecise measuring lines or no measuring lines at all. This results in the need for approximate estimates, which can be prone to errors. Studies have shown that even trained healthcare professionals, such as nurses, have difficulty in accurately estimating fluid volumes. For example, one study found that 50% of nursing staff estimated volumes within an error margin of 10% and all nurses estimated within an error margin of 25% [33]. Another study found that only 27% of nurse’s estimates were within an error margin of 10% [34].
The LICENSE device offers an opportunity to improve the accuracy of fluid intake measurement by weighing the fluids served, instead of relying on volume estimates. This reduces the risk of human error and improves the consistency of data. However, it is important to ensure that all fluids served are placed on the device to achieve maximum accuracy. This should be a consideration in the design and development of future versions of the device.
4.4Future development and implementation
In this study, LICENSE proved to be accurate in a relevant hospital environment measuring patients’ fluid intake and output and reached TRL 5. However, LICENSE needs to demonstrate its usability in a daily clinical practice setting and be developed further by providing a more comprehensive fluid balance by taking other sources of fluid input and output into account. In the present study, we considered the parameters of intravenous fluids, oral fluids, and urinary output in calculating fluid balance. Patients may have other means of fluid input and output, such as feeding tubes or fluid diversions like nephrostomies, drains, or nasogastric tubes [19], and there are also additional sources of fluid loss, like stools and insensible fluid loss through skin and respiration [8]. To address these limitations, we are currently collaborating with an engineering company to develop an updated version of LICENSE that incorporates these additional sources of fluid input and output. LICENSE needs further testing to obtain approval and certification by the CE mark, which is mandatory for medical devices marketed in The European Union and indicates compliance with health, safety and environmental standards [35].
In addition to developing technology, it is important to consider the attitudes of nursing staff towards using technology in their practice. Some nurses may resist the adoption of digital technologies and view it as an unwanted intrusion into their work [36] partly due to challenges faced with the technology, such as inadequate IT systems [37]. By collaborating with nurses across specialties and listening to their experiences, opinions and motivations, we expect to be able to deliver a well-designed technology and thus prevent nurses’ resistance. Further, nurses’ attitudes may improve if the technology is considered to be compatible with traditional nursing ideals, and frees up nurses’ time to care for patients by automating routine tasks [37].
4.5Limitations
Limitations of the study include the potential for bias introduced by the manual reading and weighting methods, slight variations in weights due to differences in drip chamber placement, and the lack of measurements of intravenous fluids using standard procedures. Our department’s standard practice is to document each fluid bag, rather than hourly intravenous fluid given, and an alternative approach would be to compare reference measurements with the accuracy of an infusion pump. Limitations related to the LICENSE devices include the relatively short battery operating time, which may necessitate recharging during continuous monitoring preventing the patient from moving around. In addition, there is need to thoroughly teach patients and nursing staff to ensure the correct use of LICENSE.
5.Conclusions
Our findings suggest that the LICENSE system is a reliable and accurate tool for recording fluid balance. The results indicate that LICENSE is comparable to or superior to manual methods in terms of accuracy and consistency, and has the potential to reduce the risk of human errors and increase the comprehensiveness and precision of fluid balance monitoring. It is important to note, however, that further research is necessary to fully evaluate the feasibility and usability of LICENSE in routine clinical practice and to explore methods for incorporating other fluid inputs and losses in fluid balance calculations.
Acknowledgments
The authors have no acknowledgements.
Conflict of interest
The authors declare that there is no conflict of interest.
Funding
This study received funding from Zealand University Hospital and ‘Helsefonden’ (21-B-0313).
References
[1] | Ruberti OM, Yugar-Toledo JC, Moreno H, Rodrigues B. Hypertension telemonitoring and home-based physical training programs. Blood Pressure. (2021) ; 30: (6): 428-38. |
[2] | Boer C, Touw HR, Loer SA. Postanesthesia care by remote monitoring of vital signs in surgical wards. Current Opinion in Anesthesiology. (2018) ; 31: (6): 716-22. |
[3] | Halcox JPJ, Wareham K, Cardew A, Gilmore M, Barry JP, Phillips C, et al. Assessment of Remote Heart Rhythm Sampling Using the AliveCor Heart Monitor to Screen for Atrial Fibrillation. Circulation. (2017) ; 136: (19): 1784-94. |
[4] | McGillion MH, Parlow J, Borges FK, Marcucci M, Jacka M, Adili A, et al. Post-discharge after surgery Virtual Care with Remote Automated Monitoring-1 (PVC-RAM-1) technology versus standard care: Randomised controlled trial. BMJ. (2021) ; 2021 Sep 30; 374: : n2209. |
[5] | Socha-Dietrich K. Empowering the health workforce. Strategies to make the most of the digital revolution.: OECD; (2020) . |
[6] | Jacobs SR, Weiner BJ, Reeve BB, Hofmann DA, Christian M, Weinberger M. Determining the predictors of innovation implementation in healthcare: A quantitative analysis of implementation effectiveness. BMC Health Services Research. (2015) ; 15: (1): 6. |
[7] | Hartley J, Knell L. Innovation, exnovation and intelligent failure. Public Money & Management. (2022) ; 42: (1): 40-8. |
[8] | Scales K, Pilsworth J. The importance of fluid balance in clinical practice. Nursing Standard (Royal College of Nursing (Great Britain): 1987). (2008) ; 22: (47): 50-7; quiz 8, 60. |
[9] | Sakr Y, Rubatto Birri PN, Kotfis K, Nanchal R, Shah B, Kluge S, et al. Higher fluid balance increases the risk of death from sepsis: Results from a large international audit. Crit Care Med. (2017) ; 45: (3): 386-94. |
[10] | Trejnowska E, Skoczynski S, Armatowicz P, Knapik M, Kurdys P, Slusarz K, et al. The importance of fluid balance in critically ill patients: a retrospective observational study. Kardiol Pol. (2019) ; 77: (12): 1147-54. |
[11] | Brandstrup B, Tonnesen H, Beier-Holgersen R, Hjortso E, Ording H, Lindorff-Larsen K, et al. Effects of intravenous fluid restriction on postoperative complications: Comparison of two perioperative fluid regimens: A randomized assessor-blinded multicenter trial. Ann Surg. (2003) ; 238: (5): 641-8. |
[12] | Chan HYL, Cheng A, Cheung SSS, Pang WW, Ma WY, Mok LC, et al. Association between dehydration on admission and postoperative complications in older persons undergoing orthopaedic surgery. J Clin Nurs. (2018) ; 27: (19-20): 3679-86. |
[13] | Wuethrich PY, Burkhard FC, Thalmann GN, Stueber F, Studer UE. Restrictive deferred hydration combined with preemptive norepinephrine infusion during radical cystectomy reduces postoperative complications and hospitalization time: A randomized clinical trial. Anesthesiology. (2014) ; 120: (2): 365-77. |
[14] | Bruno C, Collier A, Holyday M, Lambert K. Interventions to improve hydration in older adults: A systematic review and meta-analysis. Nutrients. (2021) ; 13: (10): 3640. |
[15] | Prowle JR, Liu Y-L, Licari E, Bagshaw SM, Egi M, Haase M, et al. Oliguria as predictive biomarker of acute kidney injury in critically ill patients. Crit Care. (2011) ; 15: (4): R172. |
[16] | Leinum LR, Krogsgaard M, Tantholdt-Hansen S, Baandrup AO, Gögenur I, Azawi N. The quality of fluid balance charting, and interventions to improve it: a systematic review. Submitted to BMJ Open Quality. (2023) . |
[17] | Georgiades D. A BALANCING ACT: MAINTAINING ACCURATE FLUID BALANCE CHARTING. CLINICAL UPDATE. (2016) ; 5. |
[18] | Holroyd S. Frequency volume charts and fluid balance monitoring: Getting it right. Journal of Community Nursing. (2020) ; 34: (1): 4. |
[19] | McGloin S. The ins and outs of fluid balance in the acutely ill patient. Br J Nurs. (2015) ; 24: (1): 14-8. |
[20] | Diacon A, Bell J. Investigating the recording and accuracy of fluid balance monitoring in critically ill patients. Southern African Journal of Critical Care. (2014) ; 30: (2). |
[21] | Perren A. Fluid balance in critically ill patients should we really rely on it? Minerva Anestesiologica. (2011) ; 77: (8): 802-11. |
[22] | Szmuda T, Waszak PM, Rydz C, Springer J, Budynko L, Szydlo A, et al. The challenges of hypervolemic therapy in patients after subarachnoid haemorrhage. Neurol Neurochir Pol. (2014) ; 48: (5): 328-36. |
[23] | Davies A, Srivastava S, Seligman W, Motuel L, Deogan V, Ahmed S, et al. Prevention of acute kidney injury through accurate fluid balance monitoring. BMJ Open Qual. (2017) ; 6: (2): e000006. |
[24] | Dewitte A, Carles P, Joannès-Boyau O, Fleureau C, Roze H, Combe C, et al. Bioelectrical impedance spectroscopy to estimate fluid balance in critically ill patients. Journal of Clinical Monitoring and Computing. (2016) ; 30: (2): 227-33. |
[25] | Mathew S, Abraham G Fau-Vijayan M, Vijayan M Fau-Thandavan T, Thandavan T Fau-Mathew M, Mathew M Fau-Veerappan I, Veerappan I Fau-Revathy L, et al. Body composition monitoring and nutrition in maintenance hemodialysis and CAPD patients – a multicenter longitudinal study. Ren Fail. (2015) ; 37: (1): 66-72. |
[26] | Cihoric M, Kehlet H, Højlund J, Lauritsen ML, Kanstrup K, Foss NB. Bioimpedance spectroscopy fluid analysis in acute high-risk abdominal surgery, a prospective clinician-blinded observational feasibility study. Journal of Clinical Monitoring and Computing. (2022) . |
[27] | Eklund A, Slettengren M, van der Linden J. Performance and user evaluation of a novel capacitance-based automatic urinometer compared with a manual standard urinometer after elective cardiac surgery. Crit Care. (2015) ; 19: (1): 173. |
[28] | Hersch M, Einav S, Izbicki G. Accuracy and ease of use of a novel electronic urine output monitoring device compared with standard manual urinometer in the intensive care unit. J Crit Care. (2009) ; 24: (4): 629.e13-17. |
[29] | Takai S, Matsukawa Y, Hashizume N, Gotoh M. A small pilot study to evaluate the accuracy and feasibility of a novel automated voiding diary device for recording urine output measurements. Neurourol Urodyn. (2021) ; 40: (1): 272-7. |
[30] | Flessa S, Huebner C. Innovations in Health Care-A Conceptual Framework. Int J Environ Res Public Health. (2021) ; 18: (19). |
[31] | Organisations EAoRaT. The TRL Scale as a Research & Innovation Policy Tool, EARTO Recommendations. (2014) 30 April 2014. |
[32] | Bland JM, Altman DG. Measuring agreement in method comparison studies. Stat Methods Med Res. (1999) ; (8): 135-60. |
[33] | Michelsen CF, Svendsen MBS, Bagger Marie L, Konradsen H. A study on accuracy and precision of fluid volume measurements by nurses, patients and healthy persons in a clinical setting. Nursing Open. (2022) ; 9: (2): 1303-10. |
[34] | Tattersall C. Nursing staff’s ability to gauge fluid intake. Nurs Times. (2016) ; 112: (45/46): 19-22. |
[35] | Badnjevic A. Evidence-based maintenance of medical devices: Current shortage and pathway towards solution. Technology and Health Care. (2023) ; 31: : 293-305. |
[36] | Booth RG. How the nursing profession should adapt for digital future. BMJ. (2021) ; 373: (n1190). |
[37] | Agnew T. Digital engagement in nursing: The benefits and barriers. Nurs Times. (2022) ; 118: (3). |


