
Study on the difference and regularity of tongue images in 309 patients with different pathological stages of non-small cell lung cancer
Abstract
BACKGROUND:
Tongue diagnosis is a crucial traditional Chinese medicine (TCM) inspection method for TCM syndrome differentiation and treatment.
OBJECTIVE:
The primary research focus was on tongue image characteristic parameters of patients with non-small cell lung cancer (NSCLC). Analysis of the tongue image parameters of various pathological stages of NSCLC provides technical support for establishing an integrated Chinese and Western auxiliary diagnosis and efficacy evaluation medicine system for lung cancer that integrates tongue image features.
METHODS:
Tongue image characteristics of 309 patients with NSCLC and 206 controls were collected and analyzed clinically. The
RESULTS:
There were differences in tongue image characteristics in the NSCLC group compared to the control group. The tongue quality and brightness of the tongue coating in the NSCLC group increased, the red component was reduced, the tongue coating thickened, and the yellow component increased compared to the healthy control group. A comparison of tongue image indexes of NSCLC in different pathological stages showed that stage IV had lower TB-b and higher TB-a than stage I. In addition, stage IV had lower TB-b than stage II
CONCLUSION:
The tongue image characteristics of NSCLC patients differed from those of the control group. Tongue imaging indicators can reflect the characteristics of tongue images of patients with NSCLC. The tongue image characteristics of patients with stage IV lung cancer are bluish and purple compared with those with stage I, II, and III. It is suggested that the tongue’s image characteristics can be used as a reference for the pathological classification of NSCLC and judgment of the disease process.
1.Introduction
Malignant tumors are significant diseases that seriously threaten human life and health. The latest statistics show that China ranks first in the world in terms of new cancer incidence and mortality, with 4.57 million new cancer cases in China, accounting for 23.7% of new cases worldwide (19.29 million new patients worldwide), and 3 million cancer deaths, accounting for 30% of total cancer deaths (9.96 million cancer deaths worldwide). Among these, lung cancer is China’s most common malignant tumor, with 820,000 new cases and 710,000 deaths. According to pathology, lung cancer can be classified into two categories: non-small cell lung cancer (NSCLC) and small cell lung cancer (SCLC), of which NSCLC is the most common [1, 2, 3]. There are an increasing numbers of studies on lung cancer prevention, diagnosis, and treatment, especially NSCLC. Tongue diagnosis is a crucial traditional Chinese medicine (TCM) inspection method for TCM syndrome differentiation and treatment. Tongue diagnosis identifies the location and nature of the disease, speculates on the cause and mechanism of the disease, and suggests the progression and prognosis of the disease [4]. In the past 30 years, many researchers have observed the tumor of the tongue characteristics. In 1987, the research results of the Cooperative Group of Traditional Chinese Medicine and Western Medicine Cancer Professional Committee recommended specific rules for the changes in tongue pictures of patients with tumors [5]. However, the clinical application of tongue diagnosis is affected by the external environment and doctors’ experience. Therefore, the theory and clinical experience of tongue diagnosis have been systematically summarized. The use of modern science and technology to establish an objective standard for tongue diagnosis is a significant challenge in expanding its application scope of tongue diagnosis. Since the 1990s, with the development of computer digital image processing technology and the progress of objectification of tongue diagnosis, many achievements have been made in the standardization of tongue image acquisition in Traditional Chinese Medicine Quantification [6, 7, 8, 9, 10, 11, 12, 13, 14, 15]. Researchers have increasingly applied objective tongue diagnosis to diagnose and treat clinical diseases and evaluate the curative effect based on research on classification and recognition.
This study describes the tongue image characteristics of non-small cell lung cancer with datable tongue image indices. Further, it analyzes the tongue image characteristics of NSCLC patients with different tumor node metastasis (TNM) stages. We introduced image indices that objectively reflect the diagnostic information of tongue images based on clinical observations. We provided technical support for establishing a combined Chinese and Western medicine lung cancer diagnosis and treatment evaluation system incorporating data-based information on tongue diagnosis.
2.Materials and methods
2.1Clinical information
2.1.1Study design and participants
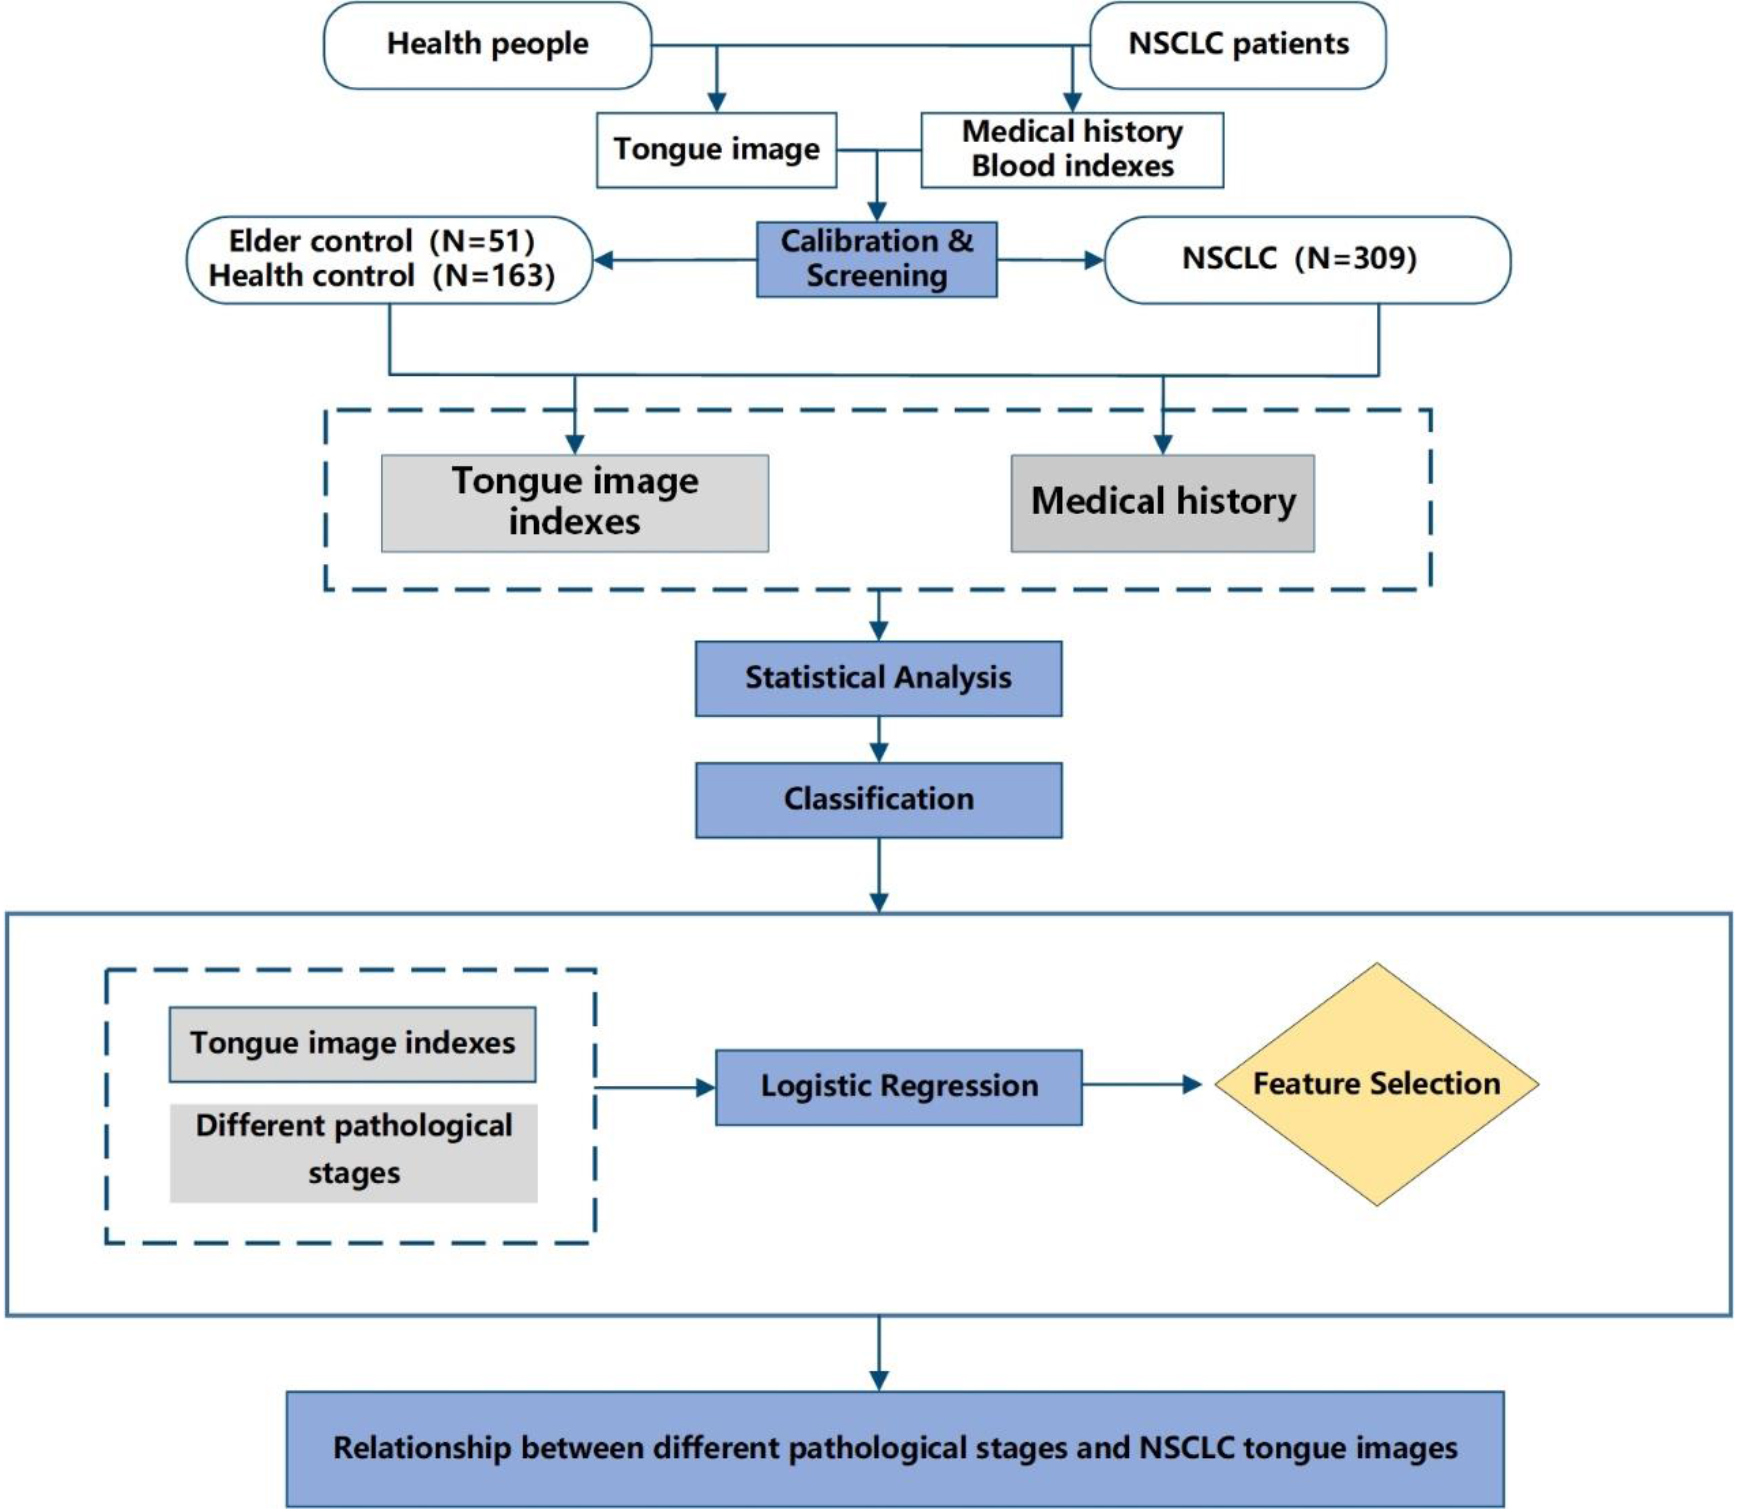
The NSCLC group included 316 patients hospitalized in the Yueyang Hospital of Integrated Traditional Chinese and Western Medicine oncology ward between October 2016 and November 2018. Additionally, a total of 553 people were screened from September to December 2017 at the health check-up center of Shuguang Hospital as a control group. Tongue images of the patients were collected using a uniform tongue diagnostic device. A flowchart of the process is shown in Fig. 1.
Figure 1.
Flowchart.
2.1.2Diagnostic criteria
(1) Diagnostic criteria for non-small cell lung cancer
The National Comprehensive cancer network (NCCN) published guidelines for non-small cell lung cancer in 2017 and the principles of diagnosis and evaluation of clinical guidelines for diagnosis and treatment (2011 edition) [16, 17].
(2) Diagnostic criteria for the TNM staging of non-small cell lung cancer
In this study, according to the TNM staging standard (8th edition), the Union for International Cancer Control (UICC) issued in 2018 [18], only patients with NSCLC were observed, and no clinical intervention was carried out [16]. The American Joint Committee on Cancer (AJCC) cancer staging manual [19]. Patients with non-small cell tumors were classified into I, II, III, and IV stages without further detailed division.
2.1.3Inclusion criteria and exclusion criteria
Inclusion and exclusion criteria in the control group
(1) Inclusion criteria for the control group:
a. There was no history of cancer diagnosis, no acute disease diagnosis within three months, and no treatment according to the clinical diagnostic criteria of the disease.
b. Age between 25–85 years old;
c. Unlimited gender.
(2) Exclusion criteria for the control group:
a. Those who did not meet the inclusion criteria of the control group;
b. Pregnant or lactating women;
c. Unable to cooperate with researchers because of subjective and objective reasons.
Inclusion and exclusion criteria in the NSCLC group
(1) Inclusion criteria for patients with non-small cell lung cancer:
a. The diagnosis is precise;
b. The age is between 25–85;
c. There is no restriction on gender.
(2) Exclusion criteria for patients with non-small cell lung cancer:
a. Those who did not meet the inclusion criteria for NSCLC;
b. Lung cancer is complicated with other significant diseases;
c. Pregnant or lactating women;
d. Unable to cooperate with researchers because of subjective and objective reasons.
2.2Experimental instruments and methods
2.2.1Experimental apparatus
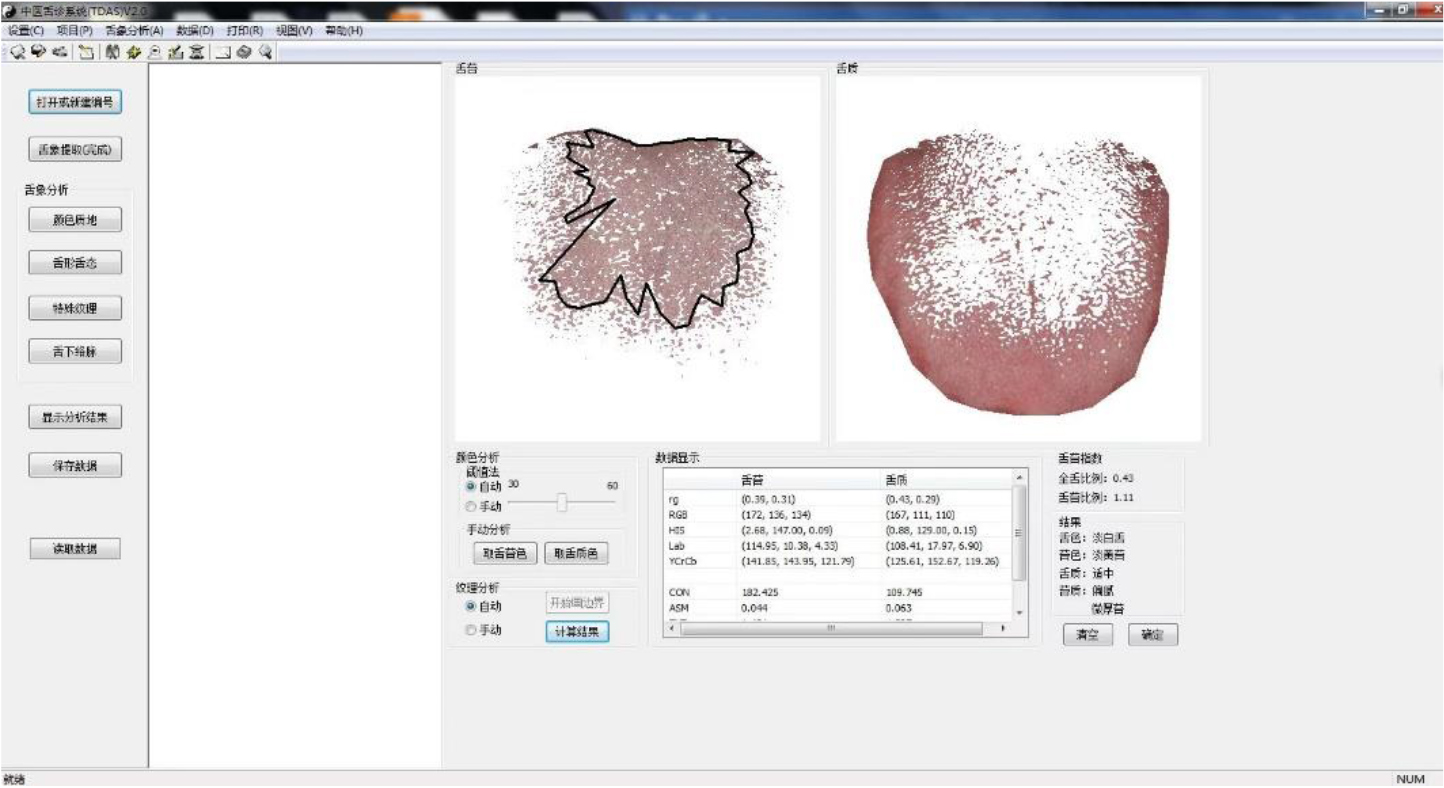
The TDA-1 digital tongue diagnosis instrument was used as the tongue image acquisition equipment (developed by the Laboratory of Intelligent Processing of TCM Diagnostic Information, Shanghai University of Traditional Chinese Medicine, patent number: CN201814562U) [20]. The tongue image diagnosis analysis system (TDAS v2.0) developed by the TCM Diagnostic Information Intelligent Processing Laboratory, Shanghai University of Traditional Chinese Medicine (Software Copyright:2018SR033451) was used to obtain relevant data. All tongue image collection and inquiry studies were completed by professional TCM or integrated TCM and Western medicine personnel who had received standardized training to ensure the consistency and authenticity of data collection and interpretation, and to minimize deviation. The TDA-1 digital tongue diagnosis instrument is shown in Fig. 2, and the corresponding tongue image analysis system TDAS v2.0 is shown in Fig. 3.
Figure 2.
TDA-1 digital tongue diagnosis instrument: (a) front view; (b) profile view.
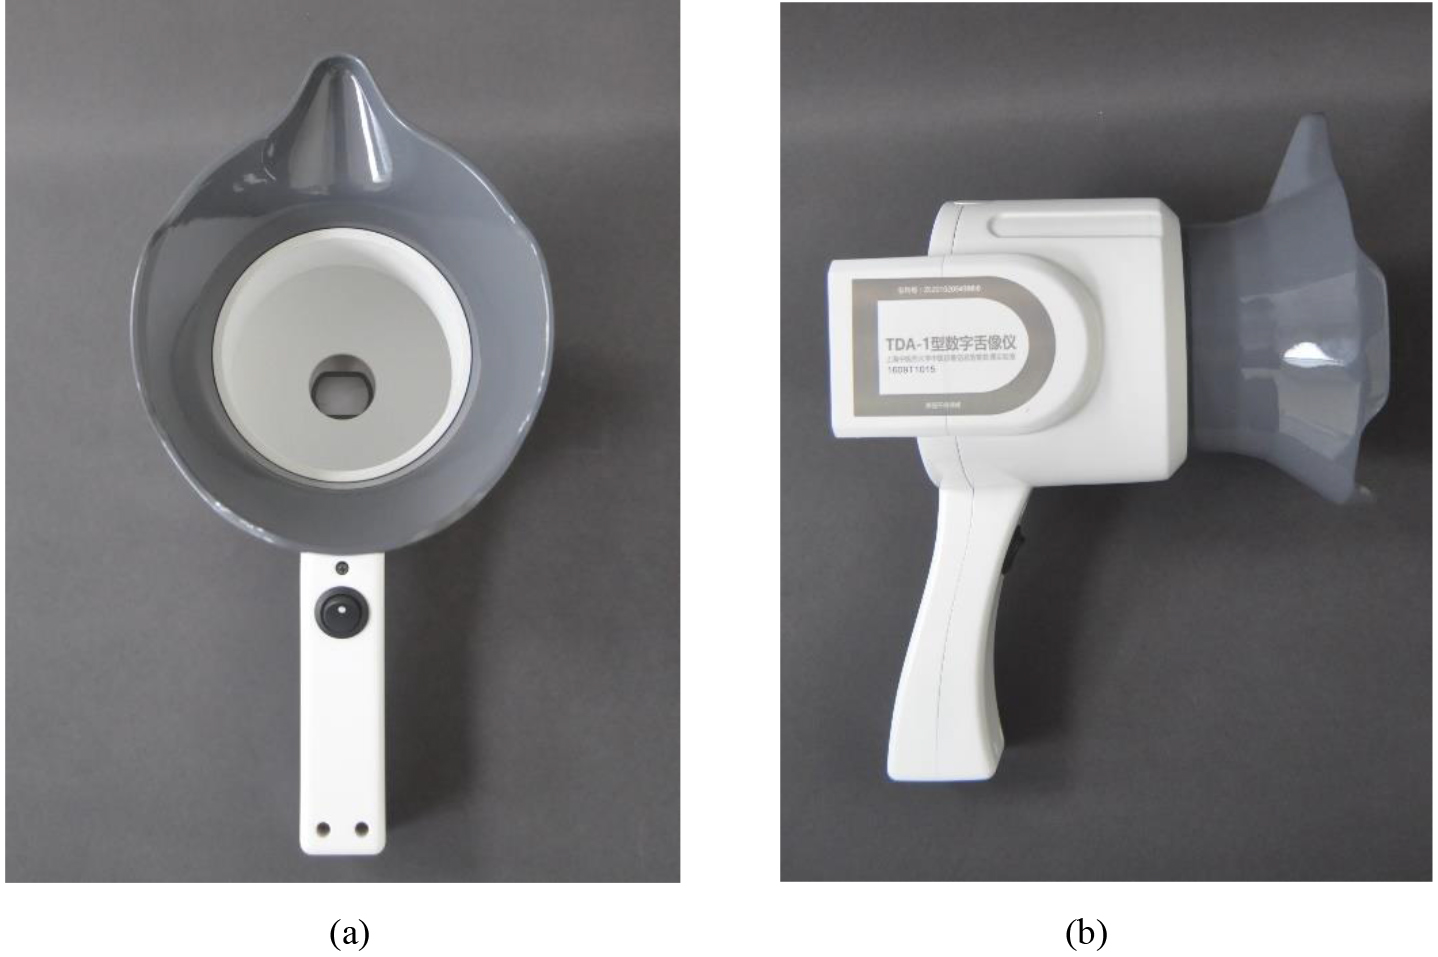
Figure 3.
Tongue image diagnosis analysis system (TDAS v2.0) of TDA-1 digital tongue diagnosis instrument.
2.2.2Experimental methods
Tongue image acquisition
(1) The tongue images were collected before breakfast from 6:15 to 7:15 in the morning.
(2) The process of tongue image acquisition was based on the standard procedure of tongue image acquisition developed by the Laboratory of Intelligent Diagnosis Technology, Shanghai University of Traditional Chinese Medicine.
Feature extraction of tongue image
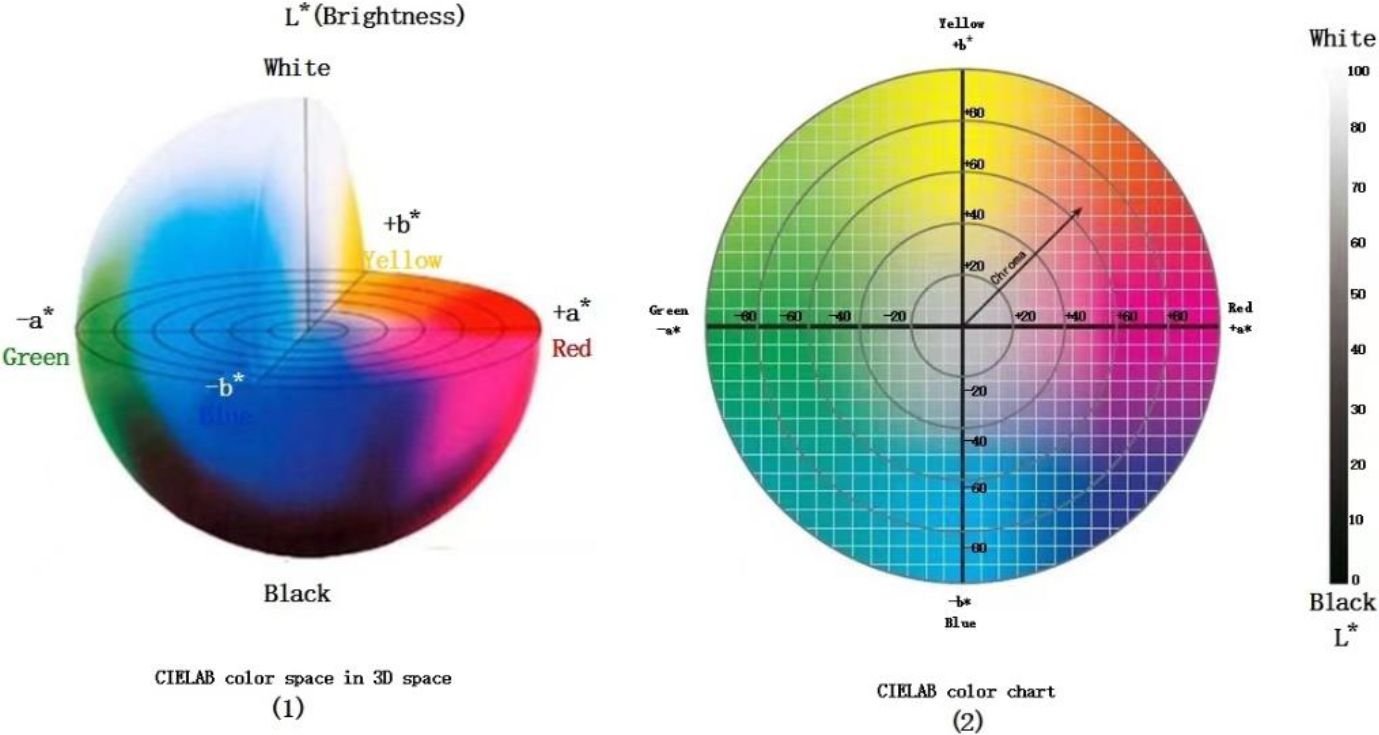
The special tongue analysis software TDAS v2.0 extracts all tongue indices. The tongue image color index is derived from the International Commission on Illumination Lab color space (CIELab). The pixel’s brightness is represented with “L,” and its value range is [0–100], representing pure black to pure white. The range from red to green is indicated with “a,” and its value range is [127–128]. “b” denotes the range from yellow to blue, the value range is [127–128]; the diagrams of Lab color space are shown in Fig. 4. Lab color space is a type of uniform color space that is a color space independent of equipment. It is a color system based on physiological characteristics. In other words, Lab color space uses a digital method to describe human visual perception. It is a color space suitable for the clinical description of tongue features [21]. It has been used in tongue diagnosis by several researchers [22, 23]. Previous studies have shown that the Lab color space best describes and distinguishes the tongue color of Traditional Chinese Medicine. Previous studies have shown that the lab color space best describes and differentiates tongue colors in TCM. The four tongue colors (pale red, pale white, red-red, and blue-violet) can be distinguished by the a-value and b-value. It is recommended that the L*a*b color space is most suitable for TCM’s description and differentiation of tongue colors [24]. In this study, we used the Lab color space index as the primary reference index to describe tongue color, in which L (lightness), a (red-green axis), b (yellow-blue axis), tongue coating index: perAll (perAll
Figure 4.
Lab space color.
2.2.3Statistical methods
Data conforming to a normal distribution were expressed as mean (standard deviation) and Mean (SD). Data not conforming to a normal distribution were expressed as median (25th percentile, 75th percentile) and Median (IQR). Measures were compared between three or two groups for normally distributed data using analysis of variance (ANOVA), multiple comparison tests, or
3.Experimental results
3.1General information
Age is an essential factor affecting lung cancer incidence [19]. Therefore, according to the inclusion criteria and physical examination results of the control group, 51 cases of the elderly control group older than 55 years were selected, and each was sampled once. At the same time, a total of 316 NSCLC patients were sampled, a total of 1257 images of NSCLC patients, excluding 6 cases of unclear stage classification, two times of surgery, finally including 309 people, for a total of 1235 tongue image data. The three groups’ basic information is shown in Tables 1 and 2.
Table 1
Comparison of essential information between NSCLC and control group [
| Project | Healthy control group | Elderly control group | NSCLC group | Total | ||||
|---|---|---|---|---|---|---|---|---|
| Gender | Female | 84 | (51.5) | 23 | (45.1) | 169 | (54.7) | 192 (53.3) |
| Male | 79 | (48.5) | 28 | (54.9) | 140 | (45.3) | 168 (46.7) | |
| Age median (IQR) | 32 | (28–40) | 61 | (58–65) | 64 | (57.50–70.00)* | ||
*Statistically significant difference (
Table 2
History of NSCLC patients
| Project | Number | ||
| Total ( | 309 | ||
| Age, median (IQR) | 64 | (57.50–70.00) | |
| The course of lung cancer, median (IQR) | 14.317 | (5.233–24.567) | |
| Gender, | Female | 169 | (54.7) |
| Male | 140 | (45.3) | |
| Pathological type, | Adenocarcinoma | 264 | (85.4) |
| Squamous cell carcinoma | 45 | (14.6) | |
| Pathological stage, | I | 137 | (44.3) |
| II | 20 | (6.5) | |
| III | 35 | (11.3) | |
| IV | 117 | (37.9) | |
| At the same time, | 58 | (18.77) | |
| EGFR ( | 62 | (20.06) | |
| Smoking history, | No | 235 | (79.9) |
| Yes | 59 | (20.1) | |
| Family history, | Nothing | 272 | (92.5) |
| Yes | 22 | (7.5) | |
| Hypertension, | No | 223 | (72.9) |
| Yes | 83 | (27.1) | |
| Diabetes, | No | 275 | (90.2) |
| Yes | 30 | (9.8) | |
| Hyperlipidemia, | No | 297 | (97.1) |
| Yes | 9 | (2.9) | |
| Operation condition, | No operation | 81 | (26.2) |
| Operation | 228 | (73.8) | |
| Chemotherapy, | Not used | 151 | (48.9) |
| Used | 158 | (51.1) | |
| Used in a month | 21 | (6.9) | |
| Targeted therapy, | No | 256 | (82.8) |
| Yes | 53 | (17.2) | |
Note: Owing to the lack of clinical data, the number of people in some items is not equal to the total number.
Table 1 shows that the gender and age distribution of the NSCLC group was not statistically different (
Figure 5.
Violin plot of tongue data between the Elder Control and NSCLC.
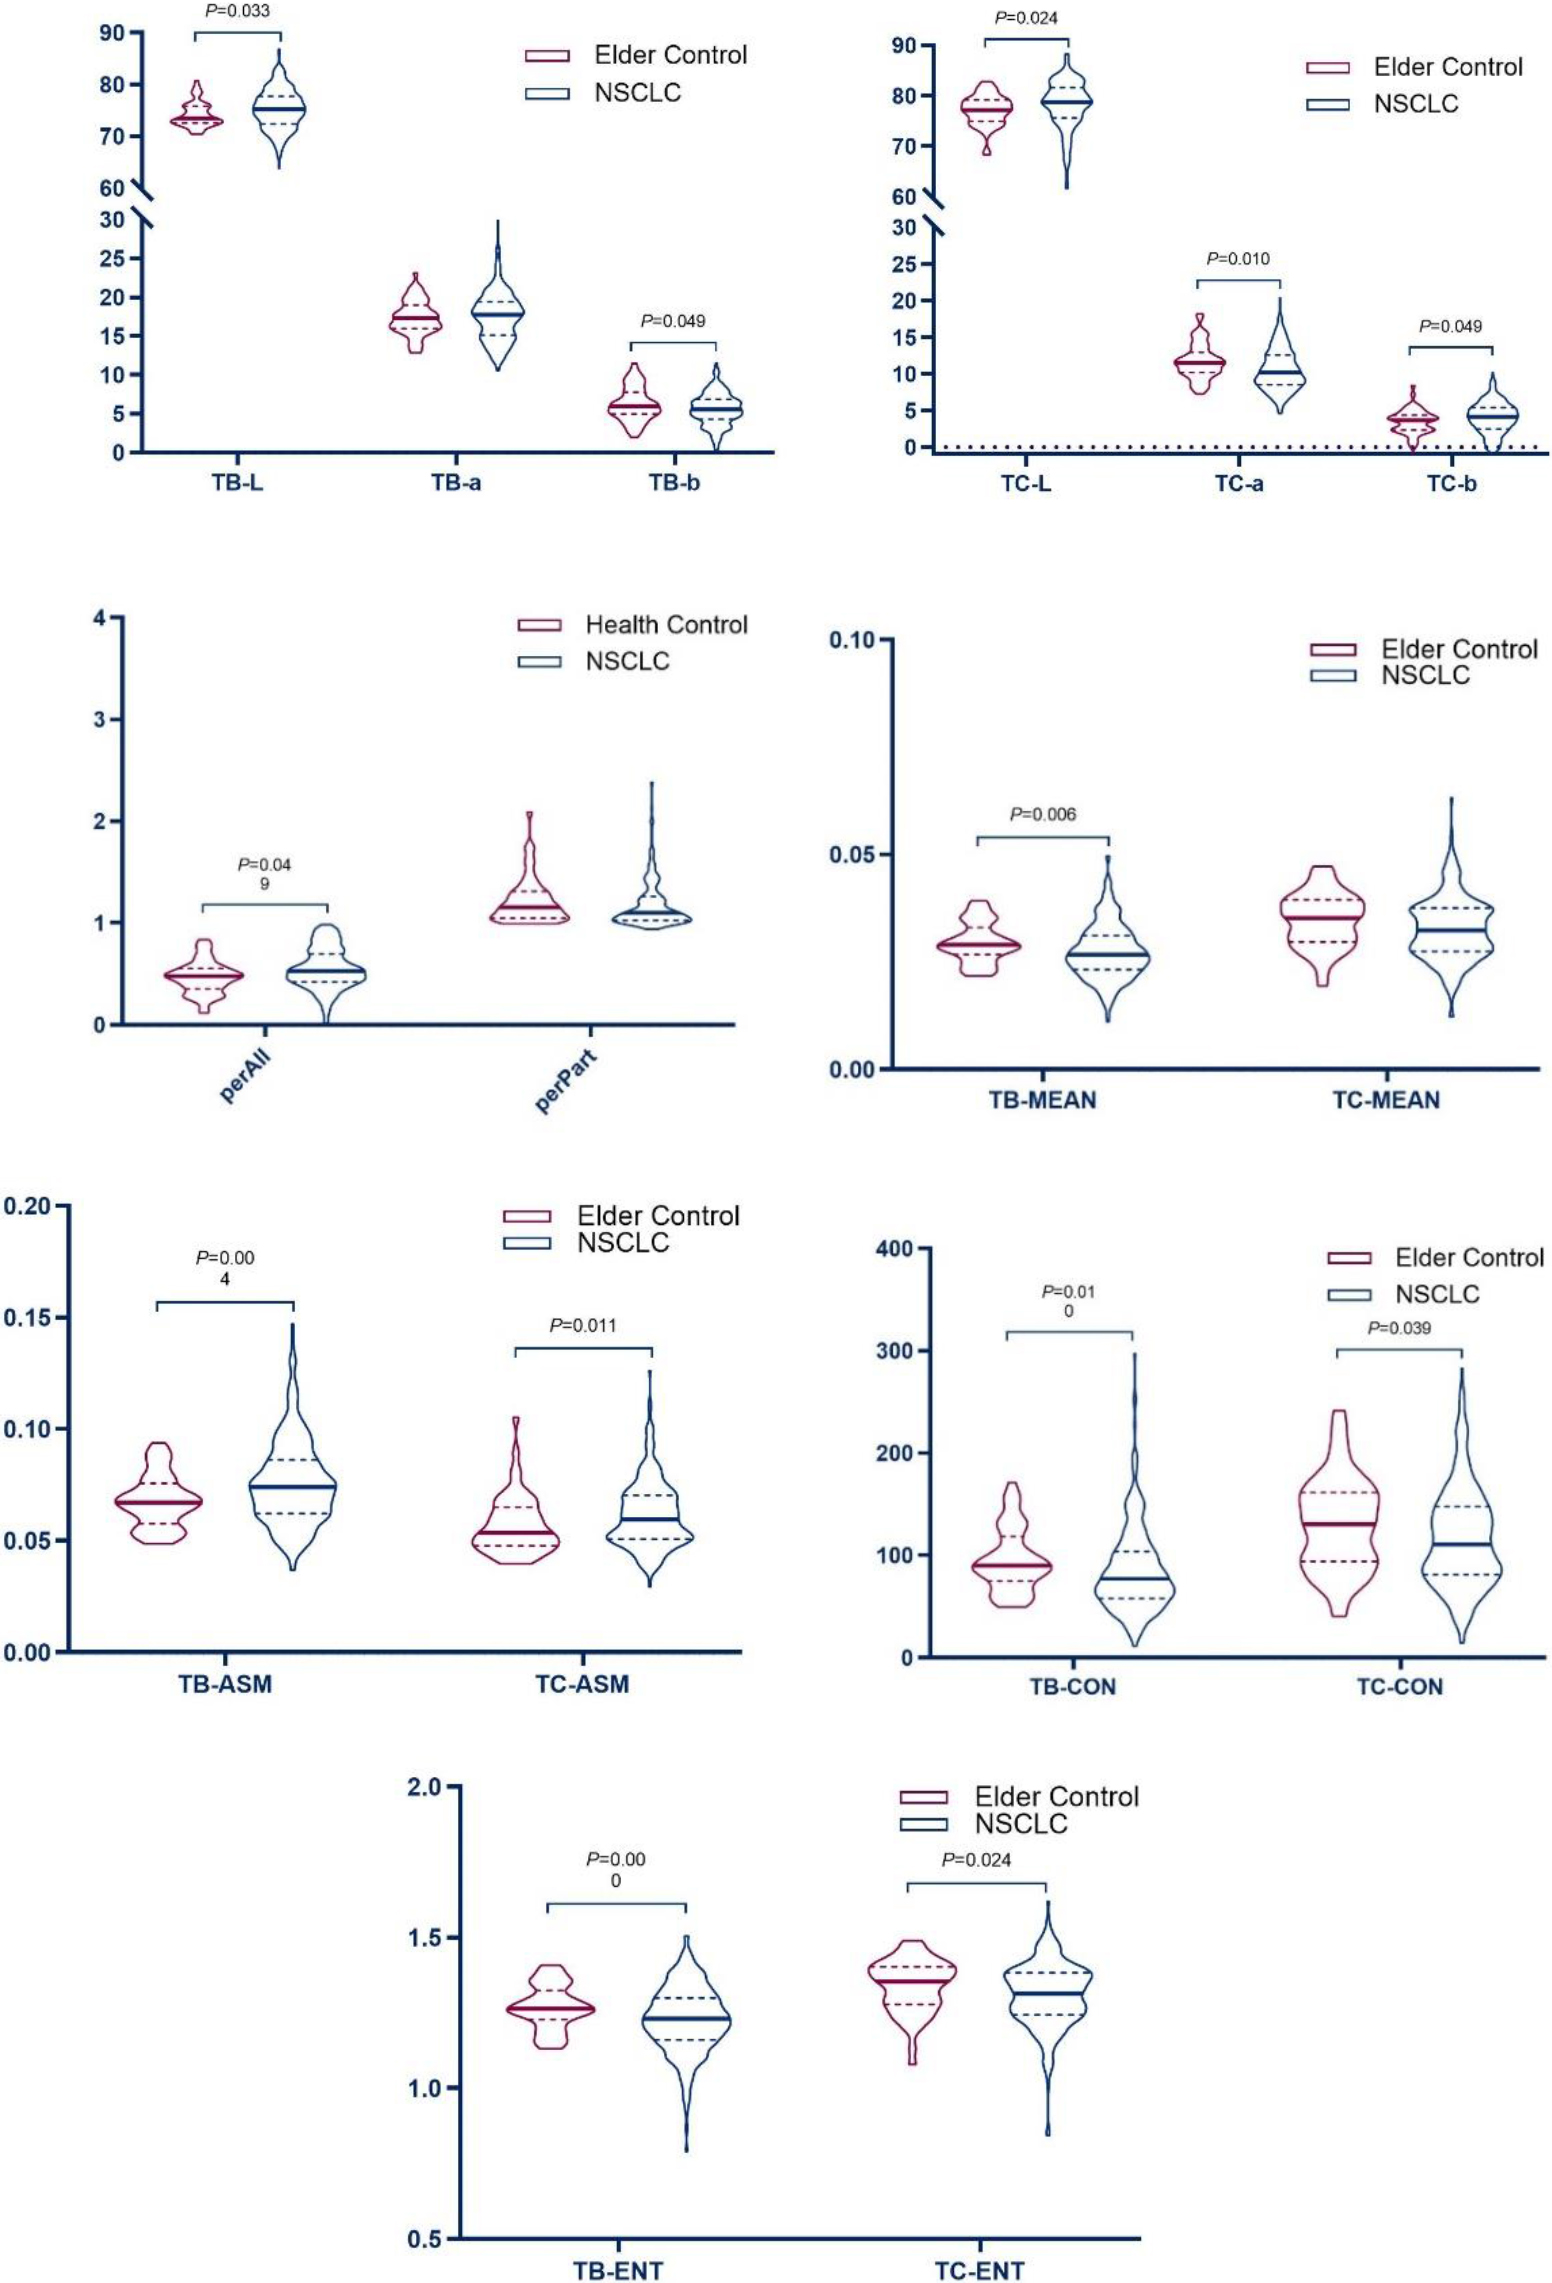
Figure 6.
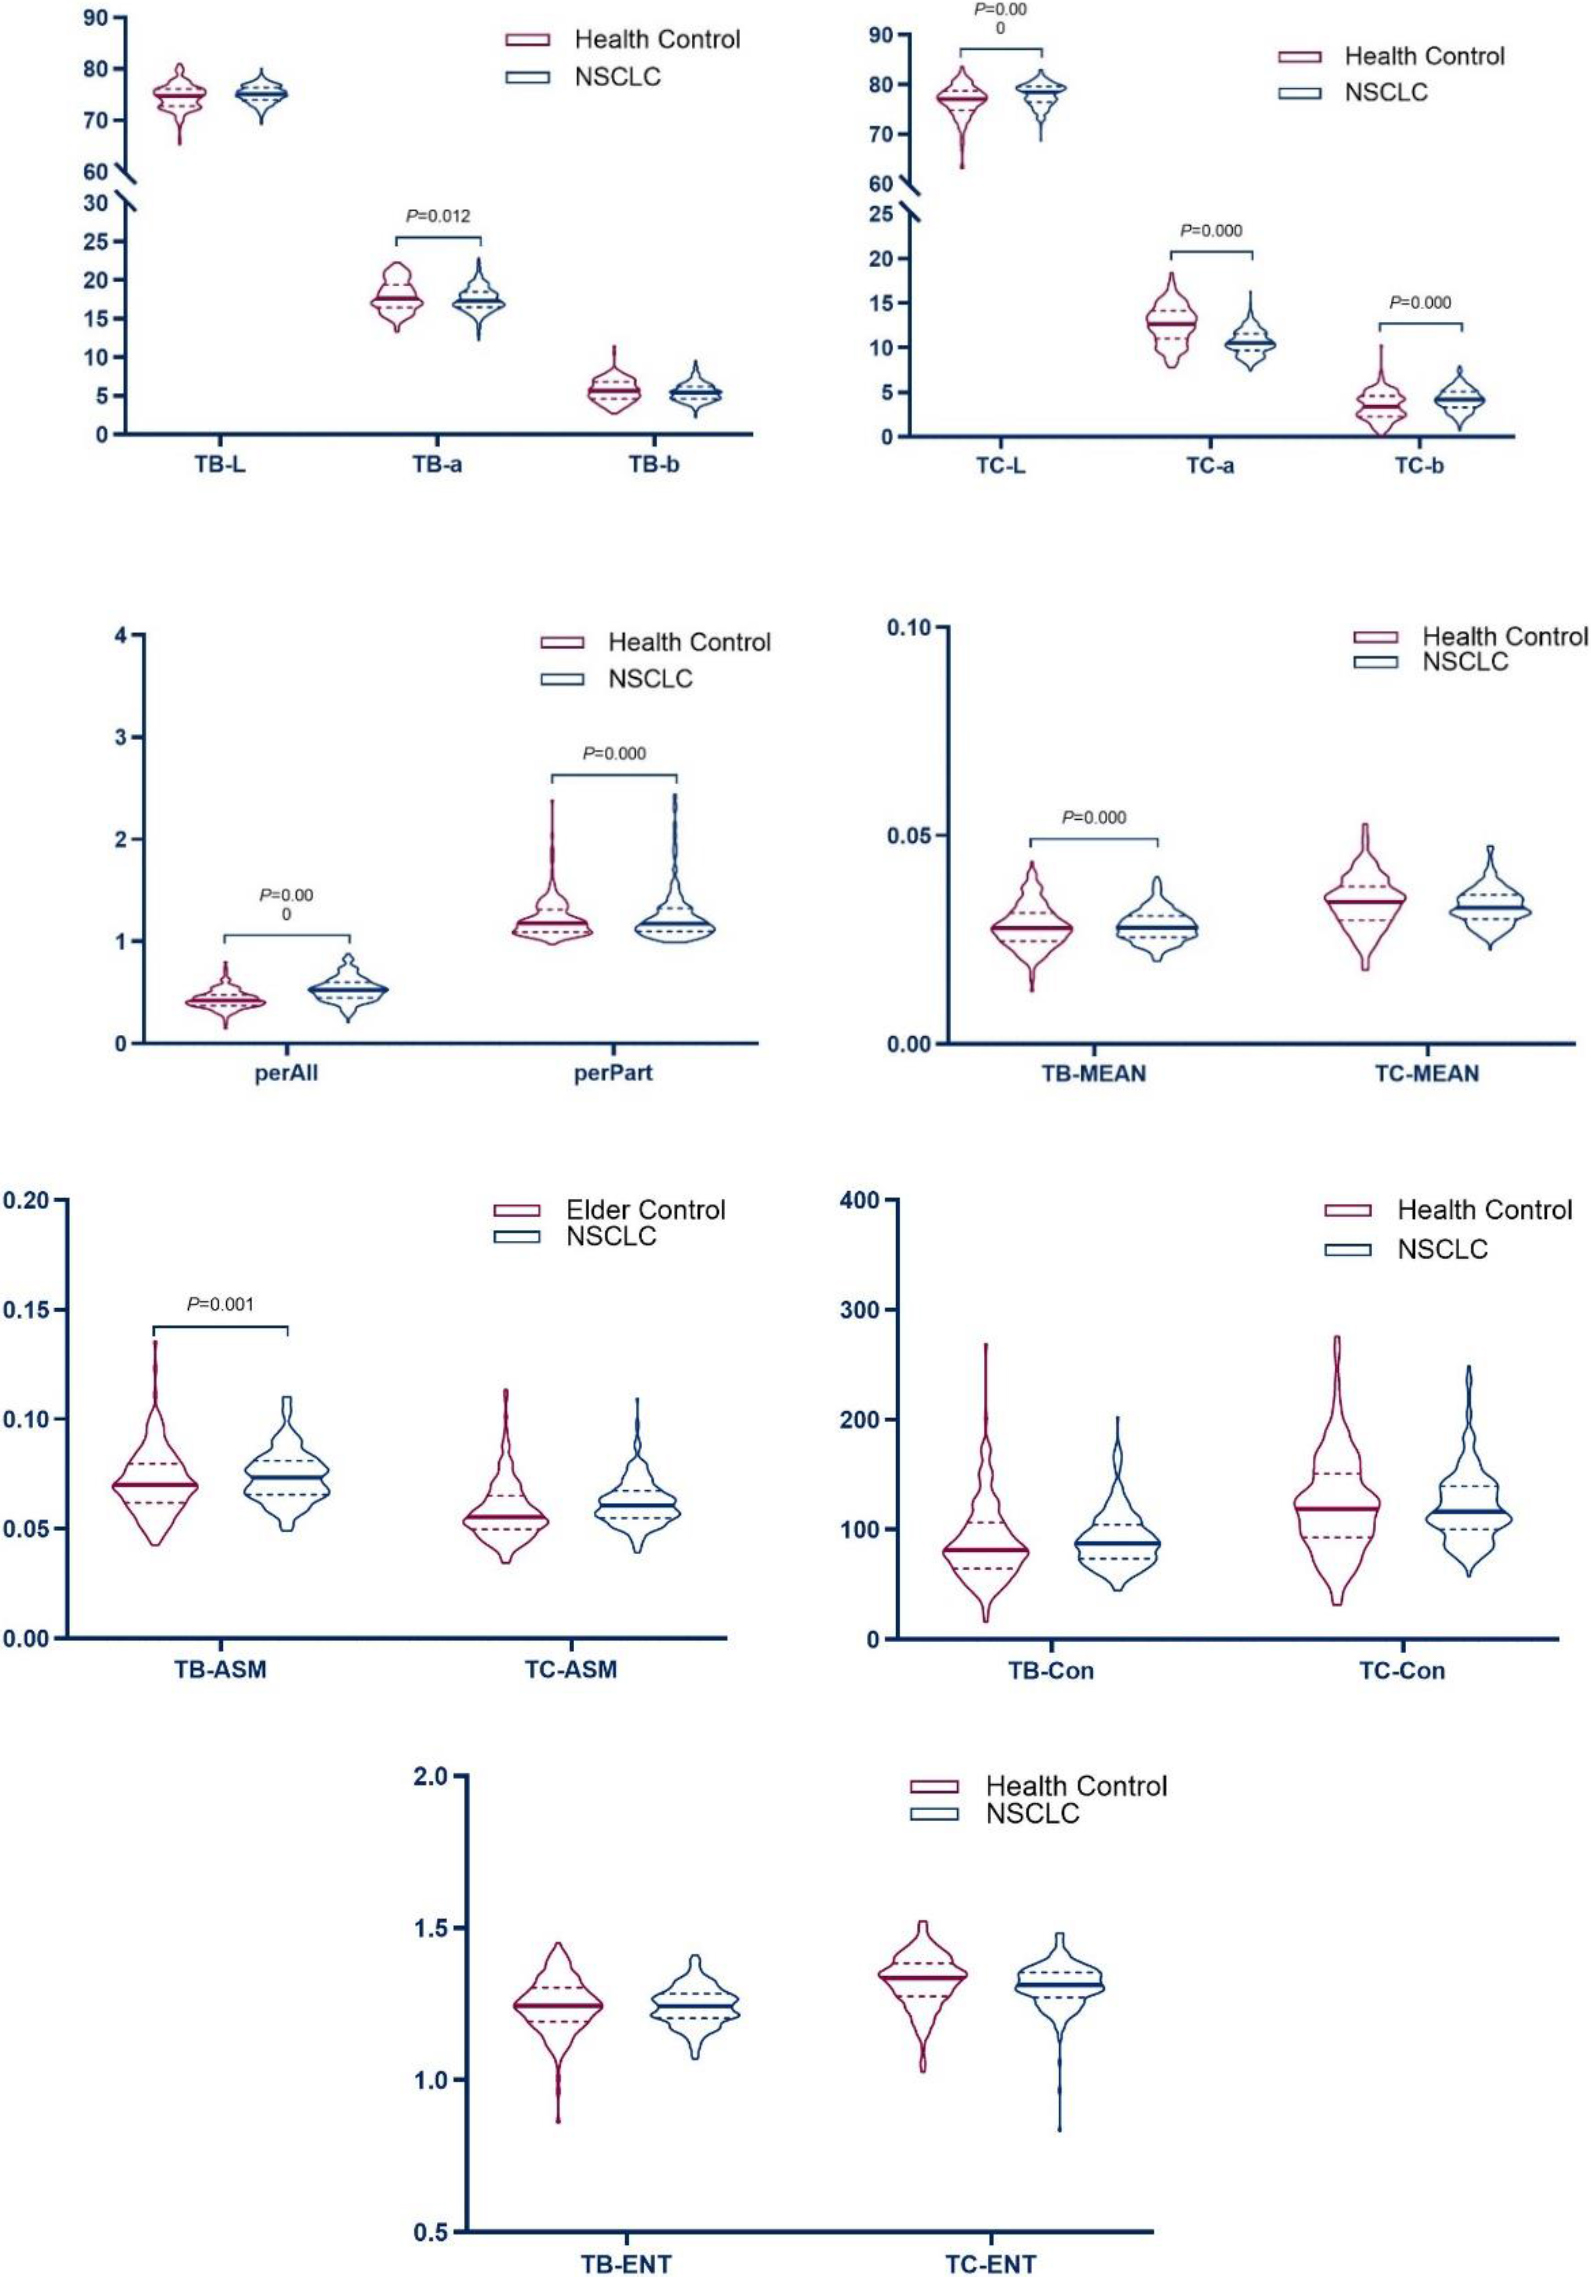
Violin plot of tongue data among the Health Control and NSCLC.
3.2Comparison of tongue features between NSCLC patients and non-tumor patients
Tongue images of 309 NSCLC cases were compared with those of 51 elderly controls to investigate the differences in tongue image characteristics between patients with and non-tumor patients. A light red tongue characterizes a healthy tongue with a thin white coating. Therefore, the differences between 1235 tongue images of NSCLC patients were compared with 163 tongue images of healthy controls with “light red tongue and thin white coating” to compare the tongue images of NSCLC patients and healthy tongue images. The results are shown in Tables 3–6.
Table 3
Comparison of tongue image indexes between the NSCLC group and elderly control group [mean (SD), median (IQR)]
| Tongue index | Elderly control group | NSCLC group |
|
| ||||
|---|---|---|---|---|---|---|---|---|
| TB | L*a*b | L | 73.47 | (72.62–75.87) | 75.14 | (72.48–77.62) | 0.033 | |
| a | 17.34 | (2.24) | 17.63 | (3.16) | 0.790 | 0.430 | ||
| b | 6.25 | (2.2) | 5.61 | (2.11) | 0.049 | |||
| Texture index | CON | 90.12 | (74.96–118.64) | 77.29 | (57.57–104.8) | 0.010 | ||
| ENT | 1.27 | (0.07) | 1.23 | (0.11) | 0.000 | |||
| ASM | 0.07 | (0.06–0.08) | 0.07 | (0.06–0.09) | 0.004 | |||
| MEAN | 0.03 | (0.03–0.03) | 0.03 | (0.02–0.03) | 0.006 | |||
| TC | L*a*b | L | 77.22 | (74.99–79.25) | 78.72 | (75.41–81.42) | 0.024 | |
| a | 11.51 | (10.2–12.92) | 10.28 | (8.5–12.62) | 0.010 | |||
| b | 3.68 | (2.33–4.36) | 4.03 | (2.56–5.41) | 0.049 | |||
| Tongue coating index | perAll | 0.48 | (0.35–0.56) | 0.52 | (0.42–0.68) | 0.049 | ||
| perPart | 1.16 | (1.06–1.32) | 1.11 | (1.04–1.3) | 0.146 | |||
| Texture index | CON | 130.49 | (94.05–161.4) | 109.67 | (81.23–147.33) | 0.039 | ||
| ENT | 1.35 | (1.28–1.4) | 1.31 | (1.24–1.38) | 0.024 | |||
| ASM | 0.05 | (0.05–0.07) | 0.06 | (0.05–0.07) | 0.011 | |||
| MEAN | 0.03 | (0.01) | 0.03 | (0.01) | 0.050 | |||
Note: The
Table 4
Comparison of tongue image indexes between the NSCLC group and healthy control group [mean (SD), median (IQR)]
| Domain | Color space | Index | Healthy control group | NSCLC group |
|
| ||
|---|---|---|---|---|---|---|---|---|
| Tongue | L*a*b | TB-L | 74.08 | (6.35) | 75.08 | (3.79) | 0.051 | |
| TB-a | 17.96 | (2.02) | 17.49 | (3.46) | 2.522 | 0.012 | ||
| TB-b | 5.7 | (1.46) | 5.48 | (2.40) | 1.656 | 0.099 | ||
| Texture index | TB-CON | 81.55 | (64.38–106.37) | 85.39 | (62.17–112.87) | 0.546 | ||
| TB-ENT | 1.24 | (1.19–1.3) | 1.25 | (1.18–1.32) | 0.732 | |||
| TB-ASM | 6.45 | (5.05–7.58) | 6.92 | (5.97–7.83) | 0.001 | |||
| TB-MEAN | 2.82 | (2.45–3.2) | 2.61 | (1.65–3.17) | 0.000 | |||
| Tongue coating | L*a*b | TC-L | 76.64 | (3.32) | 77.94 | (4.89) | 0.000 | |
| TC-a | 12.61 | (2.22) | 10.61 | (2.88) | 10.433 | 0.000 | ||
| TC-b | 3.41 | (2.4–4.61) | 4.23 | (2.55–5.74) | 0.000 | |||
| Tongue coating index | perAll | 0.42 | (0.37–0.48) | 0.51 | (0.42–0.65) | 0.000 | ||
| perPart | 1.18 | (1.09–1.31) | 1.12 | (1.04–1.28) | 0.000 | |||
| Texture index | TC-Con | 118.9 | (92.99–151) | 114.52 | (85.15–150.91) | 0.505 | ||
| TC-ENT | 1.34 | (1.28–1.38) | 1.32 | (1.26–1.39) | 0.279 | |||
| TC-ASM | 5.55 | (4.85–6.46) | 5.51 | (4.53–6.64) | 0.420 | |||
| TC-MEAN | 0.03 | (0.03–0.04) | 0.03 | (0.03–0.04) | 0.693 | |||
Note: The
Table 3’s results showed that the tongue image indexes TB-L, TB-ASM, TC-L, TC-b, TC-ASM, and perAll in the NSCLC group were higher than those in the elderly control group (
The results showed that the tongue image indices TC-L, TC-b, perAll, and TB-ASM in the NSCLC tongue group were higher than those in the healthy control group (
The results showed that, compared with the control group, the brightness of the tongue body and tongue coating in the NSCLC group increased, the red component decreased, the thickness and the yellow component of the tongue coating increased, and the tongue coating was more greasy.
3.3Analysis of tongue image characteristics between the NSCLC group and the healthy control group
The presence of characteristic differences in tongue image indexes between the NSCLC group (309 people) and the healthy control group (163 persons) was analyzed to control the influence of baseline factors on tongue image because of the difference in age distribution between the NSCLC group and the healthy control group. The differences in tongue image characteristics between the NSCLC and healthy control groups were analyzed using binary logistic regression. The results are shown in Tables 5 and 7, respectively.
Table 5
Logistic analysis of tongue image index between the NSCLC and healthy control
| Index | B | OR | 95% CI. |
| |||||
|---|---|---|---|---|---|---|---|---|---|
| Lower limit | Upper limit | ||||||||
| Gender | 520 | 0. | 594 | 0. | 250 | 1. | 411 | 0.238 | |
| Age | 0. | 242 | 1. | 274 | 1. | 212 | 1. | 340 | 0.000 |
| perAll | 5. | 982 | 396. | 041 | 16. | 060 | 9766. | 617 | 0.000 |
| TC-L | 161 | 0. | 851 | 0. | 731 | 0. | 991 | 0.038 | |
| TC-a | 389 | 0. | 678 | 0. | 539 | 0. | 852 | 0.001 | |
Note: The dependent variables were the NSCLC group and healthy control group (0
Figure 7.
Forrest plot of the NSCLC and healthy control.
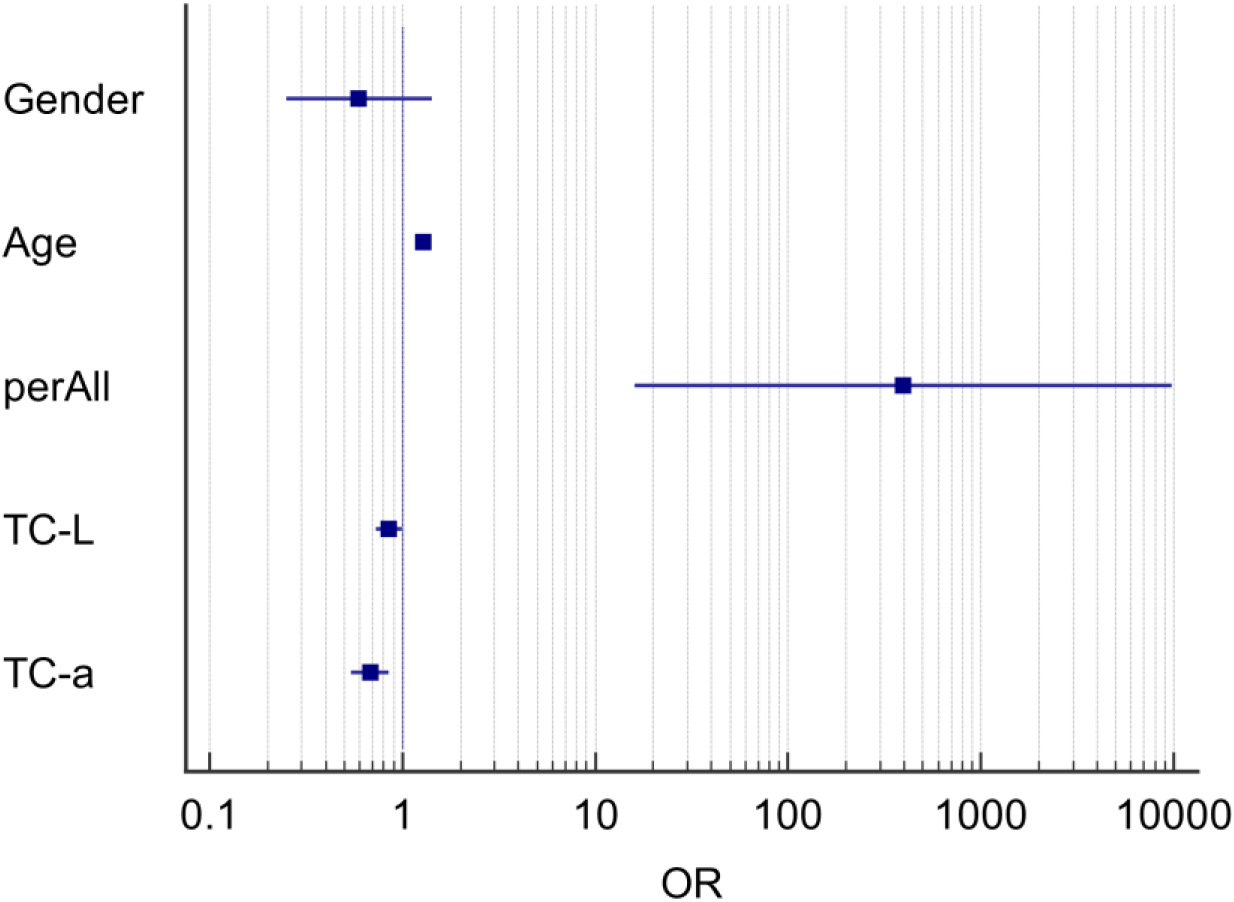
The results in Table 5 show that after controlling for the influence of sex and age, the tongue image indicators perAll, TC-L, and TC-a in the NSCLC and healthy control groups were specific between the two groups (
The results showed that the tongue coating index was the main difference in tongue image features between the NSCLC and healthy control groups. The tongue coating in the NSCLC group was thicker, the red component of the tongue coating was reduced, and the brightness was lower compared with the healthy control group. The above results showed that the tongue image index could reflect the difference between the tongue image of patients with NSCLC and normal tongue image data; therefore, it could be used to represent the change in tongue image characteristics of NSCLC patients.
3.4Tongue image characteristics of different pathological stages of non-small cell lung cancer
Pathological staging plays an important role in the treatment and prognosis of NSCLC patients. Pathological staging is determined according to clinical and pathological factors, which play a key role in selecting treatment and prognosis. Therefore, this study analyzed the characteristics of tongue images of patients with NSCLC with different TNM stages.
Basic information on NSCLC patients with different pathological stages
The number of cases in stages II and III is small in clinical sampling, and both are in the middle stage of disease development. Nevertheless, the two are similar in terms of pathological and tongue manifestations. Therefore, the data of stage II and phase III patients were combined and analyzed and classified into three groups according to stages I, II
Table 6
Basic information on NSCLC patients with different pathological stages [
| Project | Stage I | Stage II | Stage IV | Total | |||||
|---|---|---|---|---|---|---|---|---|---|
| The course of the disease: median (IQR) | 8.067 | (2.1–22.883) | 12.05 | (3.783–21.583)∗ | 19.333 | (11.35–39.492)∗# | |||
| Age median (IQR) | 62 | (56–69) | 66 | (62–71)∗ | 64 | (58–70) | |||
| Gender, | Female | 93 | (67.9) | 19 | (34.5)∗ | 57 | (169)∗ | 169 | (54.7) |
| Male | 44 | (32.1) | 36 | (65.5)∗ | 60 | (51.3)∗ | 140 | (45.3) | |
| Smoking history, | No | 114 | (86.4) | 36 | (65.5)∗ | 85 | (79.4)∗# | 235 | (79.9) |
| Yes | 18 | (13.6) | 19 | (34.5)∗ | 22 | (20.6)∗# | 59 | (20.1) | |
| Family history, | Nothing | 125 | (97.7) | 52 | (94.5) | 95 | (88.8) | 272 | (92.5) |
| Yes | 7 | (5.3) | 3 | (5.5) | 12 | (11.2) | 22 | (7.5) | |
| Hypertension, | No | 101 | (33.0) | 35 | (11.4) | 87 | (28.4) | 223 | (72.9) |
| Yes | 34 | (25.2) | 20 | (36.4) | 29 | (25.0) | 83 | (27.1) | |
| Diabetes, | No | 121 | (39.7) | 49 | (89.1) | 105 | (91.3) | 275 | (90.2) |
| Yes | 14 | (10.4) | 6 | (10.9) | 10 | (8.7) | 30 | (9.8) | |
| Hyperlipidemia, | No | 131 | (96.3) | 53 | (96.4) | 113 | (98.3) | 297 | (97.1) |
| Yes | 5 | (3.7) | 2 | (3.6) | 2 | (2.9) | 9 | (2.9) | |
| Pathological | Adenocarcinoma | 129 | (94.2) | 38 | (69.1)∗ | 97 | (82.9)∗ | 264 | (85.4) |
| classification | Squamous cell | 8 | (5.8) | 17 | (30.9)∗ | 20 | (17.1)∗ | 45 | (14.6) |
| carcinoma | |||||||||
| Operation | No operation | 9 | (6.6) | 18 | (32.7)∗ | 54 | (46.2)∗ | 81 | (26.2) |
| Operation | 128 | (93.4) | 37 | (67.3)∗ | 63 | (53.8)∗ | 228 | (73.8) | |
| Chemotherapy | Not used | 98 | (71.5) | 12 | (21.8)∗ | 41 | (35.0)∗ | 151 | (48.9) |
| Used | 39 | (28.5) | 43 | (78.2)∗ | 76 | (65.0)∗ | 158 | (51.1) | |
| Used within one | 3 | (2.2) | 5 | (9.1)∗ | 13 | (11.1)∗# | 21 | (6.8) | |
| month | |||||||||
Note: * significantly different from stage I; # significantly different from stage II
Table 7
Comparison of tongue image indexes in different pathological stages [mean (SD), median (IQR)]
| Domain | Color space | Index | Phase I | Stage II | Stage IV | |||
|---|---|---|---|---|---|---|---|---|
| Tongue | L*a*b | TB-L | 75.48 | (3.95) | 75.29 | (3.1) | 74.74 | (3.86) |
| body | TB-a | 17.21 | (3.04) | 16.95 | (2.75) | 18.45 | (3.34)∗# | |
| TB-b | 5.88 | (2) | 6.17 | (2.17) | 5.03 | (2.08)∗ | ||
| Texture index | TB-CON | 81.53 | (58.65–108.53) | 80.84 | (58–105.66) | 72.61 | (57.06–100.71) | |
| TB-ENT | 1.24 | (0.11) | 1.23 | (0.11) | 1.22 | (0.11) | ||
| TB-ASM | 0.07 | (0.06–0.09) | 0.07 | (0.06–0.09) | 0.08 | (0.06–0.09) | ||
| TB-MEAN | 0.03 | (0.01) | 0.03 | (0.01) | 0.03 | (0.01) | ||
| Tongue | L*a*b | TC-L | 79.24 | (76.15–81.91) | 78.62 | (75.88–81.64) | 78.43 | (74.74–80.64) |
| coating | TC-a | 10.16 | (8.47–12.72) | 9.81 | (8.16–12.6) | 10.62 | (8.78–12.73) | |
| TC-b | 4.02 | (2.18) | 4.12 | (1.99) | 3.64 | (2.76) | ||
| Tongue coating | perAll | 0.54 | (0.42–0.71) | 0.52 | (0.45–0.74) | 0.5 | (0.41–0.64) | |
| index | perPart | 1.1 | (1.04–1.27) | 1.12 | (1.03–1.36) | 1.12 | (1.04–1.37) | |
| Texture index | TC-CON | 111.92 | (82.71–149.38) | 120.44 | (90.91–155.21) | 102.62 | (75.39–137.96) | |
| TC-ENT | 1.32 | (1.25–1.38) | 1.33 | (1.27–1.39) | 1.3 | (1.23–1.37) | ||
| TC-ASM | 0.06 | (0.05–0.07) | 0.06 | (0.05–0.07) | 0.06 | (0.05–0.07) | ||
| TC-MEAN | 0.03 | (0.03–0.04) | 0.03 | (0.03–0.04) | 0.03 | (0.03–0.04) | ||
Note: * significantly different from stage I; # significantly different from stage II
Table 8
Logistic analysis of tongue image characteristics in different pathological stages
| Stages | Project | B | OR | 95% CI. |
| |
|---|---|---|---|---|---|---|
| Lower limit | Upper limit | |||||
| Reference category: Stage I | ||||||
| Stage IV | Gender | 0.297 | 1.346 | 0.603 | 3.001 | 0.468 |
| Age | 0.004 | 1.004 | 0.967 | 1.042 | 0.830 | |
| Smoking history | 0.846 | 2.331 | 0.854 | 6.360 | 0.099 | |
| Operation | 0.054 | 0.021 | 0.136 | 0.000 | ||
| Course of disease | 0.049 | 1.051 | 1.031 | 1.071 | 0.000 | |
| Pathological type | 0.886 | 0.255 | 3.082 | 0.850 | ||
| TB-a | 0.151 | 1.163 | 1.046 | 1.294 | 0.005 | |
| TB-b | 0.737 | 0.611 | 0.887 | 0.001 | ||
| Reference category: II | ||||||
| Stage IV | Gender | 0.648 | 0.266 | 1.577 | 0.339 | |
| Age | 0.980 | 0.938 | 1.024 | 0.363 | ||
| Smoking history | 0.908 | 0.364 | 2.269 | 0.837 | ||
| Operation | 0.389 | 0.175 | 0.867 | 0.021 | ||
| Course of disease | 0.032 | 1.033 | 1.009 | 1.058 | 0.008 | |
| Pathological type | 0.551 | 0.220 | 1.379 | 0.203 | ||
| TB-b | 0.724 | 0.594 | 0.882 | 0.001 | ||
| TC-a | 0.158 | 1.171 | 1.016 | 1.349 | 0.029 | |
Note: The dependent variable was a pathological stage (1
3.5Comparison of tongue image characteristics of patients with different pathological stages
(1) Three hundred and nine samples were classified into three groups according to different stages to study whether different pathological stages impact tongue images. The results are presented in Table 7.
The results in Table 7 show that the TB-a and TB-b in the stage IV group were significantly different from those in the stage I group and the II
(2) Sex, age, smoking history, pathological classification, surgery, and course of the disease are different in different stages of patients, and they are the factors affecting the clinical staging and tongue manifestation. Therefore, we further analyzed the image indicators of tongue images in the three groups to study whether different pathological stages can independently affect the image characteristics of tongue images. Binary logistic regression analysis was used; Stage I and Stage II
The results in Table 8 show that after controlling for the influence of sex, age, smoking history, pathological classification, surgery, and course of the disease, taking stage I as the reference category, no characteristic tongue image index in stage II
These results show that after controlling for the effects of sex, age, smoking history, pathological classification, surgery, and disease course, the tongue image indices of stage IV NSCLC were lower than those of stage I TB-b and TB-a. Compared with stage II
4.Discussion
NSCLC is all epithelial cancer except SCLC. All types of NSCLC are likely to occur. The most common types of NSCLC are adenocarcinomas, squamous cell carcinomas, and large cell carcinomas. The etiology and pathogenesis of tumors are complex, and their etiology remains unknown. The top risk factors for lung cancer are age, smoking history, past cancer history, family history, and occupational exposure [16].
The results showed that compared with the elderly control group, the tongue body and tongue coating brightness of NSCLC patients increased, the red component decreased, the tongue coating thickened, and the yellow component increased. In addition, the texture of the tongue coating was more delicate, showing a tendency for the thick and greasy coating to change. 1235 tongue images of NSCLC were compared with those of 163 healthy controls. The results showed that the brightness of the NSCLC tongue increased, the red component decreased, the tongue coating thickened, and the yellow component increased. This conclusion is similar to those of previous studies.
Preliminary findings show that a thick tongue with reduced brightness distinguishes a tongue image of NSCLC from that of a healthy tongue. A binary logistic stepwise regression was used to control for gender and age since there was a significant difference in the age distribution between the NSCLC group and the healthy control group (
Generally, the development of tumor disease from stage I to stage IV is a gradual process from excessive pathogenic factors to positive deficiency. However, because of chronic diseases, phlegm and blood stasis are often produced. In the later clinical stage, the increase in TCM deficiency syndrome and mixed syndromes, and the appearance of the tongue changes from pale to dark and even bruised. The results of this experiment showed that there was no significant difference between the phase I group and the stage II
5.Conclusion
The results of this study show that tongue imaging features can provide an objective basis for the diagnosis and efficacy evaluation of NSCLC and can also provide new ideas and methods for the diagnosis and treatment of NSCLC using a combination of traditional Chinese and Western Medicine. The construction of this study was based on a clinical cross-section and belongs to a retrospective case-control design, which is a more commonly used research method for risk prediction models. But models constructed on the basis of disease outcome are not predictive models in the strict sense, while controlled studies have certain limitations, such as the inability to specify risk factors for the outcome and the possibility of bias in the selection of study subjects, etc., which to a certain extent have an impact on the accuracy and reliability of the study.
However, in the future, we will further expand the sample size for research because the clinical conditions are limited, the number of samples is too small, it is based on a cross-sectional study, and there is not enough observation time for continuous observation of pathological changes in samples. Moreover, this study shows that tongue coating changes have important implications in the progression of NSCLC; therefore, further studies will be conducted in the future.
Author contributions
Ling-zhi Zeng and Ji Cui contributed equally to this work. Ling-zhi Zeng designed the study and drafted the manuscript. Ji Cui was responsible for preprocessing the data and checking the results. Tao Jiang and Hai-dan Liu enrolled study subjects and collected data. Ji Cui and Li-ping Tu provided support on data analysis and interpretation. Ya-bin Gong and Ling Xu offered suggestions. Ji Cui and Jia-tuo Xu are the corresponding authors. All authors have reviewed and approved the final manuscript.
Funding
The work was supported by the National Natural Science Foundation of China (82104736, 82104738).
Data availability statement
The datasets generated and analyzed during the current study are not publicly available due to the confidentiality of the data, which is an important component of the National Key Technology R&D Program of the 13th five-year plan (No. 2017YFC1703301) in China. However, the datasets are available from the corresponding author upon reasonable request.
Acknowledgments
The authors are thankful to all participants for sharing their time and experiences.
Conflict of interest
The authors declare no potential conflicts of interest with respect to the research, authorship, and/or publication of this article.
References
[1] | Sung H, Ferlay J, Siegel RL, et al. Global cancer statistics 2020: GLOBOCAN estimates of incidence and mortality worldwide for 36 cancers in 185 countries. CA Cancer J Clin. (2021) ; 71: (3): 209-249. doi: 10.3322/caac.21660. |
[2] | Jialong X, Ying Z. The global prevalence and prevention progress of lung cancer. J-Global. (2020) ; 30: (10): 721-725. |
[3] | Mingming H, Yuan Y, Tongmei Z, et al. Epidemiological characteristics analysis of 7843 cases of primary lung cancer. Tuberculosis and Thoracic Tumors. (2021) ; (3): 4. |
[4] | Li C-D. Diagnostics of Traditional Chinese Medicine. Diagnostics of Traditional Chinese Medicine. Beijing: China TCM Press, (2016) ; 76. |
[5] | China Association of Integrated Traditional Chinese and Western Medicine, China Anti-Cancer Association Traditional Chinese Medicine Diagnosis Cooperation Group. Clinical observation of tongue images in 12448 cases of cancer patients. Tumor. (1987) ; (3): 129-130. |
[6] | Yiqin W, Weichang T, Fufeng L. Development and clinical application of ZBOX-I type tongue and pulse digital analyzer. J Tradit Chin Med. (2008) ; (6): 26-28. |
[7] | Yiheng C, Changjiang L, Lansun S. Design scheme of a new type of tongue analyzer. Meas Control. (2005) ; (5): 34-36+47. |
[8] | Jing W, Xin N. Research and application prospects of BD-SZ portable four-diagnosis and ginseng auxiliary diagnosis and treatment instrument. World Chin Med. (2011) ; 6: (01): 65-66. |
[9] | Jiatuo X. A small desktop digital image acquisition device and method for tongue and face diagnosis: CN108926327A. 2018-12-04[2019-03-18]. |
[10] | Wang Yg, Yang J, Zhou Y, et al. Region partition and feature matching based color recognition of tongue image. Pattern Recognit. Lett. (2007) ; 28: (1): 11-19. doi: 10.1016/j.patrec.2006.06.004. |
[11] | Jiatuo X, Changle Z, Zhaoqin F, et al. Research on computer analysis and recognition of tongue image color features. J Shang Univer Tradit Chin Med. (2004) ; (03): 43-47. |
[12] | Jing Z, Xinfeng Z, Yazhen W, et al. Research on multi-label learning in the classification of TCM tongue images. Beijing Biomed Eng. (2016) ; 35: (02): 111-116. |
[13] | Wang W, Zeng W, He S, et al. A new model for predicting the occurrence of polycystic ovary syndrome: Based on data of tongue and pulse. Digital Health. (2023) ; 9: : 20552076231160323. doi: 10.1177/20552076231160323. |
[14] | Jiang T, Guo X, Tu L, et al. Application of computer tongue image analysis technology in the diagnosis of NAFLD. Computers in Biology and Medicine. (2021) ; 135: : 104622. doi: 10.1016/j.compbiomed.2021.104622. |
[15] | Li J, Yuan P, Hu X, et al. A tongue features fusion approach to predicting prediabetes and diabetes with machine learning. Journal of Biomedical Informatics. (2021) ; 115: : 103693. doi: 10.1016/j.jbi.2021.103693. |
[16] | Ettinger DS, Gubens MA, Patel SP. NCCN guidelines index table of contents. (2018) ; 219. |
[17] | Chinese Medical Association. Guidelines for clinical diagnosis-Tumor Volume. 1st ed. Beijing: People’s Health Publishing House; (2005) . |
[18] | Travis WD, Asamura H, Bankier AA, et al. The IASLC lung cancer staging project: proposals for coding T categories for subsolid nodules and assessment of tumor size in part-solid tumors in the forthcoming eighth edition of the TNM classification of lung cancer. J Thorac Oncol. (2016) ; 11: (8): 1204-1223. doi: 10.1016/j.jtho.2016.03.025. |
[19] | Cuccurullo V, Mansi L. AJCC cancer staging handbook: From the AJCC cancer staging manual (7th edition). Eur J Nucl Med Mol Imaging. (2011) ; 38: (2): 408-408. doi: 10.1007/s00259-010-1693-9. |
[20] | Xu J. Miniaturized handheld tongue image collection device: CN201814562U. 2011-05-04[2019-03-18]. |
[21] | Chen L, Wang D, Liu Y, Gao X, Shang H. A novel automatic tongue image segmentation algorithm: color enhancement method based on L*a*b* color space. 2015 IEEE Int Conf Bioinformatics Biomed (BIBM). (2015) ; pp. 990-993. doi: 10.1109/BIBM.2015.7359818. |
[22] | Kawanabe T, Kamarudin ND, Ooi CY, et al. Quantification of tongue colour using machine learning in Kampo medicine. Eur J Integr Med. (2016) ; 8: (6): 932-941. doi: 10.1016/j.eujim.2016.04.002. |
[23] | Pencina MJ, D’Agostino RB Sr, D’Agostino RB Jr, Vasan RS. Evaluating the added predictive ability of a new marker: From area under the ROC curve to classification and beyond. Stat Med. (2008) ; 27: (2): 157-172. doi: 10.1002/sim.2929. |
[24] | Zhen Q. Establishment of tongue image standard library and reference range of classification features based on expert consensus and its clinical mechanism. Shanghai: Shang Univer Tradit Chin Med. (2017) . |
[25] | Huizu Y. Studys on the distribution of blue tongue in non-small cell lung cancer and the characteristics of TCM syndrome differentiation. Jinan: Shandong University of Traditional Chinese Medicine. (2016) . |
[26] | Xiaojuan L, Binhai C, Xuejing Y. Clinical study on the pathogenesis of “stasis toxin” in bronchogenic carcinoma patients with qi deficiency and blood stasis syndrome. Chin J Tradit Chin Med. (2019) ; 34: (02): 773-777. |


