
Evaluation of menopausal endometrial lesions via mathematical modeling clinical indicators and ultrasonographic parameters
Abstract
BACKGROUND:
The diagnosis of benign and malignant menopausal endometrial lesions (MEL) is often misled by complicated clinical indicators and ultrasonographic parameters in actual clinical applications.
OBJECTIVE:
To investigate the performance of clinical indicators and ultrasonographic parameters in the diagnosis of MEL.
METHODS:
A cohort of 156 enrolled menopausal patients with MEL was divided into benign group (128 cases) and malignant group (28 cases). Two clinical indicators of patient age (PA), abnormal vaginal bleeding (AVB) and three transvaginal ultrasonography (TVS) parameters of endometrial thickness (ET), endometrial uneven echo (EUE) and endometrial blood flow signal (EBFS) were measured for the mathematical modelling. The performance of combined indicators and individual indicators were firstly compared, and then the optimized combined indicators was compared with corresponding individual indicators, respectively.
RESULTS:
Our experiments verified that the mathematical modelling presented robust capabilities in the diagnosis of MEL with the sensitivity, specificity and AUC of 78.6%, 75.8% and 0.83 for combined indicators, and 75.0%, 81.3% and 0.85 for optimized combined indicators, respectively. The cut off thresholds of PA was 57.5 years, ET was 11.5 mm. Furthermore, the AVB presented the most important risk factor among the optimized indicators of PA, ET and AVB (
CONCLUSIONS:
The combined indicators presented better performance in differentiating benign and malignant MEL and the AVB demonstrated the most capability for clinical applications.
1.Introduction
Endometrial lesions (EL) is one of the most common diseases in female groups and its incidence rapidly rises with the increasing of age. With the changes of estrogen and progesterone, the related thickening and proliferation of endometrium would lead to endometrial hyperplasia or space occupying lesions in uterine cavity.
The EL can be classified into benign and malignant lesions. The former had three general subtypes of endometrial polyp, endometritis, endometrial hyperplasia (EH), and the latter mainly consisted of endometrial precancerous lesions (EPL), endometrial carcinoma (EC) and endometrial sarcoma. Accordingly, the EPL was divided into three kinds of mild, moderate and severe endometrial dysplasia. It was reported that the EC was the most frequently found in perimenopausal and postmenopausal women [1, 2]. According to the guideline of surveillance, epidemiology, and end results (SEER), the EC would have better survival rate at the cases of early detection, young patients, and low grade.
Generally, the diagnosis of EL was categorized as invasive and non-invasive approaches. The invasive methods, including diagnostic curettage (DC), hysteroscopy (HS), can directly observe the endometrial samples for biopsying and excising. However, it was easily influenced by the clinical conditions and the operators’ skills and sometimes would lead to uterine perforation, infection and other serious complications [3]. Among the non-invasive methods, the ultrasonic imaging is the most used technique, and the transabdominal ultrasonography (TAS) and TVS has the advantages of real-time dynamic, simple operation, radiation free and good repeatability, etc. [4]. Compared with the modality of TAS, TVS avoided the interference of abdominal fat and intestinal gas and displayed higher quality of image, and even did not need preparation before examination. Thus, the TVS has become popular for diagnosis of EL in clinical practice [5, 6, 7, 8].
For clinical applications, the diagnosis of MEL is often misled by complicated clinical indicators and ultrasonographic parameters. Therefore, a variety of mathematical models were constructed for the performance evaluation for clinical indicators and ultrasonographic parameters. In clinical practice, two clinical indicators of patient age (PA), abnormal vaginal bleeding (AVB) was regarded as the typical symptoms for the differentiation between benign and malignant MEL. Moreover, three ultrasonographic parameters of endometrial thickness (ET) and endometrial uneven echo (EUE), endometrial blood flow signal (EBFS) were closely correlated with the occurrence of MEL.
Some mathematical models with clinical indicators and ultrasonographic parameters were proposed in the literature. It was evident that the EC of older menopause patients had the higher risks of the malignant degree [9, 10, 11, 12]. By multi-variable analysis, the clinical indicator of PA was thought as an independent prognosticator and with a cut-off threshold of 80 years [13]. It was once reported that EC increased significantly after the age of 53 in patients with atypical endometrial hyperplasia [14]. A prospective cohort study for testing the emerging EC biomarkers proved that 90% cases had the symptom of abnormal uterine bleeding [15]. This might explain the significance of abnormal EUE for the EL discrimination. This suggested that the ultrasonographic parameter of ET above the cut off threshold of 3–5 mm was identified as critical indication for endometrial malignancy [16]. Combined with multiple indicators, the risk of EC scoring system was performed with TVS parameters. The overall predicted accuracy of endometrial malignancy was 95.7%. In 89 patients with ET
In clinical applications, early EL generally lacked of specific clinical manifestations. Many woman menopause patients were easily misdiagnosed by persistent irregular vaginal bleeding or vaginal discharge, abnormal uterine echoes, abdominal pain, emaciation, etc. Therefore, the accuracy of early diagnosis and prognosis of treatment become more and more difficult only depending on the prior clinical symptoms or TVS. Therefore, the mathematical model combing clinical indicators and TVS parameters is worthy of being discussed for the potential capability in the diagnosis of MEL.
In our study, two mathematical models of improved scoring model and logistic linear regression were proposed to evaluate the performance of combined and individual indicators for the discrimination of benign and malignant MEL. The novelties of our method were summarized as follows: (1) five typical indicators of PA, AVB, ET, EUE and EBFS were implemented to construct mathematical models; (2) The scoring model and multivariate linear logistic regression were applied in the performance evaluation of combined and individual indicators. This would provide insights for the indicator interpretation and deliver valuable guidance for the early diagnosis of EL.
2.Materials and methods
2.1Materials
From November 2016 to June 2019, a retrospective study was conducted on menopausal patients admitted to our institution. The experimental procedures complied with the standard regulations and our study was formally approved by the local ethics committee. All patients underwent pathological and ultrasonic examinations. With the informed consent of all patients, the inclusion criteria was listed as: (1) underwent 2D TVS, (2) verified by pathological results, (3) without any clinical symptoms of menopausal patients, (4) no clinical symptoms during the six months follow-up, (5) completed and valid clinical data, (6) without hormone or immunotherapy in recent six months.
The clinical information of all enrolled participants were recorded including clinical history, the PA, regular premenopausal menstruation, AVB, surgical methods and pathological results. According to the pathological and ultrasonic results, the enrolled group was divided into: malignant group (28 cases, 61.93
Table 1
The demographic and clinical information of enrolled participants
| Groups | Sub-groups | Cases | PA | AVB (%) |
|---|---|---|---|---|
| Malignant | Complex endometrial hyperplasia with atypical hyperplasia | 2 | 61.93 | 71.43% |
| ( | Endometrial atypical hyperplasia accompanied by focal carcinogenesis | 1 | ||
| Endometrial adenocarcinoma | 23 | |||
| Endometrial stromal sarcoma | 1 | |||
| Uterine adenosarcoma | 1 | |||
| Benign | No obvious thickening of endometrium ( | 29 | 55.58 | 35.16% |
| ( | Simple hyperplasia of the endometrium | 21 | ||
| Complex endometrial hyperplasia | 1 | |||
| Endometrial polyp | 74 | |||
| Endometrial polyp swith simple hyperplasia | 3 |
2.2Image acquisition
The TVS was conducted by the color Doppler ultrasound diagnostic instruments (GE Voluson E10 and E6) with the 5–9 MHz intro-cavity probe IC5-9-D. During the examination, the patients were supine in the lithotomy position and kept with emptied bladder. The adjunctive area of uterus was suspected in multiple views. The multi-views of uterine shape and position, ET, muscularity uniformity, uterine space occupying and bilateral adjunctive mass were observed. Once there existed lesions, the detailed information of location, size, boundary clarity, internal echo uniformity, and surrounding tissues would be collected.
2.3Measurement of clinical indicators
Five indicators of PA, AVB, ET, EUE and EBFS were obtained from clinical history and ultrasound examination. Following the consensus of Chinese gynecological ultrasound guidelines and international endometrial tumor analysis (IETA) [21, 22], the measurement of ET was performed at the median sagittal plane of the uterus. The thickness of double layers of endometrium was measured at the plane with the largest thickness from the anterior and posterior distance of one basal layer to the contralateral basal layer. If there was uterine effusion, the thickness of single layer ET would be measured, and the thickness was calculated by summing the front and back ETs. Especially, the total thickness of ET including the lesions was measured for uterine lesions. Meanwhile, the color Doppler imaging was used to observe the distribution of blood flow signal inside and around the lesion. By adjusting the color blood flow scale to the best range, the sampling line was placed at the most obvious place of blood flow signal for spectrum measurement, and the resistance index (RI) was recorded. All the examinations were reviewed by the experienced ultrasound doctors (with over 10 years’ experience). The measured ultrasound data are listed in Table 2.
Table 2
Evaluation of ultrasonographic parameters in benign and malignant MEL
| Ultrasonic indicators | Malignant group ( | Benign group ( |
|
| |
|---|---|---|---|---|---|
| Endometrial echo | Unevenness | 27 (96.43%) | 86 (67.19%) | 9.84 | 0.002 |
| Even | 1 (3.57%) | 42 (32.81%) | |||
| EBFS | Exist | 8 (28.57%) | 15 (11.72%) | 3.94 | 0.047 |
| Without | 20 (71.43%) | 113 (88.28%) | |||
| ET | 14.89 | 8.98 | 0.021 | ||
2.4Mathematical models
2.4.1Scoring model
The improved scoring model was built on the five indicators of PA, AVB, ET, EUE and EBFS. Here, the indicators were initialized by binary assignment method. The indicators would be set as 0 (age
2.4.2Logistic regression model
Via the univariate logistic regression, the five indicators were optimized for the formulating the regression equation. The logarithmic transformation was performed on the continuous variables to find out the most related variables for MEL. And the OR and P were calculated. Here, the multivariate logistic regression equation is formulated as follows:
(1)
where,
2.5Experiment setup
In our experiment, the individual and combined indicators were evaluated by the receiver operating characteristic curves (ROCs), and then the Delong statistics and univariate logistic regression were used to compare the performance of combined and individual indicators. Moreover, the multivariate logistic regression was performed for evaluating the PA, AVB, ET, EUE and EBFS using stepwise forward method. With the multivariate logistic regression equation, the optimized indicators were obtained and compared with individual indicators as above.
2.6Performance evaluation
Here, sensitivity, specificity, area under curves (AUCs) and cut-off values of indicators were defined to evaluate the outcomes of combined and individual indicators in the diagnosis of benign and malignant MEL, respectively. During the statistical analyses, the measured data was listed as mean
3.Results
3.1Performance evaluation of individual indicators
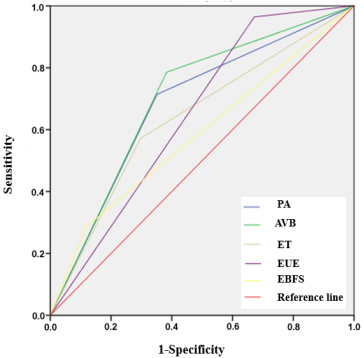
For the diagnosis of benign and malignant MEL, the calculated thresholds of PA, ET were 57.5 years old and 11.5 mm, respectively. In Fig. 1, the AUCs of PA, AVB, ET, EUE, and EBFS for benign and malignant MEL were 0.68, 0.70, 0.64, 0.65, 0.58, respectively. Among the five indicators, the sensitivity of EUE was the highest of 96.4%, and the specificity of EBFS was the highest of 88.3% (Table 3).
Table 3
Performance evaluation of individual indicators
| Indicators | Sensitivity | Specificity | AUC | 95% CI |
|---|---|---|---|---|
| PA | 71.4% | 64.8% | 0.68 | 0.57 |
| AVB | 78.6% | 61.7% | 0.70 | 0.60 |
| ET | 57.1% | 70.3% | 0.64 | 0.52 |
| EUE | 96.4% | 32.8% | 0.65 | 0.55 |
| EBFS | 28.6% | 88.3% | 0.58 | 0.46 |
Figure 1.
ROCs of individual indicators for MEL.
3.2Performance evaluation of combined indicators
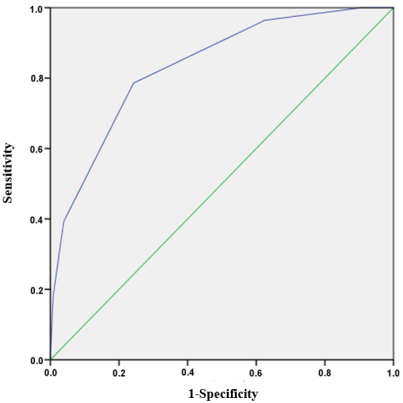
According to the ROCs, the mean total scores of malignant and benign groups were 3.32
Figure 2.
ROC of combined indicators for MEL.
3.3Performance evaluation of combined and individual indicators
Learned from the Delong statistics, the combined indicators of the scoring model showed robust capability than the four individual indicators of AVB, ET, EUE, EBFS (
Table 4
Evaluation of combined indicators and individual indicators
| Variables | 95% CI | Z |
|
|---|---|---|---|
| PA | – | 1.881 | 0.06 |
| AVB | (0.047, 0.219) | 3.302 | 0.0024 |
| ET | (0.0742, 0.269) | 3.451 | 0.0006 |
| EUE | (0.121, 0.255) | 5.517 | |
| EBFS | (0.166, 0.334) | 5.854 |
Note: – indicates no statistical significance.
The five indicators of PA, AVB, ET, EUE and EBFS were analyzed by univariate logistic regression. The results showed that there were statistically significant differences in PA, AVB, ET, EUE and EBFS (
Table 5
Evaluation of univariate logistic regression for five indicators
| Variables | OR |
|
| 95% CI |
|---|---|---|---|---|
| PA | 1.104 | 12.478 | 0.001 | (1.045, 1.166) |
| AVB | 5.720 | 12.417 | (2.168, 15.089) | |
| ET | 1.073 | 8.591 | 0.003 | (1.024, 1.125) |
| EUE | 13.186 | 6.203 | 0.013 | (1.732, 100.374) |
| EBFS | 3.013 | 50.954 | 0.028 | (1.130, 8.037) |
3.4Evaluation of optimized combined and individual indicators
With the establishment of the corresponding logistic regression equation, the results are shown in Table 6. It was evident that the three significant indicators of PA, ET and AVB showed statistical significance (
Table 6
Evaluation of optimized indicators via multivariate logistic regression
| Variables |
| OR |
|
| 95% CI |
|---|---|---|---|---|---|
| PA | 0.147 | 1.150 | 17.123 | (1.076, 1.244) | |
| ET | 0.085 | 1.068 | 7.272 | 0.046 | (1.005, 1.143) |
| AVB | 2.042 | 6.320 | 12.615 | 0.002 | (2.127, 2.195) |
| Constant | 0.000 | 25.841 |
Table 7
Comparison of optimized indicators and individual indicators
| Significant indicators | Sensitivity | Specificity | AUC | 95% CI |
|---|---|---|---|---|
| PA | 71.4% | 64.8% | 0.73 | (0.638, 0.822) |
| AVB | 78.6% | 60.9% | 0.70 | (0.595, 0.800) |
| ET | 57.1% | 70.3% | 0.66 | (0.556, 0.770) |
| Multivariate logistic regression | 75.0% | 81.3% | 0.85 | (0.786, 0.925) |
Figure 3.
ROCs of optimized combined and individual indicators.
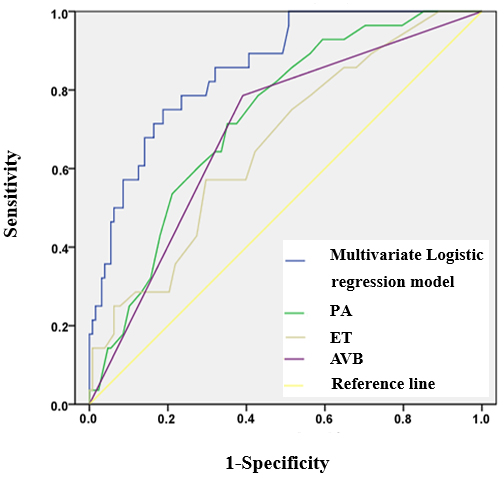
The diagnostic efficacy of benign and malignant MEL obtained by regression equation is shown in Table 7 and Fig. 3. The sensitivity, specificity and AUC of the regression model in the diagnosis of MEL were 75.0%, 81.3% and 0.85, respectively.
4.Discussion
This study retrospectively analyzed the clinical indicators and ultrasonographic parameters in the diagnosis of MEL, and concluded that PA, AVB, ET, EUE and EBFS could be used to identify the benign and malignant MEL. With the evaluation of those indicators, the scoring model and logistic regression had the similar clinical significance in the diagnosis of MEL and would provide reliable basis for the classification of MEL.
Among the five indicators, three indicators of PA, AVB and ET showed higher sensitivity and specificity in the diagnosis of MEL.There was a significant difference in PA for discriminating the benign and malignant MEL. The PA of the malignant group was higher than those of benign group. The diagnostic efficacy indicated that PA was one of the valuable indicators of endometrial malignancy, and it was consistent with endometrial cancer diagnosis and treatment standards (2018 edition) as well as previous studies [23, 24, 25, 26]. It was learned from our experiments that AVB was statistically significant in differentiating benign and malignant MEL. Combining with the main clinical symptoms of EC patients, AVB was an important indicators for 90% of menopausal patients.
In this study, the ET of 11.5 mm was the cut off value for clinical diagnosis. For menopausal women without abnormal bleeding, the sensitivity and specificity for the diagnosis of EC were the best at the ET of 11 mm [27]. More studies showed that ET was associated with EC in postmenopausal women [28, 29, 30]. Meanwhile, the risk of EC increased with increased ET [31]. In our experiment, the EUE and EBFS of malignant group were higher than those of benign group. During the examination, the ultrasound images showed that the menopausal endometrium become thinner alike the line shape, and there was no obvious blood flow signal. According to the EH, it should be alert once the endometrial thicken or more detected chaotic blood flow signals [32]. Learned from our experiment, the combined indicators of the scoring model was better than the most of individual indicators except for the PA. Multivariate logistic regression analysis showed that AVB was the most correlated risk factors with the maximum OR value. This would bring reliable indications for the clinical applications in MEL. Therefore, the menopausal women with the two mentioned indicators of AVB, ET should be preserved the high risks of malignant lesions.
Referenced by the guidelines of 2010 college of obstetricians and gynecologists of Canada (SOGC), it recommend that only endometrial thickening of postmenopausal asymptomatic women don’t regularly need for endometrial clinical samples. Especially, if the clinical cases existed typical ultrasonic indicators, such as EUE, EBFS and ET above 11 mm, the further examination of diagnostic curettage or other follow-up treatments should be required. This is consistent with our results.
However, there is still no consensus on the ET cut-off value of menopausal women undergoing diagnostic curettage or hysteroscopic surgery. Usually, surgery was strongly suggested while the menopausal ET reached to 10–15 mm. The ET of 11 mm was also reported as the most common criterion [33]. Other studies proposed that the ET should not be used as a predictor of EC [34, 35, 36].
With the multiple indicators, the two mathematical models had better guiding significance for clinical diagnosis and treatment. For menopausal women with AVB, the TVS should be suggested in the screening of MEL. Together with the follow-up observations, diagnostic curettage or hysteroscopy examination, the early detection and treatment of MEL would greatly improve the recovery rate.
5.Conclusions
The combined indicators presented better performance in the diagnosis of benign and malignant MEL. The indicators of PA, AVB and ET were considered as independent risk factors, and the AVB demonstrated the most typical indication for clinical applications.
Acknowledgments
The authors thank Ms. Ying Zhang for the assistance in data collection.
Conflict of interest
None to report.
References
[1] | Mascilini F, Testa AC, Van Holsbeke C, Ameye L, Timmerman D, Epstein E, et al. Evaluating myometrial and cervical invasion in women with endometrial cancer: Comparing subjective assessment with objective measurement techniques. Ultrasound Obstet Gynecol. (2013) ; 42: (3): 353–358. doi: 10.1002/uog.12499. |
[2] | Guo JL, Tong JY, Zheng JF. Circular RNAs: A Promising Biomarker for Endometrial Cancer. Cancer Manag Res. (2021) ; 13: : 1651–1665. doi: 10.2147/CMAR.S290975. |
[3] | Okohue JE. Overview of hysteroscopy. West Afr J Med. (2020) ; 37: (2): 178–182. |
[4] | Sun HY. Value of transvaginal ultrasound in the diagnosis of endometrial lesions in postmenopausal patients with vaginal bleeding. Journal of Chengde Medical College. (2018) ; 35: (1): 29–31. |
[5] | Du HY. Comparison of the value of transvaginal and transabdominal ultrasound in the diagnosis of endometrial lesions. Imaging Research and Medical Applications. (2020) ; 4: (8): 177–178. |
[6] | Li L. Comparison of transvaginal ultrasonography and abdominal ultrasonography in endometrial polypoid lesions. Chinese Medical Guide. (2020) ; 18: (9): 144–145. |
[7] | Wang ZB, Liu Q, Gong X, Li HT. Comparison of transvaginal ultrasound and abdominal ultrasound in the diagnosis of endometrial lesions. Clinical Research. (2017) ; 25: (3): 12–13. |
[8] | Wang CZ. Comparative study of transvaginal ultrasound and abdominal ultrasound in the diagnosis of endometrial lesions. Journal of Applied Medical Technology. (2019) ; 26: (9): 1121–1123. |
[9] | Marnitz S, Köhler C, Gharbi N, Kunze S, Jablonska K, Herter J. Evolution of adjuvant treatment in endometrial cancer-no evidence and new questions? Strahlenther Onkol. (2018) ; 194: (11): 965–974. doi: 10.1007/s00066-018-1339-6. |
[10] | Yoney A, Yildirim C, Bati Y, Unsal M. Low risk stage I endometrial carcinoma: Prognostic factors and outcomes. Indian J Cancer. (2011) ; 48: (2): 204–210. |
[11] | Braun MM, Overbeek-Wager EA, Grumbo RJ. Diagnosis and management of endometrial cancer. Am Fam Physician. (2016) ; 93: (6): 468–474. |
[12] | Morice P, Leary A, Creutzberg C, Abu-Rustum N, Darai E. Endometrial cancer. Lancet. (2016) ; 387: (10023): 1094–1108. doi: 10.1016/S0140-6736(15)00130-0. |
[13] | Hag-Yahia N, Gemer O, Eitan R, Raban O, Vaknin Z, Levy T, et al. Age is an independent predictor of outcome in endometrial cancer patients: An Israeli Gynecology Oncology Group cohort study. Acta Obstet Gynecol Scand. (2021) ; 100: (3): 444–452. doi: 10.1111/aogs.14015. |
[14] | Cakmak Y, Oge T. The effect of age on prediction of concurrent endometrial cancer in patients with atypical endometrial hyperplasia. European Journal of Gynaecological Oncology. (2020) ; 41: (4): 2020. doi: 10.31083/j.ejgo.2020.04.5351. |
[15] | Clarke MA, Long BJ, Sherman ME, Lemens MA, Podratz KC, Hopkins MR, et al. A prospective clinical cohort study of women at increased risk for endometrial cancer. Gynecol Oncol. (2020) ; 156: (1): 169–177. doi: 10.1016/j.ygyno.2019.09.014. |
[16] | Clarke MA, Long BJ, Sherman ME, Long BJ, Lemens MA, Podratz KC, et al. Risk assessment of endometrial cancer and endometrial intraepithelial neoplasia in women with abnormal bleeding and implications for clinical management algorithms. Am J Obstet Gynecol. (2020) ; 223: (4): 549.e1–549.e13. doi: 10.1016/j.ajog.2020.03.032. |
[17] | Abdalla S. Diagnostic performance of ultrasound scoring in the prediction of endometrial malignancy in post-menopausal bleeding. European society of radiology; (2020) . |
[18] | Stachowicz N, Smoleń A, Ciebiera M, Łoziński T, Poziemski P, Borowski D, et al. Risk assessment of endometrial hyperplasia or endometrial cancer with simplified ultrasound-based scoring systems. Diagnostics (Basel). (2021) ; 11: (3): 442. doi: 10.3390/diagnostics11030442. |
[19] | Liu MJ, Liu ZF, Yin WH, Chen XR, Gao LY, Sun HJ. Application of transvaginal three-dimensional power Doppler ultrasound in benign and malignant endometrial diseases. Medicine (Baltimore). (2019) ; 98: (46): e17965. doi: 10.1097/MD.0000000000017965. |
[20] | Faria SC, Devine CE, Rao B, Sagebiel T, Bhosale P. Imaging and staging of endometrial cancer. Semin Ultrasound CT MR. (2019) ; 40: (4): 287–294. doi: 10.1053/j.sult.2019.04.001. |
[21] | Chinese Medical Doctor Association ultrasound Branch. Guidelines for Gynecological ultrasound examination in China. People’s Medical Publishing House; (2017) . |
[22] | Leone FP, Timmerman D, Bourne T, Valentin L, Epstein E, Goldstein SR, et al. Terms, definitions andmeasurements to describe the sonographic features of the endometriumand intrauterine lesions: Aconsensus opinion from the International Endometrial Tumor Analysis (IETA) group. Ultrasound Obstet Gynecol. (2010) ; 35: (1): 103–112. doi: 10.1002/uog.7487. |
[23] | Marnitz S, Köhler C, Gharbi N, Kunze S, Jablonska K, Herter J. Evolution of adjuvant treatment in endometrial cancer no evidence and new questions? Strahlenther Onkol. (2018) ; 194: (11): 965–974. doi: 10.1007/s00066-018-1339-6. |
[24] | Yoney A, Yildirim C, Bati Y, Unsal M. Low risk stage I endometrial carcinoma: Prognostic factors and outcomes. Indian J Cancer. (2011) ; 48: (2): 204–210. doi: 10.4103/0019-509X.82895. |
[25] | Braun MM, Overbeek-Wager EA, Grumbo RJ. Diagnosis and management of endometrial cancer. Am Fam Physician. (2016) ; 93: (6): 468–474. |
[26] | Morice P, Leary A, Creutzberg C, Abu-Rustumc N, Darai E. Endometrial cancer. Lancet. (2016) ; 387: (10023): 1094–1108. doi: 10.1016/S0140-6736(15)00130-0. |
[27] | Saccardi C, Vitagliano A, Marchetti M, Turco AL, Tosatto S, Palumbo M, et al. Endometrial cancer risk prediction according to indication of diagnostic hysteroscopy in post-menopausal women. Diagnostics (Basel). (2020) ; 10: (5): 257. doi: 10.3390/diagnostics10050257. |
[28] | Soja M, Masternak M, Piwowarczyk I, Janas L, Szyłło K, Nowak M. Analysis of the results of invasive diagnostic procedures in patients referred to gynecologic department due to abnormal uterine bleeding. Prz Menopauzalny. (2020) ; 19: (4): 155–159. |
[29] | Wang J, Wieslander C, Hansen G, Cass I, Vasilev S, Christine H. Thin endometrial echo complex on ultrasound does not reliably exclude type 2 endometrial cancers. Gynecol Oncol. (2006) ; 101: (1): 120–125. doi: 10.1016/j.ygyno.2005.09.042. |
[30] | Hosoi A, Ueda Y, Shindo M, Nakagawa S, Matsuzaki S, Kobayashi S, et al. Endometrial thickness measured by ultrasonography in postmenopausal patients with endometrial carcinoma has significance, irrespective of histological subtype. Int J Gynecol Cancer. (2013) ; 23: (7): 1266–1269. doi: 10.1097/IGC.0b013e31829f1857. |
[31] | Lin MY, Dobrotwir A, McNally O, Abu-Rustum NR, Narayan K. Role of imaging in the routine management of endometrial cancer. Int J Gynaecol Obstet. (2018) ; 143: (Suppl2): 109–117. doi: 10.1002/ijgo.12618. |
[32] | Liu H. Clinical analysis of transvaginal color Doppler ultrasound in diagnosing uterine lesions in postmenopausal women. Imaging Research and Medical Applications. (2020) ; 4: (5): 161–162. |
[33] | Wang TH, Zhang HY. Research progress of endometrial thickening after menopause. International Journal of Reproductive Health/Family Planning. (2017) ; 36: (004): 349–352. |
[34] | Remondi C, Sesti F, Bonanno E, Pietropolli A, Piccione E. Diagnostic accuracy of liquid-based endometrial cytology in the evaluation of endometrial pathology in postmenopausal women. Cytopathology. (2013) ; 24: : 365–371. doi: 10.1111/cyt.12013. |
[35] | Seckin B, Cicek MN, Dikmen AU, Bostancı EI, Muftuoglu KH. Diagnostic value of sonography for detecting endometrial pathologies in postmenopausal women with and withoutbleeding. J Clin Ultrasound. (2016) ; 44: (6): 339–346. doi: 10.1002/jcu.22329. |
[36] | Billingsley CC, Kenne KA, Cansino CD, Backes FJ, Cohn DE, O’Malley DM, et al. The Use of Transvaginal Ultrasound in Type II Endometrial Cancer. Int J Gynecol Cancer. (2015) ; 25: (5): 858–862. doi: 10.1097/IGC.0000000000000423. |


