
Boosting framework via clinical monitoring data to predict the depth of anesthesia
Abstract
BACKGROUND:
Prediction of the depth of anesthesia is a difficult job in the biomedical field.
OBJECTIVE:
This study aimed to build a boosting-based prediction model to predict the depth of anesthesia based on four clinical monitoring data.
METHODS:
Boosting is a framework algorithm that is used to train a series of weak learners into strong learners by assigning different weights according to their classification accuracy. The input of the boosting-based prediction model included four types of clinical monitoring data: electromyography, end-tidal carbon dioxide partial pressure, remifentanil dosage, and flow rate. The output was the depth of anesthesia.
RESULTS:
The boosting framework model built in this study achieved higher prediction accuracy and a lower discrete degree in predicting the depth of anesthesia compared with the DT-, KNN-, and SVM-based models.
CONCLUSIONS:
The boosting framework was used to set up a prediction model to predict the depth of anesthesia based on four clinical monitoring data. In the experiments, the boosting framework model of this study achieved higher prediction accuracy and a lower discrete degree. This model will be useful in predicting the depth of anesthesia.
1.Introduction
Prediction of the depth of anesthesia is a difficult job in the biomedical field. The depth of anesthesia is related to the life safety and rehabilitation of patients in operation [1]. Shallow anesthesia can lead to intraoperative awareness, and deep anesthesia can make it difficult to meet the needs of the operation. Therefore, a prediction model to predict the depth of anesthesia needs to be proposed.
Many factors affect the depth of anesthesia. Electromyogram (EMG) records the bioelectrical imaging of muscle fibers. It is important to evaluate human activity in the anesthesia system. The monitoring of end-tidal carbon dioxide partial pressure (ETCO2) reflects lung ventilation and pulmonary blood flow. Ventilation is adjusted according to ETCO2 measurements during anesthesia. Remifentanil is a common anesthetic, and the dosage and flow rate of remifentanil also affect the depth of anesthesia. In this study, EMG, ETCO2, remifentanil dosage, and flow rate were selected as the main factors affecting the depth of anesthesia. A prediction model was proposed to predict the depth of anesthesia. Supervised learning was applied to the field of anesthesia to mine data or build a model to predict the depth of anesthesia [2].
Decision tree (DT) [3] was used to study the anesthesia depth index [4]. Support vector machine (SVM) [5] methods were used to monitor the level of hypnosis based on a series of striking features [6]. The K-nearest neighbor (KNN) [7] was used in clinical practice to classify states of anesthesia as awake, mild, moderate, and deep [8]. However, these methods are sensitive to parameters and easy to overfit, and have low precision. Therefore, these methods might not meet the requirements in specific scenarios. Boosting is an ensemble learning algorithm that combines a set of basic classifiers with different weights to become a strong classifier [9]. It is not easy to overfit. Boosting is highly suitable for building a prediction model for the depth of anesthesia.
In this study, the boosting framework was used to build a prediction model to predict the depth of anesthesia based on four clinical monitoring data. Boosting is a framework algorithm that usually trains a series of weak learners into strong learners by giving different weights according to their classification accuracy. The input of the proposed prediction model included four clinical monitoring data EMG, ETCO2, remifentanil dosage, and flow rate. The output was the depth of anesthesia. DT, SVM, and KNN also were used to build the proposed prediction models for the depth of anesthesia. The results of this study showed that the boosting framework model had a lower mean-squared error (MSE), mean absolute error (MAE), and a higher R-square (R2) compared with those of the DT-, KNN-, and SVM-based models.
The contributions of this study are as follows:
1) EMG, ETCO2, remifentanil dosage, and flow rate were selected as indicators to predict the depth of anesthesia more accurately.
2) The core of this study was that a boosting-based prediction model to predict the depth of anesthesia was built based on four clinical monitoring data.
3) Several popular machine learning algorithms, such as DT, KNN, and SVM, were used to build prediction models to compare performances in predicting the depth of anesthesia.
4) In the experiments, the boosting framework model of this study achieved higher prediction accuracy and a lower discrete degree in predicting the depth of anesthesia compared with the DT-, KNN-, and SVM-based models.
The structure of this study was as follows: Section 2 presents several popular prediction modeling methods; Section 3 presents the proposed methods; Section 4 presents the experimental design, the experimental results, and the discussions; and Section 5 presents the conclusion.
2.Method
2.1Decision tree
DT is a tree structure in which each internal node represents a test on an attribute, each branch represents a test output, and each leaf node represents a category. In machine learning, DT is a predictive model. It represents a mapping between object attributes and object values. Entropy represents how chaotic the system is.
The expression for entropy is defined by:
(1)
where
2.2K-nearest neighbors
According to KNNs, every sample can be represented by its closest
Distance can be measured by several ways; one of the most commonly used is the Euclidean distance, expressed as:
(2)
2.3Support vector machine
For regression problem, given the training data
For the sample
The learned regression model of SVM is defined as:
(3)
where
3.Proposed methods
A framework algorithm called boosting was designed to obtain a subset of samples by operating on the sample set; subsequently, a series of base classifiers were trained on the subset with a weak classification algorithm over time by tweaking error measures. These models were trained sequentially, and not in parallel. Weak learners were those with an error rate of slightly less than 50%. A series of trained weak learners were combined, and each weak learner
Let
For
a. Select
(4)
b. Compute the weight of the learner chosen.
c. Update the weights of the training examples
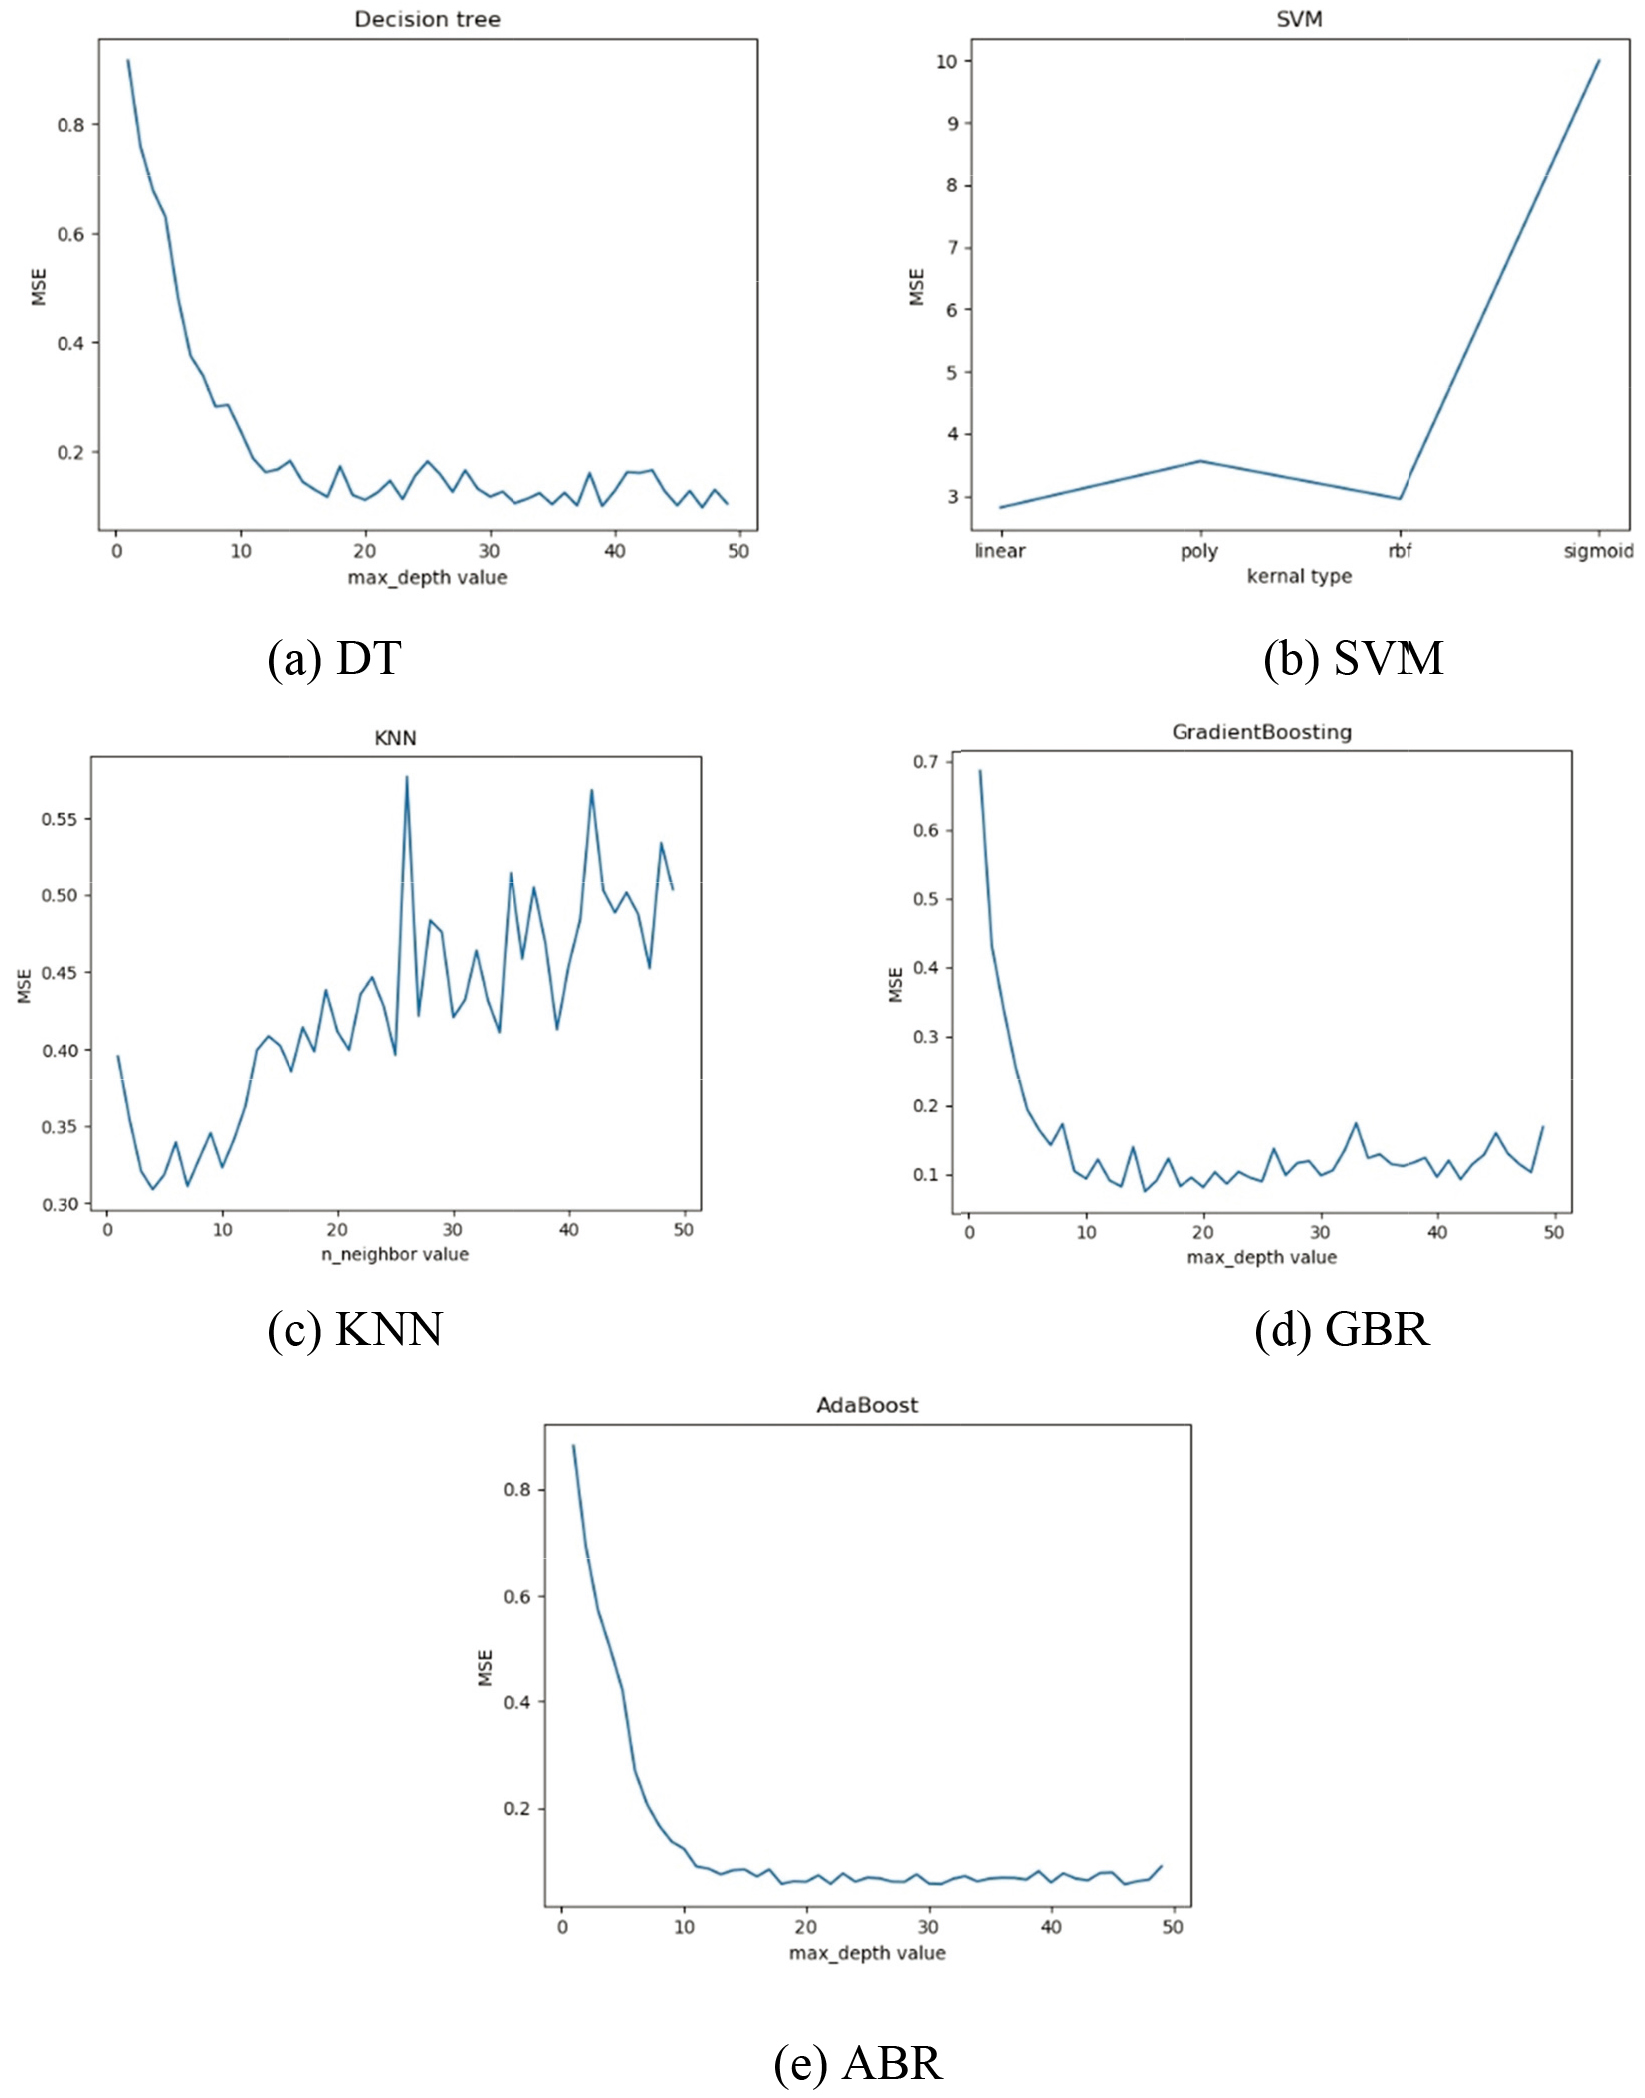
Figure 1.
Relationship of different parameters with MSE.
The boosting framework is a method for combining weak learner
(5)
Two typical representatives in boosting framework were the gradient boosting regressor (GBR) [10] and AdaBoost regressor (ABR) [11]. ABR used fractional error points to identify problems and improve the model by adjusting the weight of fractional error points. The samples misclassified by the previous basic classifier could be strengthened, and the weighted samples could be used to train the next basic classifier again. At the same time, a new weak classifier was added in each round until a predetermined small error rate or a predetermined maximum number of iterations was reached. Different from ABR, GBR selected the gradient descent direction during iteration to ensure the best final result. If the loss function declined continuously, it indicated the model was constantly improving, and the best way was to make the loss function decline in its gradient direction.
4.Experiments
4.1Data set
The data set in the experiments came from the public data set of Seoul National University Hospital, Seoul, Republic of Korea (https://vitaldb.net/dataset/?query=viewer). The public data set is a comprehensive data set of surgical patients composed of intraoperative bio-signals and clinical information. The bio-signal data included in the public data set were high-quality data such as 500-Hz waveform signals and numeric values at intervals of 1–7 s. The acquisition and release of the data were approved by the Institutional Review Board of Seoul National University Hospital (H-1408-101-605). The study was also registered at clinicaltrials.gov (NCT02914444).
Table 1
Predictive results of DT, SVM, KNN, and the boosting framework under optimal parameters
| Boosting | |||||
|---|---|---|---|---|---|
| DT | SVM | KNN | GBR | ABR | |
| MSE | 2.8873 | 2.8120 | 0.3218 | 0.0891 | 0.0622 |
| MAE | 1.2112 | 1.1907 | 0.3779 | 0.1717 | 0.1607 |
|
| 0.0478 | 0.0205 | 0.6956 | 0.9219 | 0.9421 |
MSE, Mean-squared error of the prediction; MAE, mean absolute error of the prediction;
The data were obtained from several patients who underwent routine or emergency noncardiac surgery. The average age of the patients was 47.7 years. The data set included EMG, ETCO2, remifentanil dosage, flow rate, and bispectral index (BIS) indicators for these patients. The sampling interval was 1 s. A total of 11,986 sets of data were available in total. Some data were randomly excluded so that the BIS was as evenly distributed as possible. Then, the data were normalized. The data set underwent fivefold cross-validation to improve the generalization ability of the model. The data were divided into five equal portions, one for each experiment, and the rest for training. The experiment was averaged five times. The data set was grouped into training sets and validation sets [12] following the ratio of 4:1. The training set was used to establish the prediction model of the depth of anesthesia. The validation set was used to validate some of the characteristics of the prediction model.
4.2Experimental design
BIS is an integrated anesthesia depth index based on statistical theory by analyzing some characteristic parameters [13]. In recent years, BIS is widely used in the monitoring of the depth of anesthesia [14]. Observing markers include BIS, EMG, ETCO2, remifentanil dosage, and flow rate. EMG, ETCO2, remifentanil dosage, and flow rate have a great influence on the depth of anesthesia. BIS directly reflects the depth of anesthesia. The BIS value ranges from 0 to 100. A large BIS value indicates a deep degree of anesthesia, and vice versa. Therefore, the input of the depth of anesthesia prediction model was EMG, ETCO2, remifentanil dosage, and flow rate in this study. The output of the depth of anesthesia prediction model was BIS.
In this study, DT, KNN, SVM, and the proposed method (boosting framework) were used to build prediction models to compare the performances in predicting the depth of anesthesia. GBR and ABR were used for setting up the prediction model of anesthesia. Different parameters in algorithms affect the results to a certain extent, such as the max depth of DT, GBR, and ABR, kernal type of SVM, and neighbors of KNN. Therefore, the effect of the prediction models under different parameters was explored.
4.3Results and discussion
In the experiments, the effect of the algorithms was explored under different parameters. A range of parameters from 1 to 50 was tested such as the max depth value of DT, ABR and GBR, and the number of KNN neighbors. Besides, the effect of SVM under four different kernel types, namely linear, rbf, poly, and sigmoid, was also tested. Figure 1 shows that the fluctuation of MSE value of GBR and ABR was smaller than other methods, indicating that the boosting framework method was less affected by parameters. The MSE value of GBR and ABR eventually leveled off at 0.11 and 0.06. Figure 1 also shows the MSE values of the algorithms under different parameters. The MSE value of GBR and ABR (with the max depth value of 15 and 31) was the best, which was far lower than that of other algorithms. Similarly, the optimal max depth of DT was 48, the optimal number of neighbors of KNN was 5, and the optimal kernel of SVM was “linear.” The results of the experiments are recorded in Table 1. The indicators included were MSE, MAE, and
Table 1 shows the prediction characteristics of these four prediction methods under optimal parameters. The MSE and MAE values of the boosting framework method were lower than those of the other three methods. The
Figure 2.
Comparison of predicted and actual values of DT, SVM, KNN, and the boosting framework.
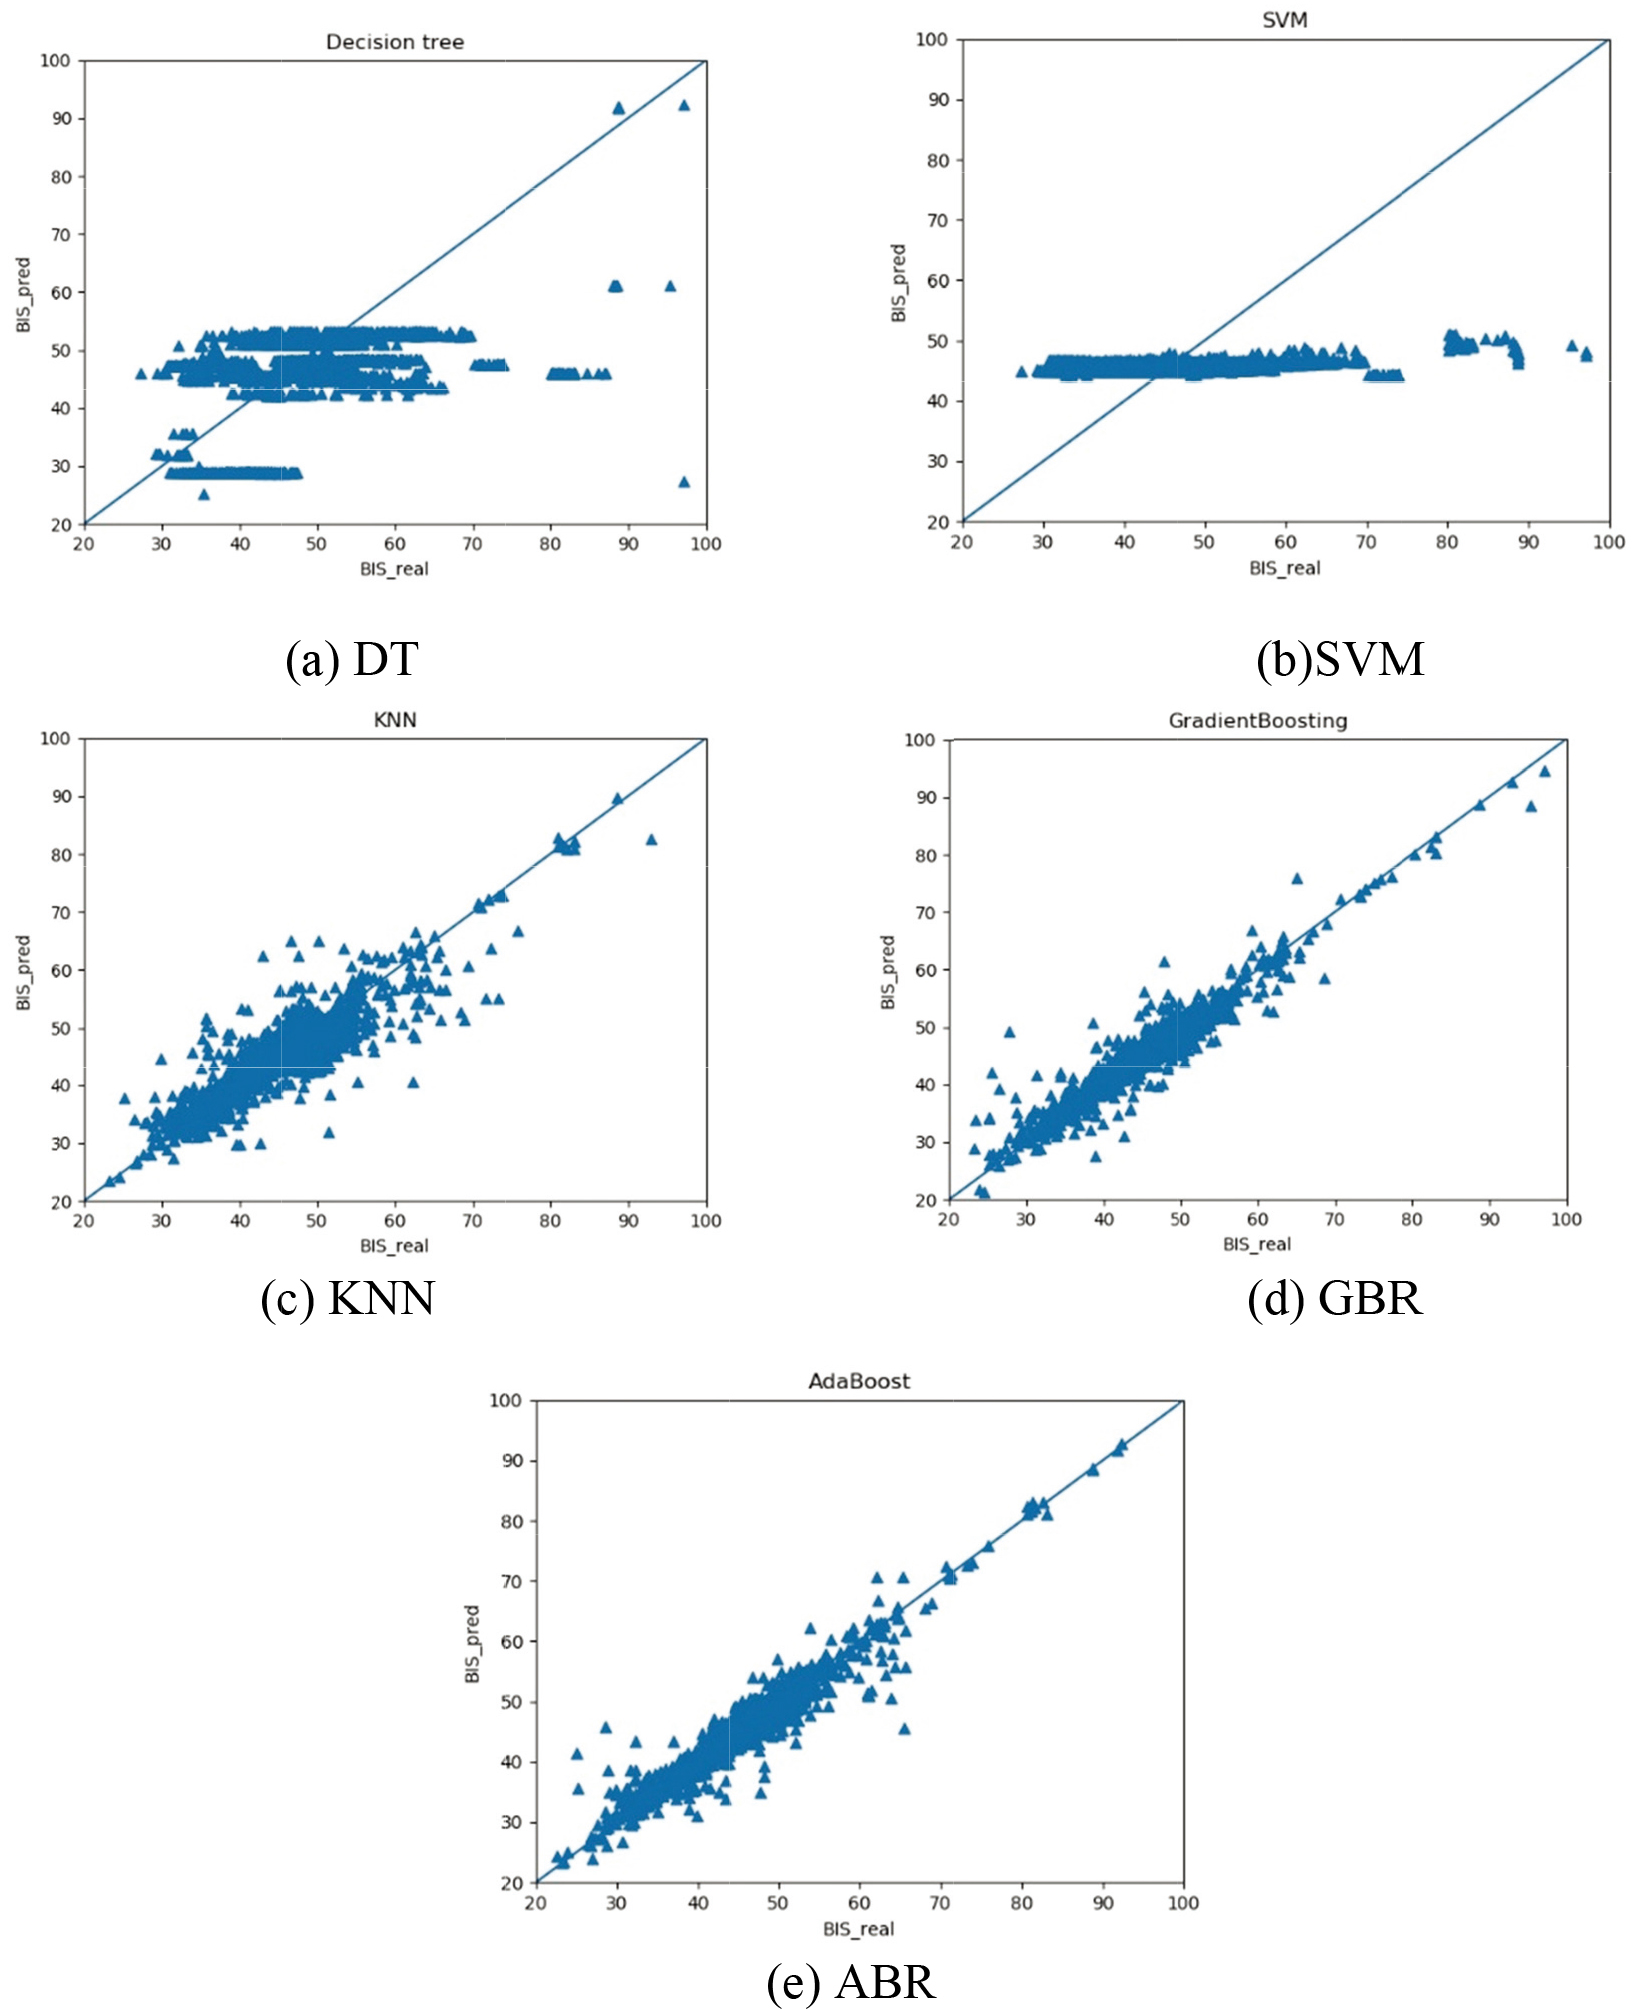
Compared with ECG and other clinical indicators commonly used in previous studies [1], we selected four clinical indicators EMG, ETCO2, remifentanil dosage, and flow rate that were more closely associated with BIS to predict the depth of anesthesia. Besides, in previous studies on the depth of anesthesia, several popular machine learning algorithms such as DT, KNN, and SVM, were used to build prediction models [4, 6, 8]. In this paper, a boosting-based prediction model to predict the depth of anesthesia was built based on four clinical monitoring data. The experimental results show that compared with the DT-, SVM-, and KNN-based models in previous studies, the boosting framework prediction method had lower MSE and MAE values and higher R2 values. That means the boosting framework method had higher prediction accuracy. In addition, the MSE value of the boosting framework method has a smaller variation range under different parameters. That means the boosting framework method was not easily affected by parameters.
In summary, the results in the table and figure demonstrated that the boosting framework prediction method had higher prediction accuracy and was not easily affected by parameters. That means the boosting framework method could be used to monitor the depth of anesthesia.
5.Conclusion
In this study, the boosting framework was used to set up a prediction model to predict the depth of anesthesia based on four clinical monitoring data. The boosting framework method had the following advantages: First, it was more accurate and realized the depth of anesthesia prediction successfully. Second, it was less affected by parameters compared with the DT-, KNN-, and SVM-based models. Third, it had higher prediction accuracy and lower discrete degree compared with those of the DT-, KNN-, and SVM-based models. Therefore, the boosting framework method can be adopted to predict the depth of anesthesia.
Conflict of interest
None to report.
References
[1] | Chowdhury MR, Madanu R, Abbod MF, et al. Deep learning via ECG and PPG signals for prediction of depth of anesthesia. Biomedical Signal Processing and Control. (2021) ; 68: (6): 102663. |
[2] | Connor CW. Artificial intelligence and machine learning in anesthesiology. Anesthesiology. (2019) ; 131: (6): 1346-1359. |
[3] | Dehbozorgi MR, Rastegar M, Dabbaghjamanesh M. Decision tree-based classifiers for root-cause detection of equipment-related distribution power system outages. IET Generation Transmission & Distribution. (2020) ; 14: (3). |
[4] | Liu J, Zhou Y, Chen S, et al. Study on the evaluation index of depth of anesthesia awareness based on sample entropy and decision tree. Journal of Biomedical Engineering. (2015) ; 32: (2): 434-439. |
[5] | Zhang K, Wang Z, Lan L, Moerchen F. Scaling up kernel SVM on limited resources: A low-rank linearization approach. IEEE Transactions on Neural Networks and Learning Systems. (2019) ; 30: (2): 369-378. |
[6] | Shalbaf A, Shalbaf R, Saffar M, et al. Monitoring the level of hypnosis using a hierarchical SVM system. Journal of Clinical Monitoring and Computing. (2019) ; 34: (3). |
[7] | Zhu H, Zhu L. Encrypted network behaviors identification based on dynamic time warping and k-nearest neighbor. Cluster Computing. (2019) ; 22: (1): 1-10. |
[8] | Zhu F, Hou C, Luo X, et al. Monitoring the depth of anesthesia using Autoregressive model and Sample entropy, (2019) . |
[9] | Champion M, Cierco-Ayrolles C, Gadat S, et al. Sparse regression and support recovery with L2-Boosting algorithms. Journal of Statistical Planning & Inference. (2014) ; 155: : 19-41. |
[10] | Mutrofin S, Machfud MM, Satyareni DH, et al. Komparasi kinerja algoritma C45, Gradient Boosting Trees, Random Forests, dan Deep Learning pada Kasus Educational Data Mining. Jurnal Teknologi Informasi dan Ilmu Komputer. (2020) ; 7: (4): 807. |
[11] | Deng X, Xu Y, Chen L, et al. Dynamic clustering method for imbalanced learning based on AdaBoost. The Journal of Supercomputing. (2020) ; 76: (1). |
[12] | Drocton P, Sachs C, Chu L, et al. Validation Set Correlates of Anogenital Injury after Sexual Assault. Academic Emergency Medicine. (2008) ; 15: (3): 231-238. |
[13] | Struys M, Smet TD, Greenwald S, et al. Performance evaluation of two published closed-loop control systems using bispectral index monitoring: A simulation study. Anesthesiology. (2004) ; 100: (3): 640-7. |
[14] | Ra JS, Li T, Li Y. A novel spectral entropy-based index for assessing the depth of anesthesia. Brain Informatics. (2021) ; 8: (1). |


