
Evaluating environmental radiations of the tomotherapy facility by optimizing full factorial design of the TLD technique
Abstract
BACKGROUND:
In the last 40 years, the number of deaths due to cancer has been the highest in Taiwan
OBJECTIVE:
To optimize the readout system of the thermoluminescent dosimeter (TLD)-100H, the radiation rates among the Tomotherapy (TOMO) facility of the Department of Radiology Oncology of Chung Shan Medical University Hospital (CSMUH) were calculated with a 3
METHODS:
A ten-month survey of the facility was employed using the sensitive and accurate TLD method. The TLD system was optimized for maximum temperature, heat rate, and preheat temperature of Harshaw 3500 reader. Eight analyzed groups with different factors were tested.
RESULTS:
The TOMO facility had significantly different radiation rates. The farther away from the gantry head, environmental radiation rates. The half value layer (HVL) was also determined. These results were compared with published. No significant contributions of environmental gamma radiations were detected except in the treatment room.
CONCLUSIONS:
Those were far below the occupational doses recommended by ICRP 60.
1.Introduction
In the last 40 years, the number of deaths due to cancer has been the highest in Taiwan [1]. High-energy radiations were generated by linear accelerator (linac), exposing staff and patients to undesirable radiations due to gantry head leakage during operations [2, 3, 4, 5, 6]. These radiations do not belong to routine treatment planning. A detailed survey is important to evaluate the extra radiations spread within this facility. Many published studies consider the thermoluminescent dosimeter (TLD) as one of the most effective approaches in dramatic radiations [3, 4, 5, 6, 7, 8, 9].
Nowadays, full factorial design (FFD) has proved its applicability and is widely used in the planning of experiments [10, 11, 12, 13]. FFD is an useful tool in the characterization of radiation measurements by studying the interactions of factors and effects [12, 13]. The applications of experimental designs provide many investigations of how different levels will affect analysis factors of the Harshaw 3500 reader (Harshaw Company, Bicron NE, OR Solon, OH, USA), instead of the traditional one-variable-at-a-time experiments They are used by a majority of researchers [9, 10, 11, 12, 13].
The appropriate heating rate (
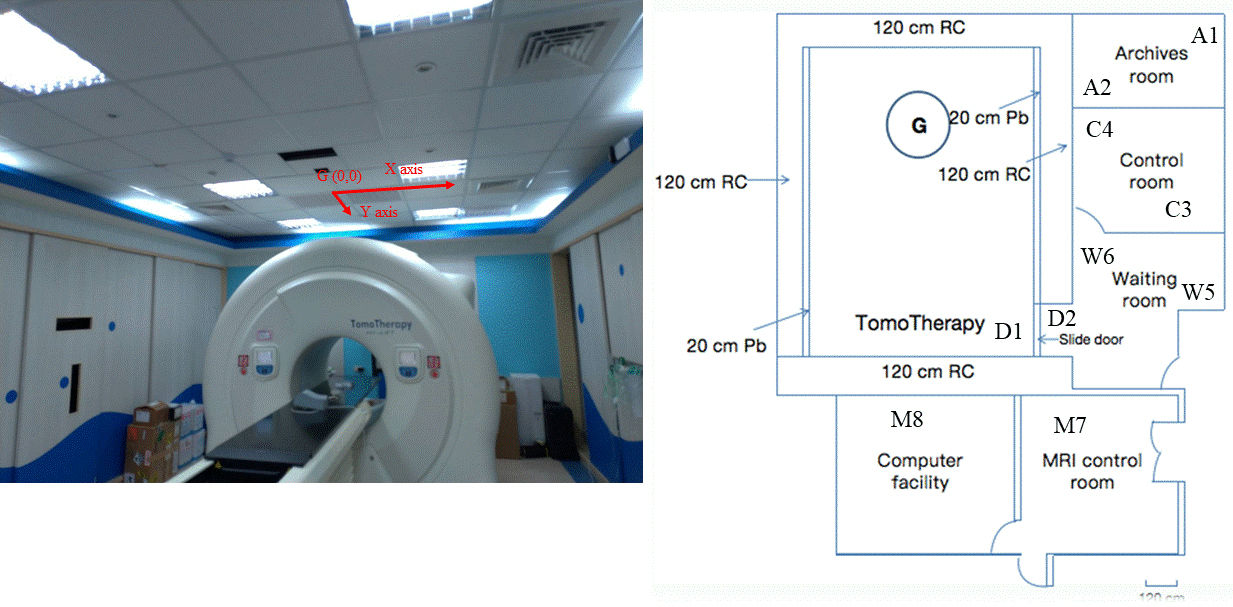
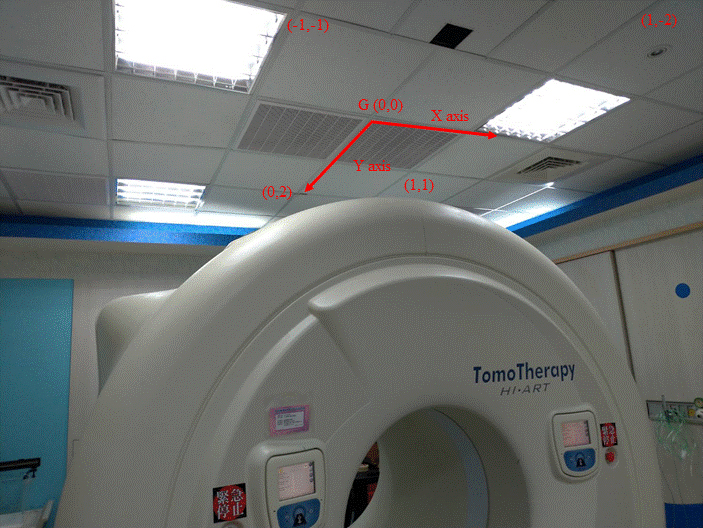
Figure 1.
(a) TOMO treatment room (b) the floor plan of the TOMO facility.
2.Method
2.1Tomotherapy facility
Figure 1a shows the TOMO treatment room, and 1b shows the plane view of the TOMO facility at the Department of Radiation Oncology (DRO) of Chung Shan Medical University Hospital (CSMUH) [14, 15]. This facility is located on the first floor (1F) and includes the TOMO treatment room, archives room, control room, magnetic resonance imaging (MRI) facility, waiting room, and computer room. A 120-cm-thick reinforced concrete (RC) wall and a 250-mm-thick lead (Pb) wall were employed in the construction of primary barriers between the archives room, control room, and waiting room. The treatment room is 9.0 meter long
These extra radiations are health concerns for the public. Thus, the TOMO facility must be exactly shielded to keep the radiations as low as reasonably achievable (ALARA) for the safety of the doctors, radiologists, and the general public [14, 16]. From 10 January to 10 September 2020, and from 29 January to 5 March 2021 (including five holidays during the Chinese New Year), 3701 patients treated for bone limb (178), pelvic cancer (665), abdominal cancer (260), breast cancer (1362), as well as head and neck cancer (1236) were included in this study [15].
2.2TLD-100 system
The TLD-100 has been used for calculating environmental radiations for the last three decades because TLD indicates long time accumulation of radiations [3, 4, 5, 6, 7, 8, 9]. To find the optimum group for environmental radiations using TLD-100H, one must find the optimum levels for the factors of Harshaw 3500 reader using FFD. The TLD-100H (Harshaw Company, Bicron, NE, OR Solon, OH, USA) made of LiF:Mg, Cu, P used around 2.8
2.3Surveying environmental radiations
The TLDs were randomly tapped on the light steel joint ceiling of the TOMO facility during the one-month survey to evaluate the distributions of environmental radiations, as shown in Fig. 2 [5]. Each light steel joint was 0.6
Automatically, the Harshaw 3500 reader was used to read irradiated TLD chips after the 1-month monitor as described in previous studies [2, 3, 4, 5, 6, 7, 8, 9]. Moreover, Tseng et al. used highly sensitive TLDs to evaluate leakage photon doses around the linac providing Volumetric Modukated Arc Therapy [3]. To eliminate the fluctuation of the TLD-100H, 3 TLDs were combined in 1 bag, so that 321 TLDs representing 107 measurement locations using reusable TLDs. 2 bags (6 TLDs) were used to monitor the environmental radiations in Taichung, about 500 meters (female dormitory) and 1000 meters (professor’s home) away from CSMUH. They were labeled as TC1 and TC2, respectively. Four bags, i.e. 12 TLDs were used to evaluate the background radiations in the lower background laboratory [3, 4, 5]. The results of each bag were mean after one-month of monitoring. The counting statistics, calibration, and fluctuations of the reader for the calibrated TLD-100H were less than twenty % [5]. The environmental radiations were evaluated as distance from spot G (0, 0) in the treatment room, which were interpolated between the monitored spots at each distance. In addition, measuring radiations at several spots at the same distance, mean environmental radiations were used. TLDs were counted and analyzed to evaluate the environmental radiations in this treatment room.
Table 1
Experimental levels and factors for the optimization experiments of the settings of the TLD Harshaw 3500 reader
| Experimental factors | Level 1 | Level 2 |
|---|---|---|
| Initial temperature ( | 130 | 140 |
| Heating rate ( | 9 | 11 |
| Maximum temperature ( | 230 | 250 |
Figure 2.
TLDs were attached on the ceiling of the TOMO facility during the survey.
2.4Full factorial design (FFD)
In an FFD, data are evaluated among all combinations of the experimental factor. To find an optimum protocol for (A) initial temperature, (B) heating rate, and (C) maximum temperature, a two-level FFD model was used, as shown in Table 1. Each factor was studied on two levels (2
The ratio of signal-to-noise (S/N, measured in dB) was introduced to qualify the integrated levels of Harshaw 3500 reader. The factor S/N integrates both sharp coefficient (
(1)
Table 2
Variable in a 2
| Group | Factor/level | ||
|---|---|---|---|
| A initial temperature ( | B Heating rate ( | C Maximum temperature ( | |
| 1 | 130 | 11 | 230 |
| 2 | 130 | 11 | 250 |
| 3 | 130 | 9 | 230 |
| 4 | 130 | 9 | 250 |
| 5 | 140 | 11 | 230 |
| *6 | 140 | 11 | 250 |
| 7 | 140 | 9 | 230 |
| 8 | 140 | 9 | 250 |
*G6 is original setting.
Thus, a bigger
(2)
The team Stdev represented the integrated standard deviations of the repeated radiated TLD, which was averaged over three TLDs in one bag. The
2.5TLD calibration
Twenty-four TLD-100H materials were obtained from the Harshaw Company. In FFD, TLDs was placed 15 cm deep in the center of solid water phantom, with a field size of 10
(3)
2.6Half value layer (HVL) of TOMO treatment room
Using the following attenuation equation the linear attenuation coefficient of the measured points was the average linear attenuation coefficient value. Averaged radiation doses measured at spot
(4)
where
Table 3
The coefficient estimate among the eight groups
| G | Linear regression equation | Correlation coefficient | Stdev |
|
|
|---|---|---|---|---|---|
| 1 | Y | R | 0.468 | 0.92267 | 0.590 |
| 2 | Y | R | 2.464 | 0.72186 | |
| 3 | Y | R | 0.510 | 0.84044 | 0.434 |
| 4 | Y | R | 1.351 | 0.72564 | |
| 5 | Y | R | 1.839 | 0.67562 | |
| 6 | Y | R | 1.072 | 0.80806 | |
| 7 | Y | R | 1.592 | 0.77861 | |
| 8 | Y | R | 1.189 | 0.64446 |
3.Results and discussions
3.1Full factorial design (FFD)
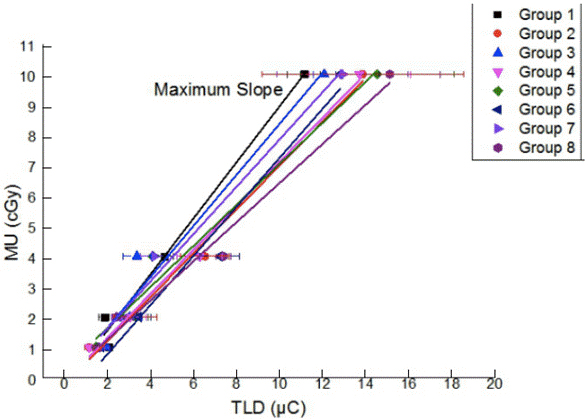
The original 3 TLD readings calculated by various radiotherapy beam doses (1, 2, 4, and 10 cGy) randomly assigned to TLDs as listed as Table 3. The square of correlation coefficient (
Figure 3.
The derived linear regression fit of the eight groups.
High
Analysis of X-ray leakage and scattering from the linac of the medical university has been reported in several previous studies [3, 4, 5, 6, 7, 8, 9]. The dose calibration line of group 1 (130
Three TLDs were combined in 1 bag to evaluate environmental radiations in the TOMO facility, with 321 TLDs representing 107 measurement spots. Figure 4 shows 3-dimensional distributions of environmental radiations among the treatment room to reflect various environmental radiations that were mapped using intensity colors.
Figure 4.
Three-dimensional distributions of the treatment room averaged environmental radiations, mapped via colored profiles.
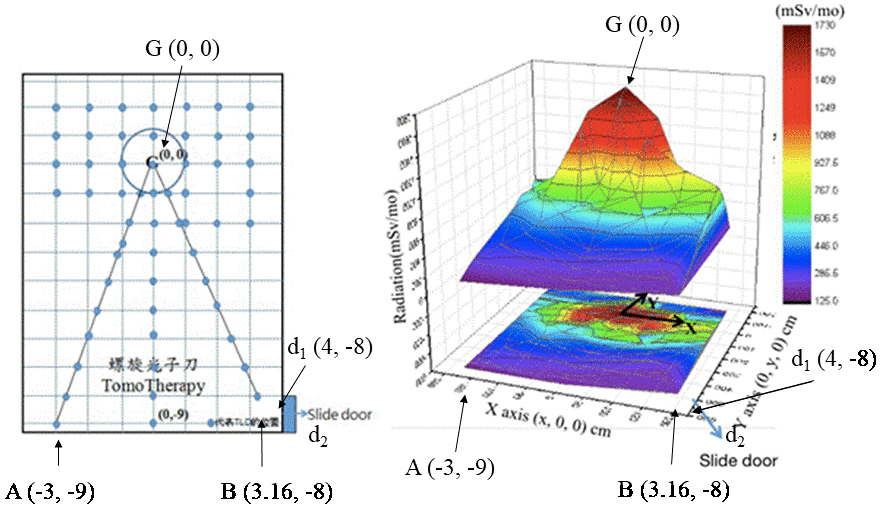
Figure 4 shows that decreases in environmental radiations were related to the increase in the distance to the gantry head ranging from the highest 1730
Table 4
The averaged environmental radiations (mSv/mo)
| Location | Radiation (mSv/mo) | |
|---|---|---|
| Control area | ||
| Treatment room | ||
| G (0, 0) | 1730 | |
| A ( | 171 | |
| B (3.16, | 211 | |
| Treatment room (inside slide door) | 104 | |
| Public area | ||
| Waiting room | ||
| Treatment room (outside ceiling) D | 0.16 | |
| Sofa (W5) | 0.15 | |
| Clock (W6) | 0.15 | |
| Achieves room | ||
| Above cabinet (A1) | 0.13 | |
| Above cabinet (A2) | 0.15 | |
| Control room | ||
| Computer (C3) | 0.16 | |
| Ceiling (C4) | 0.14 | |
| MRI | ||
| Control room (M7) | 0.11 | |
| Computer room (M8) | 0.16 | |
| Taichung City (TC1) | 0.15 | |
| Taichung City (TC2) | 0.14 | |
The TLD measurement within the TOMO facility indicated that the radiations varied markedly in the range of 1730
Environmental radiation at G (0, 0) was extremely high, which was 11,500 times more than 0.15
Over the ten-month survey in the working areas, data showed that environmental radiations in W5 (sofa of waiting room), W4 (clock of waiting room), C3 (computer of control room), and C4 (ceiling of control room) were approximately the same as the 0.16
3.2Dose estimation of radiologist in control room
Figure 4 shows the spots closest to the medical staff on duty among the computer of the control room (C3) of the public area. It was reasonably assumed that extra photons penetrated far into 120-cm-thick RC as well as 20-cm Pb wall to enter the control room (C3), 0.16
Comparison with published data showed no main public health impact. That is, no significant contributions were detected during TOMO operations in the public area. These data demonstrated that the “extra” x-rays were not a health concern for staff or the public at hospital during the linac operation. In addition, actual environmental radiations outside of the TOMO facility, such as the Axesse linac (cf Table 4, located at B1), are worth measuring in further studies.
Figure 5.
Half-value layer of the TOMO treatment room.
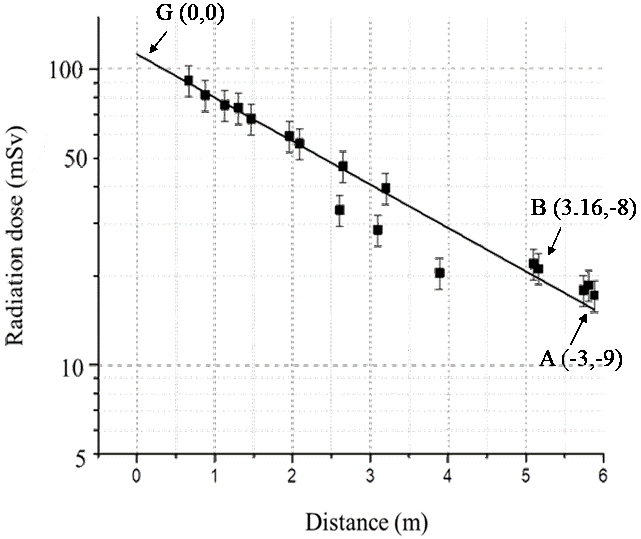
All measurements were performed by attached TLDs at location G (0, 0), A (
4.Conclusions
The FFD was successfully applied to optimize the Harshaw 3500 reader. The S/N (
In addition, a 45-cm-thick steel plate (Fe) was capable of suppressing the photon doses and provided adequate shielding for the public. The environmental radiation rates ranged from 1730
Acknowledgments
The authors thank the TOMO staff of the hospital for their useful and valuable support of this research without any reservation.
Conflict of interest
None to report.
References
[1] | MOH, Available at https://dep.mohw.gov.tw/dos/lp-4927-113.html. (2021) . |
[2] | Chen LF, Tseng HC, Pan LK, et al. Evaluating environment radiations at Axesse linac undergoing NPC treatment of VMAT. Comput Assist Surg. (2016) ; 21: (S1): 79-83. |
[3] | Tseng HC, Liu WS, Huang HS, et al. Spatial distributions of environmenral radiations at medical linac undergoing treatment of vmat using taguchi method. J Radioanal Nucl Chem. (2016) ; 307: : 1635-1639. |
[4] | Tseng HC, Liu WS, Lin JB, et al. Evaluating air kerma at a medical cyclotron after refined shielding design using the TLD approach. J Nucl Sci Technol. (2013) ; 50: (6): 599-605. |
[5] | Changlai SP, Tsai HH, Tsai SC, et al. Environmental radiation detected at Lin Shin hospital in Taichung during the Fukushima nuclear power plant accident. J Radioanal Nucl Chem. (2012) ; 291: (3): 859-863. |
[6] | Chen CY, Liu Kuo CL, Chen HH, et al. Optimizing the TLD-100 reading system for various radiotherapy beam doses using the Taguchi methodology. Appl Radiat Isot. (2010) ; 68: : 481-488. |
[7] | Le Y, Weng JH, Lee TM, et al. TLD environmental radiation of the NEW scanner facilities of the Nuclear Medicine Department of Medical University. Technol and Health Care. (2020) ; 28: : S151-S160. |
[8] | Lin HC, Lai TJ, Tseng HC, et al. Evaluating doses of multi-slice CT in brain examinations using various methods. Comput Assist Surg. (2017) ; 22: (S1): 54-60. |
[9] | Sadeghi M, Faghihi R, Sina S, Developing an optimum protocol for thermoluminescence dosimetry with GR-200 chips using taguchi method. Radiat Prot Dosim. (2017) ; 175: (2): 284-294. |
[10] | Das T, Venkatesh MP, Kumar TMP, et al. SLN based alendronate in situ gel as an implantable drug delivery system – A full factorial design approach. J Drug Deliv Sci Technol. (2020) ; 55: : 101415. |
[11] | Verma U, Rajput R, Naik JB. Development and characterization of Fast Dissolving Film of Chitosan embedded Famotidine Using 32 Full Factorial Design Approach. Mater Today Proc. (2018) ; 5: : 408-414. |
[12] | Madrid JF, Lopez PGE, Abad LV. Application of full-factorial design in the synthesis of polypropylene-gpoly (glycidyl methacrylate) functional material for metal ion adsorption. Radi Phys Chem. (2017) ; 136: : 54-63. |
[13] | Beauchamp Y, Thomas M, Youssef YA, et al. Investigation of cutting parameter effects on surface roughness in lathe boring operation by use of a full factorial design. Computers & Industrial Engineering. (1996) ; 31: (3-4): 645-651. |
[14] | Chung Shan Medical University, Available from: http://english.csmu.edu.tw/bin/home.php. (2021) . |
[15] | TomotherapyHi-Art., available at: https://delec, com.ar/panel/wp-content/uploads/Hi%C2%B7Art-Product-Data-Sheet.pdf. 2021. |
[16] | International Commission on Radiological Protection, Recommendations of the International Commission on Radiological Protection. Publication 103, Annals of ICRP Vol. 37 (2/4), Pergamon Press, Oxford, (2007) . |
[17] | Excel, available at https://www.microsoft.com/zh-tw/microsoft-365. (2021) . |


