
Analysis of the relationship between muscular strength and joint stiffness in children with Down syndrome during drop landing
Abstract
BACKGROUND:
Children with Down syndrome (DS) have critical biomechanical impairments such as increased ligamentous laxity, muscle hypotonia, and dysfunctional motor coordination, which makes performing everyday tasks challenging.
OBJECTIVE:
The purpose of the study was to explore the differences in the vertical joint stiffness, plantar force, and range of motion during drop landing for DS and age-matched typically developing children.
METHODS:
Six young male children with DS and age-matched seven healthy typically developing children (TD) assessed joint strength using an isokinetic dynamometer and performed five trials of single-leg drop jump using force platform and motion capture system.
RESULTS:
The peak vertical ground reaction force (VGRF), Range of motion (ROM), joint stiffness, and joint strength of lower limb were calculated and compared across DS and TD groups. The results revealed a significantly larger peak VGRF [
CONCLUSIONS:
The abnormal movements observed among DS was not due to the difference in stiffness of the lower extremity but due to the utilization of different landing mechanisms with changes in ROM.
1.Introduction
Children with Down syndrome (DS) are born with a chromosomal genetic disorder that results in cognitive, muscular, and orthopedic impairments [1, 2]. The critical biomechanical features of these impairments are increased ligamentous laxity, muscle hypotonia, and dysfunctional motor coordination, which makes performing everyday tasks challenging [3, 4]. Previous studies have shown compliant joints and reduced muscular strength of the lower limbs [5, 6, 7]. Compliant lower limb joints and reduced muscular strength makes it difficult for children with DS to generate sufficient plantar force during tasks requiring a larger range of motion. However, for a task that puts considerable stress on the body, such as drop landing, the changes in the joint stiffness and peak plantar force generated are unclear. Hence, a comprehensive study to evaluate the differences in the joint stiffness and plantar vertical force of the children with DS is essential to understand the strategy employed by young DS patients when they perform tasks that puts a large impact on the body.
In the field of biomechanics, it is becoming increasingly common to study joint stiffness to understand the mechanisms of complex lower extremities [8]. The simplest explanation for stiffness is the relationship between deformation and the force influencing it. From a biomechanical perspective, body stiffness can be defined as a combination of all individual characteristics such as muscles, tendons, ligaments, cartilage, and bones [9]. According to studies related to stiffness in the lower limbs, high stiffness can increase the impact load, leading to osteoarthritis or even stress fractures [10]. However, it can be theoretically argued that higher stiffness can strengthen the ligaments and soft tissues to prevent any joint sprain. On the contrary, it is also plausible that higher stiffness may also reduce the skeletal system’s damping characteristics, increasing the risk of injury [11, 12]. Therefore, the difference in the lower limbs’ stiffness, i.e., either higher or lower than the optimal, can increase the motion’s rigidity, resulting in increased impact force [8]. Studies also report a difference in joint stiffness in dynamic posture between DS patients and those without disabilities [13]. These differences in joint stiffness have been postulated to affect their movement performance [8]. Thus, having insight into stiffness during a movement can provide valuable information on constructing strategies to reduce injuries and improve performance [14, 15, 16].
The purpose of our study was to explore the differences in the vertical joint stiffness, plantar force, and range of motion during drop landing for DS and age-matched typically developing children. Further, we also recorded lower limb joint strength using an isokinetic dynamometer. Consequently, we aim to determine the key joint strength parameters responsible for changes in joint stiffness and peak plantar force. Therefore, our results can be important for physicians, doctors, and physical therapists to determine joints to target while developing exercise programs to prevent fractures and injuries among children with DS.
2.Method
2.1Participants
Six young male children with DS, DS group (age: 14.83
2.2Equipment
A force platform (OR 6, Advanced Mechanical Technology Inc., USA) was used to measure vertical ground reaction force (VGRF) during a drop-landing task at a sampling frequency of 1500 Hz. Eight infrared cameras (Oqus 500, Qualisys, Sweden) were used to record the retro-reflective markers attached to the lower-limb anatomical landmarks of the participants at a sampling frequency of 150 Hz. The two systems were synchronized using an A/D board (USB analog acquisition interface, Qualisys, Sweden) to match the initiation of data acquisition. We used an isokinetic dynamometer (Cybex 770, Cybex Norm Test & Rehabilitation isokinetic dynamometer, USA) to assess lower limb joint strength.
2.3Experimental procedure
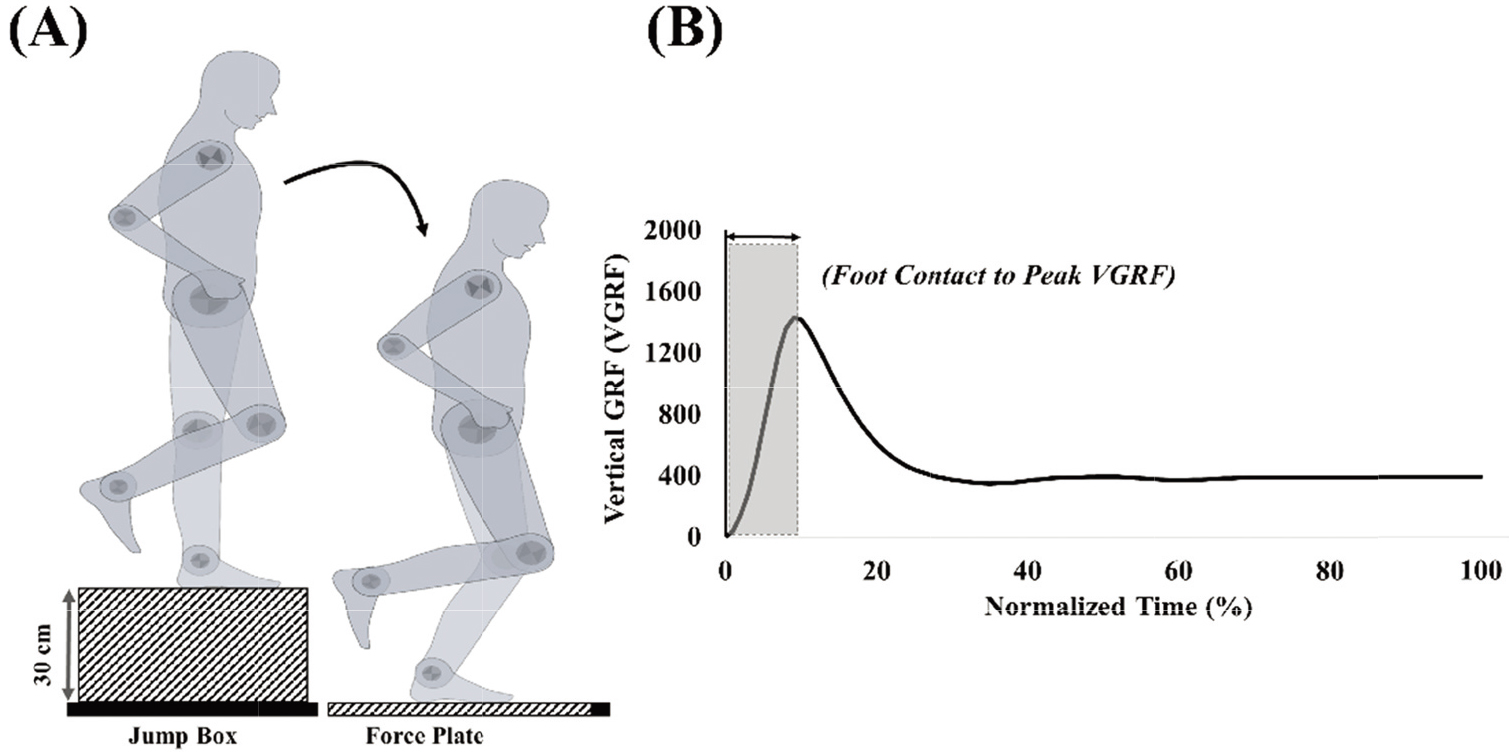
The overall experimental procedure was divided into two sessions. In the first session, participants performed a single-leg drop landing task. We provided the participants with a full-body motion capture suit, which allows us to attach retro-reflective markers directly to the body. We attached a total of 32 retro-reflective markers on the left and right sides anatomical landmarks of the lower body: anterior superior iliac spine, posterior superior iliac spine, medial and lateral knee, medial and lateral ankle, second metatarsal, heel, and three tracking markers each at the thigh and shank segment. The participants performed the drop landings from a height of 30 cm (Fig. 1A). Initially, participants climbed on top of a box (length: 50 cm; width: 50 cm; height: 30 cm) placed at a distance of 5 cm from the force platform. After that, we asked them to bend their non-dominant leg backward at 90 degrees while leaning forward and dropping onto the force platform. We asked the participants to maintain an erect one-legged stance posture for 5 seconds after drop landing. The participants placed their hands on the hip to minimize upper body movements throughout the drop landing task. We asked the participants to perform seven practice trials before data acquisition. The data acquisition trials where participants could not maintain an erect posture, maintain the medial-lateral balance, or took a step forward within 5 seconds after drop landing were excluded from the analysis. A total of 5 trials of single-leg drop landings were used for the analysis. We provided at least one-minute rest between trials.
Figure 1.
A schematic diagram of (a) single-leg drop landing with dominant leg, (b) Vertical ground reaction force (VGRF) during the drop jump. The phase between landings (VGRF = 0) to the peak vertical force (shaded-gray area) was used to calculate joint stiffness.
For the second session, we asked the participants to perform isometric ankle, knee, and hip contractions using an isokinetic dynamometer. The muscular strength measurement for each muscle site conformed to guidelines outlined in the Cybex testing manual. The dynamometer was set at a seated position such that the participant’s hip and knee angles of the dominant leg were maintained at 85 and 90 degrees, respectively. The torso and thigh of the participants were then fastened using a harness and Velcro straps. The ankle planter-dorsiflexion strength, knee flexion-extension strength, and hip flexion-extension strength were measured at a load velocity of 60 degrees per second. After familiarization with the task, subjects performed five maximal contractions for each muscle site. The experimenter verbally encouraged the subjects to perform their maximum throughout the measurement trials.
2.4Data processing
The raw three-dimensional coordinates of the retro-reflective markers and raw VGRF data were filtered using a zero-lag, fourth-order low pass Butterworth filter with a cut-off frequency of 6 Hz. We identified the maximal vertical force generated during drop landing as the maximum VGRF after foot contact following the single-leg drop landing normalized to the participant’s body weight (Fig. 1B). We used biomechanical analysis software (Visual 3D v4.8
To evaluate the effect of joint laxity on the sagittal plane joint kinematics and strength, we calculated the sagittal plane joint stiffness for the lower body joints (
(1)
Where,
2.5Statistical analysis
All the data are presented as mean and standard deviation (SD). A Mann-Whitney test was performed to evaluate the differences in the peak VGRF, ROM, joint stiffness, and joint strength between DS and TD groups. This non-parametric test was selected because the Kolmogorov-Smirnov normality test determined that the kinematic and kinetic data were not normally distributed. We performed Spearman’s correlation analysis to evaluate the monotonic relationship of peak VGRF, joint ROM, stiffness, and strength separately for DS and TD groups. The level of statistical significance was set at
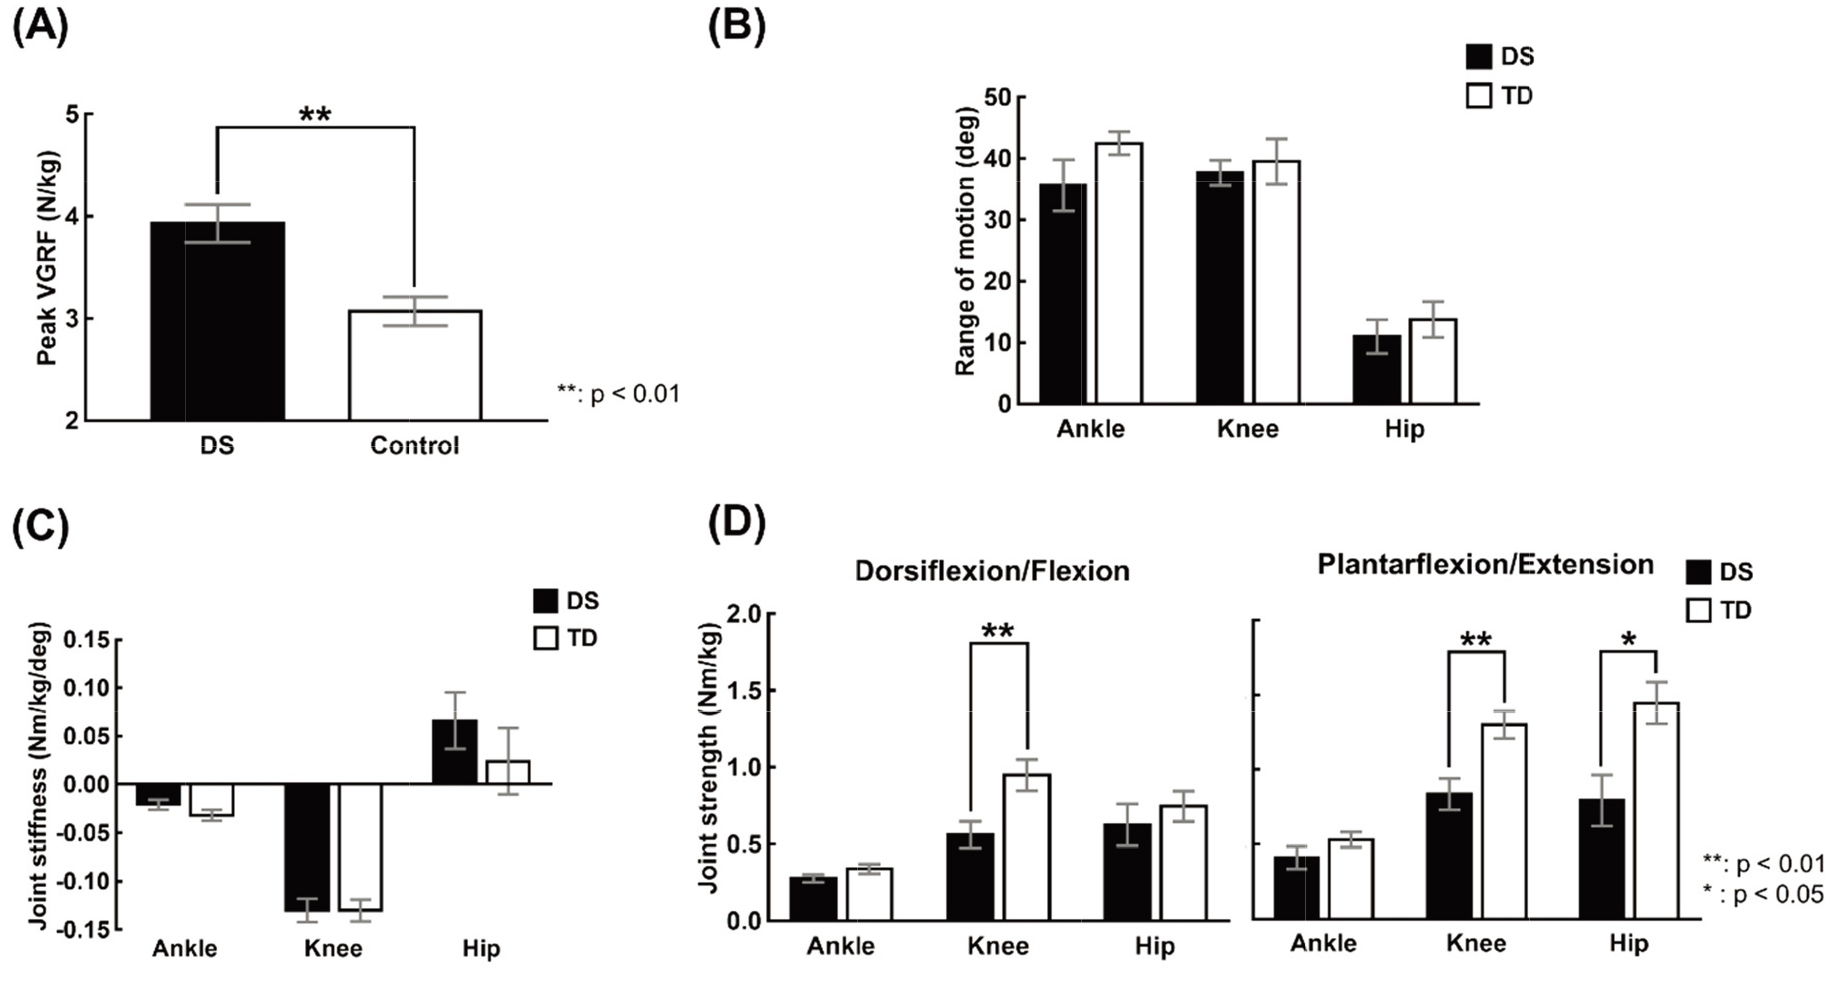
Figure 2.
The mean and standard error of calculated variables (a) Peak VGRF, (b) Range of motion of dominant lower limb (c) Joint stiffness of dominant lower limb, (d) Joint strength of dominant lower limb during drop jump for DS and TD groups.
3.Results
Figure 2 shows the mean and standard error (SE) of the sagittal plane lower body joint ROM, stiffness, and strength and peak VGRF across participants for DS and TD groups. The results of the Mann-Whitney test revealed a significantly larger peak VGRF [
Table 1
Result of spearman correlation analysis between measured variables and stiffness
| Stiffness | ||||||||||||
| Down syndrome (DS) | Typically developing (TD) | |||||||||||
| Hip | Knee | Ankle | Hip | Knee | Ankle | |||||||
| ROM | ||||||||||||
| Ankle | 0. | 429 | 0. | 143 | 0. | 257 | 071 | 0. | 821* | 464 | ||
| Knee | 886* | 314 | 829* | 0. | 607 | 0. | 607 | 214 | ||||
| Hip | 143 | 0. | 029 | 0. | 2 | 0. | 464 | 0. | 464 | 0. | 286 | |
| Force | ||||||||||||
| Peak force | 314 | 829* | 314 | 357 | 357 | 179 | ||||||
| Strength | ||||||||||||
| Ankle plantar flexor | 0. | 086 | 0. | 429 | 143 | 036 | 536 | 0. | 143 | |||
| Ankle dorsi flexor | 314 | 0. | 029 | 314 | 464 | 321 | 0. | 179 | ||||
| Knee extensor | 086 | 0. | 543 | 2 | 0. | 321 | 0. | 179 | 571 | |||
| Knee flexor | 086 | 0. | 543 | 2 | 643 | 0. | 214 | 321 | ||||
| Hip extensor | 0. | 143 | 0. | 371 | 2 | 464 | 321 | 0. | 179 | |||
| Hip flexor | 0. | 371 | 0. | 657 | 0. | 143 | 429 | 0 | 214 | |||
Table 1 shows the results of Spearman’s correlation analysis between peak VGRF and joint ROM, stiffness, and strength separately for the DS and TD groups. For the DS group, no significant correlation between joint stiffness and muscle strength was observed. However, negative correlations were found between hip joint stiffness and knee joint ROM [
4.Discussion
Prior studies have reported that DS patients exhibit lower muscular strength than those without disabilities [18, 19, 20]. One of the causes of lower muscular strength among DS patients is the early aging of muscular nerve junctions. This early aging of muscular nerve junction is caused by the abnormalities such as degeneration and deformation of terminal axons due to excessive secretion of Zn-Cu superoxide dismutase, which is stored as a genetic code on chromosome 21 [21]. A single-subject study of DS patients conducted by Lim et al. [22] reported greater ankle plantar flexion strength was 0.535 Nm/kg than the ankle dorsiflexion strength when measured at the constant velocity of 60
Joint stiffness can be considered to be a variable reflecting the characteristics of joint-related muscles, tendons, ligaments, cartilage, and bones [9]. Therefore, depending on the degree of joint stiffness, differences in performance, injury, and movement mechanisms may exist [8, 13]. A study by Galli et al., reported the ankle stiffness of DS to be lower than TD whereas, hip joint stiffness of DS was greater than TD [25]. The study attributed movement characteristics of interest to be the cause of the difference between groups. However, in the current study, no significant differences in stiffness were observed in the joint stiffness between DS and TD during drop landing. However, the sample size of our study is small (6 DS and 7 TD participants) and limited to a single dynamic task, vertical drop jump. Hence, future studies may consider confirming the efficacy of our findings using other dynamic sporting tasks with a larger sample size.
5.Conclusion
The study aimed to compare and elucidate the relationship between the lower extremities’ muscular strength and joint stiffness of patients with DS and TD. Comparing each variable between DS and TD showed no significant differences in the ROM of the lower extremity and joint stiffness. However, statistical differences were observed for knee joint torque, hip joint torque, and VGRF. Joint stiffness between DS and TD showed a significant correlation with ROM of the lower extremity during landing. For DS, the stiffness of the hip and ankle joints was negatively correlated with the ROM of the knee joint.
In contrast, for TD, the knee joint stiffness was positively correlated with the ROM of the ankle joint. Hence, the difference observed in motion between TD and DS groups appears to be due to the mechanism they selected to perform, rather than the difference in their physical characteristics such as joint laxity and muscle hypotonia. As a result, TD uses a mechanism to reduce the VGRF generated during landing by increasing the stiffness of the knee joint and increasing the ROM of the ankle. As for DS, a relatively high VGRF due to the adopted mechanism reduced the ROM in knee joints while increasing the hip and ankle joint stiffness. In conclusion, previous studies and literature suggested that abnormal movements may occur due to joint laxity and muscle hypotonia, which are the physiological characteristics of DS. As a result of this study, it is considered that the abnormal movement mentioned in previous works of literature for DS was not because of the stiffness of the lower extremity but due to the utilization of different landing mechanisms with changes in ROM compared to TD. The results of our study have several practical implications. Using a dynamic task, we found that for tasks requiring large dynamic movements such as vertical drop jump, DS seems to generate a larger plantar force associated with the change in the movement strategy. Hence, researchers in the field of rehabilitation and physical therapy might target the modified kinematic parameters associated with the larger plantar force to develop intervention programs to mitigate any negative impacts of the landing strategy implemented by children with DS.
Acknowledgments
This research was supported by the Research Grant of Jeonju University in 2020.
Conflict of interest
None to report.
References
[1] | Malak R, Kostiukow A, Krawczyk-Wasielewska A, Mojs E, Samborski W. Delays in motor development in children with Down syndrome. Medical Science Monitor: International Medical Journal of Experimental And Clinical Research. (2015) ; 21: : 1904. |
[2] | Malak R, Kotwicka M, Krawczyk-Wasielewska A, Mojs E, Szamborski W. Motor skills, cognitive development and balance functions of children with Down syndrome. Annals of Agricultural and Environmental Medicine. (2013) ; 20: (4). |
[3] | Lin H-C, Wuang Y-P. Strength and agility training in adolescents with Down syndrome: a randomized controlled trial. Research in Developmental Disabilities. (2012) ; 33: (6): 2236-44. |
[4] | Smith BA, Ashton-Miller JA, Ulrich BD. Gait adaptations in response to perturbations in adults with Down syndrome. Gait & Posture. (2010) ; 32: (2): 149-54. |
[5] | Croce RV, Pitetti KH, Horvat M, Miller J. Peak torque, average power, and hamstring/quadriceps ratios in nondisabled adults and adults with mental retardation. Archives of Physical Medicine and Rehabilitation. (1996) ; 77: (4): 369-72. |
[6] | Horvat M, Pitetti KH, Croce R. Isokinetic torque, average power, and flexion/extension ratios in nondisabled adults and adults with mental retardation. Journal of Orthopaedic & Sports Physical Therapy. (1997) ; 25: (6): 395-9. |
[7] | Shields N, Taylor NF, Fernhall B. A study protocol of a randomised controlled trial to investigate if a community based strength training programme improves work task performance in young adults with Down syndrome. BMC Pediatrics. (2010) ; 10: (1): 1-7. |
[8] | Butler RJ, Crowell HP, III, Davis IM. Lower extremity stiffness: implications for performance and injury. Clinical Biomechanics. (2003) ; 18: (6): 511-7. |
[9] | Latash ML, Zatsiorsky VM. Joint stiffness: Myth or reality? Human Movement Science. (1993) ; 12: (6): 653-92. |
[10] | Grimston SK, Engsberg JR, Kloiber R, Hanley DA. Bone mass, external loads, and stress fracture in female runners. Journal of Applied Biomechanics. (1991) ; 7: (3): 293-302. |
[11] | DeVita P, Hortobagyi T. Age increases the skeletal versus muscular component of lower extremity stiffness during stepping down. The Journals of Gerontology Series A: Biological Sciences and Medical Sciences. (2000) ; 55: (12): B593-B600. |
[12] | Devita P, Skelly WA. Effect of landing stiffness on joint kinetics and energetics in the lower extremity. Med Sci Sports Exerc. (1992) ; 24: (1): 108-15. |
[13] | Caselli MA, Cohen-Sobel E, Thompson J, Adler J, Gonzalez L. Biomechanical management of children and adolescents with Down syndrome. J Am Podiatr Med Assoc. (1991) ; 81: (3): 119-27. |
[14] | Arampatzis A, Bruggemann G, Klapsing GM. Leg stiffness and mechanical energetic processes during jumping on a sprung surface. Medicine and Science in Sports and Exercise. (2001) ; 33: (6): 923-31. |
[15] | Dutto DJ, Smith GA. Changes in spring-mass characteristics during treadmill running to exhaustion. Medicine & Science in Sports & Exercise. (2002) ; 34: (8): 1324-31. |
[16] | Seyfarth A, Geyer H, Günther M, Blickhan R. A movement criterion for running. Journal of Biomechanics. (2002) ; 35: (5): 649-55. |
[17] | Farley CT, Houdijk HH, Van Strien C, Louie M. Mechanism of leg stiffness adjustment for hopping on surfaces of different stiffnesses. Journal of Applied Physiology. (1998) ; 85: (3): 1044-55. |
[18] | Angelopoulou N, Tsimaras V, Christoulas K, Kokaridas D, Mandroukas K. Isokinetic knee muscle strength of individuals with mental retardation, a comparative study. Perceptual and Motor Skills. (1999) ; 88: (3): 849-55. |
[19] | Kramer PG. Developmental trends of selected motor performance items in mongoloid males: Springfield College; (1969) . |
[20] | Pitetti K, Climstein M, Mays M, Barrett P. Arm and leg strength of adults with mental retardation-with and without Down syndrome. Palaestra. (1995) ; 11: (2): 1-8. |
[21] | Avraham K, Sugarman H, Rotshenker S, Groner Y. Down’s syndrome: morphological remodelling and increased complexity in the neuromuscular junction of transgenic CuZn-superoxide dismutase mice. Journal of Neurocytology. (1991) ; 20: (3): 208-15. |
[22] | Lim B-O, Yoon J-M, Chung C-S, Shin I-S, Kwon Y-H. The effects of strength training on ankle kinetics during walking in an adolescent with down syndrome: a single case study. Korean Joutnal of Spoort Science. (2006) ; 17: (3): 13-22. |
[23] | Davis WE, Sinning WE. Muscle stiffness in Down syndrome and other mentally handicapped subjects: a research note. Journal of Motor Behavior. (1987) ; 19: (1): 130-44. |
[24] | Parker A, James B. Age changes in the flexibility of Down’s syndrome children. Journal of Mental Deficiency Research. (1985) ; 29: : 207-18. |
[25] | Galli M, Rigoldi C, Brunner R, Virji-Babul N, Giorgio A. Joint stiffness and gait pattern evaluation in children with Down syndrome. Gait & Posture. (2008) ; 28: (3): 502-6. |


