
Proteomic study of plaque fluid in high caries and caries free children
Abstract
BACKGROUND:
The occurrence and development of caries is a complex process affected by multiple factor.
OBJECTIVE:
The present study was envisaged to evaluate the plaque fluid in caries free children and children with high caries, in order to establish a data set of bacterial secretion proteomics. A non-labeled quantitative technique based on two-dimensional liquid chromatography-series mass spectroscopy was employed to detect plaque fluid. Based on the proteomics data, the database search, data processing and pathway analysis illuminated the function of these proteins, and clarified the role of plaque microecology in caries occurrence and development.
METHODS:
The study enrolled 8 caries free (CF) children, whose decayed-missed-filled surface of teeth is 0 (dmfs
RESULTS:
We identified 1,804 peptides with quantitative information, including 39 in CF, 30 in CS, and 1,735 similarly expressing peptides. After statistical analysis, 603 statistically different expression peptide data sets were obtained, including 202 high-expressed peptides in Group CF, 33 greater than 1.5 fold peptides, 401 high-expressed in Group CS and 199 greater than 1.5 fold peptide (173 nonredundant proteins).
CONCLUSION:
Our study obtained the largest known dataset of the bacterial secretion protein in children with high caries, and screened the data set of high caries state. 603 peptides were statistically rich in 101 pathways, including glycolysis pyruvate acid metabolism, tricarboxylic acid cycle, pentyl phosphate pathway, fructose mannose metabolism, starch and sucrose metabolism, and ABC transporters.
1.Introduction
The occurrence and development of caries is a complex process affected by multiple factors, and reflects the composition of microorganisms that is often not constant, but undergoes continuous dynamic changes. It also depends on the complexity of the interaction between the bacteria and the host. The functions within the plaque are not performed by a single individual organism, but involve the entire microbial community. However, in the current stomatology research, people’s understanding of the micro-ecology is often based on the single microbial species purely cultivated in the laboratory, or the interaction of several limited species, and the understanding of the microbial community as a whole is far behind the understanding of its individuals.
The emergence of macroproteomics provides a good platform for a comprehensive research on the plaque protein components, but it is equally challenging. The first step of sample preparation, including the complete extraction of the bacterial intracellular and extracellular proteins in the plaque, is one of the major bottlenecks. In the extracellular environment where bacterial cells survive, the plaque fluid is the forefront of the bacteria interaction, host-specific and non-specific immunity, and is relatively easy for the separation and purification process, thereby being one of the ideal models for the research on caries. By analyzing the differences in the protein composition of the plaque in children without caries and those with high caries, the impact of between the plaque and host on the occurrence and development process of caries in children can be more intuitively and accurately explored.
To accomplish this, the study employed the non-labeled quantitative technology based on two-dimensional liquid chromatography-series mass spectrometry to analyze the plaque fluid in children without caries and children with high caries and established a data set of bacterial secretion proteomics. On this basis, using database search, data processing and pathway analysis, it further clarified the role of plaque microecology in the occurrence and development of caries.
2.Materials and methods
2.1Sampling
According to the third version of the caries diagnosis standard of the Basic Methods of WHO Oral Health Survey, 8 children (CF, dmfs
The children required no oral hygiene care on the night before sampling, starting from the morning, and 12 h fasting and drinking before sampling. Washing the collection area with sterile saline. Avoid moisture with cotton roll. In CF group, we scraped all the dental plaque of smooth suface of deciduous molar teeth. In CS group, we scraped all the healthy smooth enamel surface [1, 2]. The parents of the child knowingly agreed for the experimental procedure.
2.2Preparation of plaque sample
The plaque was collected in a pre-cooled 0.5 ml centrifuge tube in crushed ice and immediately sent to the laboratory and centrifuged at 4
Figure 1.
Experimental workflow for TMT labeling and analysis: TMT 10-plex labeling was performed for three sets of technical replicates. Each condition was labeled as follows for the three technical replicates: CF (127N, 129N, 130C), HC (128N, 139C, 131). Moreover, equally amount of proteins from all samples were pooled as an internal standard (IS: 126). The labeled fractions were combined and subjected to High-pH Reversed-Phase Fractionation and desalting, followed by separation using liquid chromatography mass spectrometry (LC-MS/MS), and bioinformatics data analysis.
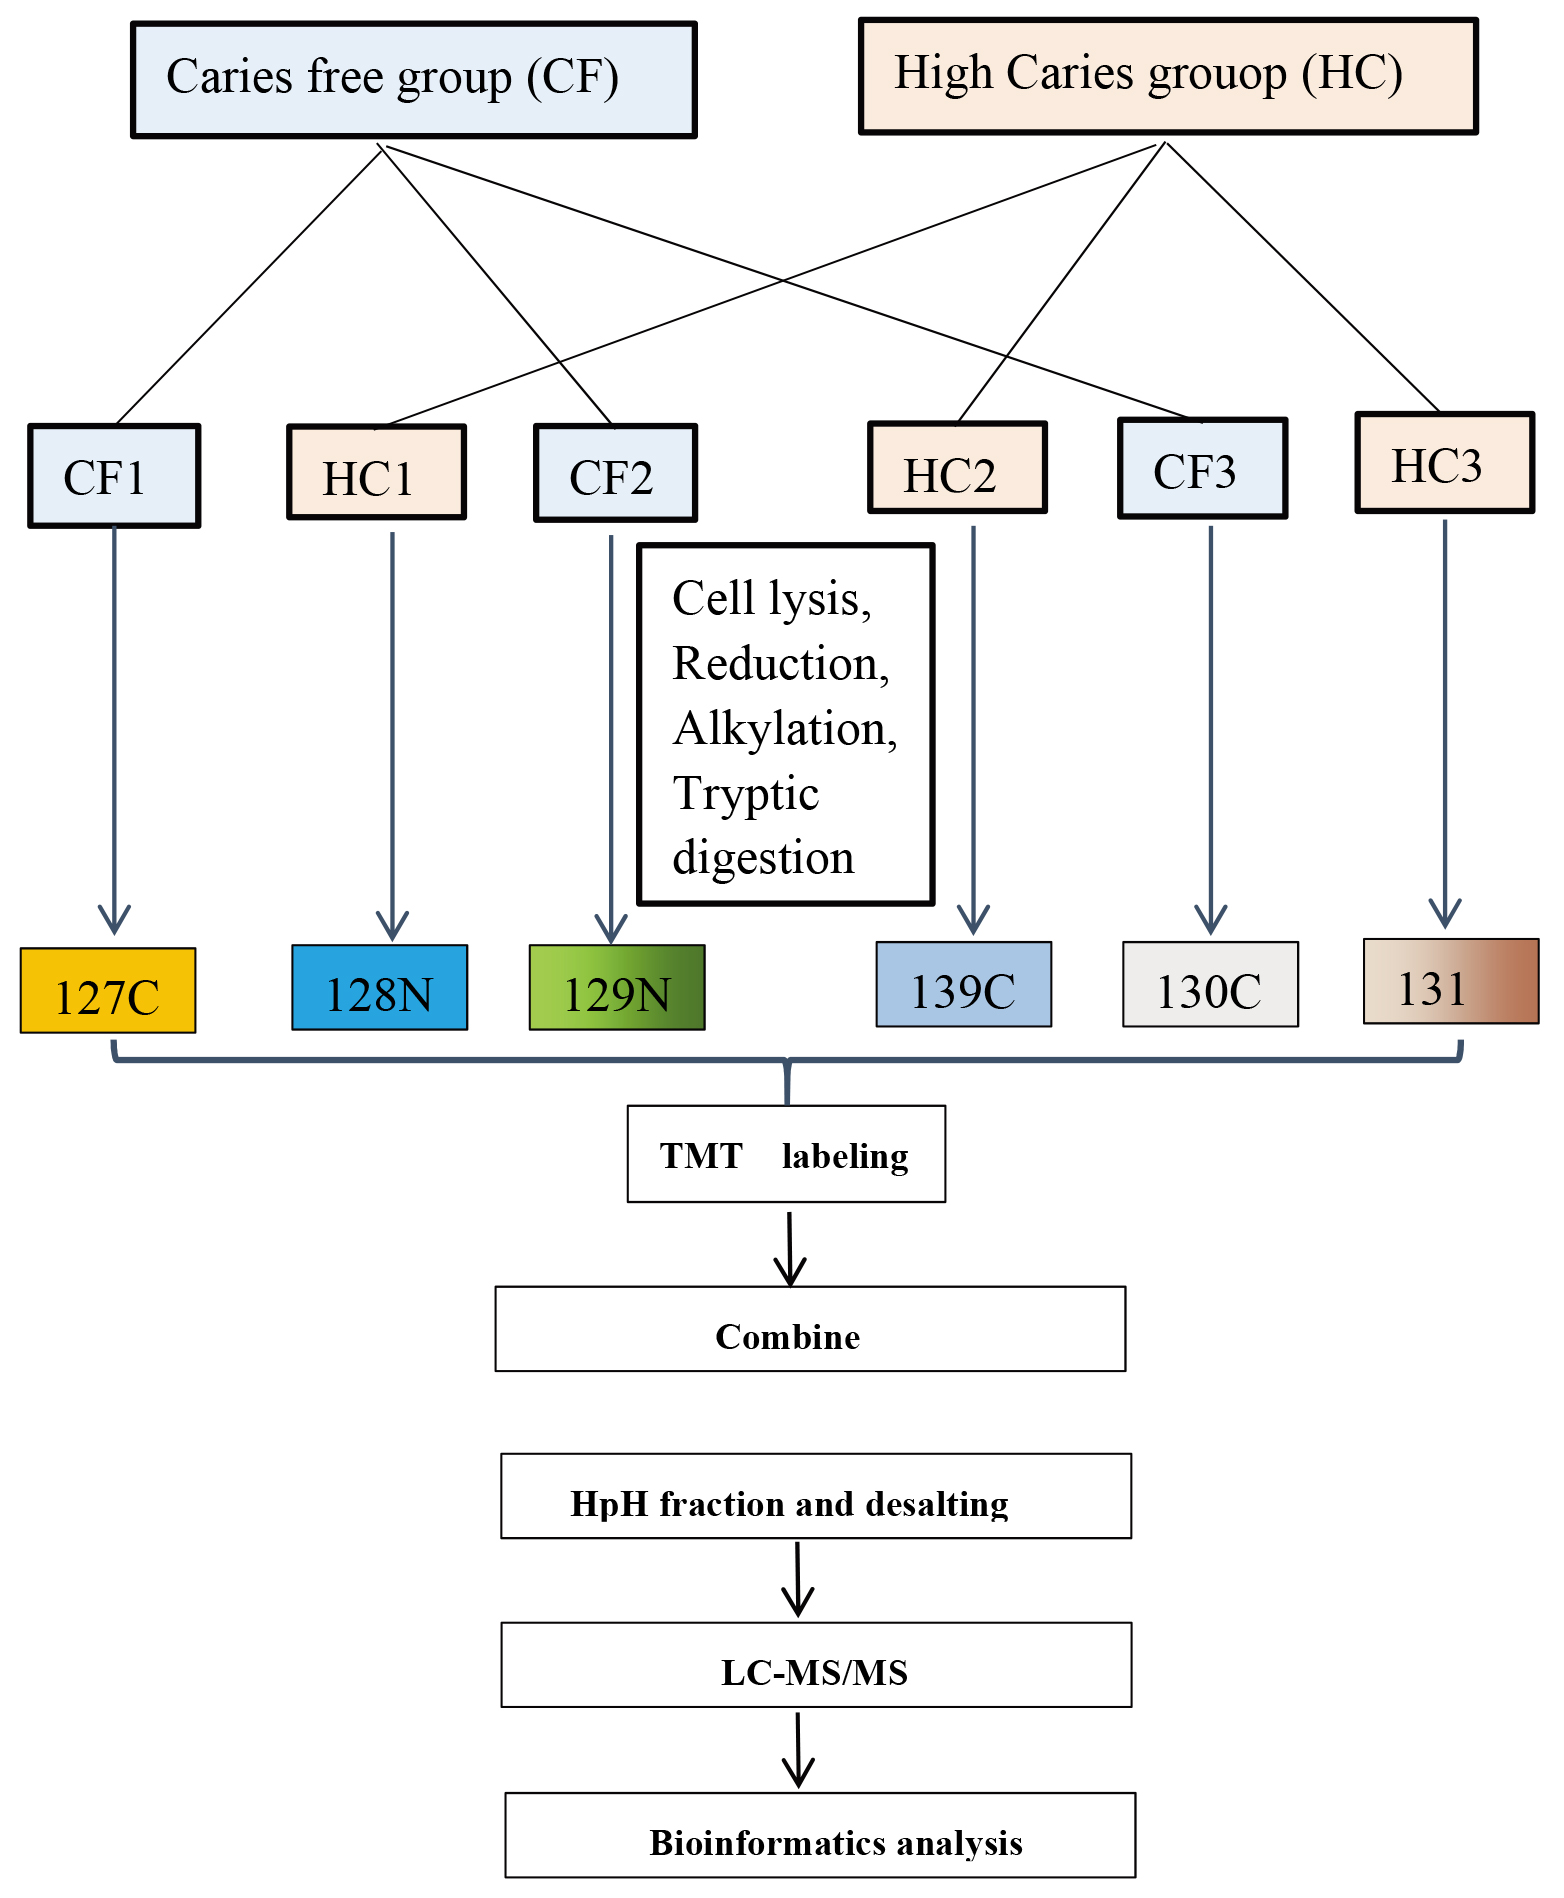
Figure 2.
Glycolysis/Gluconeogenesis.
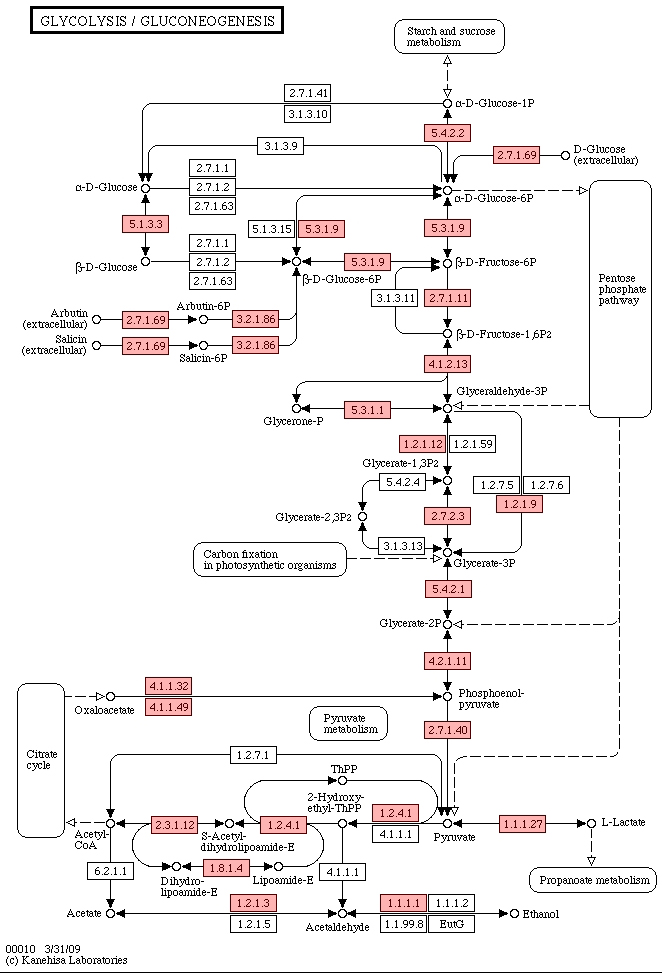
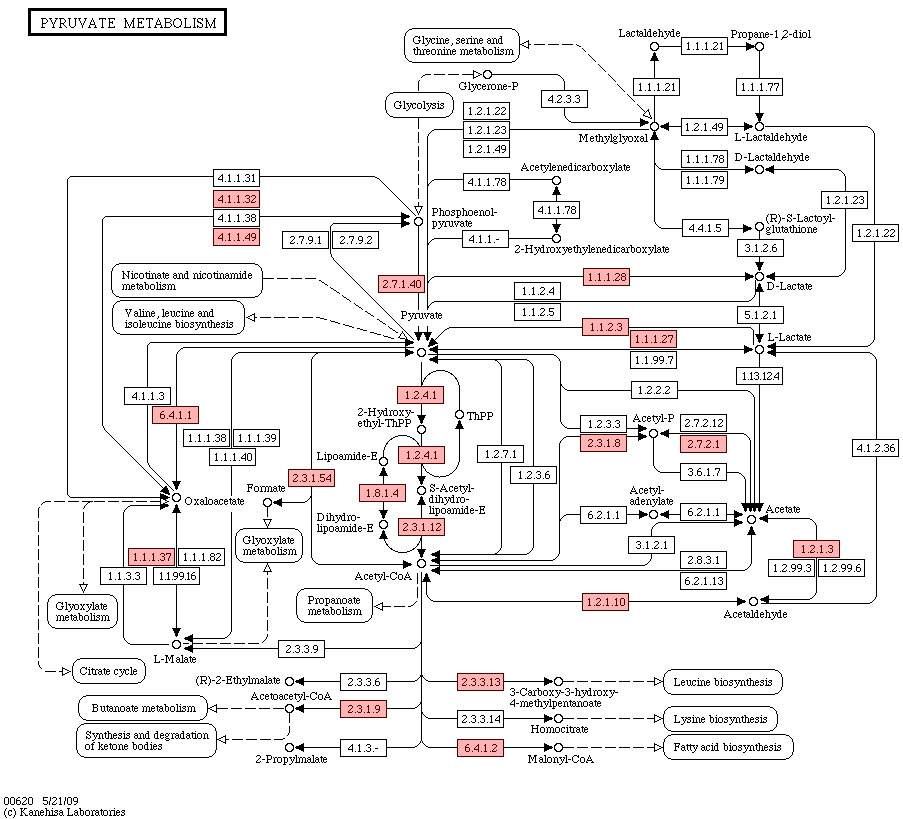
Figure 3.
Pyruvate metabolism.
2.3Preparation of enzyme solution
In order to reduce the differences between the individuals, the plaque proteins of the children without caries and children with high caries were mixed in equal amounts, and a sample library was established. CF and CS plaque were divided into three parts..Each protein samples were supplemented with lysis buffer (8 mol/Lurea, 40 mmol/L Tris, 65 mmol/L DTT) to the total volume of 100
Figure 4.
Tricarboxylic acid cycle.
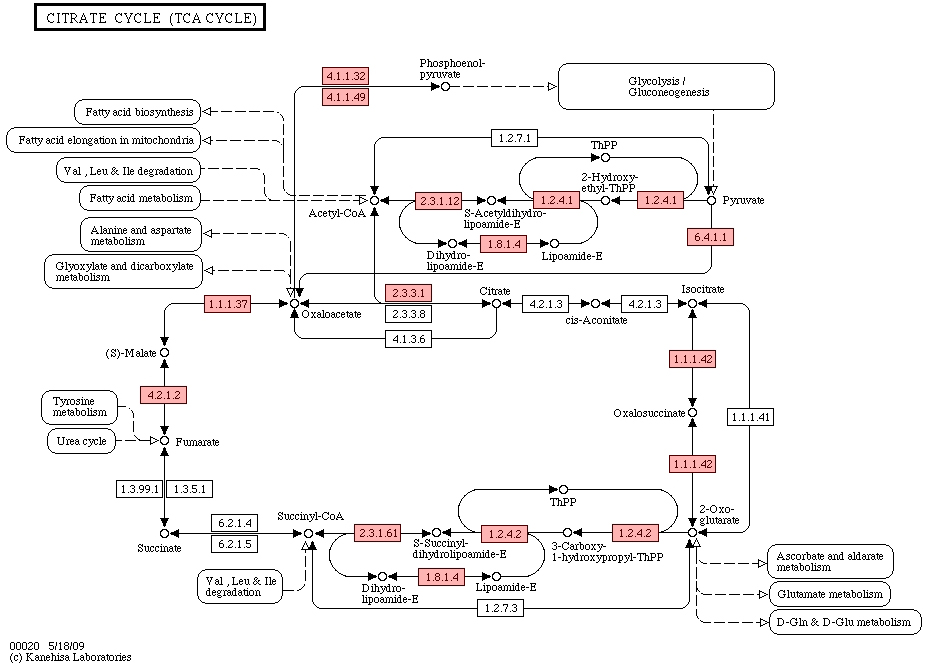
Figure 5.
Pentose phosphate pathway.
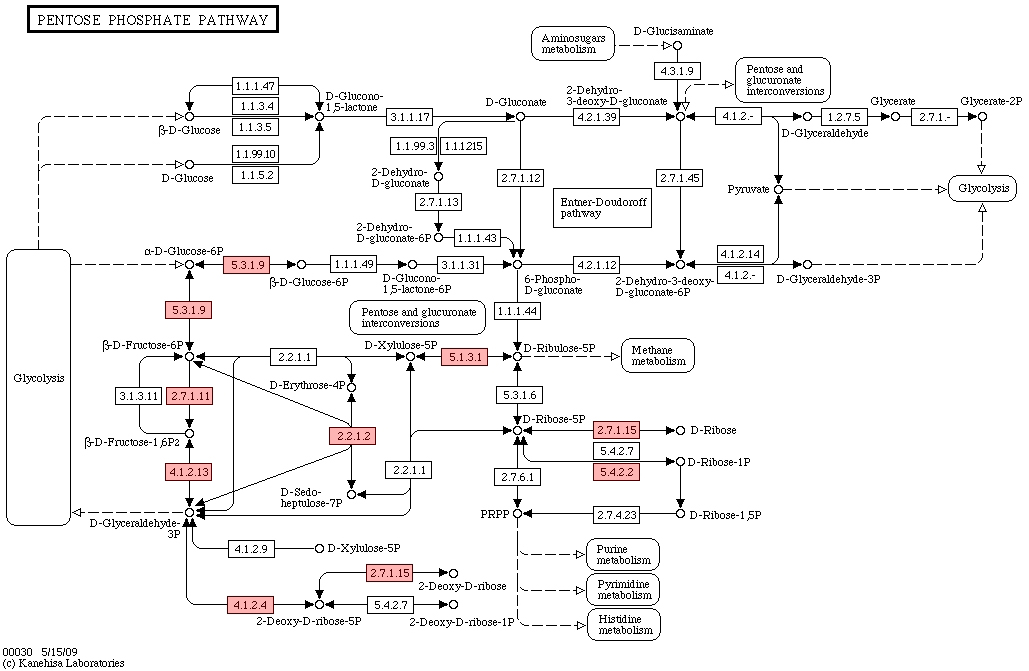
Figure 6.
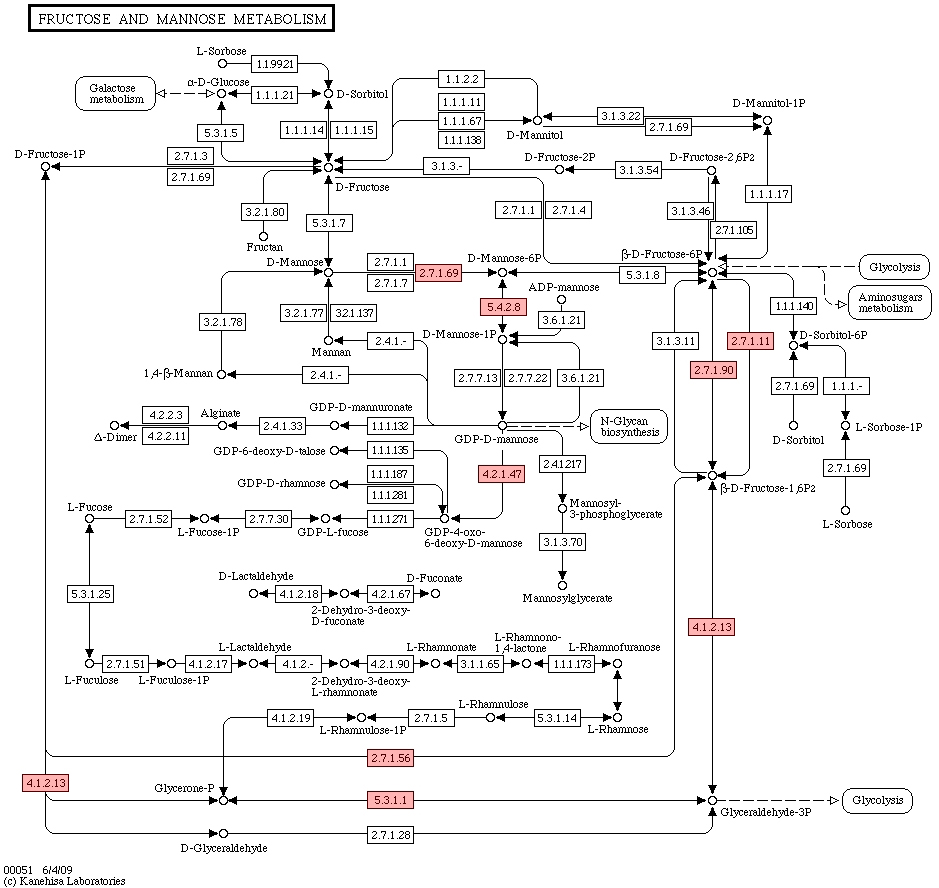
Fructose mannose metabolism.
2.4Liquid chromatography-mass spectrometry analysis
20
Figure 7.
Fructose mannose metabolism.
2.5Database search and data processing
After obtaining all peptides with quantitative information, It was tested for all
2.6Pathway analysis
The metabolic pathway map was downloaded for the 24 common oral bacteria from the www.kegg.com website to analyze the distribution of the identified proteins in each pathway.
2.7Microbial function and pathway analysis
All identified microbial protein sequences were annotated by BLASTP (version: 2.2.31+) against the UniProtKB/Swiss-Prot database that included 560,118 sequences and the COG database (version: 2014) that included 1,781,653 sequences. Furthermore, InterProScan (version: 5.35–74.0) provided the gene ontology (GO) functional annotations of all identified microbial protein sequences with default parameters. Some in-house Perl scripts and R scripts were used to complete the GO functional classification and statistics analysis. The KEGG orthology (KO) annotation of the proteins were performed using KOBAS (version: 3.0) with E-value
2.8PRM verification
Based on the results of the original label-free based quantitative meta-proteomics analysis, we selected the appropriate target peptides of the candidate proteins and performed targeted shotgun MS to finally determine the peptides of the target proteins with reliable identification information, which was used in the PRM quantification analysis. The peptide information suitable for PRM analysis was imported into the Xcalibur software program for PRM setup. Briefly, 1
Data availability: All the MS raw files were submitted to the Proteome Xchange Consortium (http://www.proteomexchange.com) via the PRIDE partner repository with the data set identifier.
2.9Statistical analysis
Statistical analysis was performed using the SPSS version 19 software. The experiments were statistically analyzed with the independent sample T test. All statistical analysis were performed at 95% significance level using 2-tailed analysis.
Figure 8.
ABC transport proteins.
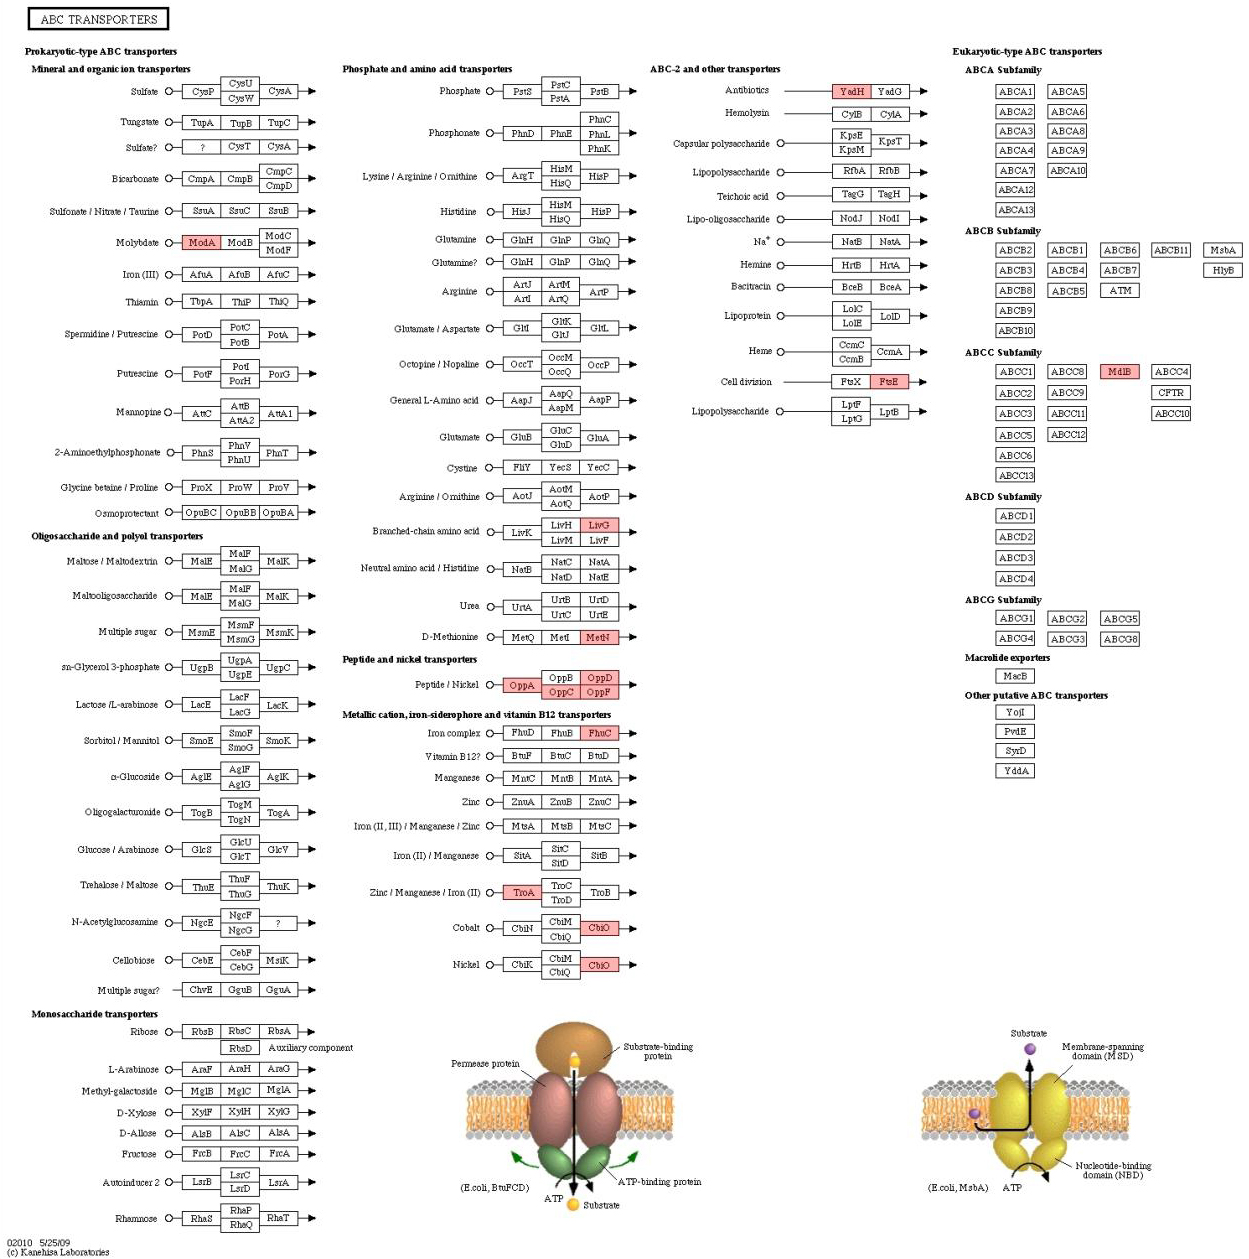
Figure 9.
Glycolysis reaction formula.

Table 1
High expression of bacterial secretory protein in plaque fluid of caries free children (
| NUM | Mass (Da) | Av. Ratio | Protein | ID Details |
|---|---|---|---|---|
| 1 | 2019.2246 | 3.9419625 | gi | Nicotinate-nucleotide pyrophosphorylase |
| 2 | 1627.0841 | 3.9031119 | gi | ISPg2, transposase |
| 3 | 844.77333 | 3.1448998 | gi | uncharacterized conserved protein |
| 4 | 2015.8037 | 2.6245635 | gi | competence protein |
| 5 | 1308.9237 | 2.53298 | gi | hypothetical protein FNP_1346 |
| 6 | 1485.0629 | 2.1089494 | gi | ribosome recycling factor |
| 7 | 1004.8306 | 1.965104 | gi | selenium metabolism protein YedF |
| 8 | 1583.1056 | 1.9346806 | gi | predicted extracellular nuclease |
| 9 | 1528.0214 | 1.9116673 | gi | peroxiredoxin |
| 10 | 1594.8706 | 1.8001297 | gi | outer membrane protein |
| 11 | 1369.6639 | 1.7949729 | gi | NADH dehydrogenase reductase |
| 12 | 1495.2313 | 1.793346 | gi | hypothetical protein PGN_1565 |
| 13 | 1328.7801 | 1.7567087 | gi | peptide chain release factor 2 |
| 14 | 1043.2649 | 1.7419186 | gi | ribosomal protein L15 |
| 15 | 1289.2159 | 1.7255517 | gi | chaperone protein DnaK |
| 16 | 905.04655 | 1.6972979 | gi | GTP-binding protein TypA/BipA |
| 17 | 1814.3222 | 1.696517 | gi | cell division protein FtsA |
| 18 | 1341.9164 | 1.6860124 | gi | glutamate dehydrogenase/leucine dehydrogenase |
| 19 | 1614.0495 | 1.6716142 | gi | carbamoyl-phosphate synthase, large subunit |
| 20 | 1347.1639 | 1.6420553 | gi | Jag protein, putative |
| 21 | 1434.1841 | 1.6119828 | gi | chaperone protein DnaK |
| 22 | 1440.6899 | 1.6006457 | gi | Alkyl hydroperoxide reductase C22 |
| 23 | 1583.0756 | 1.599004 | gi | VirB10 |
| 24 | 1296.9619 | 1.5660363 | gi | glyceraldehyde-3-phosphate dehydrogenase |
| 25 | 1414.2779 | 1.561902 | gi | LSU ribosomal protein L15P |
| 26 | 1743.6774 | 1.5616289 | gi | 3-phosphoshikimate 1-carboxyvinyltransferase |
| 27 | 1438.047 | 1.5568823 | gi | Phosphoserine aminotransfera |
| 28 | 913.14203 | 1.5564213 | gi | LSU ribosomal protein L5P |
| 29 | 714.50116 | 1.5434605 | gi | outer membrane protein |
| 30 | 888.51295 | 1.5399202 | gi | fructose-bisphosphate aldolase |
| 31 | 1254.5932 | 1.5356884 | gi | phosphoribosylaminoimidazole carboxylase |
| 32 | 1383.4912 | 1.5141757 | gi | protein TolB |
| 33 | 1366.1202 | 1.5058051 | gi | putative outer membrane protein |
Table 2
High expression of bacterial secretory protein in plaque fluid of high caries children(
| NUM | Mass (Da) | Av. ratio | Protein | ID details |
|---|---|---|---|---|
| 1 | 2968.55 | 14.07 | gi | pyruvate kinase |
| 2 | 1921.24 | 5.88 | gi | hypothetical protein EIKCOROL_00713 |
| 3 | 1652.71 | 5.62 | gi | GTP cyclohydrolase II |
| 4 | 2016.63 | 4.81 | gi | D-3-phosphoglycerate dehydrogenase |
| 5 | 2463.40 | 4.80 | gi | glyceraldehyde-3-phosphate dehydrogenase |
| 6 | 2076.89 | 4.54 | gi | bacterial nucleoid protein Hbs |
| 7 | 1760.03 | 3.97 | gi | signal transduction sensor histidine kinase |
| 8 | 1702.16 | 3.60 | gi | Fe-hydrogenase large subunit family protein |
| 9 | 2008.27 | 3.29 | gi | galactokinase, putative |
| 10 | 1399.83 | 3.16 | gi | glycosyltransferase |
| 11 | 1767.07 | 3.14 | gi | CobN/magnesium chelatase family protein |
| 12 | 2283.30 | 3.00 | gi | glutamate dehydrogenase/leucine dehydrogenase |
| 13 | 1969.37 | 2.96 | gi | conserved hypothetical protein YmdA/YtgF |
| 14 | 2120.52 | 2.89 | gi | aminotransferase [Leptotrichia buccalis DSM 11 |
| 15 | 1141.80 | 2.73 | gi | cobyric acid synthase CobQ, putative |
| 16 | 1420.06 | 2.68 | gi | periplasmic nitrate reductase, large subunit |
| 17 | 2206.43 | 2.68 | gi | translation elongation factor Tu |
| 18 | 1793.18 | 2.60 | gi | alpha-glucosidase |
| 19 | 1989.89 | 2.59 | gi | Ser-tRNA (Thr) hydrolase; threonyl-tRNA synthet |
| 20 | 1680.71 | 2.55 | gi | Butyrate-acetoacetate CoA-transferase subunit B |
| 21 | 2506.35 | 2.55 | gi | Phospho-N-acetylmuramoyl-pentapeptide-transfer |
| 22 | 2490.59 | 2.52 | gi | theronine dehydrogenase-like Zn-dependent dehy |
| 23 | 1848.55 | 2.52 | gi | flavoprotein [Fusobacterium nucleatum subsp. |
| 24 | 2545.12 | 2.45 | gi | ESS family glutamate:sodium (Na+) symporter |
| 25 | 2168.04 | 2.41 | gi | OmpA family protein |
| 26 | 1420.07 | 2.40 | gi | galactose-6-phosphate isomerase lacB subunit |
| 27 | 2550.84 | 2.36 | gi | PTS system IIA component |
| 28 | 2574.22 | 2.36 | gi | tagatose-bisphosphate aldolase |
| 29 | 2477.69 | 2.35 | gi | glyceraldehyde-3-phosphate dehydrogenase, type I |
| 30 | 2337.25 | 2.33 | gi | translation elongation factor Ts |
| 31 | 1390.89 | 2.28 | gi | Transposase |
| 32 | 1972.36 | 2.27 | gi | All-trans-retinol 13,14-reductase |
| 33 | 1893.57 | 2.26 | gi | bacteriocin ABC transporter, bacteriocin-binding |
| 34 | 1683.48 | 2.24 | gi | hypothetical protein TDE2537 |
| 35 | 2116.25 | 2.22 | gi | heat shock protein HtpG |
| 36 | 1961.89 | 2.21 | gi | glycerol dehydrogenase-like oxidoreductase |
| 37 | 2130.66 | 2.21 | gi | lysine–tRNA ligase |
| 38 | 2056.26 | 2.20 | gi | ABC transporter, ATP-binding protein |
| 39 | 1595.09 | 2.19 | gi | fructose-bisphosphate aldolase |
| 40 | 1629.07 | 2.19 | gi | Zn-dependent alcohol dehydrogenase |
| 41 | 1747.08 | 2.18 | gi | TPR domain-containing protein |
| 42 | 2085.76 | 2.14 | gi | probable transcriptional regulator AraC famil |
| 43 | 2455.92 | 2.13 | gi | thiol-disulfide interchange protein |
| 44 | 1789.44 | 2.11 | gi | 2-isopropylmalate synthase |
| 45 | 1753.58 | 2.11 | gi | thiol-disulfide isomerase and thioredoxin |
| 46 | 1565.07 | 2.10 | gi | PTS system IIC component; diguanylate phosphod |
| 47 | 1764.52 | 2.09 | gi | methionine import ATP-binding protein MetN |
| 48 | 1865.75 | 2.07 | gi | 2,3-bisphosphoglycerate-dependent phosphoglycerate |
| 49 | 1873.80 | 2.06 | gi | DNA integration/recombination/invertion protein |
| 50 | 1716.11 | 2.06 | gi | putative cytoplasmic protein |
| 51 | 1608.73 | 2.05 | gi | ribosomal protein S6 |
| 52 | 1938.30 | 2.04 | gi | isocitrate dehydrogenase, NADP-dependent |
| 53 | 2109.28 | 2.04 | gi | hypothetical protein PG_0355 |
|
Table 2, continued | ||||
|---|---|---|---|---|
| NUM | Mass (Da) | Av. ratio | Protein | ID details |
| 54 | 1830.82 | 2.03 | gi | Fructose-bisphosphate aldolase |
| 55 | 2032.14 | 2.03 | gi | aspartate semialdehyde dehydrogenase |
| 56 | 2093.27 | 2.02 | gi | Phage protein [Fusobacterium nucleatum subsp. v |
| 57 | 1721.75 | 2.00 | gi | hypothetical protein EIKCOROL_01635 |
| 58 | 2060.16 | 2.00 | gi | Aspartate carbamoyltransferase |
| 59 | 2051.33 | 1.99 | gi | bacterial nucleoid protein Hbs |
| 60 | 1689.00 | 1.99 | gi | hypothetical protein EIKCOROL_02675 |
| 61 | 2109.08 | 1.99 | gi | GDP-mannose 4,6-dehydratase |
| 62 | 1984.14 | 1.99 | gi | hypothetical protein LebuDRAFT_02810 |
| 63 | 1769.30 | 1.99 | gi | DNA/RNA helicase, superfamily II, SNF2 family |
| 64 | 1982.31 | 1.98 | gi | Alkyl hydroperoxide reductase C22 |
| 65 | 1604.10 | 1.97 | gi | hypothetical protein EIKCOROL_02276 |
| 66 | 2352.23 | 1.96 | gi | nickel ABC transporter, periplasmic nickel-bin |
| 67 | 1801.25 | 1.96 | gi | triosephosphate isomerase |
| 68 | 2169.29 | 1.94 | gi | hypothetical protein TDE0304 |
| 69 | 1956.47 | 1.94 | gi | RNA polymerase sigma factor WhiG |
| 70 | 2003.22 | 1.92 | gi | DNA helicase |
| 71 | 1580.18 | 1.91 | gi | conserved hypothetical protein |
| 72 | 1634.89 | 1.90 | gi | TldD/PmbA family protein |
| 73 | 1813.18 | 1.89 | gi | hypothetical protein |
| 74 | 1473.49 | 1.89 | gi | CRISPR-associated protein, Csn1 family |
| 75 | 1917.00 | 1.88 | gi | hypothetical protein EIKCOROL_02088 |
| 76 | 1764.27 | 1.88 | gi | SSU ribosomal protein S30P |
| 77 | 1695.78 | 1.86 | gi | ABC transporter ATP-binding protein/peptidase |
| 78 | 1892.92 | 1.86 | gi | isocitrate dehydrogenase, NADP-dependent |
| 79 | 1714.29 | 1.86 | gi | probable transcriptional regulatory protein, C |
| 80 | 1484.02 | 1.86 | gi | glycogen/starch/alpha-glucan phosphorylase |
| 81 | 1812.44 | 1.86 | gi | conserved hypothetical protein |
| 82 | 1759.24 | 1.85 | gi | conserved hypothetical protein |
| 83 | 1302.12 | 1.85 | gi | hypothetical protein CochDRAFT_08810 |
| 84 | 1912.25 | 1.85 | gi | apolipoprotein N-acyltransferase |
| 85 | 1840.92 | 1.85 | gi | ABC superfamily ATP binding cassette transpor |
| 86 | 2159.33 | 1.84 | gi | ABC transporter, ATP-binding protein |
| 87 | 1523.07 | 1.83 | gi | phosphoglycerate kinase |
| 88 | 2126.30 | 1.83 | gi | Phosphoglycerate kinase |
| 89 | 1890.45 | 1.82 | gi | isoleucine-tRNA ligase |
| 90 | 2015.12 | 1.82 | gi | CDP-glucose 4,6-dehydratase |
| 91 | 1447.57 | 1.82 | gi | uncharacterized conserved protein |
| 92 | 1468.71 | 1.82 | gi | tRNA (Uracil-5-) -methyltransferase |
| 93 | 1811.06 | 1.82 | gi | hypothetical protein FNP_0608 |
| 94 | 1769.04 | 1.81 | gi | outer membrane lipoprotein |
| 95 | 2322.33 | 1.81 | gi | hypothetical protein EIKCOROL_01521 |
| 96 | 1898.96 | 1.81 | gi | GTP-binding protein TypA/BipA TypA/BipA |
| 97 | 1754.57 | 1.80 | gi | dihydrolipoyl dehydrogenase |
| 98 | 2038.83 | 1.80 | gi | Hypothetical Cytosolic Protein |
| 99 | 1804.83 | 1.79 | gi | conserved hypothetical protein |
| 100 | 1720.61 | 1.79 | gi | hypothetical protein FNP_0141 |
| 101 | 1255.86 | 1.79 | gi | ATP-dependent DNA helicase RecG |
| 102 | 2159.84 | 1.78 | gi | Flavodoxin |
| 103 | 1949.98 | 1.77 | gi | glutamate formimidoyltransferase |
| 104 | 1735.95 | 1.77 | gi | nonphosphorylating glyceraldehyde-3-phosphate |
| 105 | 1417.96 | 1.77 | gi | DNA polymerase III alpha subunit |
| 106 | 2435.47 | 1.76 | gi | hypothetical protein EIKCOROL_00597 |
|
Table 2, continued | ||||
|---|---|---|---|---|
| NUM | Mass (Da) | Av. ratio | Protein | ID details |
| 107 | 1952.19 | 1.76 | gi | copper (Cu2+)-exporting ATPase |
| 108 | 1946.13 | 1.75 | gi | Enolase |
| 109 | 2044.80 | 1.75 | gi | fructose-bisphosphate aldolase, class II |
| 110 | 2101.11 | 1.74 | gi | hypothetical protein EIKCOROL_00207 |
| 111 | 1870.30 | 1.73 | gi | mannose-1-phosphate guanylyltransferase |
| 112 | 1815.15 | 1.72 | gi | conserved hypothetical protein |
| 113 | 2065.65 | 1.72 | gi | sulfite reductase, beta subunit (hemoprotein) |
| 114 | 2144.06 | 1.72 | gi | signal transduction histidine kinase, COG0642 |
| 115 | 1444.38 | 1.72 | gi | hypothetical protein CAMRE0001_0295 |
| 116 | 1681.92 | 1.71 | gi | hypothetical protein PGN_1895 |
| 117 | 1946.32 | 1.70 | gi | uncharacterized paraquat-inducible protein B |
| 118 | 1982.21 | 1.70 | gi | phosphoribosylformylglycinamidine synthase |
| 119 | 1928.05 | 1.70 | gi | hypothetical protein CAPSP0001_0185 |
| 120 | 2053.30 | 1.69 | gi | ABC transporter, ATP-binding protein |
| 121 | 1674.50 | 1.69 | gi | Fe-S oxidoreductase |
| 122 | 2025.65 | 1.68 | gi | possible plasmid mobilization protein |
| 123 | 2124.28 | 1.67 | gi | D-isomer specific 2-hydroxyacid dehydrogenase |
| 124 | 2205.30 | 1.66 | gi | conserved hypothetical protein |
| 125 | 1460.65 | 1.66 | gi | glycine cleavage system H protein |
| 126 | 1899.49 | 1.66 | gi | putative tonB-linked outer membrane receptor |
| 127 | 1541.42 | 1.66 | gi | glycogen synthase |
| 128 | 1887.21 | 1.64 | gi | 3-dehydroquinate synthase |
| 129 | 1273.98 | 1.64 | gi | conserved hypothetical protein |
| 130 | 1657.53 | 1.63 | gi | pyruvate synthase [Fusobacterium nucleatum su |
| 131 | 1483.78 | 1.63 | gi | hypothetical protein LebuDRAFT_11420 |
| 132 | 2134.60 | 1.62 | gi | ribosomal protein S3 |
| 133 | 1618.98 | 1.62 | gi | N-acyl-D-aspartate/D-glutamate deacylase |
| 134 | 1782.11 | 1.61 | gi | DNA-binding protein, histone-like family |
| 135 | 1586.32 | 1.61 | gi | phage minor structural protein, putative |
| 136 | 1693.94 | 1.61 | gi | hypothetical protein FNP_1373 [Fusobacterium |
| 137 | 2148.12 | 1.61 | gi | elongation factor EF1A |
| 138 | 2002.16 | 1.61 | gi | hypothetical protein EIKCOROL_02573 |
| 139 | 1480.44 | 1.60 | gi | FtsK/SpoIIIE family cell division protein |
| 140 | 1816.96 | 1.60 | gi | putative cytoplasmic protein |
| 141 | 1776.34 | 1.59 | gi | hypothetical protein TDE1704 |
| 142 | 2021.76 | 1.59 | gi | integrase/recombinase XerD |
| 143 | 2098.43 | 1.59 | gi | hypothetical protein EIKCOROL_01760 |
| 144 | 1480.96 | 1.58 | gi | aspartyl-tRNA synthetase |
| 145 | 1712.68 | 1.57 | gi | hypothetical protein CAPSP0001_1551 |
| 146 | 1874.39 | 1.57 | gi | hypothetical protein EIKCOROL_00085 |
| 147 | 1494.21 | 1.57 | gi | UDP-N-acetylmuramyl tripeptide synthase |
| 148 | 1673.82 | 1.56 | gi | 4-amino-4-deoxychorismate lyase |
| 149 | 1951.21 | 1.56 | gi | TPR domain-containing protein |
| 150 | 2204.99 | 1.56 | gi | chaperone protein DnaK |
| 151 | 1590.11 | 1.56 | gi | hypothetical protein PGN_0079 |
| 152 | 1601.16 | 1.56 | gi | hypothetical protein TDE1814 |
| 153 | 1889.49 | 1.56 | gi | hypothetical protein TDE2604 |
| 154 | 1664.98 | 1.55 | gi | fructose-1,6-bisphosphatase |
| 155 | 1377.94 | 1.55 | gi | Export ABC transporter |
| 156 | 2059.94 | 1.55 | gi | hypothetical protein |
| 157 | 2792.72 | 1.55 | gi | LSU ribosomal protein L18P [Leptotrichia bucca |
| 158 | 1143.01 | 1.55 | gi | hypothetical protein LebuDRAFT_25250 |
| 159 | 1772.95 | 1.54 | gi | hypothetical protein CAPGI0001_0708 |
| 160 | 1601.40 | 1.54 | gi | ribonucleotide reductase |
|
Table 2, continued | ||||
|---|---|---|---|---|
| NUM | Mass (Da) | Av. ratio | Protein | ID details |
| 161 | 1885.91 | 1.54 | gi | hypothetical protein TDE1500 |
| 162 | 1999.21 | 1.54 | gi | methyl-accepting chemotaxis protein |
| 163 | 1859.62 | 1.54 | gi | McrBC 5-methylcytosine restriction system comp |
| 164 | 1423.17 | 1.53 | gi | hypothetical protein CochDRAFT_19730 |
| 165 | 2024.66 | 1.53 | gi | alpha-phosphoglucomutase |
| 166 | 1603.16 | 1.53 | gi | conserved hypothetical protein |
| 167 | 2136.53 | 1.52 | gi | hypothetical protein FNP_1239 |
| 168 | 2170.12 | 1.52 | gi | conserved hypothetical protein |
| 169 | 1958.17 | 1.52 | gi | hypothetical protein EIKCOROL_00032 |
| 170 | 1441.73 | 1.52 | gi | protease subunit of ATP-dependent protease |
| 171 | 1786.80 | 1.51 | gi | replication protein |
| 172 | 1655.44 | 1.51 | gi | V-type ATP synthase subunit E |
| 173 | 1460.62 | 1.51 | gi | Carbamoyl-phosphate synthase large chain |
3.Results
3.1Label-free 2D-LC-MS/MS Identification
Liquid chromatography-series mass were analyzed in CF, CS group (we repeated the experiments for three times), including 1804 quantitative information peptides, 39 in CF group, and 30 in CS group. The data from liquid chromatography-series mass spectroscopy was analyzed by DecyderMS software, and 603 peptide data sets were obtained, including 202 in CF group. Among them, 33 peptide has a much higher significant differences which was greater than 1.5 times (Table 1), On the other hand, we found 401 peptide in CS group. And there were 199 among them has a greater differences which more than 1.5 times (173 without redundant proteins, Table 2).
3.2Gene ontology function analysis
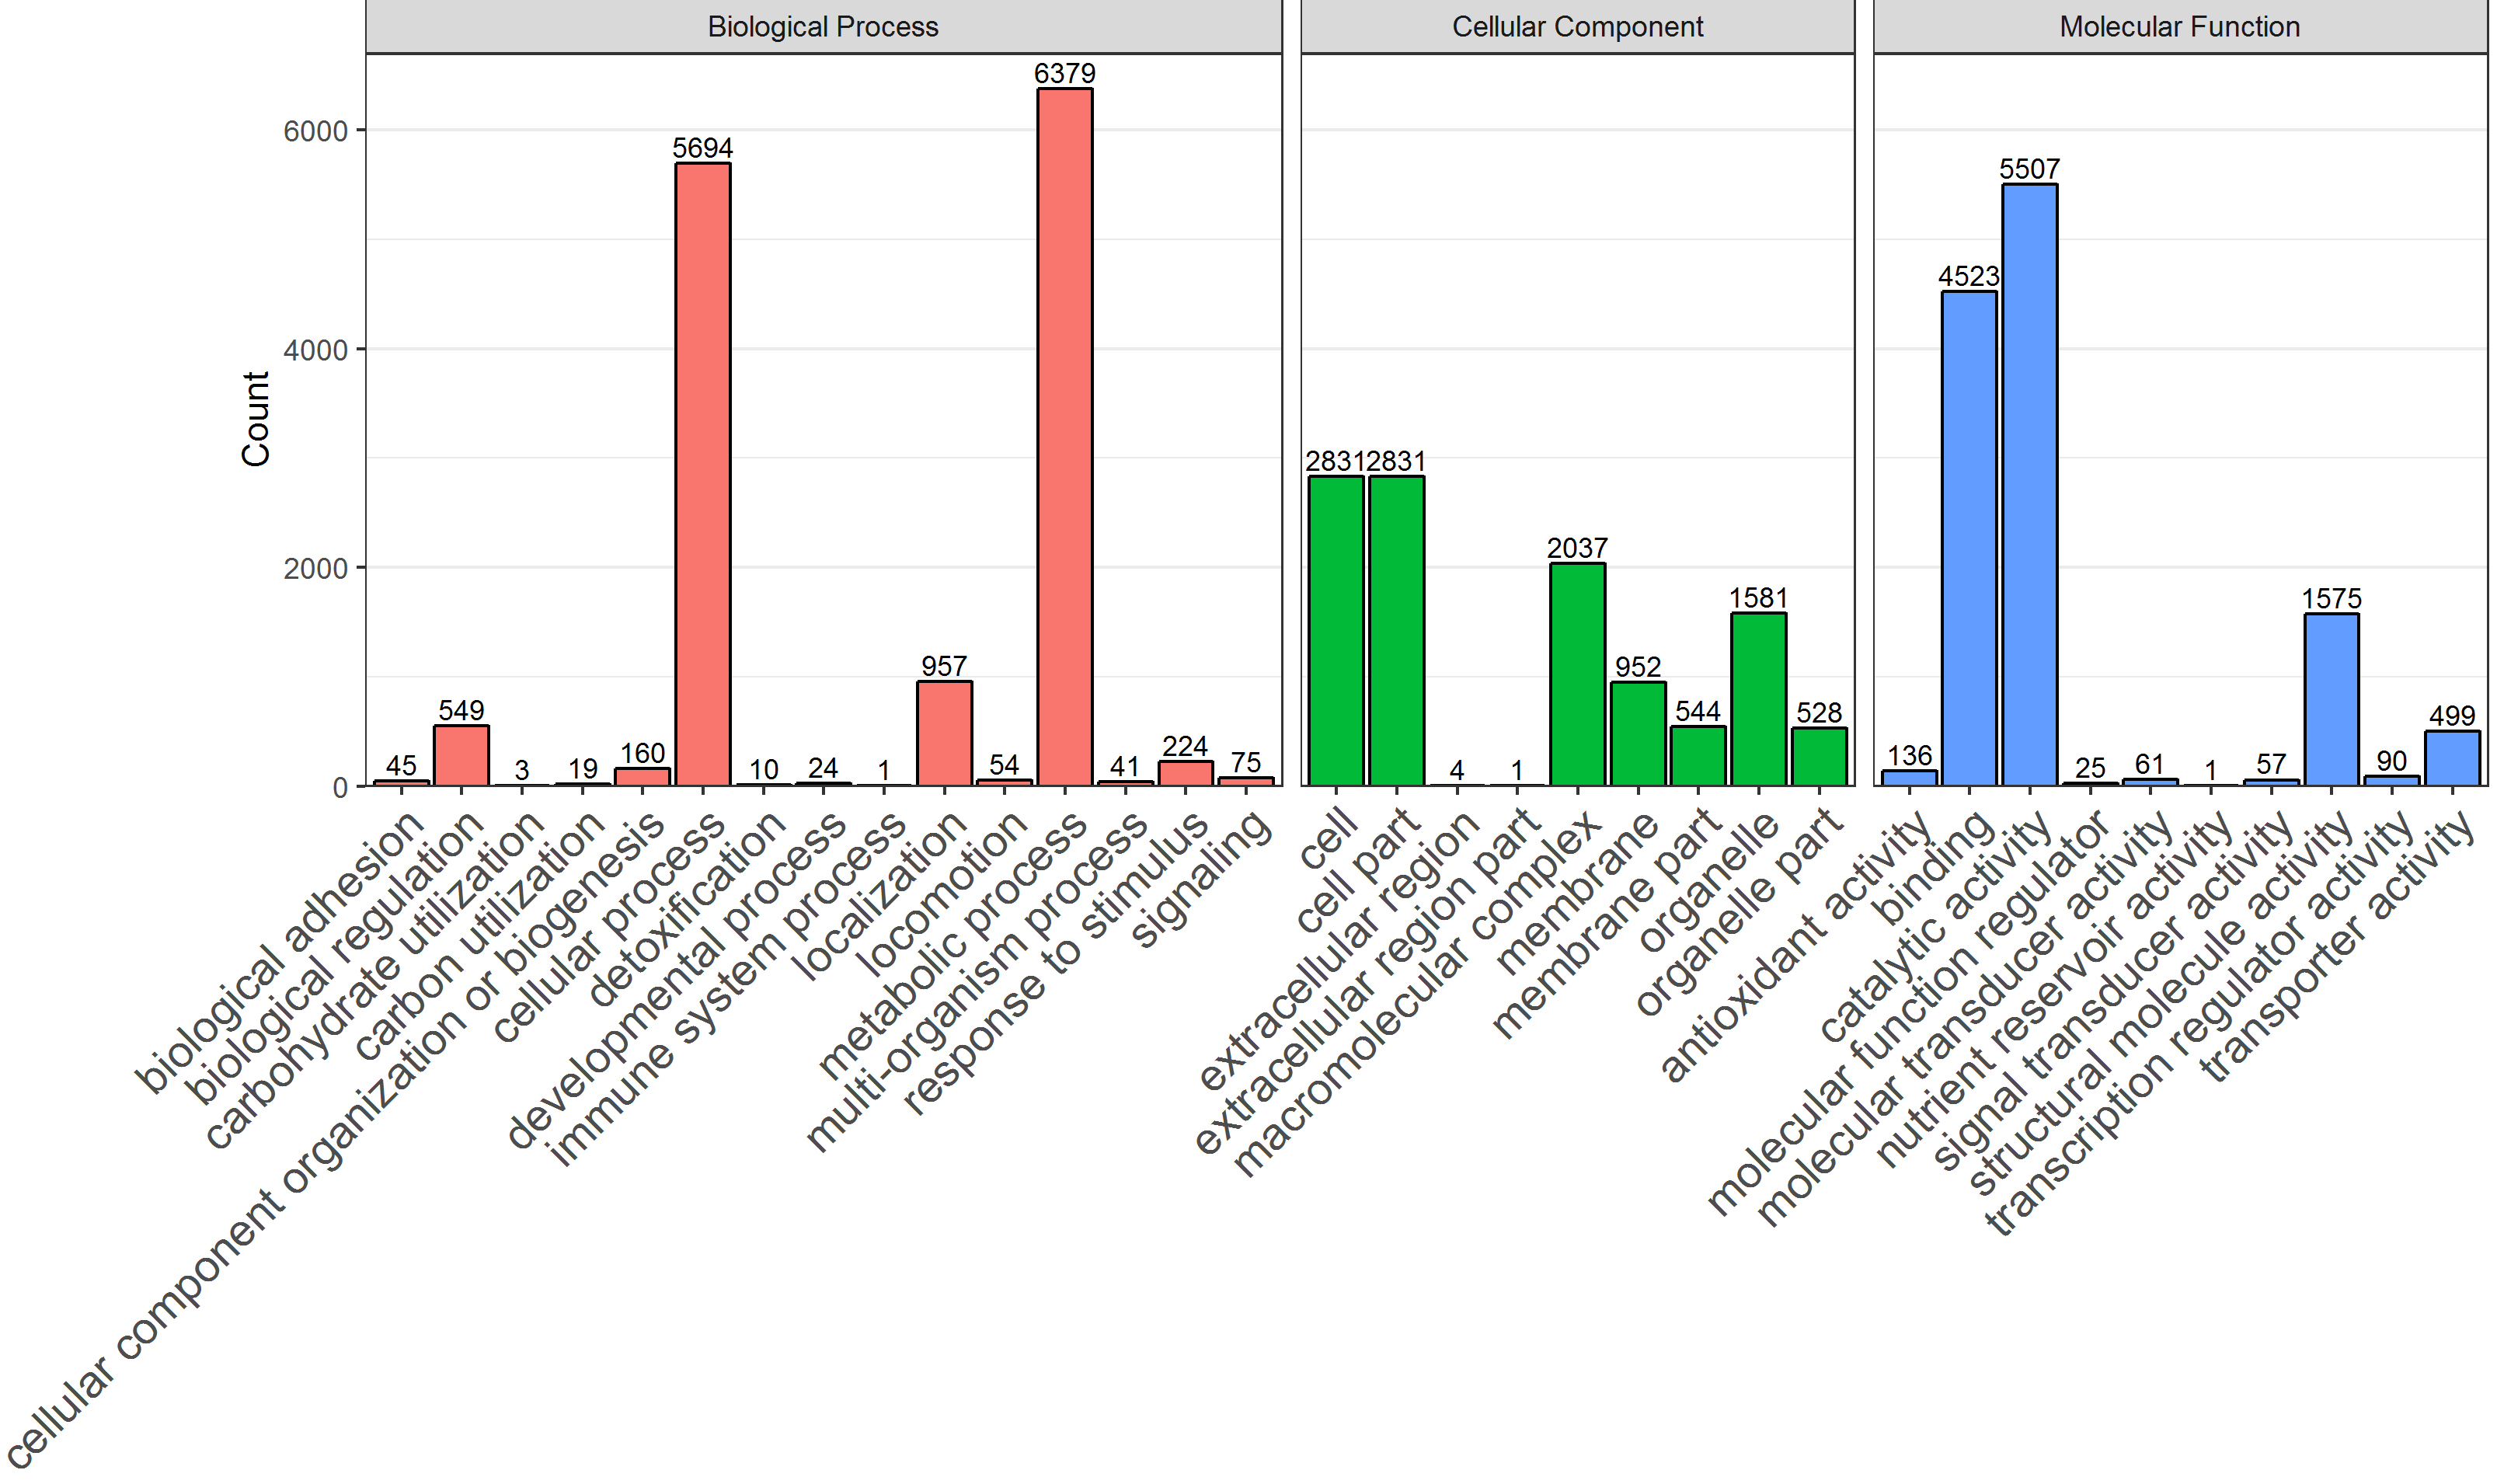
In total, 9194 (80.16%) identified microbial leading proteins corresponded to at least one GO term using InterProScan and in-house Perl Scripts. The number of proteins was counted at GO level 2 of biological process, cellular component, and molecular function ontology, respectively (Fig. 7). Moreover, the proteins of two groups that corresponded to the GO term of biological process, cellular component, and molecular function ontology were counted. Then, Fisher’s exact test was performed to compare the difference of the protein group number between the two groups. Based on a
The count of proteins corresponding to GO terms of all samples were performed using in-house Perl and R scripts. With a
3.3PRM verification
Parallel reaction monitoring (PRM) mass spectrometry was used to verify the target peptides determined by the metaproteomic analysis and a pre-experiment, and the 171 candidate peptides of the target protein were subjected to LC-PRM/MS analysis. In total, 103 candidate proteins were quantified by LC-PRM/MS, including 3 proteins (hinf_c_1_1270, fnuc2539_c_1_361, cgin_c_10_1771) that were determined as the differential expressed protein candidates in the metaprotemics study. The Skyline analysis results of each candidate peptide were shown.
Meanwhile, 17 differential expressed peptide candidates were confirmed by the Mann-Whitney U test with a
Figure 10.
Glycolysis.
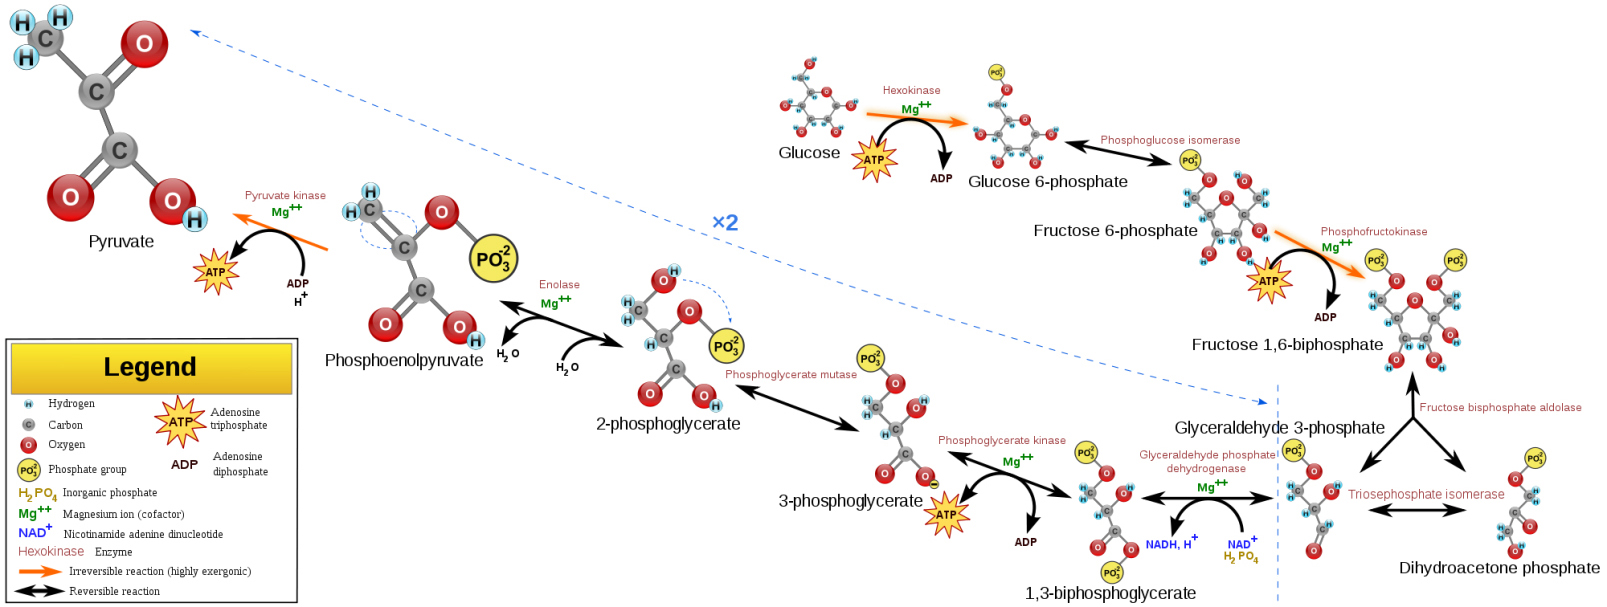
Figure 11.
Gluconeogenesis.
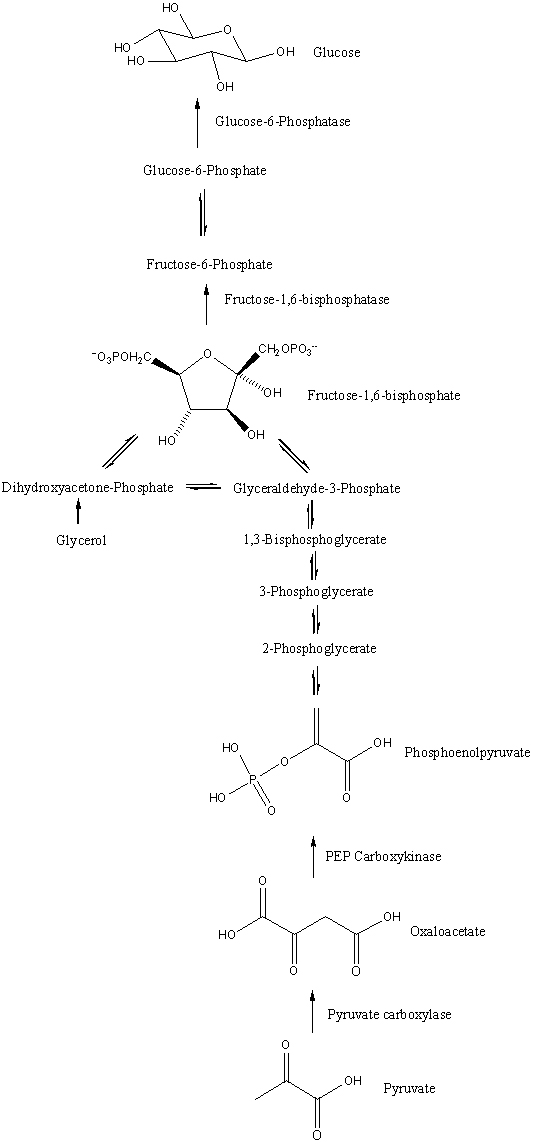
Table 3
High expression ABC transporter data set of CS group (
| Num | Ratio | GI ID | ID details |
|---|---|---|---|
| 1 | 2.26 | gi | bacteriocin ABC transporter, bacteriocin-binding |
| 2 | 2.20 | gi | ABC transporter, ATP-binding protein |
| 3 | 1.96 | gi | nickel ABC transporter |
| 4 | 1.86 | gi | ABC transporter ATP-binding protein/ peptidase |
| 5 | 1.85 | gi | ABC superfamily ATP binding cassette transporter |
| 6 | 1.84 | gi | ABC transporter, ATP-binding protein |
| 7 | 1.69 | gi | ABC transporter, ATP-binding protein |
| 8 | 1.55 | gi | Export ABC transporter |
| 9 | 1.44 | gi | ABC superfamily ATP binding cassette transpor |
| 10 | 1.37 | gi | ABC transporter ATP-binding protein |
| 11 | 1.39 | gi | ABC-type metal ion transport system |
| 12 | 1.19 | gi | ABC superfamily ATP binding cassette transpor |
| 13 | 1.12 | gi | Hemin transport system ATP-binding protein hmuV |
Table 4
High expression ABC transporter data set of CF group (
| Num | Ratio | GI ID | ID details |
|---|---|---|---|
| 1 | 1.32 | gi | ABC-type uncharacterized transport system |
| 2 | 1.26 | gi | putative ABC transporter ATP-binding protein |
| 3 | 1.18 | gi | ABC transporter, ATP-binding/permease protein |
| 4 | 1.16 | gi | branched chain amino acid ABC superfamily ATP |
4.Discussion
In this study, we initially used the method of macroproteomics to find the bacterial secretion proteins in caries-free children and children with high caries, with a total of 1735 peptides, including 603 statistically different peptides. Further bioinformatics study found that the proteins with differences in the expression were more than 1.5 times mainly concentrated in the glycolysis/glyneogenesis, pyruvate metabolism, citric acid circulation, ABC transporters, etc. We will discuss from two aspects – the pathways and the key proteins.
4.1Saccharolysis/sugar lyiogenesis
4.1.1Glycolysis
Saccharolysis (glycolysis) is the first step in the sugar metabolism process of all biological cells. During this process, a molecule of glucose undergoes a ten-step enzyme reaction to form two molecules of pyruvate with the formation of ATP (Figs 8–10). This suggests the presence of active sugar metabolism in the caries-causing plaque, presumably due to the highly expressed enzymes that use intracellular polysaccharide, mainly glycogen as a source of energy, resulting in tooth demineralization [6].
Phosphorylation of the phosphoric fructose (phosphorylation of fructose-6-phosphate) is the third step of glycolysis, further phosphorylation of C on 6-phosphate fructose initially produces 1,6-diphosphate fructose supplied by ATP. The reaction is catalyzed by phosphate fructose kinase (phosphofructokinase, PFK), which is an important speed limiting enzyme in the sugar aerobic oxidation process. Phosphoric transfer of phosphoenol pyruvate is the final reaction in glycolysis that involves the transfer of the high energy phosphorate group from phosphoroll pyruvate to ADP, and is catalyzed by pyruvate kinase, PK, which is another phosphorylation process at the substrate level.
Figure 12.
Tricarboxylic acid.
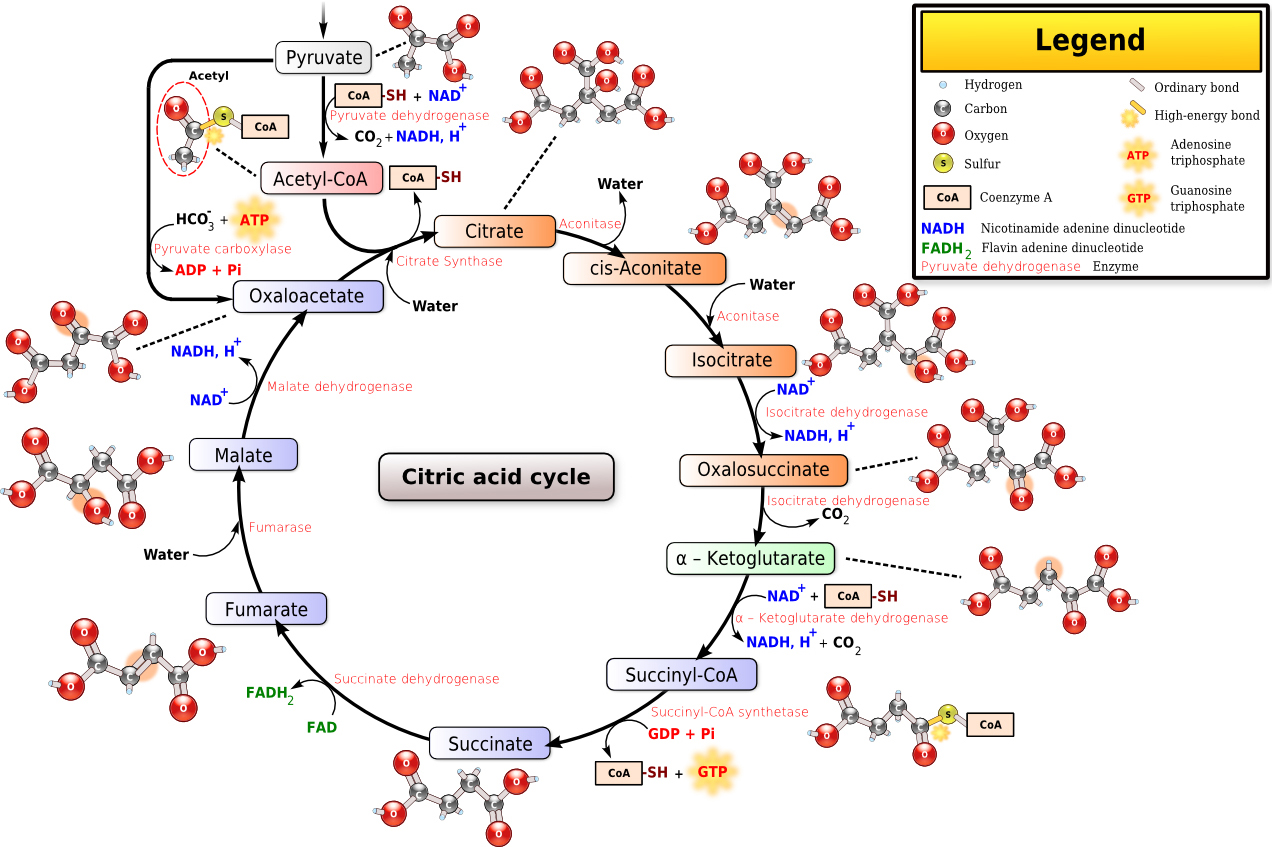
Table 5
Co expression ABC transporter data set of CS&CF group (
| Num | GI ID | ID details |
|---|---|---|
| 1 | gi | ABC superfamily ATP binding cassette transport |
| 2 | gi | ABC-type multidrug transport system |
| 3 | gi | ABC-type multidrug transport system |
| 4 | gi | ABC-type oligopeptide transport system |
| 5 | gi | ABC transporter, ATP-binding/permease protein |
| 6 | gi | ABC-type cobalt transport system |
| 7 | gi | ABC-type Fe |
| 8 | gi | ABC-type metal ion transport system |
| 9 | gi | ABC transporter, ATP-binding/permease protein |
| 10 | gi | ABC transporter, ATP-binding/permease protein |
| 11 | gi | ABC transporter, ATP-binding/permease protein |
| 12 | gi | ABC transporter, ATP-binding protein |
| 13 | gi | ABC transporter, ATP-binding protein |
| 14 | gi | ABC transporter ATP-binding protein/peptidase |
| 15 | gi | amino acid/amide ABC transporter membrane prot |
| 16 | gi | branched chain amino acid ABC transporter |
| 17 | gi | dipeptide/oligopeptide/nickel (Ni |
| 18 | gi | excinuclease ABC subunit A |
| 19 | gi | excinuclease ABC subunit B |
| 20 | gi | excinuclease ABC, C subunit |
| 21 | gi | galactoside ABC transporter, ATP-binding protein |
| 22 | gi | iron (Fe |
| 23 | gi | iron compound ABC transporter |
| 24 | gi | iron compound ABC transporter |
| 25 | gi | nickel (Ni |
| 26 | gi | possible nitrate/sulfonate/bicarbonate ABC su |
Table 6
Candidate differential expressed peptides were confirmed by Mann-Whitney U test and paired-samples T test in common
| Peptide sequence | Fold change | ||
|---|---|---|---|
| VVEYVEKPVIVYR | 4.90E-02 | 4.63E-02 | 8.51 |
| YSFSTCYNSER | 3.56E-03 | 4.40E-03 | 5.21 |
| TAALENAAEGGFNKK | 2.19E-02 | 5.22E-03 | 4.33 |
| VVVEVLSQGK | 2.27E-02 | 5.87E-03 | 3.73 |
| LNNCPTSPR | 4.35E-02 | 3.32E-02 | 3.71 |
| VLDELTALR | 4.97E-02 | 4.18E-02 | 2.50 |
| SPEEAYEHAK | 4.91E-02 | 2.51E-02 | 2.14 |
Figure 13.
A bar chart of protein count at GO level 2 of biological process, cellular component, and molecular function ontology using the ‘ggplot2’ package. The number markers at the bar were protein count of the GO term.
Reversible reactions in glycolysis include 7 steps: glucose phosphate isomerase is involved in the second step; heterogeneous reaction of glucose phosphate (isomerization of glucose-6-phosphate); participation in step 4 1.6-diphosphate pyrolysis reaction (i.e. cleavage of fructose 1, 6 di/bis phosphate from fructose-1, 6-Bisphosphate Aldoase (fructose-1, 6-bisphosphate aldolase); participation in step 6: 3-glyceraldehyde phosphate oxidation reaction (oxidation of glyceraldehydes-3-phosphate); 3-glyceraldehyde phosphate dehydrogenase (glyceraldehyde 3-phosphate dehydrogenase); phosphorate kinase (phosphoglycerate kinase, PGK) participating in high energy phosphate bond transfer of step 1.3-diphosphate glyceric acid. These enzymes showed a high expression in the plaque fluid in both two groups. Studies show that the above catalytic enzymes participate in the sugar heterogeneous reaction at the same time. So, we speculate that both in caries-free or caries causogenic plaque, the glycolysis and sugar heterogeneous reaction can be accurately adjusted, so that the bacteria in the plaque can use the excess sugar in the form of glycogen as energy storage to meet their own energy needs.
The final reversible reaction is step 2-phosphoglyceric acid, catalyzed by enolase, which was highly expressed in the CS group (
4.1.2Gluconeogenesis and NAD+
There are three-step reactions in glycolysis that are irreversible reactions that must be bypassed during sugar heterogenesis, at the cost of higher energy consumption (Fig. 11). The fructose-1,6-diphosphatase involved in this process was highly expressed in the CS group and the phosphoenlate-type pyruvate carboxylated kinase was expressed in both groups, suggesting that the sugar heterogenesis occured in both the mature and the pathogenic plaque and was precisely regulated.
NAD
4.2Tricarboxylic acid circulation
The cytoplasm of prokaryotes is the site of tricarboxylic acid circulation, but most enzymes are found in plaque fluid, including isocitrate dehydrogenase (isocitrate dehydrogenase, IDH) (Fig. 12), succinate dehydrogenase, malate dehydrogenase, succinyl-assisted A synthase, and
The IDH superfamily is ancient and large, widespread in the three boundaries of life (archaea, bacteria and eukaryotes). IDH catalyzes isocitric acid to
4.3ABC transporter protein
This study identified more than 50 corresponding adenosine triphosphate binding box transporters (ATP-binding cassette transporter, ABC transporters) in children who were caries-free or with high caries. Associated with the transport of iron, nickel, cobalt ions, iron compounds, metal ions, oligopeptides, dipeptides, amino acids, branched chain amino acids, lactosidase, it is seen that ABC transporters are involved in various physiological functions of bacteria. It is worth noting that we identified 13 highly-expressed ABC transporters in the CS group, 6 proteins expressed more than 1.5 times, while only 4 ABC transporters were highly expressed in the CF group and all were less than 1.5 times, suggesting that material transformation in the process of caries-causing transformation of bacteria. Among them, ABC transporter of the group CS was expressed 2.6 times high, which may be the potential target molecule for caries activity evaluation.
4.4Molecular partner
This experiment identified 34 molecular companion peptide segments, belonging to the Hsp60 (GroEL) family, Hsp70 (DnaK) family, Hsp90 (Http pG) family, and Hspl00 (CIp) family. GroEL’s E. coli is a homologous oligomer complex that plays an important role in the correct folding and assembly of newborn proteins and the recovery of degenerative proteins under thermal or chemical adversity. Although it has been determined that GroEL is located in the cytoplasm, the surface of some pathogens can express GroEL, and this is generally associated with the role the molecular partners play during adhesion [15]. GroEL expression was also detected in plaque fluid. It is speculated that the Hsp molecular companion, as the main antigen of most pathogens, may cause GroEL rearrangement on the bacterial cell membrane in the process of bacterial infection or under stress stimulation. Unlike the first two HSP, we found that HtpG was significantly upregulated in the CS group, but relevant studies showed that HSP90 synthesis speed and synthesis volume after stress were not significantly different than the above HSP, so its mechanism of cell protection needs to be further clarified.
4.5Phosphorylation modification
In this experiment, the presence of two-component systems and Phosphotransferase system (PTS) was detected and consistently increased in expression in group CS, suggesting active protein phosphorylation modification and intercellular signaling in pathogenic biofilms.
The PTS system usually consists of five proteins including the enzyme I, enzyme (including three subunits of A, B and C) and phosphoolenol pyruvate (phosphoenolpyruvate, HPr). High expression of PTS system IIA, IIC in the CS group was also observed in this trial, indicating that the glucose intake within the flora was active during the occurrence of caries and development.
4.6Bacterial phages
At present, specific phages for bacteria such as Actinomyces, Actinobacillus Actinomycetecomitans, Actinomyces viscosus, Enterococcus faecalis (Actinomyces Actinobacillus actinomycetecomitans, Actinomyces viscosus, Enterococcus faecalis have been isolated in plaque and saliva respectively, In this experiment, eight phage-related proteins were detected in two groups, two of them (phages and microstructural proteins) were highly expressed in the high caries group. Although less data on this finding is available, some scholars have speculated on the potential prospect of bacteriophages in the caries prevention and treatment process [16, 17, 18, 19]. Taking a phage as a plaque control method may be a new area.
4.7Membrane protein
The outer membrane is the contact surface of the bacteria and the external environment, and its main components are lipid, lipoprotein and outer membrane protein. Outer membrane protein is the main component of the outer membrane, which plays an important role in material transport, information identification, cell adsorption, and outer membrane protein and secreted protein are also the first choice protein of vaccine antigens. A variety of high-expression of bacterial outer membrane protein, lipoprotein, and apolipoprotein were detected in this experiment, but its function in the occurrence and development of caries needs yet to be studied specifically.
4.8Other key proteins
After PRM verification, we found some key proteins which may play an important role during the development of dental caries in children (Fig. 13), which are discussed below.
Our experimental results show that although PFK and PK are highly expressed in both CF, CS groups, it exceeds 1.5 times in the CS group, indicating that PEK and PK play an important role in the occurrence and development of caries, especially in bacterial caries, and also shows that the glycolysis process can provide energy for the life activity of bacterial cells and maintain the bacterial physiological function in mature plaque.
In addition, this experiment also found that glycan phosphate isomerase was highly expressed in the plaque fluid in children with high caries, indicating that this enzyme may play an important role in the plaque caries-causing process by promoting the effective energy generation of the plaque bacteria.
ADH is a zinc-containing metallicase widespread in human and animal liver, plant and microbial cells, with a broad substrate specificity to convert pyruvate produced by glycolysis into acetaldehyde and NAD and NAD
Hydrohydrogenase (hydrogenase) is an important class of biological enzymes present in the microorganisms that catalyze the oxidation of hydrogen or hydrogen production from reduced protons. In our experimental results, the presence of iron hydrogenase and ferroxygen reduction protein was detected in both groups and significantly highly expressed in the high caries group, presuming that this may be one of the mechanisms where acid-producing and acid-resistant bacteria survive in the acid-induced plaque.
In conclusion, in the present study, we obtained 1804 peptides with quantitative information, including 395 in CF group, 30 in CS group, 1735 peptides in both the groups. The DeCyder
Acknowledgments
This work is supported by the Shanghai Natural Science Foundation of China (grant number: 18zr1422300), the Innovative research team of high-level local universities in Shanghai (SSMU-ZDCX20180901), the Fundamental research program funding of Ninth People’s Hospital affiliated to Shanghai Jiao Tong university School of Medicine (JYZZ139), and the Natural Science Foundation of Tibet Autonomous Region (XZ2019ZR-ZY43(Z)).
Conflict of interest
None to report.
References
[1] | Corby PM, Lyons-Weiler J, Bretz WA, et al. Microbial risk indicators of early childhood caries. J Clin Microbiol. (2005) ; 43: : 5753-5759. |
[2] | Li Y, Ge Y, Saxena D, Caufield PW. Genetic profiling of the oral microbiota associated with severe early-childhood caries. J Clin Microbiol. (2007) ; 45: : 81-87. |
[3] | Lin Y, Qiu L, Gao X. Relationship between protein components in saliva and plaque fluid and caries susceptibility. Chinese Journal of Stomatology. (2002) ; 37: : 39-42. |
[4] | Yao Y, Grogan J, Zehnder M, et al. Compositional analysis of human acquired enamel pellicle by mass spectrometry. Arch Oral Biol. (2001) ; 46: : 293-303. |
[5] | Yao Y, Berg EA, Costello CE, et al. Identification of protein components in human acquired enamel pellicle and whole saliva using novel proteomics approaches. J Biol Chem. (2003) ; 278: : 5300-5308. |
[6] | Liu Z. Oral biology. People’s Health Publishing Company. Third edition. |
[7] | Hillman JD, Brooks TA, Michalek, et al. Construction and characterization of an effector strain of Streptococcus mutans for replacement therapy of dental caries. Infect Immun. (2000) ; 68: : 543-549. |
[8] | Fitzgerald RJ, Adams BO, Sandham HJ, et al. Cariogenicity of a Lactate dehydrogenase-deficient mutant of Streptococcus mutans serotype c in gnotobiotic rats. Infect Immun. (1989) ; 57: : 823-826. |
[9] | Hillman JD. Lactate dehydrogenase mutants of Streptococcus mutans: isolation and preliminary characterization. Infect Immun. (1978) ; 21: : 206-212. |
[10] | Yang D, Liu T, Zhou X, et al. Preliminary study on LDH activity of Streptococcus mutans isolates from different caries sensitive populations. West China Journal of Stomatology. (2005) ; 23: : 116-118. |
[11] | Zhu GP, Golding GB, Dean AM. The selective cause of an ancient adaptation. Science. (2005) ; 307: : 1279-1282. |
[12] | Lunzer M, Mill ER SP, Felsheim R. The biochemical architecture of an ancient adaptive landscape. Science. (2005) ; 310: : 499-501. |
[13] | Ell-ington AD, Bull JJ. Changing the cofactor diet of an enzyme. Science. (2005) ; 310: : 454-455. |
[14] | Jung IL, Kim SK, Kim IG. The RpoS-mediated regulation of isocitrate dehydrogenase gene expression in Escherichia coli. Curr Microbiol. (2006) ; 52: : 21-26. |
[15] | Garduno RA, Garduno E, Hoffman PS. Surface-associated hsp60 chaperonin of Legionella pneumophila mediates invasion in a HeLa cell model. Infect Immun. (1998) ; 66: : 4602-4610. |
[16] | Delisle AL, Nauman RK, Minah GE. Isolation of a bacteriophage for Actinomyces viscosus. Infection and Immunity. (1978) ; 20: : 303-306. |
[17] | Tylenda CA, Calvert C, Kolenbrander PE, Tylenda A. Isolation of Actinomyces bacteriophage from human dental plaque. Infection and Immunit. (1985) ; 49: : 1-6. |
[18] | Yeung MK, Kozelsky CS. Transfection of Actinomyces spp. by genomic DNA of bacteriophages from human dental plaque. Plasmid. (1997) ; 37: : 141-153. |
[19] | Bachrach G, Leizerovici-Zigmond M, Zlotkin A, Naor R, Steinberg D. Bacteriophage isolation from human saliva. Lett Appl Microbiol. (2003) ; 36: : 50-3. |


