
Recognition of uterine contractions with electrohysterogram and exploring the best electrode combination
Abstract
BACKGROUND:
As an essential indicator of labour and delivery, uterine contraction (UC) can be detected by manual palpation, external tocodynamometry and internal uterine pressure catheter. However, these methods are not applicable for long-term monitoring.
OBJECTIVE:
This paper aims to recognize UCs with electrohysterogram (EHG) and find the best electrode combination with fewer electrodes.
METHODS:
112 EHG recordings were collected by our bespoke device in our study. Thirteen features were extracted from EHG segments of UC and non-UC. Four classifiers of the decision tree, support vector machine (SVM), artificial neural network, and convolutional neural network were established to identify UCs. The optimal classifier among them was determined by comparing their classification results. The optimal classifier was applied to evaluate all the possible electrode combinations with one to eight electrodes.
RESULTS:
The results showed that SVM achieved the best classification capability. With SVM, the combination of electrodes on the right part of the uterine fundus and around the uterine body’s median axis achieved the overall best performance.
CONCLUSIONS:
The optimal electrode combination with fewer electrodes was confirmed to improve the clinical application for long-term monitoring of UCs.
1.Introduction
As an essential indicator of labour and delivery, uterine contraction (UC) can be detected by manual palpation, external tocodynamometry and internal uterine pressure catheter [1, 2, 3, 4, 5]. However, these methods are not applicable for long-term monitoring.
UC is the results of the myometrial cells’ underlying electrical activity, which is represented by the electrohysterogram (EHG) signal. With electrodes on a pregnant woman’s abdominal surface, EHG signals could be recorded noninvasively [6]. However, the electrode combination, including the number and arrangement, was primarily based on clinical experience and varied greatly in the published papers. Six bipolar electrodes were connected to the abdomen to identify and track UCs during labour. Threatened premature labour was diagnosed by eight electrodes in two symmetrical vertical columns of the belly button [7].
Multiple electrodes can provide comprehensive information about the uterine activity, however, causing inconvenience for clinical practice. Placing too many electrodes will cause stress on the pregnant woman and limit her activities. Decreasing the number of electrodes is mostly required for long-term monitoring. The F1-score method has been used to select the most appropriate electrode combination to classify between pregnancy and labour [8]. However, most researchers adopted an electrode combination with some subjectivity. Few studies have focused on optimizing electrode combinations. This paper intends to explore the best electrode combination of UC detection. Therefore, the optimal classifier has to be confirmed beforehand.
In recent years, many EHG features combined with different classifiers including SVM, decision tree (DT), artificial neural network (ANN), and convolutional neural network (CNN) have been investigated to recognize EHG signals for various research objectives [9, 10, 11, 12, 13, 14]. The performance of DT, SVM and ANN depends on their input features. DT requires only a small size of training samples. ANN is a better solution for nonlinear medical decision support systems. SVM is particularly appropriate for the classification of nonlinear, high-dimensional and small-size samples. CNN is one of the representative algorithms of deep learning, which has the advantage of incorporating feature learning and classification tasks into the unified network architecture. At the same time, one-dimensional CNN is more appropriate for processing time series, which has not been investigated in the classification of EHG signals [15]. Although a variety of classifiers have been used to identify UCs, the optimal one is still not explicit due to the different data sources. We chose the optimal classifier based on the same database and made efforts to reduce the number of electrodes.
In this paper, we selected four classifiers to differentiate UCs and non-UCs and the optimal classifier among them was determined based on their recognition capability. Then, with the optimal classifier, the recognition performance of all the electrode combinations were compared to achieve the best combination.
2.Methods
2.1EHG recording
One hundred twelve women were recruited at the Department of Gynecology and Obstetrics, Peking Union Medical College Hospital, Beijing. All healthy women were 38 to 42 weeks of gestation and gave birth within 24 hours. The recordings were recorded under the Declaration of Helsinki of the World Medical Association and approved by the Ethics Committee of Peking Union Medical College Hospital. After informing the pregnant woman of goals, potential benefits and research risks, they were required to sign an informed consent form.
Figure 1.
Configuration of the eight electrodes.
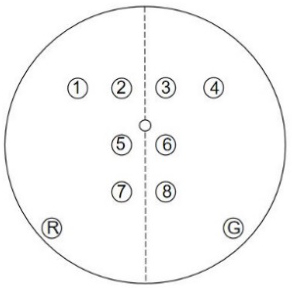
As shown in Fig. 1, eight electrodes placed in the abdomen were inverted cones. Electrode R and G were the reference electrode and the ground electrode respectively. One-channel TOCO signal and eight-channel EHG signals were collected simultaneously for about 30 minutes at the sampling frequency of 250 Hz using a bespoke recording system [16]. The pregnant women were required to press the button to indicate UCs they felt during recording.
2.2Signal preprocessing
All EHG signals were preprocessed by a low-pass filter of 3 Hz and a median filter to eliminate other interference. The amplitude of EHG signals was normalized between
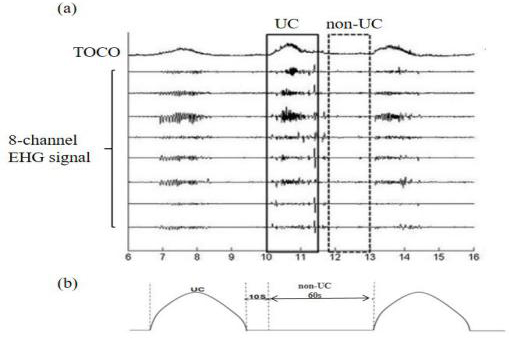
Figure 2.
(a) Illustration of the TOCO signal and eight EHG signals (b) The duration reference used to segment the EHG signal.
2.3EHG feature extraction
The conventional classifiers DT, SVM and ANN require the input feature vectors. Therefore, EHG features from UCs and non-UCs have to be extracted to train and test these classifiers. Table 1 summarizes the brief information about the thirteen extracted features.
Table 1
Extracted features from EHG segments
| Feature | Formula |
|---|---|
| Root mean square (RMS) |
|
| Standard deviation (STD) |
|
| Log detector (LOG) |
|
| Mean absolute value (MAV) |
|
| Simple square integral (SI) |
|
| Difference absolute standard deviation value (DAS) |
|
| Average amplitude change (AAC) |
|
| Median frequency (MF) |
|
| Peak frequency (PF) |
|
| Energy |
|
| Time reversibility (TR) |
|
| Lyapunov Exponent (LE) |
|
| Sample entropy (SampEn) |
|
Table 2
The details of the 1D-CNN structure
| Layer | Type | Number of neurons | Kernel size | Stride |
|---|---|---|---|---|
| 1 | Convolution | 741*64 | 10 | 1 |
| 2 | Convolution | 737*32 | 5 | 1 |
| 3 | Convolution | 734*16 | 4 | 1 |
| 4 | Fully connected | 2048 | – | – |
| 5 | Fully connected | 1024 | – | – |
| 6 | Fully connected | 2 | – | – |
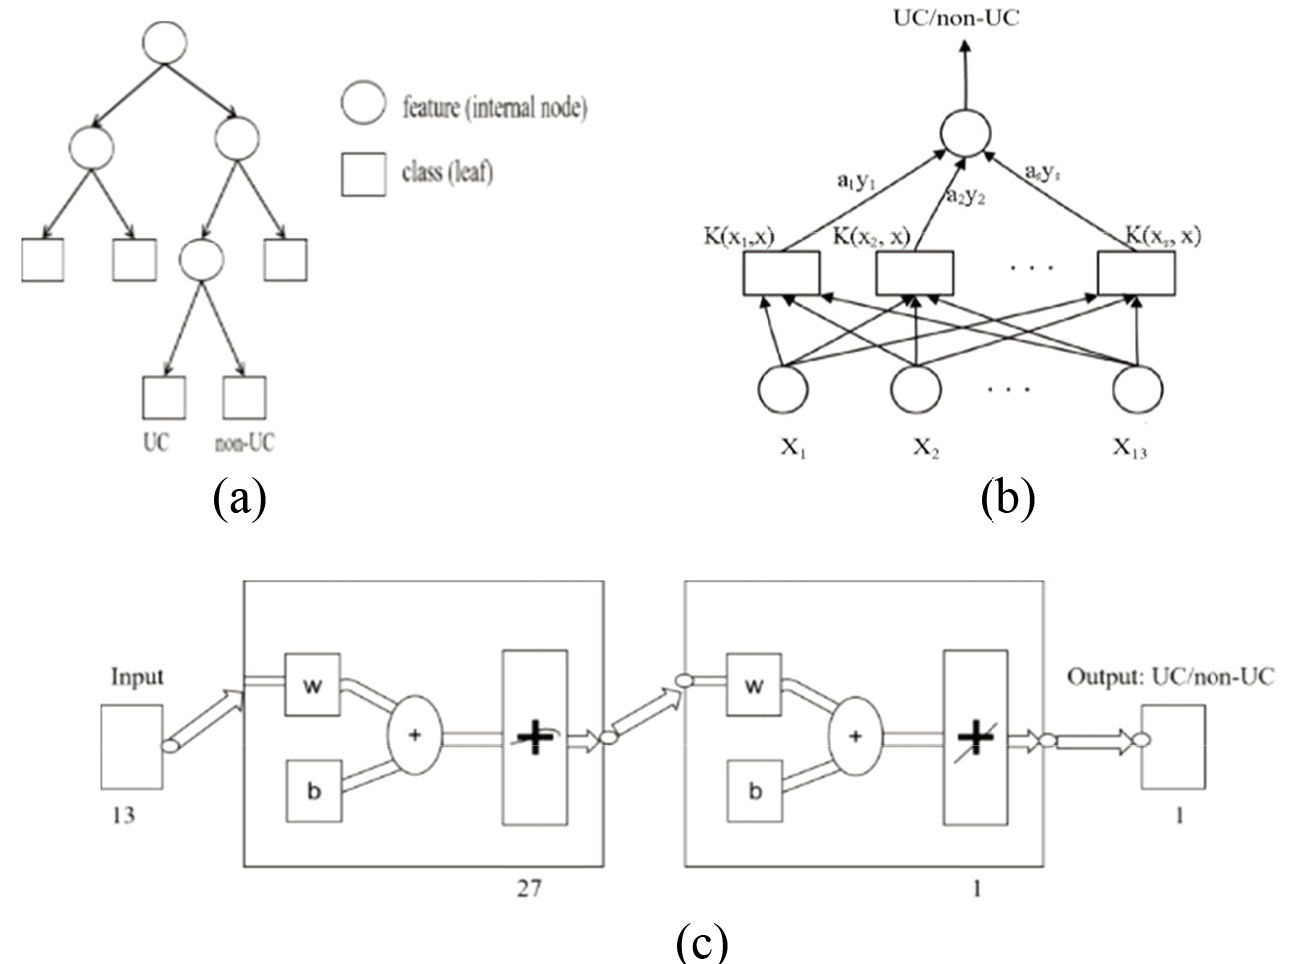
Figure 3.
Three classifiers (a) DT (b) SVM (c) ANN.
2.4Development of four classifiers
DT is a tree that each internal non-leaf node denotes a test on an input feature. In our study, Fig. 3a shows the diagram of DT. In SVM, the EHG signal described by 13 features (
Figure 4.
The structure of 1-D CNN.
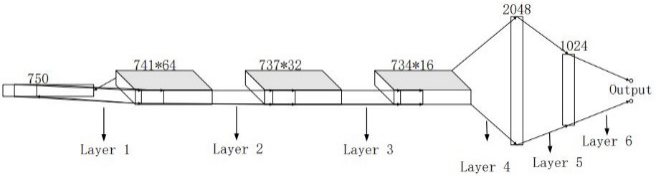
The CNN used in this study is a kind of feed-forward neural network that can automatically obtain optimal features from the training data. Figure 4 shows the structure of CNN. Table 2 summarizes the details of the 1-D CNN structure. The size of the kernel in the CNN model was selected based on the preliminary test, and the learning rate was 0.001.
2.5Classification evaluation
Ten-fold cross-validation was utilized to estimate the performance of four classifiers. Seven parameters, including area under the receiver operating characteristic curve (AUC), sensitivity (Sen), specificity (Spe), positive predictive value (PPV), negative predictive value (NPV), accuracy (ACC) and F1-Score were employed to estimate the effect of the classifiers. The outcomes of Sen, Spe, PPV, NPV, AUC, ACC and F1-score in the ten-fold cross-validation were calculated and averaged to evaluate the classifiers. The optimal classifier was determined by the overall consideration of these results.
2.6Evaluation of electrode combination
Evaluation of electrode combination is essential for reducing the number of electrodes and improving UC recognition’s ability. In the case of eight electrodes, there are C (8, 1), C (8, 2) …C (8, 8) combinations from one electrode to eight electrodes, a total of 255 electrode combinations. For each combination, the derived EHG segments of UC and non-UC were applied to train and test the optimal classifier with ten-fold cross-validation.
The combinations with one to eight electrodes were sorted in terms of the seven parameters. These parameters voted the optimal combinations with a different number of electrodes. Further, the best electrode combination was determined by the tradeoff between these optimal combinations.
3.Results
Table 3
Summary of the performance of four classifiers (95% CI)
| [height=1cm,width=4cm]Parameter (95% CI)Classifier | DT | SVM | ANN | CNN |
|---|---|---|---|---|
| Sen | 0.78 (0.76, 0.80) | 0.84 (0.83, 0.86) | 0.78 (0.75, 0.80) | 0.68 (0.66, 0.70) |
| Spe | 0.80 (0.79, 0.82) | 0.86 (0.84, 0.88) | 0.72 (0.70, 0.75) | 0.83 (0.81, 0.85) |
| PPV | 0.80 (0.79, 0.81) | 0.86 (0.84, 0.88) | 0.74 (0.72, 0.76) | 0.88 (0.86, 0.90) |
| NPV | 0.78 (0.77, 0.80) | 0.85 (0.83, 0.86) | 0.76 (0.74, 0.79) | 0.58 (0.55, 0.62) |
| ACC | 0.79 (0.78, 0.80) | 0.85 (0.84, 0.86) | 0.75 (0.73, 0.77) | 0.73 (0.72, 0.74) |
| AUC | 0.79 (0.78, 0.80) | 0.85 (0.84, 0.86) | 0.74 (0.73, 0.75) | 0.73 (0.72, 0.74) |
| F1-Score | 0.79 (0.78, 0.80) | 0.85 (0.84, 0.86) | 0.76 (0.74, 0.78) | 0.77 (0.76, 0.77) |
Table 4
Performance of the optimal combinations with different number of electrodes
| Number of electrodes | One | Two | Three | Four | Five | Six | Seven | Eight |
|---|---|---|---|---|---|---|---|---|
| Number of combinations | 8 | 28 | 56 | 70 | 56 | 8 | 8 | 1 |
| Optimal combination | 1 | 1-6 | 2-3-4 | 1-3-6-7 | 1-2-3-5-6 | 2-3-4-5-6-8 | 1-2-3-4-5-6-7 | 1-2-3-4-5-6-7-8 |
| Sen | 0.81 | 0.86 | 0.84 | 0.82 | 0.85 | 0.82 | 0.85 | 0.84 |
| Spe | 0.75 | 0.77 | 0.81 | 0.86 | 0.83 | 0.86 | 0.85 | 0.86 |
| PPV | 0.77 | 0.79 | 0.82 | 0.86 | 0.83 | 0.86 | 0.85 | 0.86 |
| NPV | 0.80 | 0.84 | 0.84 | 0.83 | 0.85 | 0.83 | 0.85 | 0.85 |
| ACC | 0.78 | 0.81 | 0.83 | 0.84 | 0.84 | 0.84 | 0.85 | 0.85 |
| AUC | 0.74 | 0.81 | 0.83 | 0.85 | 0.84 | 0.85 | 0.85 | 0.85 |
| F1-Score | 0.78 | 0.82 | 0.83 | 0.84 | 0.84 | 0.84 | 0.85 | 0.85 |
Table 3 summarizes the classification results of UC and non-UC with their 95% confidence intervals (CI). These results were obtained from the 8-electrode EHG signals. We deduced that SVM achieved the best recognition results. Table 4 shows the optimal combinations of the different number of electrodes and their classification performance using the optimal classifier SVM. The classification performance of one electrode, two electrodes and three electrodes were poor. In addition, more electrodes did not significantly improve the classification. The four-electrode combination used fewer electrodes but had a similar performance with the eight-electrode combination. The combination of 1-3-6-7 with four electrodes achieved better performance by overall consideration.
4.Discussion
This study proposed an efficient way to explore the best electrode combination to differentiate UCs and non-UCs. We established four popular classifiers to identify UCs and non-UCs. The optimal one among these four classifiers was determined by their performance. Using the optimal classifier, we achieved the best electrode combination for identifying UCs among the 255 combinations. This study facilitates us to decrease the number of electrodes and obtain necessary information for UC identification.
These four classifiers were selected because they have been applied to identify EHG signals in the previous studies, but have never been compared to the same dataset. The most popular EHG features were extracted to establish these classifiers. The comparison results indicated that SVM outperformed the other three classifiers with our EHG recordings. SVM is particularly applicable to small samples with high-dimensional features. DT is easy to overfit and ignore correlations between attributes. Its learning algorithms based on heuristics cannot guarantee to return the global optimum. There are some fundamental problems about BP ANN: the definition of the network size, the slow training process, and the local minimum. Besides, 1-D CNN was first applied to classify EHG signals in this study, but its performance is limited by the small sample set and parameter selection.
The characteristics of the EHG signal largely depend on the position of the recording electrode. Therefore, this study evaluated all possible electrode combinations. The optimal electrode combinations were voted by seven parameters. Covering the uterus, the electrode combination of 1-3-6-7 on the fundus, body, and cervix of the uterus was selected to reduce the number of electrodes, which also achieved better performance in recognition of UCs. In another study, the locations that provide higher accuracy for the classification of UCs from pregnancy and labour were similar to the positions of electrode 1 and electrode 3 in this study. The uterus’s median axis, where electrode 6 was placed, was found to be the best location for recording EHG signals [18]. The deviation of the electrode placement may be due to the uterus’ shape, position, and dimensions. We realized that the evaluation results depend heavily on the criteria, which may not be convincing with a single criterion. Therefore, the most commonly used evaluation parameters were summarized to obtain the overall results. Our study contributes to reducing the number of electrodes in clinical applications and facilitates long-term monitoring of UCs.
The limitation of the present work includes the manual segmentation of UCs and non-UCs with subjectivity. In the future, we will investigate the UC automatic recognition algorithm to improve identification accuracy.
5.Conclusion
The present study obtained the optimal classifier for recognition. The optimal electrode combination with fewer electrodes was achieved to improve the clinical application for long-term monitoring of uterine activities.
Conflict of interest
None to report.
Funding
This research was sponsored by the National Key Research and Development Program of China (2019YFC0119700), the National Natural Science Foundation of China (U20A20388), and the Beijing Science and Technology Project (Z161100000116005).
References
[1] | Norwitz ER, Robinson JN, Challis JR. The control of labor. New England Journal of Medicine. (1999) ; 341: (9): 660. |
[2] | Rabotti C, Mischi M, Van Laar JOEH, Oei GS, Bergmans JWM. Estimation of internal uterine pressure by joint amplitude and frequency analysis of electrohysterographic signals. Physiological Measurement. (2008) ; 29: (7): 829–841. |
[3] | Lucovnik M, Novak-Antolic Z, Garfield RE. Use of non-invasive uterine electromyography in the diagnosis of preterm labour. Facts, Views, Vision in ObGyn. (2012) ; 4: (1): 66–72. |
[4] | Barrie H-G, Sarmina H, Fadi G, Mirza S, Ommani J. Accuracy and reliability of uterine contraction identification using abdominal surface electrodes. Clinical Medicine Insights: Women’s Health. (2012) ; 5: (5): 65–75. |
[5] | Lucovnik M, Maner WL, Garfield RE. Accuracy of frequency-related parameters of the electrohysterogram for predicting preterm delivery. Obstetrical and Gynecological Survey. (2010) ; 65: (2): 141. |
[6] | Yiyao Y-L, Javier G-C, Gema P-B, José A-R, Alfredo P. Automatic identification of motion artifacts in ehg recording for robust analysis of uterine contractions. Computational and Mathematical Methods in Medicine. (2014) ; 11. |
[7] | Lemancewicz A, Borowska M, Ku P, Jasińska E, Laudański P, Laudański P, Laudański T, Oczeretko E. Early diagnosis of threatened premature labor by electrohysterographic recordings – the use of digital signal processing. Biocybernetics and Biomedical Engineering. (2016) ; 36: (1): 302–307. |
[8] | Alamedine D, Khalil M, Marque C. Channel combination selection for EHG bivariate analysis. Biomedical Engineering. IEEE, November 17, (2016) . |
[9] | Nafissa SA, Baya K, Hamza T, Malika KT. Relevant features selection for automatic prediction of preterm deliveries from pregnancy electrohysterograhic (ehg) records. Journal of Medical Systems. (2017) ; 41: (12). |
[10] | Acharya UR, Sudarshan VK, Rong SQ, Tan Z, Lim CM, Koh JE, Nayak S, Bhandary SV. Automated detection of premature delivery using empirical mode and wavelet packet decomposition techniques with uterine electromyogram signals. Computers in Biology and Medicine. (2017) ; 85: : 33–42. |
[11] | Paul F, Ibrahim I, Abir H, Chelsea D. Advanced artificial neural network classification for detecting preterm births using EHG records. Neurocomputing. (2016) ; 188: : 42–49. |
[12] | Hao D, Peng J, Wang Y, Liu J, Zhou X, Zheng D. Evaluation of convolutional neural network for recognizing uterine contractions with electrohysterogram. Computers in Biology and Medicine. (2019) ; 113. |
[13] | Peng J, Hao D, Liu H, Liu J, Zhou X, Zheng D. Preliminary study on the efficient electrohysterogram segments for recognizing uterine contractions with convolutional neural networks. BioMed Research International. (2019) ; 2019: : 9. |
[14] | B LCA, B HXA. Deep neural network for semi-automatic classification of term and preterm uterine recordings. Artificial Intelligence in Medicine. (2020) ; 105. |
[15] | Kiranyaz S, Ince T, Gabbouj M. Real-time patient-specific ecg classification by 1-d convolutional neural networks. IEEE Transactions on Biomedical Engineering. (2016) ; 63: (3): 664–675. |
[16] | Hao D, An Y, Qiao X, Qiu Q, Peng J. Development of electrohysterogram recording system for monitoring uterine contraction. Journal of Healthcare Engineering. (2019) ; 2019: : 1–9. |
[17] | Moslem B, Khalil M, Diab MO, Chkeir A, Marque C. Combining multiple support vector machines for boosting the classification accuracy of uterine EMG signals. 18th IEEE International Conference on Electronics, Circuits and Systems (ICECS). (2011) ; pp. 631–634. |
[18] | Alberola-Rubio J, Prats-Boluda G, Ye-Lin Y, Valero J, Perales A, Garcia-Casado J. Comparison of non-invasive electrohysterographic recording techniques for monitoring uterine dynamics. Medical Engineering & Physics. (2013) ; 35: (12): 1736–1743. |


