
HER2-ResNet: A HER2 classification method based on deep residual network
Abstract
BACKGROUND:
HER2 gene expression is one of the main reference indicators for breast cancer detection and treatment, and it is also an important target for tumor targeted therapy drug selection. Therefore, the correct detection and evaluation of HER2 gene expression has important value for clinical treatment of breast cancer.
OBJECTIVE:
The study goal is to better classify HER2 images.
METHODS:
For general convolution neural network, with the increase of network layers, over fitting phenomenon is often very serious, which requires setting the value of random descent ratio, and parameter adjustment is often time-consuming and laborious, so this paper uses residual network, with the increase of network layer, the accuracy will not be reduced.
RESULTS:
In this paper, a HER2 image classification algorithm based on improved residual network is proposed. Experimental results show that the proposed HER2 network has high accuracy in breast cancer assessment.
Conclusion:
Taking HER2 images in Stanford University database as experimental data, the accuracy of HER2 image automatic classification is improved through experiments. This method will help to reduce the detection intensity and improve the accuracy of HER2 image classification.
1.Introduction
Breast cancer is the most common cancer in women, known as the female killer [1]. The pathological morphology of breast cancer is complex, such as, there are more than two types in the same cancer tissue, even in the same section. For each type, the corresponding treatment and prognosis are different. Thus, the clinical treatment plan should be made according to the pathological type and histological grade. With development of high resolution digital scanners, the whole-slide image (WSI) that can convert entire glass slides at high magnifications are widely used. The WSIS allows extensive analysis of complex cell and protein characteristics through computer software.
The human epidermal growth factor receptor-2 (HER2) gene amplification or protein over expression exists in a considerable number of breast cancer patients, which is called HER2 positive breast cancer [2]. As an independent prognostic indicator, it plays a guiding role in the choice of treatment. In general cancer treatment, the existence of cancer cells depends on the mature pathological diagnostic criteria. Hematoxylin eosin (HE) staining is very mature for microscopic observation. The expression level of HER2 was generally determined by immunohisto-chemistry (IHC) or fluorescence in situ hybridization (FISH) [3]. Generally, samples are assigned different HER2 grades according to the degree and proportion of invasive cancer cell membrane staining. Based on the immunohistochemistry (IHC) examination theory for breast cancer evaluation [4], the HER2 scoring calculation are present as follows:
3
At present, the evaluation of HER2 grading still depends on manual calibration. However, the manual calibration depends on the medical experience of doctors, and it inevitably results to high work intensity. Nowadays, a few software methods have been proposed to assess HER2-stained images. Especially, classification algorithms for assessments of Her2 have gained researchers’ attention.
In the past years, by using machine learning method and computer to automatically diagnose various components in biomedical images, good results have been achieved. Some authors present a method of assessing IHC in breast cancer images [5]. There are four steps in this method, including region of interest (ROI) extraction, feature extraction, feature selection, and a SVM classifier. The classification accuracy of this experiment is 90.60%. Several classical and manual methods for automatic evaluation of HER2 pathological sections have been proposed [6, 8]. Most of these methods are threshold based methods, such as Choudhury uses the best threshold to evaluate the percentage and percentage of dyeing area [9]. An algorithm based on membrane connectivity is introduced, which can automatically specify HER2 state in tissue preselected slices [10]. The brown pixels were segmented, and each slide was scored with a skeletonized connecting membrane.
Recently, researchers have been very interested in the advanced method of deep learning. At present, there are many researches on HER2 classification, among which the deep learning technology does not need to set up the feature extractor manually, and through the construction of the deep neural network with multi-layer nonlinear transformation, the internal structure feature representation of the data is automatically learned from the input data. After years of development, deep learning technology has made great achievements in many fields, and for specific problems, there are more and more algorithms. So far, deep neural network has formed different models. Arevalo proposed a full connectivity layer structure using maxout activation function, and added it to the CNN model for automatic classification of breast imaging lesions [11]. The AUC of the model was improved from 0.787 to 0.822.
A deep learning algorithm HER2 classification using convolutional neural networks has been proposed [12]. A patch screening method based on clustering algorithm and CNN was proposed to select more discriminative patches [13]. The accuracy of the initial test set is 95%, the accuracy of the overall test set is 88.89%. A HER2 deep neural network based on deep learning was proposed to classify stained breast cancer images [14]. This network is classified by full connection layer and softmax layer. Convolution layer, maximum convergence layer, spatial pyramid convergence layer, deconvolution layer, upper sampling layer and trapezoidal long-term memory constitute the convolution and deconvolution parts of the framework. The experimental results show that the proposed HER2 network has high accuracy and wide applicability in breast cancer evaluation.
For general convolutional neural networks, the deeper the network structure, the better the effect of the network. But in the process of back-propagation, the gradient should be continuously propagated. With the deepening of network layers, the gradient will gradually disappear in the process of propagation, resulting in the failure to adjust the weight of the previous network layer effectively. We use residual networks to solve this problem. For the training data, we built a data generator to generate data in real time to solve the problem of large amount of data and insufficient memory. Each batch of content is fixed from the total data, forming the automatic classification model of this paper.
To sum up, in this paper we present a method that provides classification of HER2 using a deep neural network, called HER2-ResNet. To the best of our knowledge, this is the first study to perform HER2 classification using an architecture that inspired by convolution network and residual network. Due to the usage of residual block, a network with 38 layers is applied to assess HER2, and higher classification accuracy is obtained. This paper consists of the following parts. The next section describes the network architecture used in our experiments. In the third section, we compare HER2-ResNet with other methods. The fourth section summarizes the methods proposed in this paper.
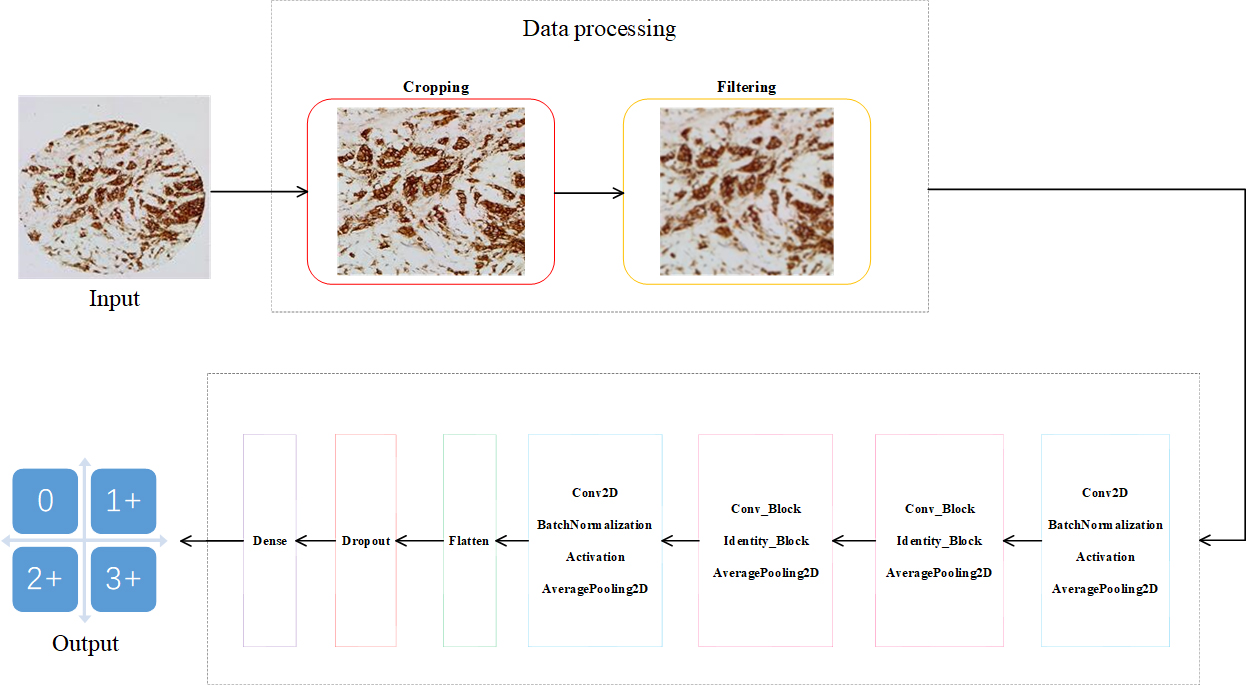
Figure 1.
Network structure.
2.Proposed method
2.1Network architecture
In this section, we designed HER2-ResNet to carry out the HER2 classification. The network contains 38 layers and six different blocks, as shown in Fig. 1. The details of these blocks are described as follows.
2.1.1Convolution + + +
In the applied network shown in Fig. 1 “Convolution
(1)
When
2.1.2Residual unit +
To avoid the gradient disappearing, we use “Residual unit
Figure 2.
Two residual units.
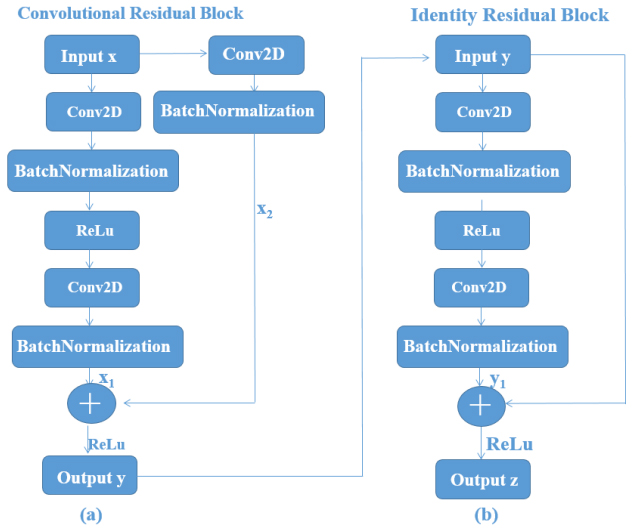
Figure 2 shows two different residual units: residual unit (Fig. 2a) with identity mapping and residual unit with convolution mapping (Fig. 2b). When the size of input and output is different, use Fig. 2a; when the input and output are the same size, use Fig. 2b. In the third block, 8 convolution filters with size 7
2.1.3Fully connected layer
The fully connected layer is used to transform multidimensional input data into one-dimensional output, which is often used to transition from the convolutional layer to the fully connected layer.
2.1.4Dropout layer
This layer randomly disconnects the input neurons every time the parameters are updated during training, and delete some layers with a certain probability. Its role is to prevent overfitting.
2.1.5Dense layer
It is to extract the association between the features after nonlinear changes, and finally map them to the output space. Finally, 512 inputs are transformed into four types of outputs.
2.2Training
In HER2-ResNet, the following cross-entropy loss function is used to train the whole network,
(2)
where,
In this learning model, the optimizer chooses the Adam optimizer [15, 16]. The training batch size was set to 30. The learning rate is set to 0.001 and the number of iterations is 1000.
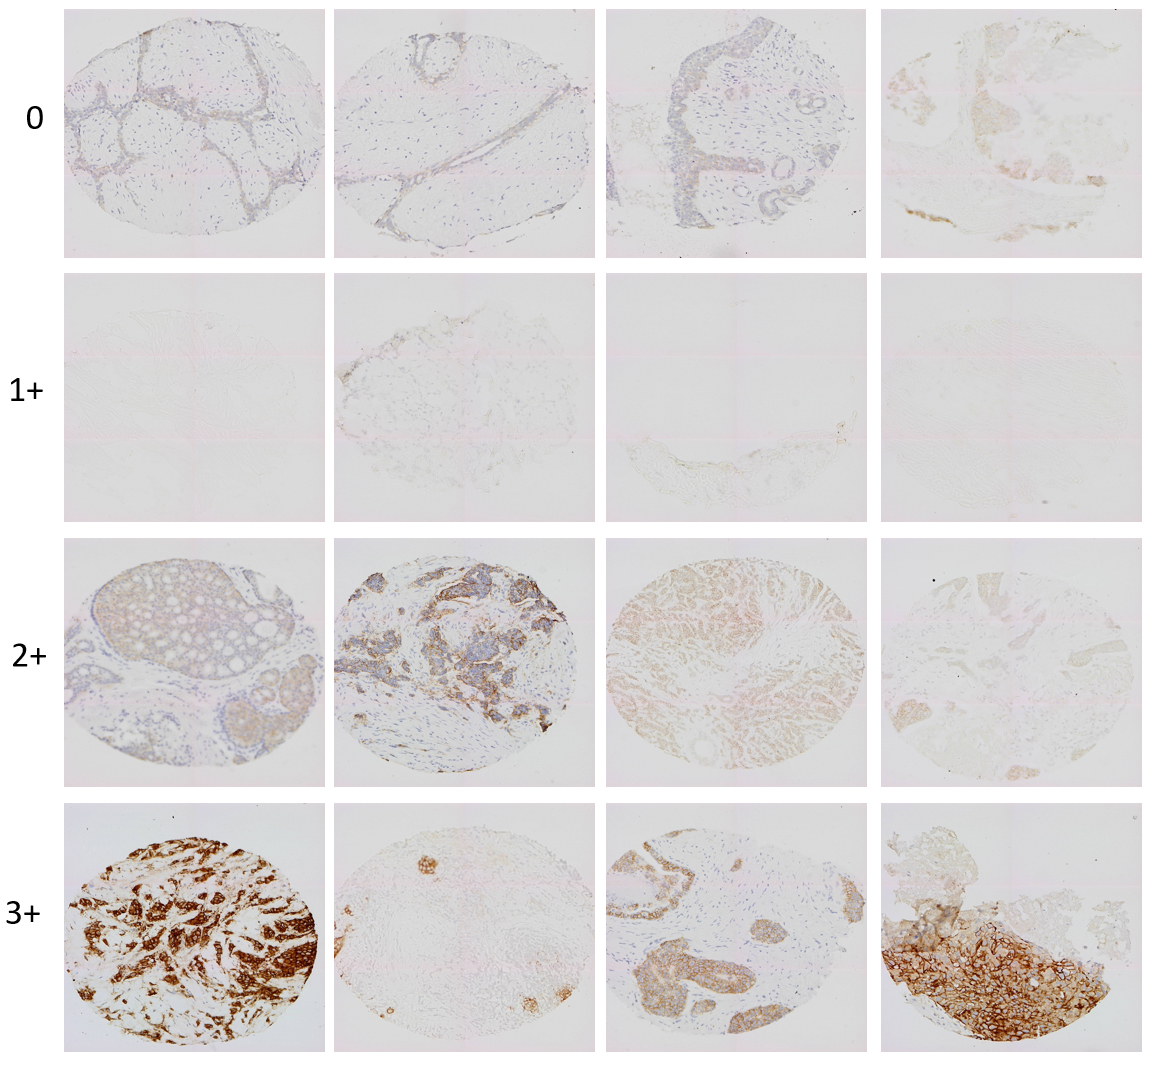
Figure 3.
Training data.
3.Experiments
3.1Database
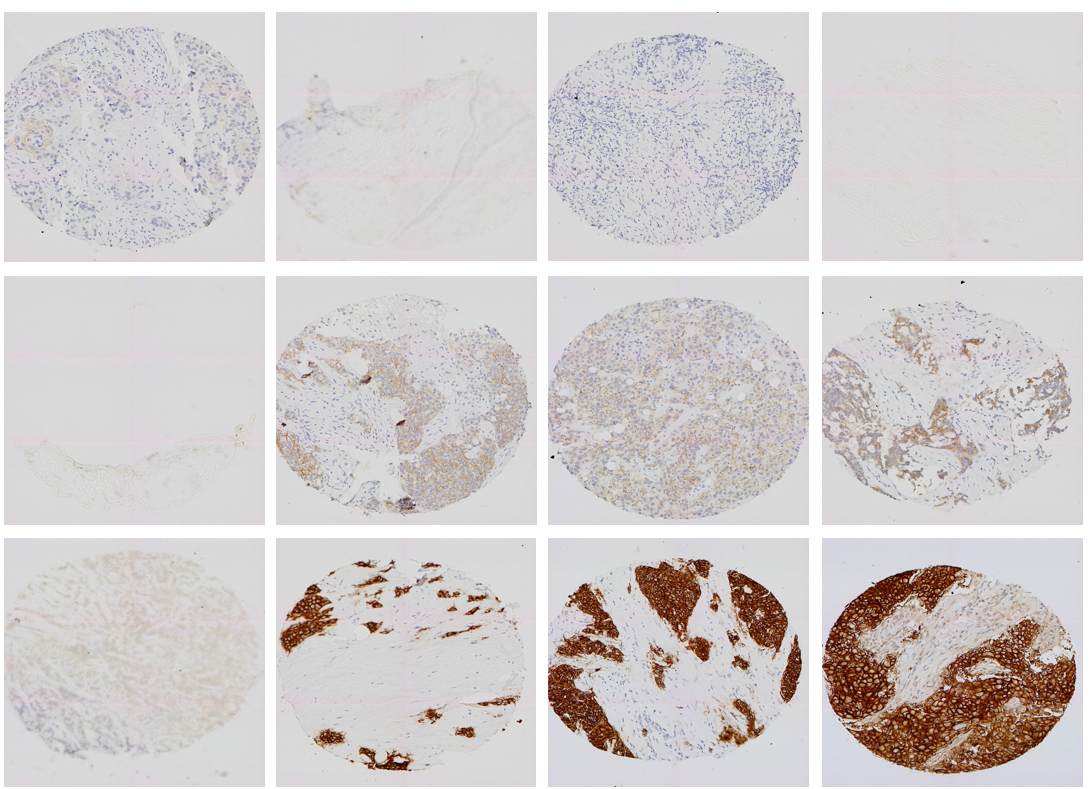
The training and validation data used in this section is downloaded from Stanford tissue microarray database (TMAD). There are a large amount of original data, normalized data and corresponding image files in the database. As of July 2007, TMAD has included 205161 images, 349 different probes on 1488 tissue microarray slides have been archived in the database, and 31306 images of 68 probes on 125 slides have also been disclosed. In our study, we used 334 WSIs to divide the dataset into subsections, training (300 WSIs) and testing (34 WSIs). The training set is used for autonomous learning of the model, while the test set is used to test the quality of the model after the model training is completed. About 3000 images were cropped (using MATLAB imcrop function) from the 334 WSIs, 400 of which were used as testing sets and the rest as training sets. Four kinds of pictures of training data some pictures of testing data are shown in Figs 3 and 4, respectively.
Figure 4.
Testing data.
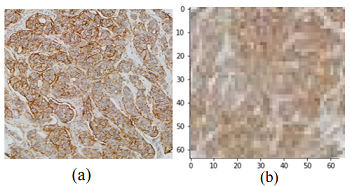
After cropping, the dataset needs to be preprocessed. Due to the large size of the image itself, it will have a bad impact on the recognition process of the computer. Therefore, we need to use the PIL library to adjust the size of the target image and make it more suitable for the network proposed in this paper. The methods are as follows:
1. Firstly, we introduce PIL database and confirm the storage path of HER2 data set after adjustment.
2. The image is scaled to 64
3. The following figure clearly shows the difference before and after the adjustment. The picture before adjustment is shown in Fig. 5a. View the adjusted dataset on the jupyter notebook, as shown in Fig. 5b.
Figure 5.
Original-picture and adjustment-picture.
3.2Building a data generator
In this subsection, we described how to read data. We set up a data generator to generate data in real time, solve the problem of large amount of data and insufficient memory, and then train the model better.
First, we get the score label value, and deal it with the following steps: (1) convert it into a column, (2) convert the above column of data into an array form through array, (3) convert the array to a binary (only 0 and 1) matrix. The original class vector is transformed into the form of single hot coding. Because classifiers are not good at processing attribute data, One-hot coding is used to solve this problem, it also plays a role in extending features to a certain extent. Its values are only 0 and 1, and different types are stored in the vertical space.
To avoid running out of memory, a data generator is introduced to generate data in real time for training the model.
1. For establishing the generator, we first initialize the class, (1) set up a list that stores the file names of all training sets; (2) mark the data type of the classification information of the recorded pictures; (3) record the size of the training samples generated in each batch; (4) use shuffle to randomly sort all elements in the sequence. If the parameter is true, the training data will be randomly shuffled, which is generally true by default.
2. Use the Rounding function to return the smallest integer greater than or equal to a given number. Divide the length of the list of all training data by the size of each batch of training data to get the total number of batches of data generated, which is the length of the data generator.
3. Use the getitem function (keras library in Python) to return the value associated with the specified index. Generally, if you need to use the index to access elements, you can define this method in the class. First generate batch size indexes, then get the data in the data collection according to the index, and finally return the processed data every time we need.
4. In the training process, use the callback function to be automatically executed at the end of each epoch. The meaning of this function is to randomly shuffle the index order to facilitate the next batch of training data. Shuffle determines whether to scramble the data during data generation. Returns an array of the specified shape, where the array elements are randomly generated data. Finally, a file name is given, data is generated, and the picture is normalized.
3.3Experimental results
In this subsection, in order to verify the effectiveness of the proposed HER2-ResNet method, we compare it with the SVM, VGG and AlexNet methods. The experimental results show that the proposed method inspired by convolution network and residual network is better.
As an important hyper-parameter in the network training, when and whether the loss function converges to the local minimum is determined by the learning rate. A proper learning rate can make the loss function converge to the local minimum in a proper time. During the training, at the end of each iteration, if the loss value is reduced compared with the previous iteration, the learning rate can be slightly increased. If the loss value is increased compared with the previous iteration, the optimal value may be missed. Thus, the learning rate should be reset with a smaller value. In Fig. 6, we show the loss value and accuracy rate under three different cases. If LR (Learning Rate) is set to 0.01, after 1000 iterations, the loss value of loss is 12.1054, and the accuracy rate is 0.1927. When LR
Figure 6.
Changes in accuracy and loss.
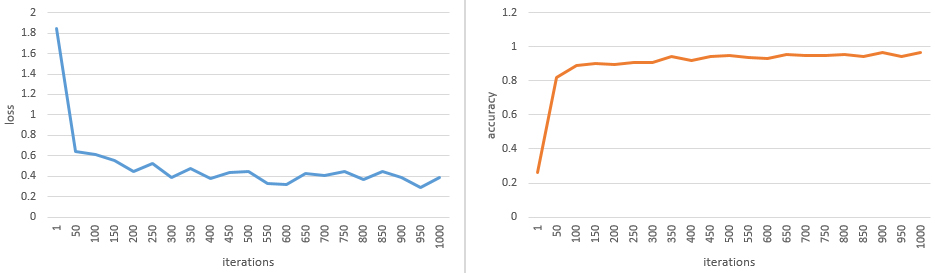
Figure 7.
The output of the network. The first column shows the category of the corresponding HER2 image presented in the second column (a), the output of the first block is shown in the third column (b), the output of the fourth block is shown in the forth column (c).
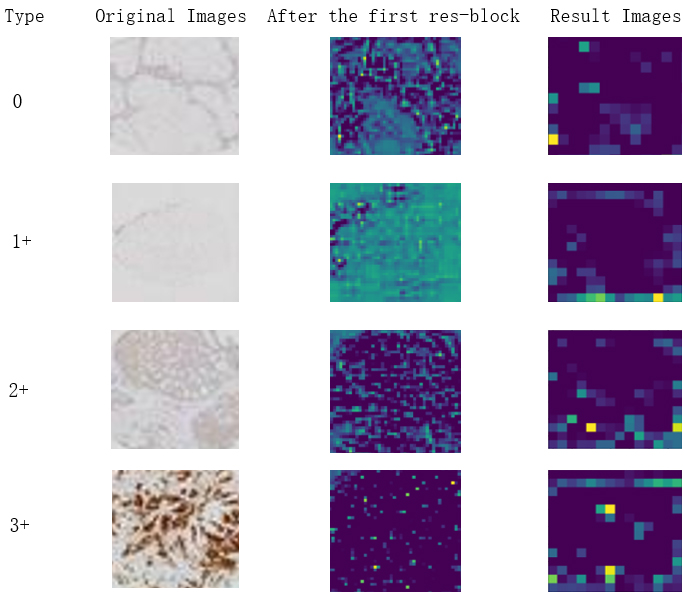
Table 1
Accuracy comparison
| Approach | HER2 grading | Accuracy | Comprehensive accuracy |
|---|---|---|---|
| HER2-ResNet | 0 | 0.94 | 0.93 |
| 1 | 0.93 | ||
| 2 | 0.90 | ||
| 3 | 0.95 | ||
| SVM | 0 | 0.91 | 0.90 |
| 1 | 0.88 | ||
| 2 | 0.89 | ||
| 3 | 0.93 | ||
| AlexNet | 0 | 0.89 | 0.89 |
| 1 | 0.92 | ||
| 2 | 0.82 | ||
| 3 | 0.93 | ||
| VGG16 | 0 | 0.82 | 0.75 |
| 1 | 0.73 | ||
| 2 | 0.69 | ||
| 3 | 0.76 |
Figure 8.
Comparison with different evaluation indicators.
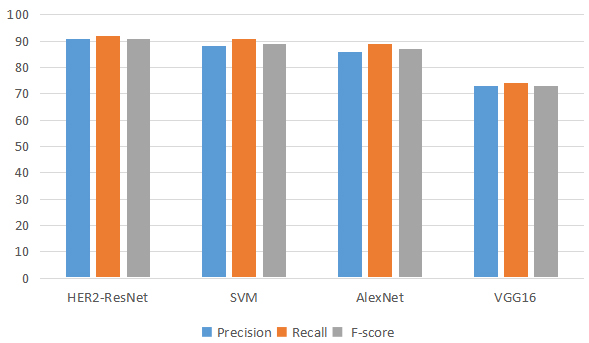
We compare the proposed HER2-ResNet method with traditional machine learning and other deep learning methods, such as SVM (traditional machine learning method), VGG16 and AlexNet. The classification results corresponding to different methods are presented in Table 1. Table 1 gives the accuracy comparison of the HER2-ResNet, SVM, VGG16 and AlexNet methods. It can be seen from the Table 1 that the accuracy of 0 and 3
4.Conclusion
In order to effectively complete HER2 classification, we use deep learning technology to achieve. This article optimizes and improves the classic convolutional neural network model in deep learning technology. In depth learning, the deeper the network structure, the better the effect of the network. In the process of back propagation, the neural network needs to continuously propagate the gradient. With the deepening of network layers, the gradient will gradually disappear in the process of propagation, resulting in the failure to effectively adjust the weight of the previous network layer. Based on the above analysis, we proposed a network inspired by convolutional neural network and residual network, called HER2-ResNet. And the final classification effect is also very good. Compared with the previous network, the accuracy is slightly improved.
Acknowledgments
This work is supported by the National Key Research and Development Project (No. 2019YFB1404701 and No. 2019YFB1404700), the National Natural Science Foundation of China (No. 61802213), the Natural Science Foundation of Shandong Province (Nos ZR2018LF004 and ZR2020MF039), the Major Science and Technology Innovation Projects of Key R&D Programs of Shandong Province in 2019 (Development and Industrialization of Pathological Artifificial Intelligence Application Software, No. 2019JZZY010108), and the Qilu University of Technology (Shandong Academy of Sciences) Young doctor Cooperation Fund Project (No. 2019BSHZ009).
Conflict of interest
None to report.
References
[1] | Desantis CE, Ma J, Sauer AG, Newman LA and Jemal A, Breast cancer statistics, 2017, racial disparity in mortality by state. CA: A Cancer Journal for Clinicians. (2017) ; 67: (6): 439-448. |
[2] | Wu D, Jia HY, Wei N and Li SJ, POU4F1 confers trastuzumab resistance in HER2-positive breast cancer through regulating ERK1/2 signaling pathway. Biochemical and Biophysical Research Communications. (2010) ; 533: (3): 533-539. |
[3] | Yi ES, Boland JM, Maleszewski JJ, Roden AC, Oliveira AM, Aubry MC, Erickson-Johnson MR, Caron BL, Li Y and Tang H, Correlation of ihc and fish for alk gene rearrangement in non-small cell lung carcinoma: ihc score algorithm for fish. Journal of Thoracic Oncology. (2011) ; 459-465. |
[4] | Wolff AC, Hammond MEH, Allison KH, Harvey BE, Mangu PB, Bartlett JMS, Bilous M, Ellis IO, Fitzgibbons P, Hanna W, Jenkins RB, Press MF, Spears PA, Vance GH, Viale G, McShane LM and Dowsett M, Human epidermal growth factor receptor 2 testing in breast cancer: American society of clinical oncology/college of american pathologists clinical practice guideline focused update. Journal of Clinical Oncology. (2018) ; 36: (20): 2105-2122. |
[5] | Chang CY, Huang YC and Ko CC, Automatic analysis of her-2/neu immunohistochemistry in breast cancer. (2012) ; 297-300. |
[6] | Qaiser T, Sirinukunwattana K, Nakane K, Tsang YW, Epstein D and Rajpoot N, Persistent homology for fast tumor segmentation in whole slide histology images. Procedia Computer Science. (2016) ; 90: : 119-124. |
[7] | Akbar S, Jordan LB, Purdie CA, Thompson AM and McKenna SJ, Comparing computer-generated and pathologist-generated tumour segmentations for immunohistochemical scoring of breast tissue microarrays. British Journal of Cancer. (2015) ; 113: (7): 1075-1080. |
[8] | Khan AM, Mohammed AF, Al-Hajri SA, Shamari HMA, Qidwai U, Mujeeb I and Rajpoot NM, A novel system for scoring of hormone receptors in breast cancer histopathology slides. Middle East Conference on Biomedical Engineering. (2014) ; 155-158. |
[9] | Choudhury KR, Yagle KJ, Swanson PE, Krohn KA and Rajendran JG, A robust automated measure of average antibody staining in immunohistochemistry images. Journal of Histochemistry & Cytochemistry. (2010) ; 58: : 95-107. |
[10] | Holten-Rossing H, Talman MLM, Kristensson M and Vainer B, Optimizing HER2; assessment in breast cancer: application of automated image analysis. Breast Cancer Research and Treatment. (2015) ; 152: (2): 367-375. |
[11] | Arevalo J, Gonzalez FA, Ramos-Pollan R, Oliveira JL and Guevara Lopez MA, Representation learning for mammography mass lesion classification with convolutional neural networks. Computer Methods and Programs in Biomedicine. (2016) ; 127: : 248-257. |
[12] | Singh P and Mukundan R, A Robust HER2 Neural Network Classification Algorithm Using Biomarker-Specific Feature Descriptors. IEEE International Workshop on Multimedia Signal Processing. (2018) ; 1-5. |
[13] | Li Y, Wu J and Wu Q, Classification of breast cancer histology images using multi-size and discriminative patches based on deep learning. IEEE ACCESS. (2019) ; 7: : 21400-21408. |
[14] | Saha M and Chakraborty C, Her2Net: A deep framework for semantic segmentation and classification of cell membranes and nuclei in breast cancer evaluation. IEEE Transactions on Image Processing. (2018) ; 27: (5): 2189-2200. |
[15] | Zhou Y, Zhang M, Zhu J, Zheng R and Wu Q, A randomized block-coordinate adam online learning optimization algorithm. Neural Computing and Applications. (2020) ; 32: (16): 12671-12684. |
[16] | Zou F, Shen L, Jie Z, et al., A Sufficient Condition for Convergences of Adam and RMSProp. 2019 IEEE/CVF Conference on Computer Vision and Pattern Recognition (CVPR). IEEE, (2019) . |


