
Deep learning-based breast region extraction of mammographic images combining pre-processing methods and semantic segmentation supported by Deeplab v3+
Abstract
BACKGROUND:
Breast cancer has long been one of the major global life-threatening illnesses among women. Surgery and adjuvant therapy, coupled with early detection, could save many lives. This underscores the importance of mammography, a cost-effective and accurate method for early detection. Due to the poor contrast, noise and artifacts which results in difficulty for radiologists to diagnose, Computer-Aided Diagnosis (CAD) systems are hence developed. The extraction of breast region is a fundamental and crucial preparation step for further development of CAD systems.
OBJECTIVE:
The proposed method aims to extract breast region accurately from mammographic images where noise is suppressed, contrast is enhanced and pectoral muscle region is removed.
METHODS:
This paper presents a new deep learning-based breast region extraction method that combines pre-processing methods containing noise suppression using median filter, contrast enhancement using CLAHE and semantic segmentation using Deeplab v3
RESULTS:
The method is trained and evaluated on mini-MIAS dataset. It has also been evaluated on INbreast dataset. The results outperform those generated by other recent researches and are indicative of the capacity of the model to retain its accuracy and runtime advantage across different databases with different image resolutions.
CONCLUSIONS:
The proposed method shows state-of-the-art performance at extracting breast region from mammographic images. Wide range of evaluation on two commonly used mammography datasets proves the ability and adaptability of the method.
1.Introduction
Breast cancer is a globally-significant disease most commonly found in women. The proportion of breast cancer in relation to other cancers in women has increased to 25.2% in recent years [1]. The exact causes and progression of breast cancer are unknown, but the annual rise in incidence has resulted in it now being a leading cause of death among women. In China, the annual incidence of breast cancer is increasing rapidly. There were 367,900 registered cases of China in 2018, making up a total of 19.2% of all female cancers that year [2]. This can be compared to a registered incidence of 268,600 in 2015, making up a total of 15.1% of all female cancers [3]. However, only 13% of the cases are included in the national cancer registries [4], which makes a particularly urgent need for improvements in the diagnosis and treatment of breast cancer in China.
So long as the cases are accurately diagnosed in their early stages, breast cancer can be cured by surgery and adjuvant therapy, although some of the cases still result in mortality [5]. Mammography is considered to be one of the most effective and important methods for early breast cancer detection. It has been verified as a reliable and essential screening technique by obtaining visual images of the internal structure of breasts using a low energy procedure [6]. However, examining large numbers of mammographic images manually takes time and there is an error rate of between 10% and 30% due to human factors such as “experience, specialization and number of mammograms read per year” [7], with the latter being the most significant. In view of this, computer-aided detection and diagnosis (CAD) systems have the advantage of using standardized operations and building upon a body of experience that is typically more extensive than any individual radiologist can achieve. This has led to the widespread development of computer-based supports [8, 9, 10, 11].
Mammographic images inevitably capture both the breast region and the non-breast region. As a result, there are always background elements, especially those associated with the pectoral muscle region. Both of these regions may contain prenoise, such as the labels used by radiologists to identify certain features and patient information [12], noise (such as salt and pepper noise, gaussian noise, speckling and Poisson noise) and artifacts that can influence the performance of a CAD system [13]. The areas of poor contrast, high and low intensity and the mix of regular or irregular shapes in the pectoral muscle region and around the labels can also confuse CAD systems [14]. A variety of preprocessing methods have therefore been proposed to improve the quality of mammograms, so that they can be processed more accurately [15, 16].
This paper presents a new breast region extraction method which combines pre-processing methods and deep learning-based semantic segmentation. Not only is the method able to overcome the challenges mentioned above, but it also returns the accurate breast region which is treated as region of interest (ROI) for further steps of development of CAD systems. For many researches such as breast cancer detection and breast cancer risk prediction, the breast region part can be the fundamental but crucial ROI as the input (i.e. [17]). For CAD systems, they also need to reduce the amount of calculation of the image without losing essential information (i.e. breast region) and exclude the background in the following processing steps by identifying breast border, pectoral muscle which may disturb performance of breast cancer detection. Accuracy and runtime are also taken into consideration to improve the accuracy of the overall CAD system [18]. The method starts from pre-processing step with transforming the images into a format required by the deep learning model, then a non-linear median filter is used to remove noise and artifacts. A Contrast Limited Adaptive Histogram Equalization (CLAHE) algorithm is then used to enhance the contrast in the images, thereby improving the distinction between the breast region, the pectoral muscle and the background when moving on to the next phase. Semantic segmentation step contains feature extraction and prediction implemented by applying a convolutional deep learning technique (Deeplab v3
The paper is organized as follows. Section 2 provides a brief outline of the related works, including some recent research as well as methods applied in the proposed method, and the proposed extraction method is presented. An experimental application of the proposed method and its results are presented and discussed in Section 3. Section 4 gives the conclusion and outlook.
2.Related works and proposed method
This section contains mainly two components. Section 2.1 includes several previous researches related to this method and Section 2.2 introduces the proposed method. In Section 2.1.1 some traditional pre-processing methods are mentioned with some recent researches which apply series of algorithms to achieve the objective of pre-processing and breast region extraction. Discussion of advantages and drawbacks will then be given. The development of deep learning and its role in medical image segmentation especially breast mammographic image will be introduced in Section 2.1.2, as well as some researches applying deep learning models. Finally, a contribution of the proposed method is presented.
2.1Related works
2.1.1Traditional pre-processing methods
Pre-processing is an important process in mammographic images, and noise suppression is one of the fundamental operations. Median filter is widely used in medical images. It is effectively a non-linear filter that works well for grayscale images. As well as suppressing speckles and salt and pepper noise, a median filter also preserves the image contours, which is important in this context for being able to adequately distinguish between the pectoral muscle and the breast region. A median filter is a particular kind of low-pass filter. It takes all the pixel values for a designated area within an image and enters them in an element array. The element array is then sorted to arrive at the median value. All the median values for all the element arrays established for all the pixels are then output as an image array. The median filter is applied iteratively until the whole image has been treated. Mammograms have poor levels of contrast and are blurred, which can make them difficult to interpret. Contrast enhancement emphasizes specific regions, thus assisting the next step of segmentation. As in some studies [21, 22, 23], a CLAHE algorithm is applied [24]. It extends upon Adaptive Histogram Equalization (AHE) algorithms by allowing the manual setting of the height of a histogram, which is called the clip limit. The value of the limit is from 0 to 1 and it enables more refined enhancement calculations [21]. Basically, the higher the clip limit, the greater the contrast. Usually, the value for this is set to 0.01 by default. The CLAHE algorithm operates on small pieces of the whole image. The overall image is divided up into blocks called tiles. The contrast transformation function is calculated on each tile so that the contrast is enhanced on each tile. This is based on an approximation that takes both the histogram specified by the distribution value and the specific histogram of the tile into account. The objective is to enhance the contrast for each tile until it more or less matches the overall distribution and desired shape for the histogram. Once the clip limit has been set and the histograms have been redistributed, the transformation function is applied. It works upon a probability density function of the input mammogram’s grayscale value and the total number of pixels in the image. Each of the tiles is combined with one another using bilinear interpolation, which gets rid of any artificially-induced boundaries. The contrast in homogenous areas is limited so as to minimize the risk of amplifying any noise and to reduce any potential shadows at the edges.
Median-filter and CLAHE are widely used in some recent related researches. With regard to the preprocessing of digital mammograms, Lbachir et al. developed a method for handling several of the key steps necessary for the preprocessing of mammograms for CAD systems [25]. They applied a median filter to reduce the salt and pepper noise and a mean filter to deal with false contours produced by the initial noise suppression. Then a CLAHE algorithm was applied. After that artifact removal and label suppression were implemented by applying thresholding and morphological operations. Finally, an active contours method was applied for pectoral muscle suppression. This method was tested on the mini-MIAS database and achieved an accuracy of 98.75%. Basheer et al. [26] have presented a method that first of all flips all the right breast images so that all images are effectively left breast images. Then a thresholding method and an average filter are applied to remove noise and artifacts. For the purposes of pectoral muscle segmentation, a piecewise method is adopted that aims to find the threshold values and find the mid-point between them by comparing and calculating the average values. Finally, translation and rotation are applied to achieve mammogram alignment. The method was tested on the mini-MIAS database and achieved an accuracy of 100% for the removal of noise and labels. The removal of artifacts obtained an accuracy of 99.68%, the pectoral muscle extraction, 92.85%, and the mammogram alignment, 100%. Somewhat similarly, Maitra et al. [21] applied a preprocessing method to the mini-MIAS database that first transformed all images to the same orientation. Then, a CLAHE algorithm was applied for contrast enhancement. Finally, a seeded region growing (SRG) method was applied to achieve image segmentation and identify the pectoral muscles, so that they could be suppressed. This method achieved an accuracy of 95.71%. Adopting a different approach, Bae et al. [27] have proposed a method that focuses on pectoral muscle detection. The artifacts are first removed by applying a labeling algorithm. Then, a median filter is used for noise removal and the CLAHE algorithm is used for contrast enhancement. The detection of candidate pectoral muscle is then achieved by correcting the given image using brightness weights and pectoral muscle edge detection. This results in a candidate contour. The final step is the actual pectoral muscle detection. Here, Hough transformation is used to detect edges and lines within the image. Missing lines are then filled in by connecting lines with similar angles. The pectoral muscle detection is then achieved by applying the RANSAC (random sample consensus) method. This approach produced results with a 92.2% accuracy when applied to the mini-MIAS database.
From the researches above, it can be concluded that noise suppression, artifact and label removal and pectoral muscle suppression are the common ways of implementing pre-processing methods. Through several steps of removing these unnecessary parts, the breast region is naturally extracted. Although traditional methods have reached ideal results such as accuracy, there are still drawbacks. Most of them are time consuming so that majority of the methods cannot be used for real-time operation. Some of the methods (i.e. [21, 26]) have to normalize images by flipping them to face the same direction so as to proceed further operations, which lacks in robustness.
2.1.2Deep learning based semantic segmentation
As the information contained in a mammogram image relates to the breast and pectoral muscle regions, suppressing the pectoral muscle information and enabling segmentation of the regions can be key for the effective use of a mammogram by CAD systems. Clearly, the breast region contains most of the salient detail, so a great deal of research effort has been devoted to effectively bringing the breast information to the fore [23, 29, 30]. Semantic segmentation is usually applied once features are identified. For computer vision systems to accomplish this, it is necessary to undertake classification at the pixel level. This should lead to several groups that each contain all the pixels belonging to one specific category. The Texton Forest method and classifiers based on random forest algorithms were typically used to accomplish this before the widespread adoption of deep learning techniques [31, 32]. After the notable success of Fully Convolutional Network (FCN) models in relation to semantic segmentation [33, 34], there was a move towards using end-to-end convolutional deep learning models instead [35, 36].
Deep learning approaches are increasingly being used throughout medical image processing, not only for mammograms but also for tomosynthesis and ultrasound-based imaging [37]. In the vast majority of cases, some kind of convolutional neural network (CNN) forms the basis of the approach. CNNs are made up of input and output layers with multiple hidden layers in-between that are typically convolutional layers, meaning that they convolve upon the application of some kind of mathematical function. In image processing they can use the convolved layers to learn weights or biases that enable them to assign different degrees of importance to different aspects of an image and to differentiate between them. The first application of a CNN to mammography was by Sahiner et al. in 1996 [38]. Since then, a diverse range of variations upon the basic idea of a CNN have been applied, including a four-layer Adaptive Deconvolution Network (ADM), which was an early kind of CNN used for mass classification [39], the addition of support vector machines (SVMs) for classification [28, 40, 41, 42], modified region proposal CNNs (R-CNNs) [35, 43], combinations of CNN and a stacked autoencoder (CNN-SAE) [44], combining CNN mass detection with extreme learning machine (ELM) clustering [45], the use of a full resolution convolutional network (FrCN) for segmentation before applying a CNN [46, 47], or even a combination of several different kinds of CNNs [48, 49, 50]. To some extent, these variations are the result of what aspect of a mammogram is being focused upon and its perceived utility. Thus, some studies are interested in providing information about variations in breast density [40, 44]. Some want to identify and pinpoint masses [35, 43, 45, 51, 52, 53, 54]. Some are interested in classifying lesions [55]. Some want to facilitate tissue classification [56]. Others want to classify the risk of developing cancer [57, 58] and some are focused on a combination of these various things [59]. One of the key distinctions between various approaches is the approach taken to training the network. In some instances, a pretrained network is used, where the network has already been trained using data from an established database [40, 51, 59], such as ImageNet-1k [60]. Some approaches use fully supervised methods, which explicitly use models to map between different examples and variables, typically to solve classification or regression problems. Others are only semi-supervised [53], making use of a mixture of labelled and unlabeled examples, or weakly supervised [54] making use of data where the labelling is somehow noisy or imprecise. Some studies have adopted an unsupervised strategy, where a model is not used to map to variables but rather to perform operations directly upon the input [44, 45]. These kinds of studies are typically focused on objectives such as clustering or estimating density. At the opposite end of the scale, some networks are hand-crafted, where experts specifically define the features as opposed to them being learned automatically [48, 55].
A number of deep learning approaches have recently begun to be developed that have the capacity to overcome the above issues by taking original images as input, automatically extracting their various features and then learning directly from their individual pixels [28]. They are also associated with improving training precision [61]. A common feature of different deep learning approaches is to convert the original mammograms to a representation of their features across a number of layers, upon which different filters or operations can be applied [28]. Rodriguez-Ruiz et al. [62] have presented a deep learning method that is chiefly focused on pectoral muscle segmentation. The central feature of the method is an automatic model based on a u-net architecture, which is a convolutional network. The u-net architecture is principally an encoder-decoder system. This is highly effective for biomedical image segmentation [63]. The method was tested on 125 images of three different types which are digital breast tomosynthesis (DBT), synthetic mammography (SM) and digital mammography (DM). The results indicated a dice similarity coefficient (DSC) of between 0.947 and 0.970.
There are also some methods developed to solve challenges other than mammogram images. For development of identifying, segmenting and classifying cell membranes and nuclei from human epidermal growth factor receptor-2 (HER2), Saha et al. present a deep learning framework constructed by mainly convolution and deconvolution part [64]. They apply long short-term memory (LSTM) which is a special RNN architecture to help identify and preserve features (i.e. cellular and textural structures) from convolution part then transit to deconvolution part. LSTM is special in avoiding gradient loss or gradient explosion and widely used in speech recognition and handwriting recognition. They use 51 and 28 WSIs from the database of an online HER2 image database of the Department of Computer Science, University of Warwick, United Kingdom, for training and evaluating. The input size of each image is 251*251, They report the effect of the method at precision of 96.64%, recall of 96.79%, f-score of 96.71%, NPV of 93.08%, accuracy of 98.33%, false positive rate (FPR) of 6.84% and AUC of 94%. The authors state that the proposed method is a supplement of research on segmentation and performance measurement of cell membranes and nuclei.
Saha et al. present a deep neural network structured by an encoder, a decoder and a scoring system which is actually a two-stage network [65]. The encoder and decoder part inspired by U-net and Segnet accomplish the goal of segmentation, and the scoring layer is responsible for scoring of ER and PR using IHC images. They use a private database containing 600 images with a size of 2048*1536 which are divided into 100*100 at every batch. A proportion of 65% and 35% for training and evaluating with no overlap existing ensures the number of samples for each process. The batch size of training and evaluating is set to 28, the testing interval is 4500, the maximum iteration is 500,000, the learning rate is 0.01, the weight decay is 0.045 and the momentum is 0.9. The optimizer is stochastic gradient descent (SGD). They achieve the performance of the method at a precision of 95.87%, recall of 95.64%, f-score of 96.49%, NPV of 92.13%, accuracy of 94.53%, AUC of 96% and higher scores than pathologists. The authors claim the proposed method is a valuable supplement of existing ER and PR scoring.
Both of the research above demonstrates the improvement of segmentation using well designed deep learning models, some additional scoring layers give additional evaluation of specific issues. However, the situation of breast extraction in mammogram images is different. Instead of segmenting multiple cells in one image, there is usually one large complete area which needs to extract. This may result in the lack of usefulness of scoring systems which originally work effectively. The need of dividing pectoral muscle from the biggest high gray level areas may demand deeper layers of the model, different levels of features and larger receptive field. Nonetheless, the research above proved the successful apply of deep learning.
One of the goals when using deep learning approaches is to be able to arrive at results that can match, or even exceed human performance, though only a few come near to this at present (i.e. [52]). The accuracy associated with deep learning approaches is variable, ranging from 64% [41], which is only marginally better than conventional CAD-based results to 99% [46, 47]. Semantic segmentation is strongly associated with achieving better results but the use of semantic segmentation is also varied. A notable move towards trying to accentuate the importance of semantic segmentation came with the work of Kisilev et al. [43] where they attempted to apply semantic segmentation in relation to the descriptors commonly used in mammography, i.e. shape, margin and density. Some recent approaches have moved away from conventional CNNs towards other deep learning models, such as conditional generative adversarial networks (cGANs) [66], which can speed up the process by avoiding the need for pixel or patch-based classification, but it is not clear that these achieve any greater degrees of accuracy than the conventional methods. Most recently, the state-of-the-art has moved towards building upon fully convolutional networks (FCNs) by using u-net architectures, using instance segmentation networks and end-to-end convolutional networks, such as DeepLab and Mask RCNN, which promise to offer especially high levels of accuracy [67, 68].
Whilst the capacity of deep learning to improve upon previous approaches to segmentation is clear, there are several problems that have been identified with adopting deep learning approaches that have yet to be fully overcome. One of the main challenges is that the training data is key to the effectiveness of deep learning, so very large training datasets significantly improve the results [61]. However, large public datasets of mammograms are not currently available so most researchers are obliged to still turn to older scanned datasets such as mini-MIAS [37, 69]. This has driven research to using various degrees of supervision [53, 54], transfer learning [59, 70], or the handcrafting of features [48, 52]. Many projects adopt a two-stage process where the first stage involves the detection of candidate lesions before passing potentially malignant results to a deep CNN [52, 69]. Another way around the problem is to avoid a cascaded CNN by using region proposal networks (R-CNNs) [35, 43]. Nonetheless, on the rare occasions that very large proprietary datasets rather than public ones have been made available to certain teams, the results have been far superior [69]. Another noted issue is the degree of complexity and thus greater computational and time-related costs associated with the use of deep learning approaches [46]. With hand-crafting and varying degrees of supervision also being a vital aspect of the training for most methods, there is also an ongoing issue or sourcing the relevant knowledge and the time and cost involved in making it available. Some approaches have also been criticized for being overly-dependent upon subjective criteria such as grayscale intensity [42, 61].
In this study, a DeepLab v3
The main contribution of this paper is shown as follows. The setting of weights for each class help fine-tune the pre-trained Deeplab model which achieved better convergence during training process, so as to accomplish the model with a very small size of mammogram dataset. The input images are processed by proper pre-processing methods, which help improve the performance of the method. Considering the situation of limited samples of mammogram images publicly available, the state-of-the-art performance of the method indicates success of fine-tuning pre-trained networks which is a supplement and improvement of existing methods. The low false positive rate and runtime also strongly recommend a clinical attempt and a fundamental step of further development of CAD systems.
2.2Proposed method
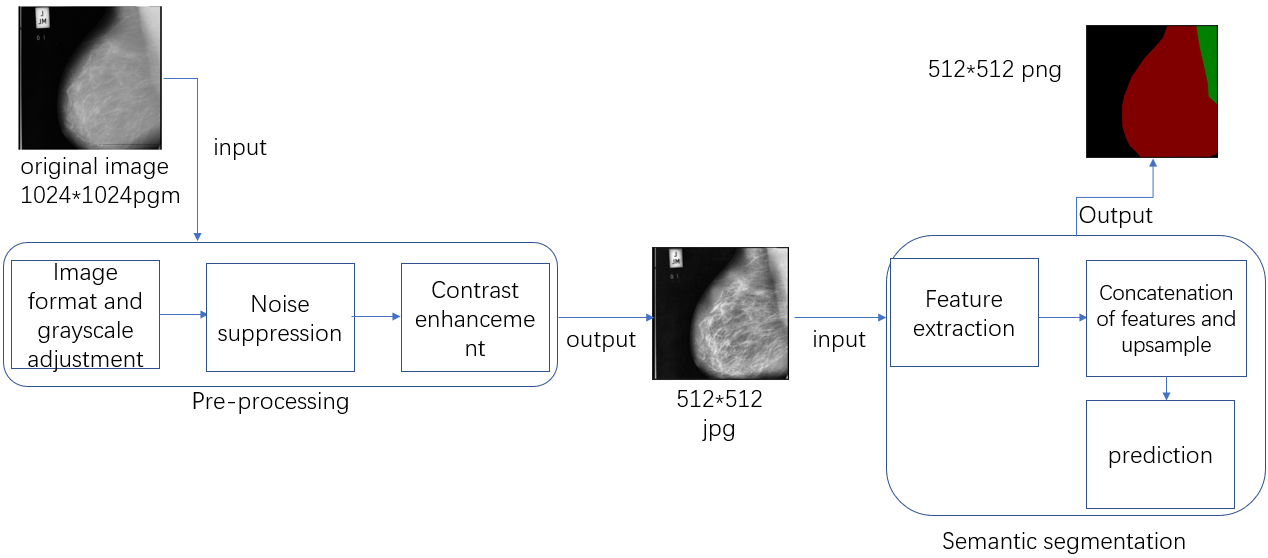
The proposed method contains mainly two steps, which are pre-processing and semantic segmentation. Based on previous researches and actual requirements of the method, the pre-processing step of the proposed method is divided into several steps which are image format and grayscale adjustment, noise suppression and contrast enhancement. The first step aims to transform the original images to a grayscale jpg format which is the requirement of median-filter. The noise suppression seeks to suppress any salt and pepper noise in the mammograms. The contrast enhancement phase focuses on arriving at a clearer presentation of specific regions. After pre-processing step, the processed images are ready for semantic segmentation. The feature is first extracted at different levels, then a concatenation of the features is processed, which will then be up-sampled to the original size of the input. A prediction step is finally deployed to extract breast region by identifying background, breast region and pectoral muscle, which means a prediction of each pixel into three classes above. The flowchart for this method is shown in Fig. 1.
Figure 1.
The basic workflow of the proposed method. The red part of the output is the breast region.
2.2.1Pre-processing
As the mammogram images used to establish this method were from the mini-MIAS database, the original format is pgm and all of the images are in color with the size of 1024*1024. To enable the other steps in the process, they need to be transformed to a jpg format and in grayscale. The process starts with loading each pgm file as a matrix, which is then exported as a jpg file. The jpg file will be judged by the condition of dimension, making sure all files are in grayscale. For the noise suppression step, a median filter with a window size of 3*3 is applied to suppress the noise. Assuming a coordinate (
Figure 2.
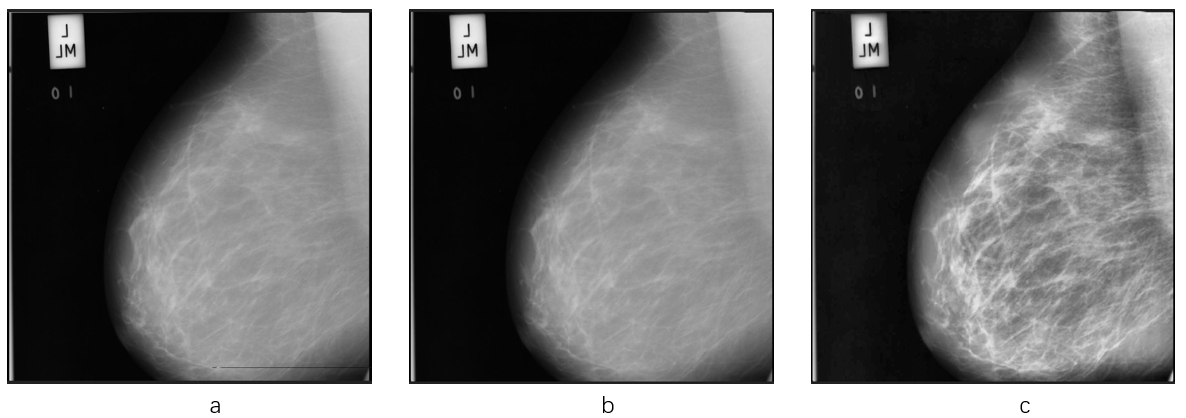
The effects of pre-processing step. The principal noise in the original image (a), is a black line at the bottom of the left-hand image. The image (b) presents the effect of the median filter. The black line has been erased without destroying the other detailed information. The image (c) is the one which applies CLAHE algorithm on image (b). Note the greater visibility of the pectoral muscle in the right-hand image.
2.2.2Semantic segmentation
Semantic segmentation is the novel aspect of the proposed method and is where the advantages of deep learning are brought to bear. Although u-net model has already been applied for breast extraction, Deeplab v3
The semantic segmentation step applies transfer learning, and a modified xception network is applied as backbone. All the max pooling layers are replaced by depthwise separable convolution layers, and batch normalization and ReLU are added after each 3*3 depth convolution layer. Because the dataset used for training and evaluating is much less than ImageNet, the parameters of the network are not tuned massively. As the number of classes is different between the pretrained network and the training dataset, the last layer is removed remaining logits only. Manual calculated weights are taken into consideration. The value setting of weights of the network is 1.0 by default because ImageNet has a large number of classes, which makes each class containing nearly equal weight. However, the three classes labeled in the training dataset are naturally imbalanced which requires proper value set of weight for each class. The sum of pixels belonging to three classes is calculated, and the least common multiple of three classes is then calculated. The multiple of each class is regarded as weight. The equation of the process can be presented as
(1)
where
(2)
where
(3)
(4)
Where
Figure 3.
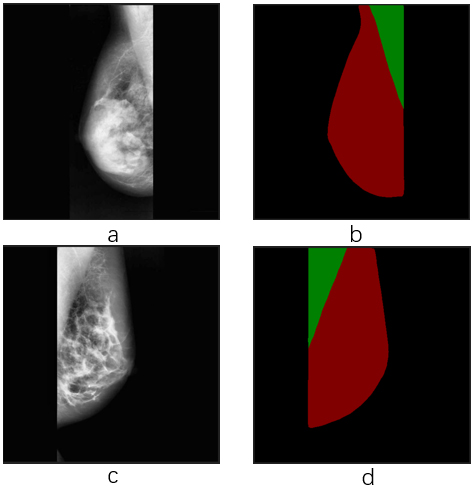
Effect of semantic segmentation. Image a and c are input images with different orientations. Image b and d are output labels with breast region extraction as the red part, as well as pectoral muscle region part as the green part.
3.Results
3.1Datasets, environments and data preparation
The majority of previous research has drawn upon two key mammography image databases. These are Mini-MIAS (Mammographic Image Analysis Society Digital Mammogram Database) [74] and DDSM (Digital Database for Screening Mammography) [75, 76], though some studies have also started to use the annotated INbreast database [77]. Mini-MIAS is a database containing 322 mammographic images taken from a mediolateral point of view [78]. The size of all the images is 1024*1024 pixels. The database is arranged in pairs of images, with each odd image containing the right mammogram and each even on the left mammogram, from a single patient. All of the images are indexed in detail to incorporate, which are the character of the background tissue, the class of abnormality, the severity of the abnormality, the x and y coordinates of the center of the abnormality, and its approximate radius. DDSM is designed to support digital mammogram research and the development of CAD systems [75, 76]. The database contains 2620 cases with four distinct views. Some detailed information is also provided, such as information about the patient, information about the image, and the location and type of possible abnormalities. The INbreast database contains 410 images from 115 different cases. The images are either 3328*4084 or 2560*3328 pixels, depending on the compression applied at the point of acquisition. The images are pre-annotated by two mammography experts (one validating the other) and contain six types of findings which are asymmetries, calcifications, distortion, masses and multiple findings and normal [77].
In order to test the proposed approach, an experiment was undertaken using images from the mini-MIAS database. All 322 pgm format images from the mini-MIAS database were transformed into 1024*1024 jpg format images. They were then converted to grayscale. After applying the median filter and CLAHE algorithm, the images were resized to 512*512. This was necessary for the next phase because of memory constraints in the research environment. The computer used for the experiment had 16 GB RAM, its CPU was an Intel Core i7-9700 and the operating system was Windows 10 home edition. The computer also had a NVIDIA GeForce GTX 1660 Ti graphics card with 6G memory. Initially, the training and evaluation of the deep learning model used 1024*1024 images. However, the program returned an OOM exception, which is a typical problem when there is insufficient memory.
Prior to the semantic segmentation, the processed images were labeled using LabelMe [79], a web-based annotation tool for annotating images. The breast region was labeled as class 1 and the pectoral muscle region was labeled as class 2. The rest region was treated as background, which was automatically labeled as class 0. To avoid there not being enough samples for the training, about 70% of the images were selected as training images and the rest as evaluation images. So, 220 of the original 322 images were randomly picked as training images and the other 102 were used for evaluation.
3.2Comparison of different deep learning models
A comparison experiment is made between u-net model and Deeplab model. From the labelling above, pectoral muscle class is removed so that there is class 0 representing background and class 1 representing breast region. Both models use the same images and labels.
For the u-net model, the learning rate is set to 0.0001, batch size is 1, the steps per epoch is 220 and epoch is 10. It applies binary cross entropy loss as loss function, which is a special case of softmax cross entropy loss.
For the Deeplab model, the atrous rates are set at 6, 12 and 18, the base learning rate is set to 0.0001, the cropped size of the images is set to 513*513 and the batch size is set at 2. A larger batch size would have been beneficial, but 2 is the best the computer being used for the experiment could supply. The manual weight of class 0 is 0.30008681 and the weight of class 1 is 0.54401687. As the pretrained model had different features and numbers of classes to the medical images, the last layer was removed to leave just the logits. In the training phase, 50000 steps were trained, running the CPU and GPU in parallel.
Table 1
Result of deep learning models
| Model | Accuracy | Precision | Recall | F-score | Miou | auc |
|---|---|---|---|---|---|---|
| u-net | 96.11% | 97.28% | 90.41% | 93.58% | 95.28% | 97.62% |
| Deeplab v3 | 98.94% | 98.43% | 98.95% | 98.67% | 96.99% | 98.80% |
Both of the models are implemented in TensorFlow [80], and Keras is also applied for u-net. They also have the same input images prepared in Section 3.1. The Deeplab model reaches better performance through calculation. Considering both models have similar encoder-decoder structure, only deeplab model concatenates conv2 feature map with Deeplab v3 feature map when u-net model generates feature map with convolution and max pooling. Another difference is the use of manual weight in the Deeplab model. The results of both models are shown in Table 1. Although various evaluation analysis parameters are applied such as accuracy, precision, recall, f_score, auc, this paper takes mean intersecion over union (miou) as the main reference to evaluate the performance of a model, for it is widely used as the standard performance measure in networks charging segmentation. Specificity and false positive rate (FPR)will also be given to the model which performs highest miou at the end of all comparison. The equations of calculating these evaluation analysis measures are shown as follows [64, 65, 81].
(5)
(6)
(7)
(8)
(9)
(10)
(11)
Where TP denotes true positive, TN denotes true negative, FP denotes false positive, FN denotes false negative.
3.3Comparison of 2-class segmentation and 3-class segmentation
The purpose of the comparison is to test the influence of labeling pectoral muscle. As an extension of the comparison above, a comparison experiment between different labels is made. The label of 2-class remains the same as it is set in phase 3.2, and the label of 3-class remains the same as it is set in phase 3.1. The parameters and input images of both experiments are the same, only manual weight of the 2-class is 0.30008681 of class 0 and 0.54401687 of class 1, and weight of the 3-class is 1.9908 of class 0, 3.32696 of class 1 and 24.8 of class 2. The 3-class segmentation reaches better performance. Because the pectoral muscle region is very near to the breast region and the grayscale of pectoral muscle is very different from the background, the performance of the model is better if the pectoral muscle is labeled. The result of two experiments is shown in Table 2.
Table 2
Results of 2-class and 3-class segmentation
| Model | Accuracy | Precision | Recall | F-score | Miou | auc |
|---|---|---|---|---|---|---|
| 2-class | 98.94% | 98.43% | 98.95% | 98.67% | 96.99% | 98.8% |
| 3-class | 98.98% | 98.48% | 98.58% | 98.48% | 97.39% | 98.98% |
3.4Comparison of influence of pre-processing methods
The purpose of the comparison is to test the influence of the pre-processing methods with the same labels for training. The first dataset is the original jpg files without noise suppression and contrast enhancement, the second is the jpg files with noise suppression, the third is the jpg files with contrast enhancement and the last is the jpg files with noise suppression and contrast enhancement. The results of the comparison are shown in Table 3. The results show that the pre-processing methods can improve the performance of semantic segmentation.
Table 3
Results of the comparison between 4 datasets. The abbreviation Ns denotes noise suppression, ce denotes contrast enhancement, acc denotes accuracy, pre denotes precision, re denotes recall, f denotes f-score
| Dataset | Ns | Ce | Acc | Pre | Re | F | Miou | auc |
|---|---|---|---|---|---|---|---|---|
| Oriseg |
|
| 98.86% | 95.97% | 98.32% | 97.02% | 97.29% | 98.52% |
| Orimed |
|
| 98.88% | 98.42% | 98.52% | 98.47% | 97.38% | 98.85% |
| Oricla |
|
| 98.89% | 98.44% | 98.52% | 98.48% | 97.36% | 98.81% |
| Fullseg |
|
| 98.98% | 98.48% | 98.58% | 98.48% | 97.39% | 98.98% |
3.5Comparison with other methods
After exporting the model and evaluating it with the 102 images for evaluating, the sensitivity, specificity, false positive rate (FPR) and runtime are also calculated. The model reaches a sensitivity of 98.58%, specificity of 99.25% and FPR of 0.75%. The time consumed to segment each image is between 0.12 s and 0.16 s. As most of the recent research applied accuracy as evaluation analysis, a comparison based on accuracy is shown in Table 4. The effect of semantic segmentation is shown in Fig. 4.
Table 4
Comparison of the accuracy of various methods evaluated on the mini-MIAS database
| Method | Publication | Images | Accuracy |
|---|---|---|---|
| Maitra et al. [21] | 2012 | 322 | 95.71% |
| Li et al. [82] | 2013 | 322 | 90.06% |
| Mustra et al. [83] | 2013 | 320 | 96.57% |
| Bae et al. [27] | 2016 | 322 | 92.2% |
| Taghanaki et al. [84] | 2017 | 322 | 95% |
| Basheer et al. [26] | 2017 | – | 92.85% |
| Shen et al. [85] | 2018 | 322 | 96.89% |
| Lbachir et al. [25] | 2018 | 322 | 98.75% |
| Rahman et al. [86] | 2019 | 200 | 97.50% |
| Elmoufidi. [87] | 2019 | 322 | 97.89% |
| Proposed method | – | 102 | 98.98% |
Figure 4.
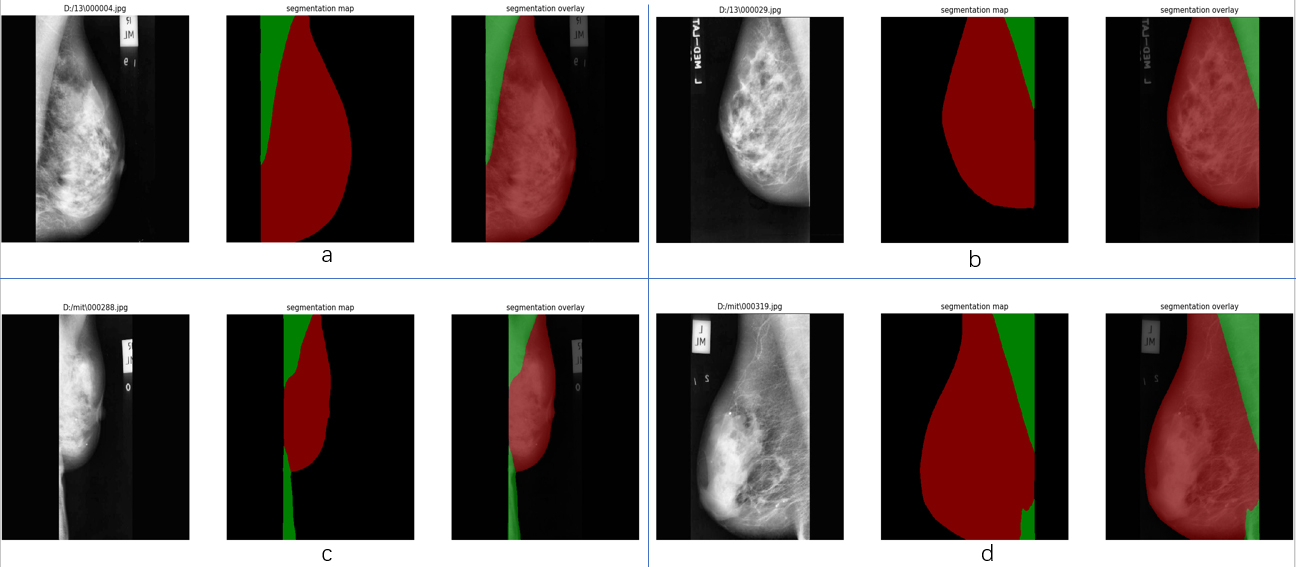
Effect of semantic segmentation on mini-MIAS. Group a and c are the images at right MLO view, group b and d are the images at left MLO view. For each group, the image on the left is the input, the middle is the result image called segmentation map with red label representing breast region and green label representing pectoral muscle region. On the right is the overlay which covers labels to the original image. It can be seen that a lack of contrast between breast and pectoral muscle will lower performance of the model.
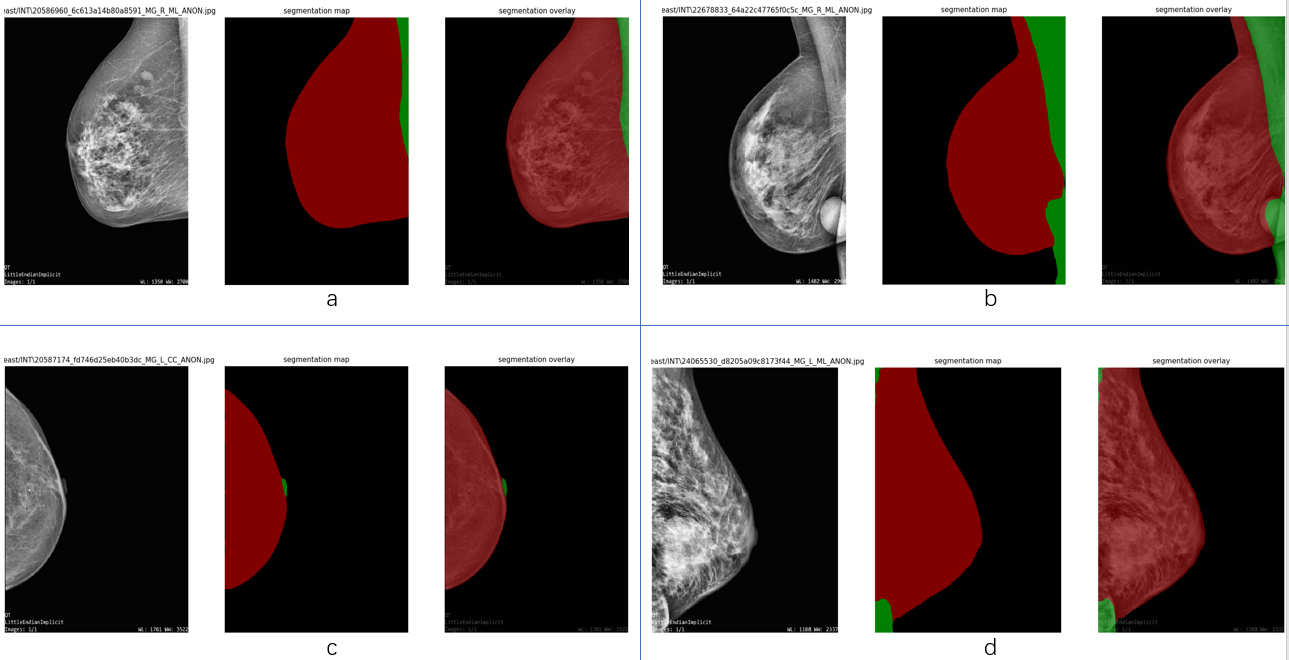
As the number of images for evaluation is too small to be persuasive, images from INbreast databases are also used to evaluate the model. All 410 dcm format images from the INbreast database are used to conduct further evaluation. First, they are transformed to png format files by applying MicroDicom, which is a free software that has a number of useful medical image manipulation functions, including being able to read and convert them from dcm format to other formats. After this, each image is loaded in Matlab and transformed to grayscale, subjected to pre-processing step, then saved as a jpg format of the original size. This evaluation also attempts to test the adaptability of the model dealing with different sizes of images. The time consumed to segment each image is between 0.2 s and 0.26 s. The evaluation on INbreast achieves an accuracy of 99.12%, precision of 98.06%, recall of 98.93%, f-score of 98.48%, miou of 97.14%, specificity of 99.17%, sensitivity of 98.93%, FPR of 0.83%. Even when evaluating images with different sizes, the model performs ideally. A comparison between various approaches using the INbreast database is given in Table 5. The effect of the segmentation is shown in Fig. 5.
Table 5
Comparison of the accuracy of various methods evaluated on the INbreast database
| Method | Publication | Images | Accuracy |
|---|---|---|---|
| Taghanaki et al. [84] | 2017 | 197 | 96% |
| Lbachir et al. [25] | 2018 | 40 | 90% |
| Rahman et al. [86] | 2019 | 200 | 94.50% |
| Proposed method | – | 410 | 99.12% |
Figure 5.
Effect of semantic segmentation on INbreast dataset. Group a and b are at left MLO views, group c is at right CC view, group d is at right MLO view. It can be seen that the pre-processing step has performance limitation in terms of some specific cases.
4.Conclusion
The proposed method shows state-of-the-art performance at extracting breast region from mammographic images. Combining median-filter and CLAHE which are widely used in recent research, the thought of applying semantic segmentation supported by deep learning models achieves both high accuracy and short runtime. Wide range of evaluation on two commonly used mammography datasets proves the ability and adaptability of the method. Being capable of segmenting breast region from all four views of mammographic images using less than 1 second ensures wide application of the method in real-time operation. As the proposed method proves success of transfer learning with pre-trained network segmenting mammographic images, one direction of future work can be semantic segmentation supported by transfer learning based on a newly-designed deep learning model pretrained with a large number of samples which is more targeted to mammography segmentation.
Conflict of interest
None to report.
References
[1] | Stewart BW, Kleihues P, World Cancer Report IARC Press, International Agency for Research on Cancer, WHO (2014), Lyon, France. |
[2] | Feng RM, Zong YN, Cao SM, Xu RH, Current cancer situation in China: Good or bad news from the 2018 Global Cancer Statistics, J. Cancer Communications 39: ((2019) ), 1–12. |
[3] | Chen W, Zheng R, Baade PD, Zhang S, Zeng H, Bray HF, et al., Cancer statistics in China, 2015, J. CA: A Cancer Journal for Clinicians 66: ((2016) ), 115–132. |
[4] | Fan L, Weippl KS, Li J, Louis JS, Finkelstein DM, Yu K, et al., Breast cancer in China, J. Lancet Onconlogy 15: ((2014) ), 279–289. |
[5] | Falcetta FS, Träsel H, Almeida FK, Falcetta MRR, Falavigna M, Rosa DD, Effects of physical exercise after treatment of early breast cancer: Systematic review and meta-analysis, J. Breast Cancer Research & Treatment 170: ((2018) ), 455–476. |
[6] | Head JF, Wang F, Elliott RL, Breast thermography is a noninvasive prognostic procedure that predicts tumor growth rate in breast cancer patients, J. Annals of the New York Academy of Sciences 698: ((1993) ), 153–158. |
[7] | Ekpo EU, Alahkras M, Brennan PC, Errors in Mammography Cannot be Solved Through Technology Alone, J. Asian Pacific Journal of Cancer Prevention: APJCP 19: ((2018) ), 291–301. |
[8] | Rao VM, Levin DC, Parker L, Cavanaugh B, Frangos A, Sunshine JH, How widely is computer-aided detection used in screening and diagnostic mammography, J. Journal of the American College of Radiology 7: ((2010) ), 802–805. |
[9] | Jalalian A, Mashohor SBT, Mahmud HR, Saripan MI, Ramli AR, Karasfi B, Computer-aided detection/diagnosis of breast cancer in mammography and ultrasound: A review, J. Clinical Imaging 37: ((2013) ), 420–426. |
[10] | Henriksen EL, Carlsen JF, Vejborg IM, Nielsen MB, Lauridsen CA, The efficacy of using computer-aided detection (CAD) for detection of breast cancer in mammography screening: A systematic review, J. Acta Radiologica 60: ((2018) ), 13–18. |
[11] | Masud R, Al-Rei M, Lokker C, Computer-aided detection for breast cancer screening in clinical settings: Scoping review, J. JMIR Medical Informatics, Preprint 7: ((2019) ), e12660. |
[12] | Ortiz-Rodriguez JM, Guerrero-Mendez C, Martinez-Blanco MDR, Castro-Tapia S, Moreno-Lucio M, Jaramillo-Martinez R, et al., Breast Cancer Detection by Means of Artificial Neural Networks, in Advanced Applications for Artificial Neural Networks, IntechOpen, (2018) , 161–179. |
[13] | Hupse R, Karssemeijer N, The effect of feature selection methods on computer-aided detection of masses in mammograms, J. Physics in Medicine & Biology 55: ((2010) ), 2893–2894. |
[14] | Ponraj DN, Jenifer ME, Poongodi P, Manoharan JS, A survey on the preprocessing techniques of mammogram for the detection of breast cancer, J. Journal of Emerging Trends in Computing and Information Sciences 2: ((2011) ), 656–664. |
[15] | Bandyopadhyay SK, Pre-processing of mammogram images, J. International Journal of Engineering Science & Technology 2: ((2010) ), 6753–6758. |
[16] | Makandar A, Halalli B, A review on Preprocessing Techniques for Digital Mammography images, in National Conference on Digital Image and Signal Processing, (2015) , pp. 23–27. |
[17] | Arefan D, Mohamed AA, Berg WA, Zuley ML, Sumkin JH, Wu S, Deep learning modeling using normal mammograms for predicting breast cancer risk, J. Medical Physics 47: ((2020) ), 110–118. |
[18] | Boss R, Thangavel K, Daniel D, Automatic mammogram image breast region extraction and removal of pectoral muscle, J. International Journal of Scientific and Engineering Research 4: ((2013) ), 1722–1729. |
[19] | Chen LC, Papandreou G, Schroff F, Adam H, Rethinking atrous convolution for semantic image segmentation, J. arXiv:1706.05587, (2017) . |
[20] | Chollet F, Xception: Deep Learning with Depthwise Separable Convolutions, arXiv:1610.02357. |
[21] | Maitra IK, Nag S, Bandyopadhyay SK, Technique for preprocessing of digital mammogram, J. Computer Methods & Programs in Biomedicine 107: ((2012) ), 175–188. |
[22] | Papadopoulos A, Fotiadis DI, Costaridou L, Improvement of microcalcification cluster detection in mammography utilizing image enhancement techniques, J. Computers in Biology and Medicine 38: ((2008) ), 1045–1055. |
[23] | Makandar A, Halalli B, Breast cancer image enhancement using median filter and CLAHE, J. International Journal of Scientific & Engineering Research 6: ((2015) ), 462–465. |
[24] | Zuiderveld K, Contrast Limited Adaptive Histogram Equalization, J. Graphics Gems, (1994) , 474–485. |
[25] | Lbachir IA, Essalhi R, Daoudi I, Tallal S, A new mammogram preprocessing method for Computer-Aided Diagnosis systems, in IEEE/ACS International Conference on Computer Systems & Applications, IEEE, (2017) , pp. 166–171. |
[26] | Basheer SI, Abbosh YM, Younus MD, Pre-processing algorithms on digital mammograms, J. International Journal of Computer Applications 174: ((2017) ), 975–8887. |
[27] | Bae YW, Eun OJ, Young CE, Hee KH, Yeul LS, Gi KK, Automatic detection of pectoral muscle region for computer-aided diagnosis using MIAS mammograms, J. Biomed Research International 2016: ((2016) ), 1–6. |
[28] | Arfan M, Deep learning based computer aided diagnosis system for breast mammograms, J. International Journal of Advanced Computer Science and Applications 8: ((2017) ), 286–290. |
[29] | Bick U, Giger ML, Schmidt RA, Nishikawa RM, Wolverton DE, Doi K, Automated segmentation of digitized mammograms, J. Academic Radiology 2: ((1995) ), 1–9. |
[30] | Zhou C, Chan HP, Petrick N, Helvie MA, Goodsitt MM, Sahiner B, Hadjiiski LM, Computerized image analysis: Estimation of breast density on mammograms, J. Medical Physics 28: ((2001) ), 1056–1069. |
[31] | Jenefer BM, Cyrilraj V, Multi-class abnormal breast tissue segmentation using texture features, in 2014 International Conference on Science Engineering and Management Research, IEEE, (2014) , pp. 1–4. |
[32] | Li XZ, Williams S, Bottema MJ, Background intensity independent texture features for assessing breast cancer risk in screening mammograms, J. Pattern Recognition Letters 34: ((2013) ), 1053–1062. |
[33] | Zhu W, Xiang X, Tran TD, Hager GD, Xie X, Adversarial deep structured nets for mass segmentation from mammograms, in 2018 IEEE International Symposium on Biomedical Imaging, (2018) , pp. 847–850. |
[34] | Singh VK, Romani S, Rashwan HA, Akram F, Pandey N, Sarker MM, et al., Conditional generative adversarial and convolutional networks for x-ray breast mass segmentation and shape classification, in International Conference on Medical Image Computing and Computer-Assisted Intervention, CVPR, (2018) , pp. 833–840. |
[35] | Akselrod-Ballin A, Karlinsky L, Alpert S, Hasoul S, Barkan E, A region based convolutional network for tumor detection and classification in breast mammography, in International Workshop on Large-scale Annotation of Biomedical Data & Expert Label Synthesis International Workshop on Deep Learning in Medical Analysis, Springer International Publishing, (2016) , pp. 197–205. |
[36] | Lévy D, Jain A, Breast mass classification from mammograms using deep convolutional neural networks, preprint, arXiv:1612.00542. |
[37] | Litjens G, Kooi T, Bejnordi BE, Setio A, Ciompi F, Ghafoorian M, van der Laak J, van Ginneken B, Sánchez C, A survey on deep learning in medical image analysis, J. Medical Image Analysis 42: ((2017) ), 60–88. |
[38] | Sahiner B, Chan HP, Petrick N, Wei D, Helvie MA, Adler DD, Goodsitt MM, Classification of mass and normal breast tissue: A convolution neural network classifier with spatial domain and texture images, J. IEEE Trans Med Imaging 15: ((1996) ), 598–610. |
[39] | Jamieson AR, Drukker K, Giger ML, van Ginneken B, Novak CL, Breast image feature learning with adaptive deconvolutional networks, J. Proceedings of SPIE – The International Society for Optical Engineering 8315: ((2012) ), 831506. |
[40] | Hadjiiski LM, Tourassi GD, Fonseca P, Mendoza J, Wainer J, Ferrer J, et al., Automatic breast density classification using a convolutional neural network architecture search procedure, in Spie Medical Imaging, Proceedings of SPIE, (2015) , 941428-941428-8. |
[41] | Gallego-Posada JD, Montoya-Zapata DA, Quintero-Montoya OL, Detection and diagnosis of breast tumors using deep convolutional neural networks, J. Medical Physics 43: ((2016) ), 1–6. |
[42] | Jiao Z, Gao X, Wang Y, Li J, A deep feature based framework for breast mases classification, J. Neurocomputing 197: ((2016) ), 221–231. |
[43] | Kisilev P, Sason E, Barkan E, Hashoul S, Medical image Description Using Multi-task-loss CNN, in International Workshop on Large-Scale Annotation of Biomedical Data and Expert Label Synthesis International Workshop on Deep Learning in Medical Image Analysis, Springer, Cham, (2016) , pp. 121–129. |
[44] | Kallenberg M, Petersen K, Nielsen M, Ng A, Diao P, Igel C, et al., Unsupervised deep learning applied to breast density segmentation and mammographic risk scoring, J. IEEE Transactions on Medical Imaging 35: ((2016) ), 1322–1331. |
[45] | Wang Z, Li M, Wang H, Jiang H, Yao Y, Zhang H, Xin J, Breast cancer detection using extreme learning machine based on feature fusion with CNN deep features, J. IEEE Access 7: ((2019) ), 105146–105158. |
[46] | Al-antari MA, Al-masni MA, Choi MT, Han SM, Kim TS, A fully integrated computer-aided diagnosis system for digital X-ray mammograms via deep learning detection, segmentation, and classification, J. International Journal of Medical Informatics 117: ((2018) ), 44–54. |
[47] | Al-Masni MA, Al-Antari MA, Park JM, Gi G, Kim TY, Rivera P, Valarezo E, Choi MT, Han SM, Kim TS, Simultaneous detection and classification of breast masses in digital mammograms via a deep learning YOLO-based CAD system, J. Computer Methods and Programs in Biomedicine 157: ((2018) ), 85–94. |
[48] | Dhungel N, Carneiro G, Bradley AP, The automated learning of deep features for breast mass classification from mammograms, in Medical Image Computing and Computer-Assisted Intervention-MICCAI, Springer International Publishing, (2016) , pp. 106–114. |
[49] | Ertosun MG, Rubin DL, Probabilistic visual search for masses within mammography images using deep learning, in IEEE International Conference on Bioinformatics & Biomedicine, IEEE, (2015) , pp. 1310–1315. |
[50] | Murtaza G, Shuib L, Wahid A, Wahab A, Azmi A, Deep learning-based breast cancer classification through medical imaging modalities: State of the art and research challenges, J. Artificial Intelligence Review 1: ((2019) ), 1–66. |
[51] | Huyuh BQ, Li H, Giger ML, Digital mammographic tumor classification using transfer learning from deep convolutional neural networks, J. Journal of Medical Imaging 3: ((2016) ), 034501. |
[52] | Kooi T, Litjens G, van Ginneken B, Gubern-Mérida A, Sánchez C, Mann R, et al., Large scale deep learning for computer aided detection of mammographic lesions, J. Medical Image Analysis 35: ((2017) ), 303–312. |
[53] | Sun W, Tseng TL, Zhang J, Qian W, Enhancing deep convolutional neural network scheme for breast cancer diagnosis with unlabeled data, J. Computerized Medical Imaging and Graphics 57: ((2017) ), 4–9. |
[54] | Huwang S, Kim H, Self-transfer learning for fully weakly supervised object localization, arXiv:1602.01625. |
[55] | Arevalo J, González FA, Ramos-Pollán R, Oliveira JL, Lopez M, Representation learning for mammography mass lesion classification with convolutional neural networks, J. Computer Methods & Programs in Biomedicine 127: ((2016) ), 248–257. |
[56] | Dubrovina A, Kisilev P, Ginsburg B, Hashoul S, Kimmel R, Computational mammography using deep neural networks, J. Computer Methods in Biomechanics & Biomedical Engineering Imaging & Visualization 6: ((2018) ), 243–247. |
[57] | Qiu Y, Wang Y, Yan S, Tan M, Cheng S, Liu H, Zheng B, An initial investigation on developing a new method to predict short-term breast cancer risk based on deep learning technology, J. Proeedings of SPIE – The International Society for Optical Engineering 9785: ((2016) ), 978521. |
[58] | Kumar A, Mukherjee S, Luhach AK, Deep learning with perspective modeling for early detection of malignancy in mammograms, J. Journal of Discrete Mathematical Ences and Cryptography 22: ((2019) ), 627–643. |
[59] | Kooi T, Ginneken BV, Karssemeijer N, den Heeten A, Discriminating solitary cysts from soft tissue lesions in mammography using a pretrained deep convolutional neural network, J. Medical Physics 44: ((2017) ), 1017–1027. |
[60] | Russakovsky O, Deng J, Su H, Krause J, Satheesh S, Ma S, et al., ImageNet Large Scale Visual Recognition Challenge, J. International Journal of Computer Vision 115: ((2015) ), 211–252. |
[61] | Burt JR, Torosdagli N, Khosravan N, Raviprakash H, Mortazi A, Tissavirasingham F, et al., Deep learning beyond cats and dogs: Recent advances in diagnosing breast cancer with deep neural networks, J. The British Journal of Radiology 91: ((2018) ), 20170545. |
[62] | Rodriguez-Ruiz A, Teuwen J, Chung K, Karssemeijer N, Sechopoulos I, Pectoral muscle segmentation in breast tomosynthesis with deep learning, in Computer-Aided Diagnosis, SPIE Medical Imaging, (2018) , 105752J. |
[63] | Zhou Z, Siddiquee MMR, Tajbakhsh N, Liang J, Unet |
[64] | Saha M, Arun I, Ahmed R, Chatterjee S, Chakraborty C, HscoreNet: A deep network for estrogen and progesterone scoring using breast IHC images, J. Pattern Recognition 102: ((2020) ), 107200. |
[65] | Saha M, Chakraborty C, Her2Net: A deep framework for semantic segmentation and classification of cell membranes and nuclei in breast cancer evaluation, J. IEEE Transactions on Image Processing 27: ((2018) ), 2189–2200. |
[66] | Hamidinekoo A, Denton E, Zwiggelaar R, Automated Mammogram Analysis with a Deep Learning Pipeline, arXiv:1907.11953. |
[67] | de Oliveira HN, de Avelar CS, Machado AMC, de Albuquerque Araujo A, Santos JAD, Exploring Deep-Based Approaches for Semantic Segmentation of Mammographic Images, in Iberoamerican Congress on Pattern Recognition, Springer, Cham, (2018) , 690–698. |
[68] | Ahmed L, Iqbal MM, Aldabbas H, Images data practices for Semantic Segmentation of Breast Cancer using Deep Neural Network, J. Journal of Ambient Intelligence and Humanized Computing, (2020) . Available from doi: 10.1007/s12652-020-01680-1. |
[69] | Fotin S, Yin Y, Haldankar H, Hoffmeister JW, Periaswamy S, Detection of soft tissue densities from digital breast tomosynthesis: comparison of conventional and deep learning approaches, in Medical Imaging, Proceedings of the SPIE, (2016) , 97850X. |
[70] | Samala RK, Chan H, Hadjiiski L, Helvie MA, Wei J, Cha K, Mass detection in digital breast tomosynthesis: Deep convolutional neural network with transfer learning from mammography, J. Medical Physics 43: ((2016) ), 6654–6666. |
[71] | Chen L, Zhu Y, Papandreou G, Schroff F, Adam H, Encoder-Decoder with Atrous Separable Convolution for Semantic Image Segmentation, in ECCV, ECCV 2018, (2018) , 833–851. |
[72] | Everingham M, Eslami SMA, van Gool L, Williams C, Winn J, Zisserman A, The pascal visual object classes challenge: A retrospective, J. International Journal of Computer Vision 111: ((2015) ), 98–136. |
[73] | Cordts M, Omran M, Ramos S, Rehfeld T, Enzweiler M, Benenson R, et al., The cityscapes dataset for semantic urban scene understanding, eprint, arXiv:1604.01685. |
[74] | Suckling J, Parker J, Dance DR, The mammographic image analysis society digital mammogram database, J. International Congress Series 1069: ((1994) ), 375–378. |
[75] | Heath M, Bowyer K, Kopans D, Moore R, Kegelmeyer P Jr, The Digital Database for Screening Mammography, J. Medical Physics, (2001) , 212–218. |
[76] | Heath M, Bowyer K, Kopans D, Kegelmeyer P Jr, Moore R, Chang K, Munishkumaran S, Current status of the Digital Database for Screening Mammography, in digital Mmmography, Springer, Dordrecht, (1998) , 457–460. |
[77] | Moreira IC, Amaral I, Domingues I, Cardoso A, Cardoso MJ, Cardoso JS, Inbreast: Toward a full-field digital mammographic database, J. Academic Radiology 19: ((2012) ), 236–248. |
[78] | Oliveira J, Gueld M, De A, Araújo A, Ott B, Deserno T, Toward a standard reference database for computer-aided mammography, J. Proceedings of Spie the International Society for Optical Engineering 6915: ((2008) ), 69151Y. |
[79] | Russell BC, Torralba A, Murphy KP, Freeman WT, LabelMe: A database and web-based tool for image annotation, J. International Journal of Computer Vision 77: ((2008) ), 157–173. |
[80] | Abadi M, Agarwal A, Barham P, Brevdo E, Chen Z, Citro C, et al., TensorFlow: Large-Scale Machine Learning on Heterogeneous Distributed Systems, arXiv:1603.04467. |
[81] | Rahman MA, Wang Y, Optimizing Intersection-Over-Union in Deep Neural Networks for Image Segmentation, in International Symposium on Visual Computing, Springer International Publishing AG, (2016) , pp. 234–244. |
[82] | Li Y, Chen H, Yang Y, Yang N, Pectoral muscle segmentation in mammograms based on homogenous texture and intensity deviation, J. Pattern Recognition 46: ((2013) ), 681–691. |
[83] | Mustra M, Grgic M, Robust automatic breast and pectoral muscle segmentation from scanned mammograms, J. Signal Processing 93: ((2013) ), 2817–2827. |
[84] | Taghanaki SA, Liu Y, Miles B, Hamarneh G, Geometry-Based Pectoral Muscle Segmentation from MLO Mammogram Views, J. IEEE Transactions on Bio Medical Engineering 64: ((2017) ), 2662–2671. |
[85] | Shen R, Yan K, Xiao F, Chang J, Jiang C, Zhou K, Automatic pectoral muscle region segmentation in mammograms using genetic algorithm and morphological selection, J. Digital Imaging 31: ((2018) ), 680–691. |
[86] | Jha RK, Rahman M, Gupta A, Gabor phase response based scheme for accurate PMB detection, J. IET Image Processing 13: ((2019) ), 771–778. |
[87] | Elmoufidi A, Pre-Processing Algorithms on Digital X-ray Mammograms, in IEEE International Smart Cities Conference, IEEE, (2019) , pp. 87–92. |


