
Non-destructive morphological observation of anatomical growth process in Haemaphysalis Longicornis tick specimens using optical coherence tomography
Abstract
BACKGROUND:
Ticks are known as the representatives of hematophagous arachnids. They cause various tick-borne diseases, such as severe fever with thrombocytopenia syndrome (SFTS) and Lyme disease. To understand the mechanism of virus infection caused by ticks, morphology for the anatomical characteristics of crucial organs has been widely studied in acarological fields. The conventional methods used for tick observation have inevitable limitations. Dissection is the standard method to obtain the morphological information, and complex microscopy methods were utilized alternatively.
OBJECTIVE:
The study goal is to obtain the morphological information of ticks in different growth stages non-invasively.
METHODS:
Optical coherence tomography (OCT) is employed to acquire structural images of various internal organs without damage for observing the growth process of larva, nymph, and adult in Haemaphysalis longicornis ticks in real-time.
RESULTS:
Various internal organs, such as salivary glands, rectal sac, genital aperture, and anus, were well-visualized by the OCT enface and cross-sectional images, and the variation in size of these organs in each growth stage was compared quantitatively.
CONCLUSIONS:
Based on the obtained results, we confirmed the potential feasibility of OCT as a non-destructive real-time tool for morphological studies in acarology. Further research using OCT for acarological applications can include monitoring the growth process of ticks in terms of structural changes and investigating morphological differences between normal and virus-infected tick specimens.
1.Introduction
Ticks are one of the hematophagous arachnids that live by feeding on the blood of birds and mammals including livestock and even humans [1]. Ticks constitute the subclass of Acari and have families of Ixodidae, Argasidae, and Nuttalliellidae. Growth stages and life cycles of ticks go through egg, larval, nymphal, and adult life. Various tick-borne diseases include severe fever with thrombocytopenia syndrome (SFTS), Lyme disease, babesiosis, Q fever, and ehrlichiosis [2, 3, 4, 5, 6]. Except for the egg stage, ticks take blood as the main feeding source at every growth stage. Hypostome and salivary glands are major organs for ticks to suck blood. The hemoglobin and proteins in the blood are digested at the cytoplasm of the gut inside their body, which is the main digestive organ [7]. Genital aperture is the reproductive organ in female ticks that is important for examining the reproduction of the tick population. Therefore, morphological study of ticks is essential to observe its variation caused by specific factors including viruses, and studying the internal organs is needed to understand how the dissemination of tick-borne diseases occur [8].
In this sense, observation of the organs and tick morphology is done by the common dissection methods [9]. During dissection, the specimen is fixed, and then internal organs are extracted sequentially starting to peel off the integument (outer cover). Although these methods can provide the most direct approach to confirm certain organs, there is a critical disadvantage of damaging the specimen inevitably. On the other hand, various imaging techniques have been employed to visualize such structures in ticks. Microscopic imaging method, such as transmission electron microscopy (TEM), scanning electron microscopy (SEM), and confocal microscopy, has been widely used to acquire high-resolution images. However, lack of depth information is the main drawback of these methods, which produce images of the external appearance, and the preparation of the specimen, such as fixation, dehydration, and coating, is required [10, 11, 12]. Besides, for functional imaging, fluorescence imaging has also been applied to monitor the digestion process, but the acquired images were limited to topology without depth information [13]. In addition to these imaging technologies, magnetic resonance imaging (MRI) and conventional x-ray imaging, on the other hand, can both produce tomographic images, but the resolution of the aforementioned methods has a major limitation of obtaining a precise visualization of ticks [14, 15]. Although phase-contrast x-ray has been applied to visualize tissues and organs inside small living animals, the radiation caused by the synchrotron x-rays leads to molecular damages, which is detrimental to the living specimen [16].
Another optical imaging technique, the optical coherence tomography (OCT), which is a non-invasive imaging technique using interferometry, can be an alternative to visualize the ticks. OCT uses a non-ionizing broadband light source providing high-resolution tomographic images [17]. The resolution of the OCT is higher than that of ultrasound imaging and less than that of confocal microscopy, while the penetration depth is up to ten times deeper than confocal microscopy [18]. One of the great advantages of OCT imaging is the capability of non-invasive imaging without any damage to the specimen. Therefore, OCT has been applied in various medical fields, such as ophthalmology [19, 20], dentistry [21, 22], otolaryngology [23, 24], dermatology [25, 26], and surgical operation [27, 28]. Currently, OCT applications are not limited to medical fields but also in multidisciplinary studies such as agriculture [29, 30], industry [31, 32], and biology [33]. In addition, OCT has been applied for entomological research, such as monitoring a cardiac function in Laval fly and morphological assessment of moth [34, 35, 36, 37]. In Table 1, the conventional dissecting method and imaging techniques that could be used for morphological study of ticks were briefly compared with OCT in various aspects [14, 16, 38, 39, 40, 41].
Table 1
Comparison of dissection and imaging techniques used for small living animals
| Dissection | Electron microscopes | Phase-contrast X-ray | MRI | OCT | |
|---|---|---|---|---|---|
| Penetration depth | – | Entire body | Entire body | 1–3 mm | |
| Observable area | External & | External | Internal | Internal | External & |
| internal | internal | ||||
| Resolution | – | Nanometer-scale | 6–70 | 60 | 5–20 |
| millimeter-scale | |||||
| Damage to specimen | Irreversible | (In-vitro) Irreversible | (In-vitro) Radiation & | (In-vivo) None | (In-vivo) None |
| damage | damage | Irreversible damage |
Note: Values are for typical biological tissue.
In this study, the ultimate purpose of this study was to confirm the applicability of OCT to study tick morphology and reveal its novelty for acarological research. To this end, an OCT system was developed to observe various organs, both inside and outside, in tick specimens at different growth stages (larval, nymphal, and adult life). After anesthetizing the tick specimens, tomographic images of the organs were obtained in vivo through OCT enface and cross-sectional images. Here, we focused on imaging and comparing vital organs in the digestive, genital, and excretory system, such as the gut, salivary glands, genital aperture, anus, and festoons, which are directly related to various tick-borne diseases harmful to humans and associate with the reproduction and development of ticks. The variation in the sizes of these organs was also analyzed quantitatively. Through this study, the internal morphology of ticks in each growth stages was identified and analyzed without damages, and the applicability of OCT to the tick study was demonstrated.
2.Method
2.1The development of optical coherence tomography (OCT) system
For this study, a spectral-domain optical coherence tomography (SD-OCT) system, which utilizes a spectrometer to collect raw interference signals, was fundamentally developed to acquire images. The overall configuration of the SD-OCT system is presented in the schematic shown in Fig. 1. The utilized optical laser was a broadband light source with a center wavelength of 840 nm and bandwidth (full width at half maximum; FWHM) of 50 nm (EXS210022-02, SLED, EXALOS, Switzerland). The laser was connected to an optical interferometer. This interfered light was transferred to the customized spectrometer and dispersed by wavelengths as it passes through the diffraction grating (transmission type, 1800 lines/mm, Wasatch Photonics Inc., USA). The achromatic lens (AC508-100-B, Thorlabs, USA) made the dispersed light to be focused on the line scan camera (high-speed CMOS camera with 2048 (H)
Figure 1.
A schematic diagram of the developed spectral-domain optical coherence tomography (SD-OCT) system. C: collimator, DG: diffraction grating, FC: fiber coupler, GS: Galvano scanner, L: lens, LS: light source, LSC: line scan camera, M: mirror, PC: polarization controller, S: sample.
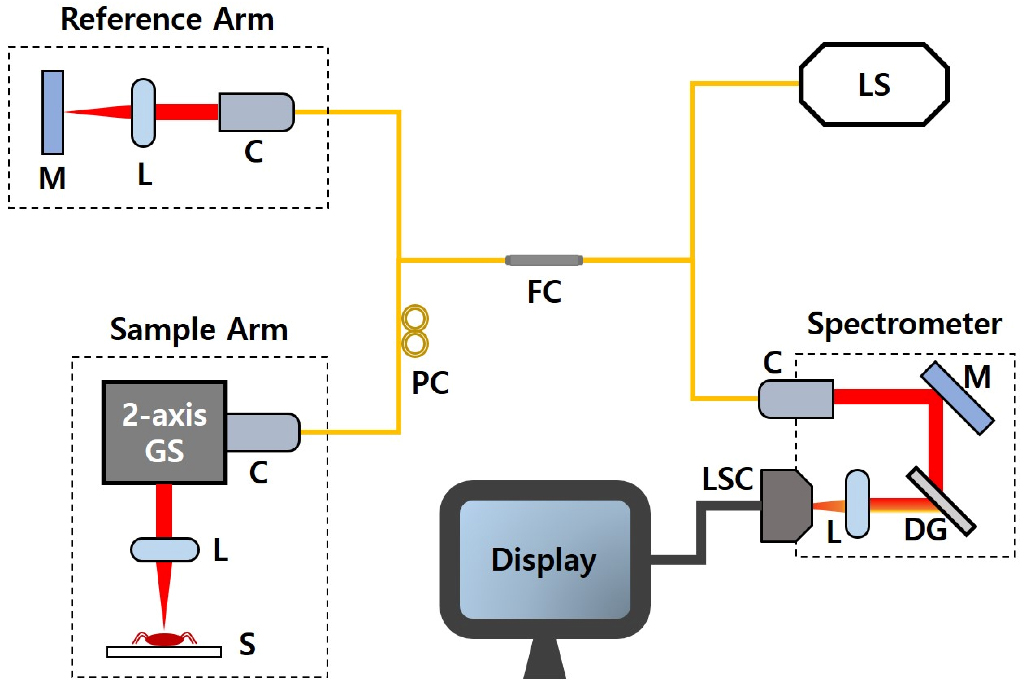
The raw data from the frame grabber (PCIe-1433, National Instruments, USA) was processed by the software developed using a graphical programming language LabVIEW 2018 [44]. The frame rate of the system was 50 frames per second, and the OCT B-scan image could be displayed at every 20 milliseconds in real-time. A total of 1000 B-scan images were collected for C-scan to acquire the entire tomographic images for each tick specimen, which was taken within 20 seconds. For the rapid data processing, we used a compute unified device architecture (CUDA) with graphics processing units (GPU) to perform fast Fourier transform (FFT), wavenumber-linearization (k-linearization), and background noise removal [45]. After log-scaling, the processed data was sent to the CPU thread to save, and the OCT B-scan image was displayed on the computer monitor in real-time.
2.2Preparation of Haemaphysalis longicornis tick specimens
The examined tick specimens of the study were Haemaphysalis longicornis (Acari: Ixodidae) species known as the ‘Asian long-horned tick’ in East and Central Asia [46]. These species transmit tick-borne diseases like theileriosis to livestock and be one of the major vectors for human diseases such as Lyme disease and severe fever with thrombocytopenia syndrome (SFTS). Three examined tick specimens (named as A
3.Results
3.1Gut distribution comparing
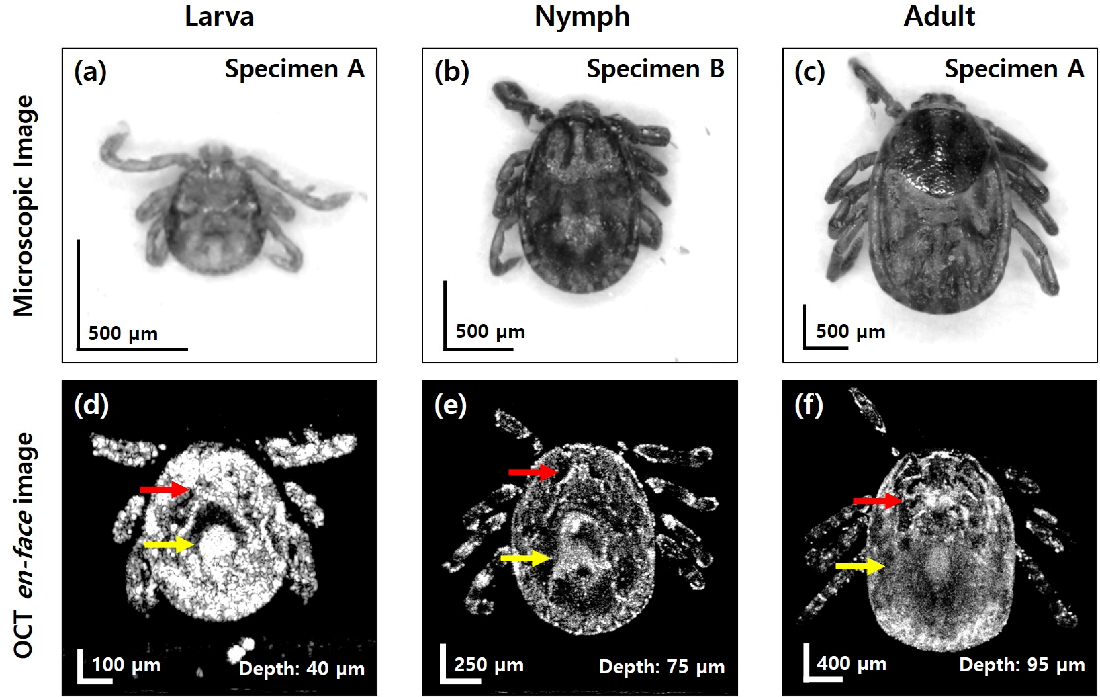
The photographs of the specimens in this paper were imaged using a digital microscope (AM3113T, Dino-Lite, Taiwan). For comparing the gut distribution inside the tick specimens, OCT enface images (frontal view) covering the whole body of specimens in each growth stage were collected, and the representative images are shown in Fig. 2 with the corresponding microscopic images viewed on the dorsal side. The microscopic image of the larva specimen (tick specimen A) in Fig. 2a illustrates only three legs, which is the unique characteristics in the larval stage. In Fig. 2c, the round line appears on the dorsal shield (scutum) of the adult specimen A, which is a typical structure found only in female adult ticks. Through the microscopic images, some of the external features in each specimen can be observed. However, these microscopic images are unable to provide information about internal organs. On the other hand, OCT enface images in Fig. 2d–f present the distribution of the internal organs that belong to the same specimens shown in the microscopic images (Fig. 2a–c). Through the OCT enface images, it can be observed that the internal organs become more complex and distinct according to the growth stages. The salivary glands indicated with the red arrows become more clearly visible as the growth processes from larva to adult along with an increased dimension. The midgut indicated with the yellow arrows is also shown in each specimen, and the distribution of the midgut spreads more evenly throughout the body as the growth stage proceeds. The depth values marked in each OCT enface image illustrate the distance from the top dorsal surface to the enface image plane inside the specimen. Since the head part of each specimen was lower than the dorsal shield, the OCT enface images could not cover the head part together with the body.
Figure 2.
Microscopic and OCT enface images (frontal view) for the comparison of gut distribution. (a)–(c) Microscopic images of larva specimen (A), nymph specimen (B), adult specimen (A), respectively. (d)–(f) OCT enface images of larva specimen (A), nymph specimen (B), adult specimen (A), respectively. The depth of each OCT enface image is denoted at the right bottom. Red arrows indicate salivary glands. Yellow arrows indicate midgut.
3.2Cross-sectional comparison of the organs
One of the compelling advantages of OCT imaging is its capability of non-invasive tomographic imaging in the depth direction. Based on the acquired OCT data, we observed the changes in specific organs at each growth phase through the OCT cross-sectional images. Figure 3 shows the representative microscopic and OCT cross-sectional images (transverse view) of the larva specimen B, nymph specimen B, and adult specimen B. The locations of each OCT cross-sectional image are marked on the microscopic images of the specimens (Fig. 3a–c) with the dotted lines. The specimens were imaged on the ventral side, and the presented OCT cross-sectional images (Fig. 3d–i) were averaged with the adjacent three B-scan slides toward the y-axis. The genital aperture of tick is the specific organ that can only be identified in adults, which starts to emerge when a nymph enters the adult life stage (position is indicated by the red arrows in Fig. 3d–f). The beginning of the genital aperture development is observed in the form of empty space shown in Fig. 3e of the nymph specimen. Finally, the morphological structure of the genital aperture is clearly revealed in the OCT cross-sectional image of the adult specimen B (Fig. 3f), and the spatial structure inside has become more pronounced. The development of anus is also observed along the growth process. Figure 3g–i is the OCT cross-sectional images for the anus region of each specimen, and the yellow arrows indicate the locations of the anus. In Fig. 3g, the larva specimen (B) shows a strong internal intensity at the anus location, although the body thickness is too thin to be appropriate for the axial resolution of the system. In the case of the nymph specimen (Fig. 3h), the overall appearance of the anus in the depth direction is well visible, and in the adult specimen (Fig. 3i), the internal structure of the anus becomes more distinguishable.
Figure 3.
Microscopic images on the ventral side and OCT cross-sectional images (transverse view) about genital aperture and anus. (a–c) Microscopic images. The dotted lines indicate the location of each OCT cross-sectional image plane. (d–f) OCT cross-sectional images for genital aperture. Red arrows indicate the position of the genital aperture. (g–i) OCT cross-sectional images for the anus. Yellow arrows indicate the position of anus. Black scale bar: 500
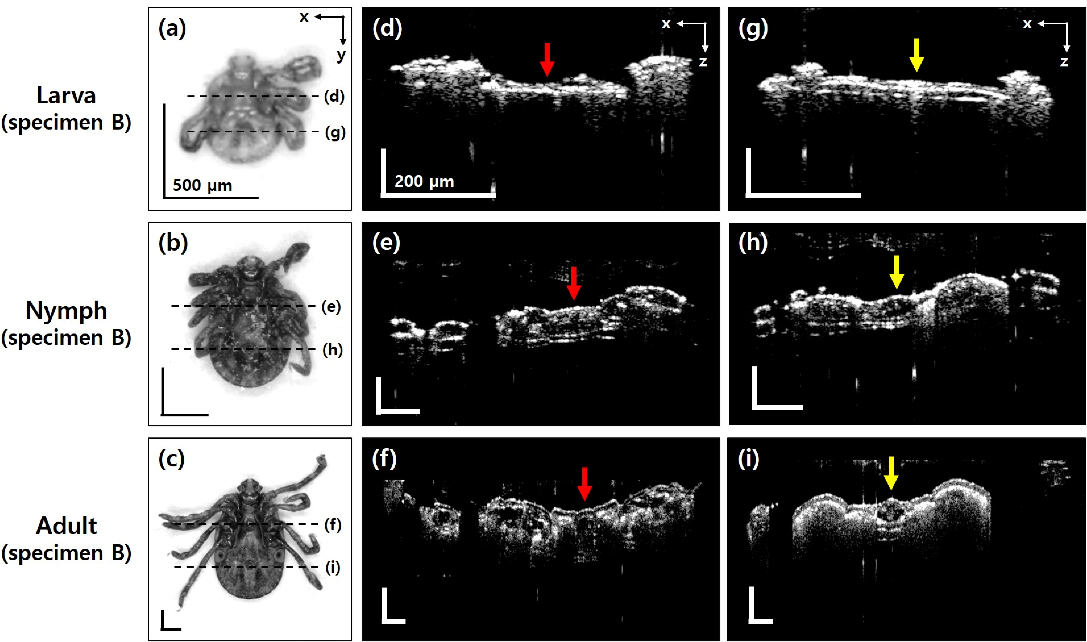
Figure 4.
Microscopic images on the ventral side and OCT cross-sectional images in the sagittal view. (a–c) Microscopic images. The dotted lines indicate the position of each OCT cross-sectional image plane. (d–f) OCT cross-sectional images in the sagittal view. White, red, and yellow arrows indicate the festoons, rectal sac, and basis capitulum, respectively. Black scale bar: 500
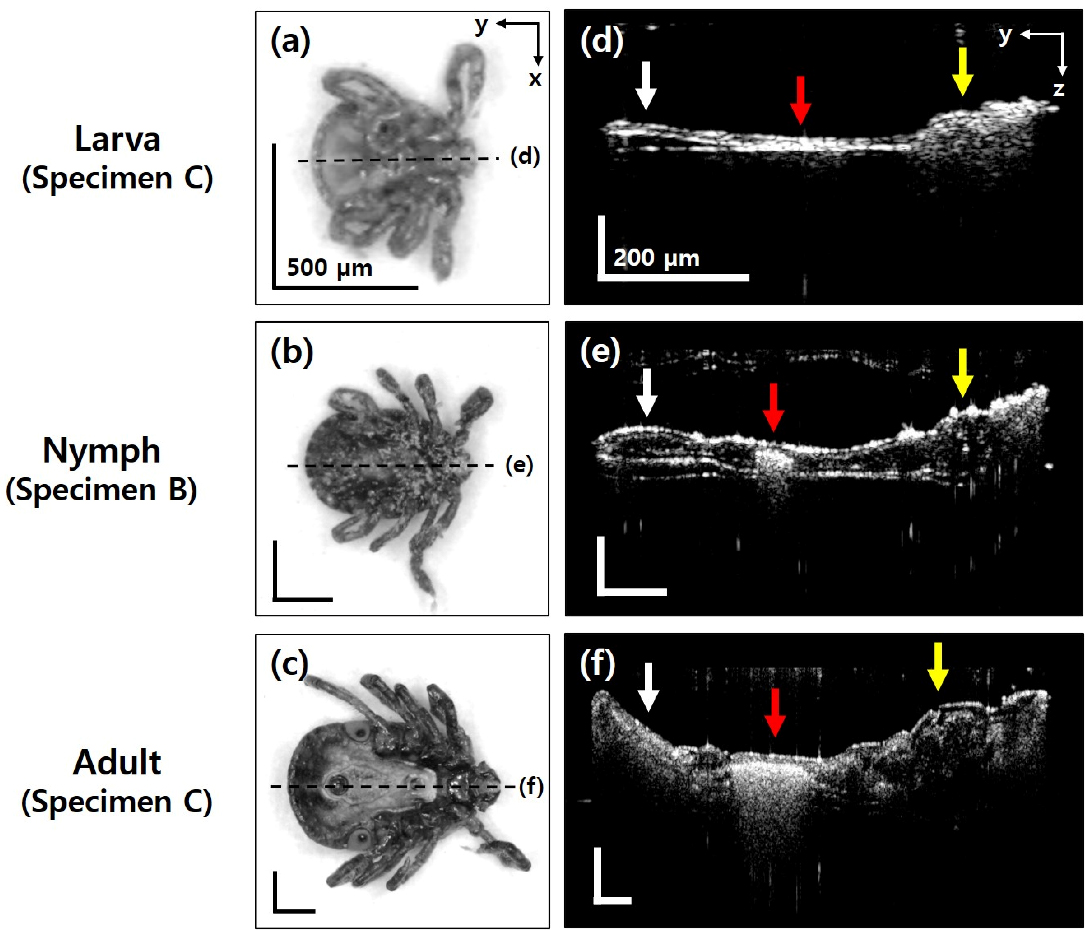
In addition to the frontal view (Fig. 2) and transverse view (Fig. 3), OCT cross-sectional images corresponding to the sagittal view were also acquired, since OCT imaging can provide tomographic images without limitation for the direction. Figure 4 shows the representative OCT cross-sectional images corresponding to the sagittal view for the tick specimens at each growth stage. The Specimens are larva Specimen (C), nymph Specimen (B), and adult Specimen (C), respectively. Figure 4a–c present the microscopic images in the ventral direction for each specimen, and the black dotted lines indicate the position of each corresponding OCT cross-sectional image plane. The OCT cross-sectional images covering from the head part to the end of festoons are presented in Fig. 4d–f, and the festoons, rectal sac, and basis capitulum are indicated in each image with the white, red, and yellow arrows, respectively. Both festoons and rectal sac increase in size and distribution as the growth progressed from larval to adult life, and the development of the basis capitulum marked with the yellow arrow is also confirmed.
Figure 5.
The representative A-scan profile and quantitative measurements of the organ sizes at different growth stages. (a) OCT cross-sectional image of adult specimen C (sagittal view). The red line indicates the position of the A-scan profile, which is the anus region. (b) A-scan profile of the anus site. (c) Numerical graph of the sizes of specific organs at each growth stage. Each value is the averaged size of all three specimens in each growth stage. error bar: standard deviation.
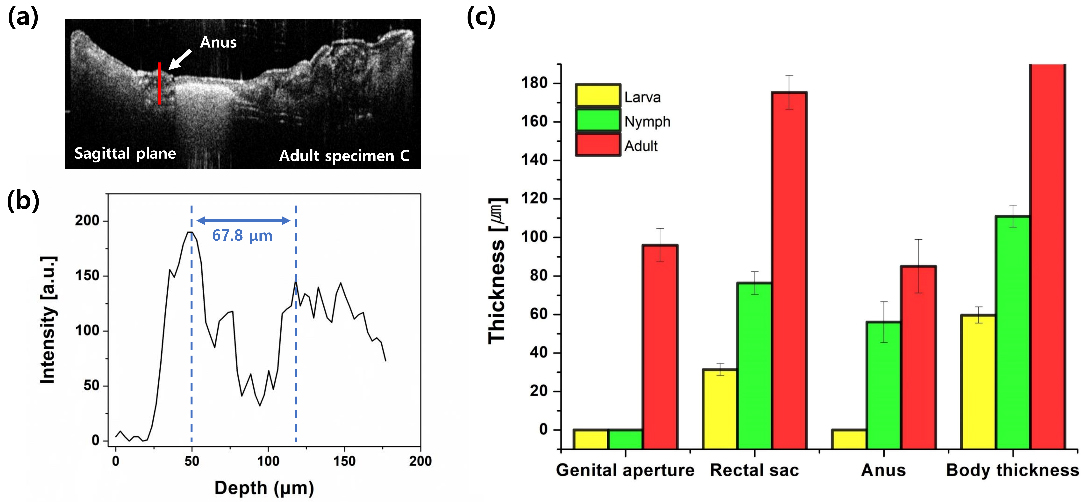
The size comparison of specific internal organs, according to the growth stages, is depicted in Fig. 5. Figure 5a and b are the representative OCT cross-sectional image and amplitude scan (A-scan) profile, respectively, that describe the measurement and analysis procedure of dimensions of specific organs toward the depth direction. The OCT cross-sectional image in Fig. 5a is for adult specimen C as the sagittal view, and the red line indicates the position of A-scan profile in Fig. 5b that is the site of the anus. The size of the anus in the depth direction was measured as 67.8
4.Discussion
In this study, we developed a customized spectral-domain optical coherence tomography to observe various internal and external organs of ticks and compare them according to the growth stage including larval, nymphal, and adult life. The developed system presented a proper performance to identify the internal morphology of tick specimens with the axial resolution of 6.2
The results show clear images of specific internal organs, such as the salivary glands, gut, rectal sac, and festoons, without damage to the specimens, which is the unavoidable drawback in the conventional dissecting method and several imaging techniques. In addition, the inner structures of the organs that protrude from the ventral surface, such as the anus, genital aperture, and basis capitulum, were also identified through the OCT cross-sectional images for sagittal and transverse views. Since the genital aperture and anus are the main reproductive and excretory organs, respectively, the morphological observations about them with comparing the changes according to the growth stages could be an important approach in the study of tick’s morphology. Although this structure can be also observed by the outer appearance, OCT imaging allows obtaining the visual information of the development process inside the body. To calculate the depth information for the acquired OCT images, we applied the refractive index of 1.5 that is for an exoskeleton of insects [49]. Every OCT images presented in this paper were reconstructed by averaging adjacent five B-scan images to reduce the background noise and enhance the image quality. The accuracy and validity of the acquired OCT images of the internal organs can be verified through the previous anatomical study by Edwards et al. [9].
As a result, we demonstrated the applicability of OCT for the morphological study of ticks. The notable advantages of OCT imaging that involve non-invasive and non-ionizing characteristics substantiated the feasibility of future studies, such as monitoring and comparing the inner morphological variation between the tick specimens that are carrying the virus (experimental group) and the control group.
5.Conclusion
In this study, we utilized a laboratory customized SD-OCT system to observe various internal organs and the appearance of the Ixodidae ticks (Haemaphysalis longicornis) in morphology. In particular, the specimens were prepared using different ticks from each growth stage, such as larvae, nymphs, and adults, to compare specific organs in each growth stage. The organ distribution inside each tick specimen was visualized through the OCT enface images, and major organs, such as the genital aperture, anus, festoons, rectal sac, and basis capitulum, were observed in the depth direction through the OCT cross-sectional images. In addition, the variation in size of the major organs was compared by averaging all specimens in each growth stage and presenting them as a bar graph to provide a comprehensive analysis of the novel imaging system. The real-time and non-destructive OCT results clearly confirm the potential merits of the proposed scheme over the conventional dissecting methods. To the best of our knowledge, this is the first study that identifies the morphological structures inside the ticks according to the different growth stages via OCT imaging. By confirming the feasibility of the OCT application in tick morphology research, it can be concluded that the study could contribute to several future studies in acarology.
Acknowledgments
This research was supported by the Kyungpook National University Development Project Research Fund, 2018, and by the Bio & Medical Technology Development Program of the NRF funded by the Korean government, MSIP (2017M3A9E2065282).
Conflict of interest
None to report.
References
[1] | Walker AR, Bouattour A, Camicas J-L, et al. Ticks of domestic animals in Africa: A guide to identification of species. Edinburgh (Scotland): Bioscience Reports; (2003) . |
[2] | Petney TN, Saijuntha W, Boulanger N, et al. Ticks (argasidae, ixodidae) and tick-borne diseases of continental Southeast Asia. Zootaxa (2019) ; 4558: : 1-89. |
[3] | Krause PJ, McKay K, Thompson CA, et al. Disease-specific diagnosis of coinfecting tickborne zoonoses: Babesiosis, human granulocytic ehrlichiosis, and lyme disease. Clinical Infectious Diseases (2002) ; 34: : 1184-1191. |
[4] | Liu Q, He B, Huang S-Y, et al. Severe fever with thrombocytopenia syndrome, an emerging tick-borne zoonosis. The Lancet Infectious Diseases (2014) ; 14: : 763-772. |
[5] | Dumler JS, Bakken JS. Ehrlichial diseases of humans: Emerging tick-borne infections. Clinical Infectious Diseases (1995) ; 20: : 1102-1110. |
[6] | Graves SR, Stenos J. Tick-borne infectious diseases in Australia. Med J Aust (2017) ; 206: : 320-324. |
[7] | Horn M, Nussbaumerová M, Šanda M, et al. Hemoglobin digestion in blood-feeding ticks: Mapping a multipeptidase pathway by functional proteomics. Chemistry & Biology (2009) ; 16: : 1053-1063. |
[8] | Kazimirova M, Stibraniova I. Tick salivary compounds: Their role in modulation of host defences and pathogen transmission. Frontiers in Cellular and Infection Microbiology (2013) ; 3: : 43. |
[9] | Edwards KT, Goddard J, Varela-Stokes AS. Examination of the internal morphology of the ixodid tick, amblyomma maculatum koch, (Acari: Ixodidae); a “How-to” pictorial dissection guide. Midsouth Entomol (2009) ; 2: : 28-39. |
[10] | Chu-Wang I-W, Axtell RC. Fine structure of ventral and lateral tarsal sensilla of the hard tick, amblyomma americanum1,2. Annals of the Entomological Society of America (1974) ; 67: : 453-457. |
[11] | Baker GT. Spiracular plate of nymphal and adult hard ticks (Acarina: Ixodidae): Morphology and cuticular ultrastructure. Invertebrate Biology (1997) ; 116: : 341-347. |
[12] | Kuhn KH, Haug T. Ultrastructural, cytochemical, and immunocytochemical characterization of haemocytes of the hard tick Ixodes ricinus (Acari; Chelicerata). Cell Tissue Res (1994) ; 277: : 493-504. |
[13] | Baldridge GD, Kurtti TJ, Burkhardt N, et al. Infection of Ixodes scapularis ticks with rickettsia monacensis expressing green fluorescent protein: A model system. Journal of Invertebrate Pathology (2007) ; 94: : 163-174. |
[14] | Wecker S, Hörnschemeyer T, Hoehn M. Investigation of insect morphology by MRI: Assessment of spatial and temporal resolution. Magnetic Resonance Imaging (2002) ; 20: : 105-111. |
[15] | Westneat MW, Betz O, Blob RW, et al. Tracheal respiration in insects visualized with synchrotron x-ray imaging. Science (2003) ; 299: : 558-560. |
[16] | Socha JJ, Westneat MW, Harrison JF, et al. Real-time phase-contrast x-ray imaging: a new technique for the study of animal form and function. BMC Biol (2007) ; 5: : 6. |
[17] | Fercher AF, Drexler W, Hitzenberger CK, et al. Optical coherence tomography – principles and applications. Rep Prog Phys (2003) ; 66: : 239-303. |
[18] | Popescu DP, Choo-Smith L-P, Flueraru C, et al. Optical coherence tomography: Fundamental principles, instrumental designs and biomedical applications. Biophys Rev (2011) ; 3: : 155. |
[19] | Wojtkowski M, Leitgeb R, Kowalczyk A, et al. In vivo human retinal imaging by fourier domain optical coherence tomography. J Biomed Opt (2002) ; 7: : 457-463. |
[20] | Wijesinghe RE, Park K, Kim P, et al. Optically deviated focusing method based high-speed SD-OCT for in vivo retinal clinical applications. Opt Rev (2016) ; 23: : 307-315. |
[21] | Lee J, Han S, Hwang J, et al. Identification of multi-dimensional thread geometry using depth-resolved swept-source optical coherence tomography for assessment of dental implant fabrication. Optics and Lasers in Engineering (2020) ; 127: : 105951. |
[22] | Wijesinghe RE, Cho NH, Park K, et al. Bio-photonic detection and quantitative evaluation method for the progression of dental caries using optical frequency-domain imaging method. Sensors (2016) ; 16: : 2076. |
[23] | Lee J, Kim K, Wijesinghe RE, et al. Decalcification using ethylenediaminetetraacetic acid for clear microstructure imaging of cochlea through optical coherence tomography. J Biomed Opt (2016) ; 21: : 081204. |
[24] | Wong BJF, Jackson RP, Guo S, et al. In vivo optical coherence tomography of the human larynx: Normative and benign pathology in 82 patients. Laryngoscope (2005) ; 115: : 1904-1911. |
[25] | Mogensen M, Thrane L, Joergensen TM, et al. Optical coherence tomography for imaging of skin and skin diseases. Semin Cutan Med Surg (2009) ; 28: : 196-202. |
[26] | Welzel J. Optical coherence tomography in dermatology: A review. Skin Res Technol (2001) ; 7: : 1-9. |
[27] | Lee J, Wijesinghe RE, Jeon D, et al. Clinical utility of intraoperative tympanomastoidectomy assessment using a surgical microscope integrated with an optical coherence tomography. Sci Rep (2018) ; 8: : 17432. |
[28] | Boppart SA, Herrmann J, Pitris C, et al. High-resolution optical coherence tomography-guided laser ablation of surgical tissue. Journal of Surgical Research (1999) ; 82: : 275-284. |
[29] | Wijesinghe RE, Lee S-Y, Ravichandran NK, et al. Optical coherence tomography-integrated, wearable (backpack-type), compact diagnostic imaging modality for in situ leaf quality assessment. Appl Opt, AO (2017) ; 56: : D108-D114. |
[30] | Lee J, Lee S-Y, Wijesinghe RE, et al. On-field in situ inspection for marssonina coronaria infected apple blotch based on non-invasive bio-photonic imaging module. IEEE Access (2019) ; 7: : 148684-148691. |
[31] | Shirazi MF, Park K, Wijesinghe RE, et al. Fast industrial inspection of optical thin film using optical coherence tomography. Sensors (2016) ; 16: : 1598. |
[32] | Liu P, Groves RM, Benedictus R. 3D monitoring of delamination growth in a wind turbine blade composite using optical coherence tomography. NDT & E International (2014) ; 64: : 52-58. |
[33] | Garcez AS, Suzuki SS, Ribeiro MS, et al. Biofilm retention by 3 methods of ligation on orthodontic brackets: A microbiologic and optical coherence tomography analysis. American Journal of Orthodontics and Dentofacial Orthopedics (2011) ; 140: : e193-e198. |
[34] | Bradu A, Ma L, Bloor JW, et al. Dual optical coherence tomography/fluorescence microscopy for monitoring of drosophila melanogaster larval heart. J Biophotonics (2009) ; 2: : 380-388. |
[35] | Choi KS, Wijesinghe RE, Lee C, et al. In vivo observation of metamorphosis of plodia interpunctella hübner using three-dimensional optical coherence tomography. Entomological Research (2017) ; 47: : 256-262. |
[36] | Brown K, Harvey M. Optical coherence tomography: Age estimation of calliphora vicina pupae in vivo? Forensic Science International (2014) ; 242: : 157-161. |
[37] | Boppart SA, Brezinski ME, Bouma BE, et al. Investigation of developing embryonic morphology using optical coherence tomography. Developmental Biology (1996) ; 177: : 54-63. |
[38] | Smith DJ. Ultimate resolution in the electron microscope? Materials Today (2008) ; 11: : 30-38. |
[39] | Zarraoa L, González MU, Paulo ÁS. Imaging low-dimensional nanostructures by very low voltage scanning electron microscopy: Ultra-shallow topography and depth-tunable material contrast. Sci Rep (2019) ; 9: : 16263. |
[40] | Guo B, Zhang X, Zhang J, et al. High-resolution phase-contrast imaging of biological specimens using a stable betatron X-ray source in the multiple-exposure mode. Sci Rep (2019) ; 9: : 7796. |
[41] | Brezinski ME. Optical Coherence Tomography: Principles and Applications. Elsevier, (2006) . |
[42] | Hagelin PM, Solgaard O. Optical raster-scanning displays based on surface-micromachined polysilicon mirrors. IEEE Journal of Selected Topics in Quantum Electronics (1999) ; 5: : 67-74. |
[43] | Agrawal A, Pfefer TJ, Woolliams PD, et al. Methods to assess sensitivity of optical coherence tomography systems. Biomed Opt Express, BOE (2017) ; 8: : 902-917. |
[44] | Elliott C, Vijayakumar V, Zink W, et al. National instruments LabVIEW: A programming environment for laboratory automation and measurement. JALA (2007) ; 1: : 17-24. |
[45] | Kalkman J. Fourier-domain optical coherence tomography signal analysis and numerical modeling. International Journal of Optics (2017) ; 2017: : e9586067. |
[46] | Yamaguti N, Tipton V, Keegan H, et al. Ticks of Japan, Korea, and the Ryukyu Islands. Brigham Young University Science Bulletin, Biological Series; (1971) . |
[47] | Vanderhoof-Forschner K. Everything You Need to Know About Lyme Disease and Other Tick-Borne Disorders. John Wiley & Sons, (2004) . |
[48] | Loru L, Sassu A, Fois X, et al. Ethyl acetate: A possible alternative for anaesthetizing insects. Annales de la Société Entomologique de France (NS) (2010) ; 46: : 422-424. |
[49] | Callahan PS. Insect bioelectronics: A theoretical and experimental study of insect spines as dielectric tubular waveguides. IFAC Proceedings Volumes (1968) ; 2: : 303-310. |


