
Technical aspects and validation of custom digital algorithms for hand volumetry
Abstract
BACKGROUND:
Establishing baseline measurements on normative data is essential to evaluate standards of care and the impact of clinical or surgical treatments. Hand volume determination is relevant in pathological conditions where the anatomical structures might undergo modifications like post-treatment chronic edema. For example, one of the consequences of breast cancer treatment is the possibility of developing uni-lateral lymphedema on the upper limbs.
OBJECTIVE:
Arm and forearm volumetrics are well-studied techniques, whereas hand volumetry computation poses several challenges both from the clinical and digital perspectives. The current work has explored routine clinical and customized digital methodologies for hand volume appraisal on healthy subjects.
METHODS:
Clinical hand volumes computed by water displacement or circumferential measurements were compared to digital volumetry calculated from 3D laser scans. Digital volume quantification algorithms exploited the gift wrapping concept or cubic tessellation of acquired 3D shapes. This latter digital technique is parametric, and a calibration methodology to define the resolution of the tessellation has been validated.
RESULTS:
Results on a group of normal subjects demonstrated that the volumes computed from digital hand representations extracted by tessellation return values similar to the clinical water displacement volume assessment at low tolerances.
CONCLUSIONS:
The current investigation suggested that the tessellation algorithm could be considered a digital equivalent of water displacement for hand volumetrics. Future studies are needed to confirm these results in people with lymphedema.
1.Introduction
Calculating anatomical volumes of human body parts is relevant in several aspects of physical medicine and rehabilitation, ranging from muscular characterization to limb edema appraisal. Upper limb volume assessment could be computed directly on the patient’s arm using the circumferential method or water displacement [1]. Circumferential measurement (i.e., CM) is a clinical quantification methodology involving the determination of limb girth using a tape at equispaced points along the arm starting from the wrist. After measuring the limb’s circumferences, the total arm volume is computed by summing up each segment’s volume calculated by the truncated cone formula using the measured circumferences as bases [2]. For hand volumetry, a single frustum or multiple subdivisions could be applied. However, bony landmarks might be undetectable in several conditions affecting the hand volume, such as lymphedema, with crucial implications in volumetric assessment [3]. Water displacement (i.e., WD) is a theoretically precise but laborious procedure requiring the evaluation of the mass of water overflowing from a tank after limb immersion. Although WD is currently considered the “gold standard” for the volumetric assessment of hand and wrist in patients with lymphedema, several barriers still affect its integration in routine clinical settings [4]. Constraints include a time-consuming procedure with bulky equipment, the presence of hospital-specific protocols, it is discouraged in the presence of skin lesions, and it might suffer inter- and intra-observer variations in the assessment [5, 6, 7, 8, 9, 10]. Between the two clinical methodologies, the WD is considered more reliable for upper limbs volumetrics [5]. Alternatively, health professionals could estimate limb volumes from surface maps acquired by digital instruments such as three-dimensional laser scanners (i.e., 3DLS), perometers, computerized axial tomography, or magnetic resonance. Digital techniques acquire imaging data through sensors to create computerized reconstructions of anatomical shapes in three-dimensional space [11]. Volumetry from direct anatomical measurements or by digital devices is not invasive and applicable in clinical settings; however, the predictions provided by these methodologies of the actual unknown anatomical volume could show discrepancies [12]. This uncertainty is more evident in specific body sectors such as the hands due to the peculiar structure of the palm and fingers that allow movements on a total of 27 degrees of freedom [13]. Moreover, divergences might be exacerbated in pathological conditions like lymphedema [9].
In lymphedema management, a precise volumetric assessment is a cornerstone in supporting diagnosis and monitoring the therapeutic effects of complete decongestive therapies [10]. On the other hand, growing literature is now focusing on the precise management of this disabling condition, with increasing reports underlining the role of a precise assessment of patients with upper limb lymphedema [14, 15]. Despite these considerations, evidence about the optimal volumetric assessment of the hand is still lacking. Furthermore, to the best of our knowledge, several methods are currently used in clinical practice with detrimental consequences in treatment comparison and follow-up among different centers [14, 16, 17]. In this scenario, digital innovation solutions might improve the volumetric assessment of the hand, providing easy-to-use tools and saving time in a precise assessment of upper limb volume. The study aims to compare clinical and digital methods for hand volumetry, finding a digital equivalent or acceptable replacement for the clinical methods. Indeed, providing alternatives to clinical measurements could fill the knowledge gap about the optimal digital volume approximation approaches, and computerized volumetrics might improve the clinical care management of patients with upper limb lymphedema.
2.Materials and methods
The present study focused on hand volumetry by running a pilot examination of normative data comparing clinical and digital volumes. Except where otherwise indicated, all units of measurement for the volumes were in cubic decimeters. Twenty-one volunteers were recruited to gather the empirical evidence from September 2021 to September 2022, and their hands were scanned using a portable 3DLS. Inclusion criteria were the following: a) adult subjects (aged more than 18 years); b) absence of any condition able to modify arm structure and volume; c) agreed to participate in the study and signed written informed consent. We excluded participants with: a) skin lesions in the upper limb; b) cardiovascular diseases; c) vascular pathologies; d) lymphatic disease; e) traumas at the upper limb level. The scanned arm has been saved as a textured OBJ mesh file by the device, and the software kit in [18] was employed for data processing and volume assessment. The software consists of three independent programs (Edit 3D, Cut 3D, and Slice 3D) with peculiar features and characteristics. In the current study, the digital volumetrics exploiting the gift-wrapping algorithms of the software were evaluated in their similarity to the clinical outcomes. In addition, novel gift-wrapping or cubic tessellation strategies were tested. The gift-wrapping algorithm (i.e., GW) calculates the volume by finding the smallest convex set that encloses the data. Conversely, tessellation (i.e., TE) discretizes the 3D hand representation into elementary shapes and sums up each unit volume. Another difference between TE and GW is that the first is a parametric procedure. For this reason, an initial calibration has been proposed for tuning the resolution parameter of the tessellation. The custom algorithms proposed in the present study, and studied to assess specifically hand volume, were:
• A TE algorithm sub-dividing the hand shape into cubes with edge size determined by the resolution parameter during the calibration phase. The TE volume was the sum of the volumes of all cubes.
• A GW customized algorithm, already included in the Cut 3D app and called “Estimated Volume” in the textual report. In Cut 3D, this customized volume is the sum of nine sub-volumes obtained by dividing the data into smaller portions along the major axis. This strategy has been analyzed in [18] to reduce the overestimation that may affect the standard GW formulation when handling specific 3D shapes characterized by tortuosities or higher complexity levels. In Cut 3D, the number of sections is fixed to nine because optimized for arm volume estimation. However, during the current study, the splitting strategy might range from five to nine sections to verify the best fit for hand volumes.
Figure 1.
Two views of convex envelope edges (black lines) enclosing the scanned hand vertices (red dots) by the gift wrapping algorithm. On the right an example of hand tessellation.
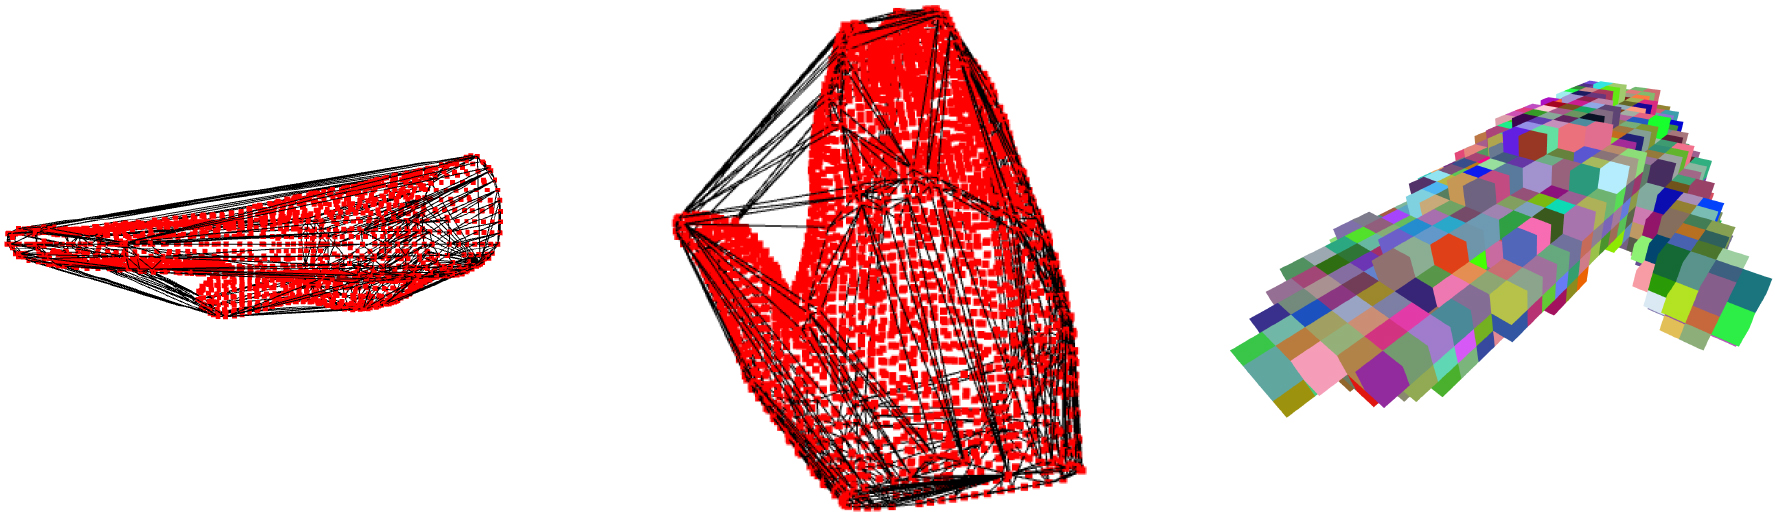
The Fig. 1 shows examples of how GW and TE algorithms work on scanned surfaces. While wrapping the scanned hand with a convex closure, the GW algorithm might include regions of space outside the anatomical shape if the thumb is not constrained. When this happens, the resulting GW-related volume might overestimate the actual hand volume, which is a relevant problem for the hand due to the peculiar position of the thumb that allows opponency movements. For this reason, during 3DLS acquisition, the thumb was fixed to the palm with adhesive tape on all subjects. The TE algorithm instead summed all the volumes of every cubic element, and the thumb position might not affect the final value.
2.1Clinical data collection
The volunteers included in the study were seven males and fourteen females, with a mean age of 30.95
2.2Digital preprocessing
Initially, limb meshes have been edited by the program Edit 3D to select the same hand portion measured clinically. Then, all hands meshes were aligned along the major length axis and saved for customized volumetric analysis. The files were in Stanford Polygon “PLY” file format. At the same time, Edit 3D calculated the hand volume in the standard GW algorithm implementation [21]. The customized version of GW volume was obtained by importing the 3D hand object into the Cut 3D program. In Cut 3D, the final report contains an “Estimated Volume”, which is the sum of nine volumes obtained by dividing the scanned body part into sections along the major axis. This strategy has been previously studied to reduce the overestimation that may affect the standard GW formulation on arms characterized by pathological conditions deforming the anatomical structures. In the current investigation, the number of sections to determine the Cut 3D “Estimated Volume” volume varied from five to nine, to validate which value better models hand data. Being hands smaller than arms, it might be possible that a lower number of portions might produce better results than the nine sections implementation of Cut 3D. In addition, this test will help to judge if the Cut 3D software should be updated in a future version, allowing users to insert the number of sections for fine-tuning the volume of different parts of the human body.
2.3TE parameter calibration
The TE algorithm subdivides the hand space into elementary cubic units: the user determines unit size by setting a resolution parameter. To determine the resolution of TE, one could scan the hands of a population and select the parameter producing a TE volume closer to the average hand volume obtained by WD or CM. However, it might be time-consuming, so current work demonstrated an alternative approach using a 3D template object for tuning the TE resolution. Hand measurements were collected from the size charts of glove makers [22]. These measures could be employed to build a template object to adjust the resolution of the tessellation. For the hand, glove manufacturers provide: hand length from the tip of the third finger to wrist, the breadth that is the width of the palm, and the circumference of the palm excluding the thumb. The reference values were reported in Table 1. From circumference and breadth, and using the Eq. (1), it could be possible to detect hand thickness at the palm. The palm’s circumference might be associated with the shape of a stretched 2D ellipse and the breadth the extent of its main axis. In Eq. (1),
(1)
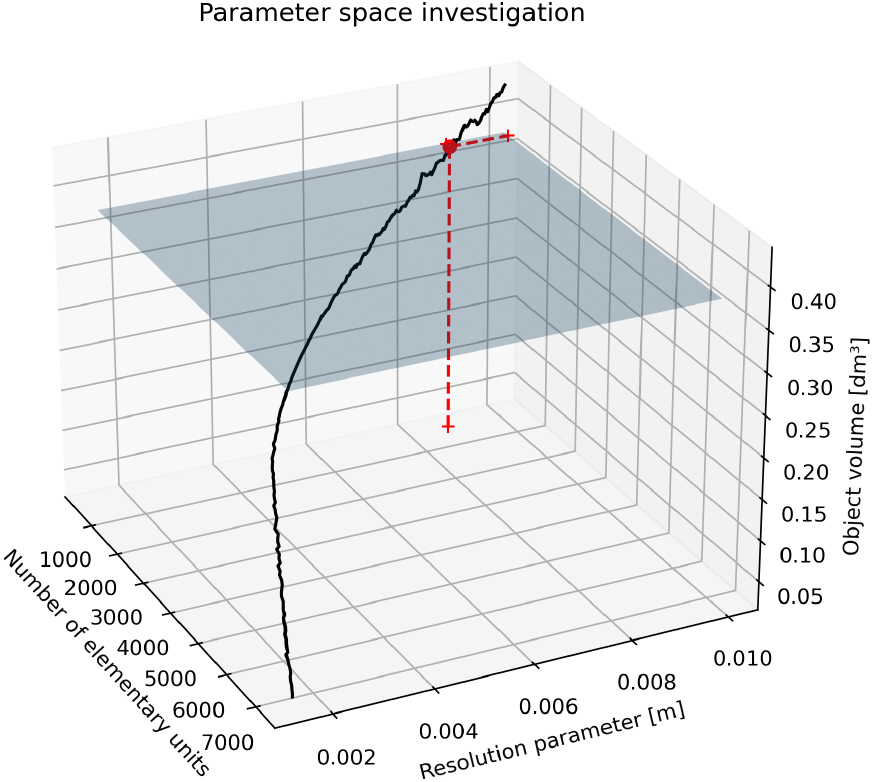
By knowing the average hand’s length, width, and height, these measurements could be associated with the axes of a 3D ellipsoid. This geometric shape is usually employed in robotics to model the hand [23, 24, 25, 26]: it could represent a simplified surrogate of hand anatomy and a template for TE resolution tuning (Fig. 2). The ellipsoid volume acted as a reference value to determine the resolution parameter of the TE algorithm. Calibration aimed to find the resolution of the TE volume closer to the estimated volume of the 3D ellipsoid; the volume of the 3D ellipsoid was computed digitally, triangulating its contour (Fig. 3). To take into account gender characteristics, two ellipsoids were modeled separately for men and women. Both meshes constructed on the 3D ellipsoids were watertight; thus, the volumes could be safely computed programmatically. The volume of both ellipsoids was the ground truth to fix the resolution of the TE volumes by exploring the parameter space of all possible resolutions and resulting TE volumes. The resolution corresponding to the TE volume closer to the men and female 3D ellipsoid volume was chosen. The search for the best resolution was exemplified in the Figs 4 and 5. The planes represented the calculated 3D ellipsoid volumes, while the sequence of black dots was the series of TE volumes obtained at different resolutions. The intersection points (the red dots in the Figures) ensuring a TE volume closer to the template volume has been selected as optimum. The resolution obtained was 8.73 millimeters corresponding to a tessellation of 567 cubes for male ellipsoid template, and 4.09 millimeters giving a tessellation of 1496 cubes in women. The average resolution was 6.415 millimeters, and this value has been set to calculate TE hand volumes on the subjects.
Table 1
Average hand sizes in centimeters from glove size charts
| Average length | Average breadth | Average circumference | |
|---|---|---|---|
| Male | 19.31 | 8.89 | 21.84 |
| Female | 17.272 | 7.87 | 17.78 |
Figure 2.
3D ellipsoid built using average hand measurements.
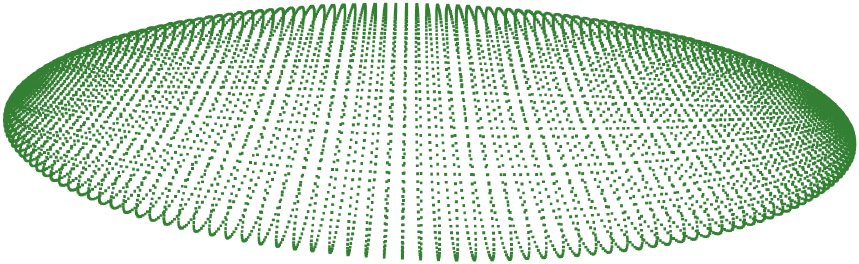
Figure 3.
Mesh built over the countour of the 3D ellipsoid.
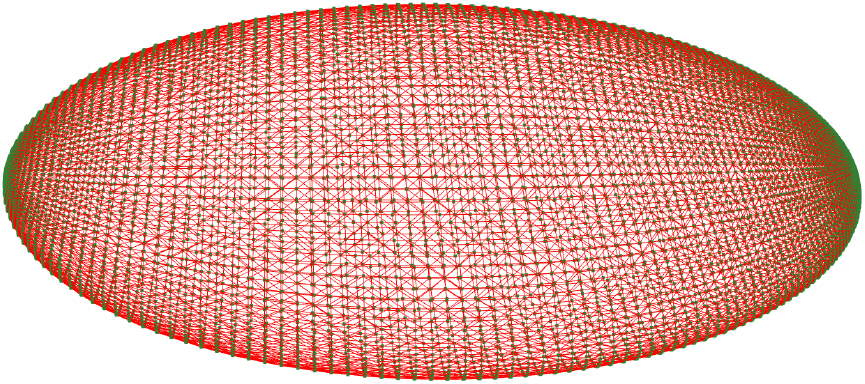
Figure 4.
TE parameter determination on male template.

2.4Notes on statistical analysis
When comparing results from two methods, one would like to estimate the sources of analytical error given by two components: systematic error and random error [27]. Systematic error affects validity, while random error is connected with the concept of reliability. These two types of errors sum up due to the involvement of multiple factors or causes. Systematic error, approximated by the bias in Bland-Altman analysis, is the over or underestimation of one method against the other [28]. The bias affects the degree of agreement between the methodologies under study, with a negative bias implying an overestimation of the second method compared to the first. Random error is related to chance and inherent in the methodologies; thus, it cannot be eliminated. Usually, it is controlled by enlarging the sample size and is associated with the concept of imprecision. The random error could be delineated through the coefficient of variation [29]. In the current study, a separate assessment of both errors was made (Sections 3.1 and 3.2).
Table 2
Mean and standard deviation of each volume across subjects
| Mean | CV (%) | Median | ||||
|---|---|---|---|---|---|---|
| Volume type | Right | Left | Right | Left | Right | Left |
| WD | 0.2812 | 0.2752 | 15.61 | 12.95 | 0.27 | 0.26 |
| CM | 0.3385 | 0.3352 | 22.19 | 22.77 | 0.32 | 0.324 |
| GW | 0.4384 | 0.4287 | 19.23 | 20.63 | 0.42 | 0.4119 |
| GW Par 5 | 0.3618 | 0.3452 | 19.6 | 23.1 | 0.3504 | 0.3209 |
| GW Par 6 | 0.3531 | 0.3324 | 19.24 | 23.24 | 0.3518 | 0.3149 |
| GW Par 7 | 0.3445 | 0.3261 | 19.6 | 25.08 | 0.3439 | 0.3108 |
| GW Par 8 | 0.3375 | 0.3161 | 19.85 | 26.12 | 0.3369 | 0.2989 |
| GW Par 9 | 0.3301 | 0.307 | 19.72 | 27.22 | 0.3257 | 0.2906 |
| TE | 0.2831 | 0.2754 | 11.49 | 12.93 | 0.2765 | 0.2701 |
All measures in dm
Figure 5.
TE parameter determination on female template.
In clinical practice, precision is the degree to which measurements from different methods agree, usually expressed as the percentage coefficient of variation. The coefficient of variation (CV) is a unitless measure of variability, with higher values meaning that the standard deviation is far from the mean [30]. Analyzing CV values of Table 2 for TE and WD, they are close to each other. At the same time, higher variability could be found between the clinical methods CM and WD or the other volumetrics. Using Eq. (2.4) as found in [31], the acceptance limits due to errors in laboratory measurements could be calculated assuming the volumes expected to be identical in 95% of the assessments. The imprecision is quantified as a 95% confidence interval around zero, the value expected in case of no difference between methods.
(2)
Additionally, the agreement of the methods in terms of statistical equivalence [32] was covered by Section 3.3. Equivalence testing is widespread in the analytical similarity evaluation of drugs through a two-sided
The similarity between clinical and digital volumes was evaluated by TOST performing two independent one-sided
In practice, by executing TOST, the equivalence between methodologies is established at a certain significance level
Figure 6.
Significance of
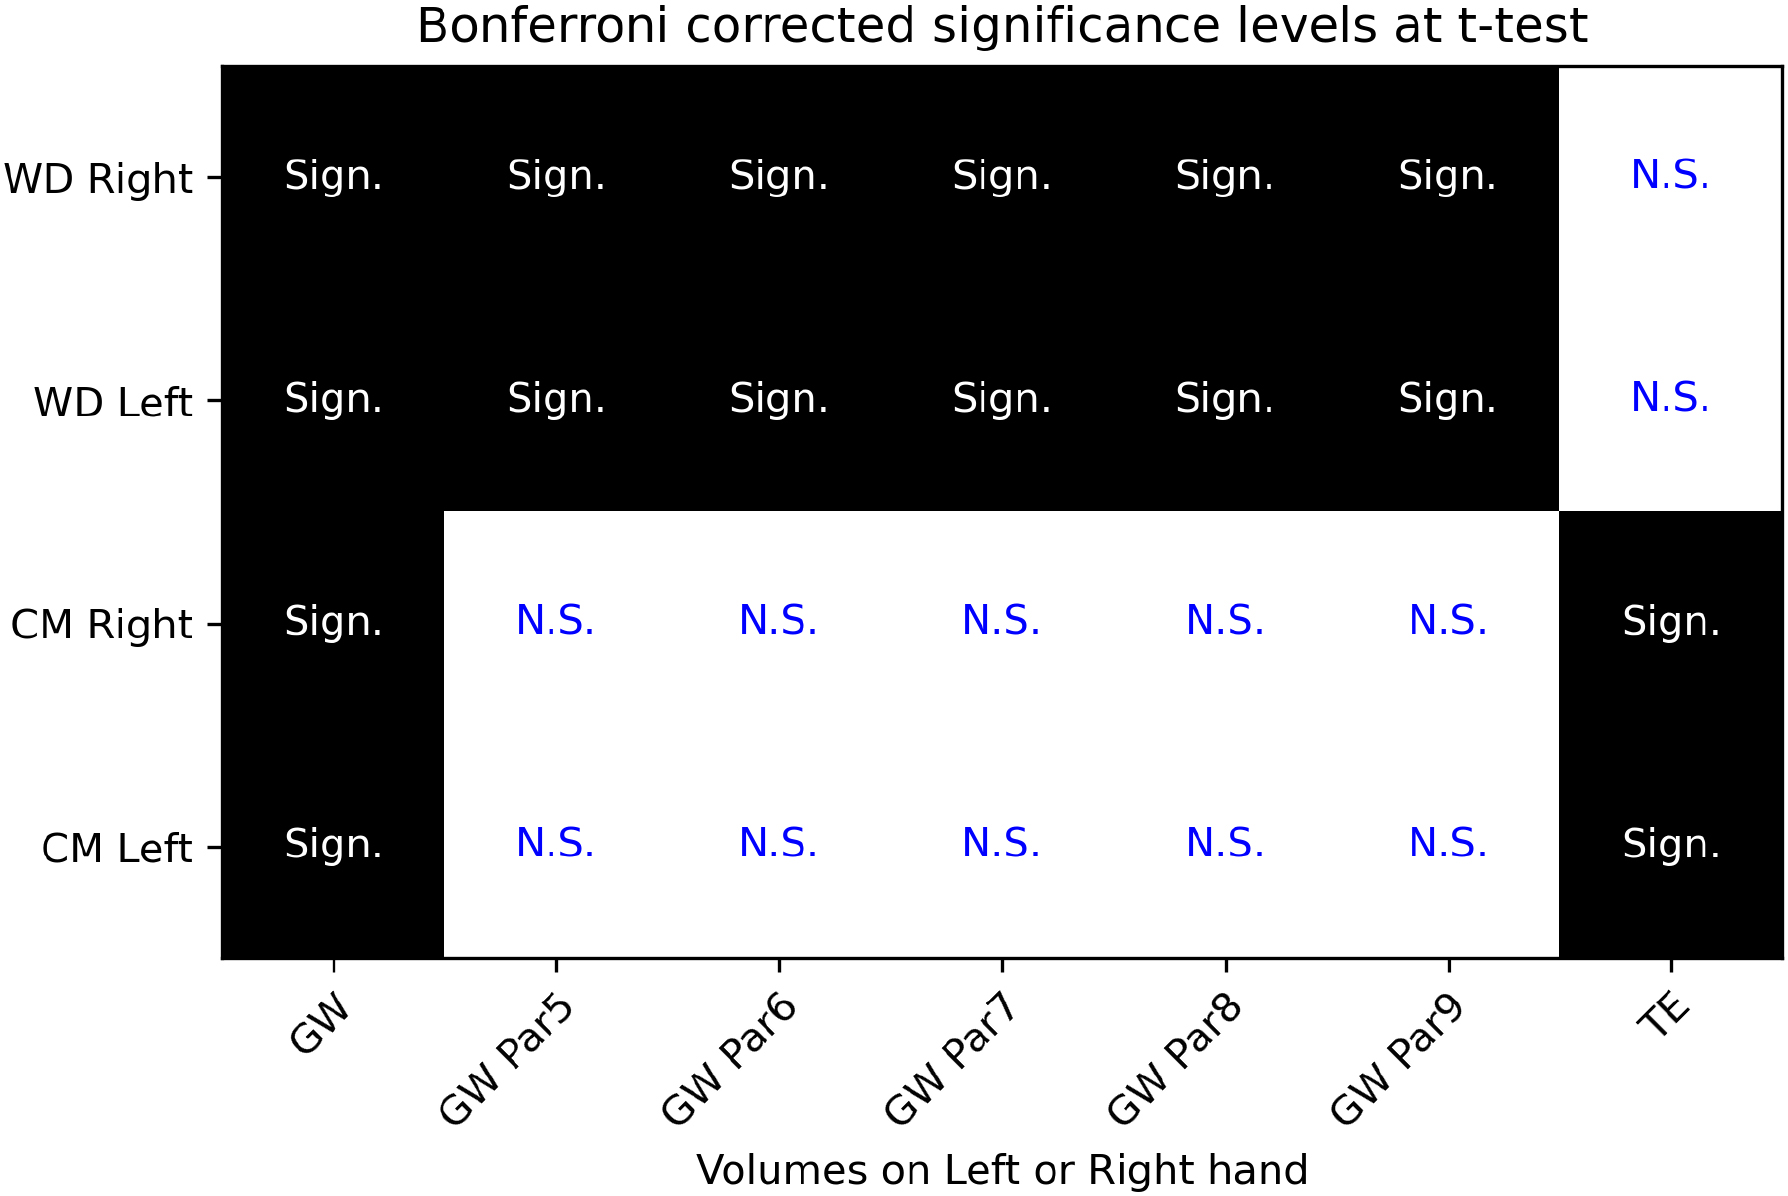
3.Results
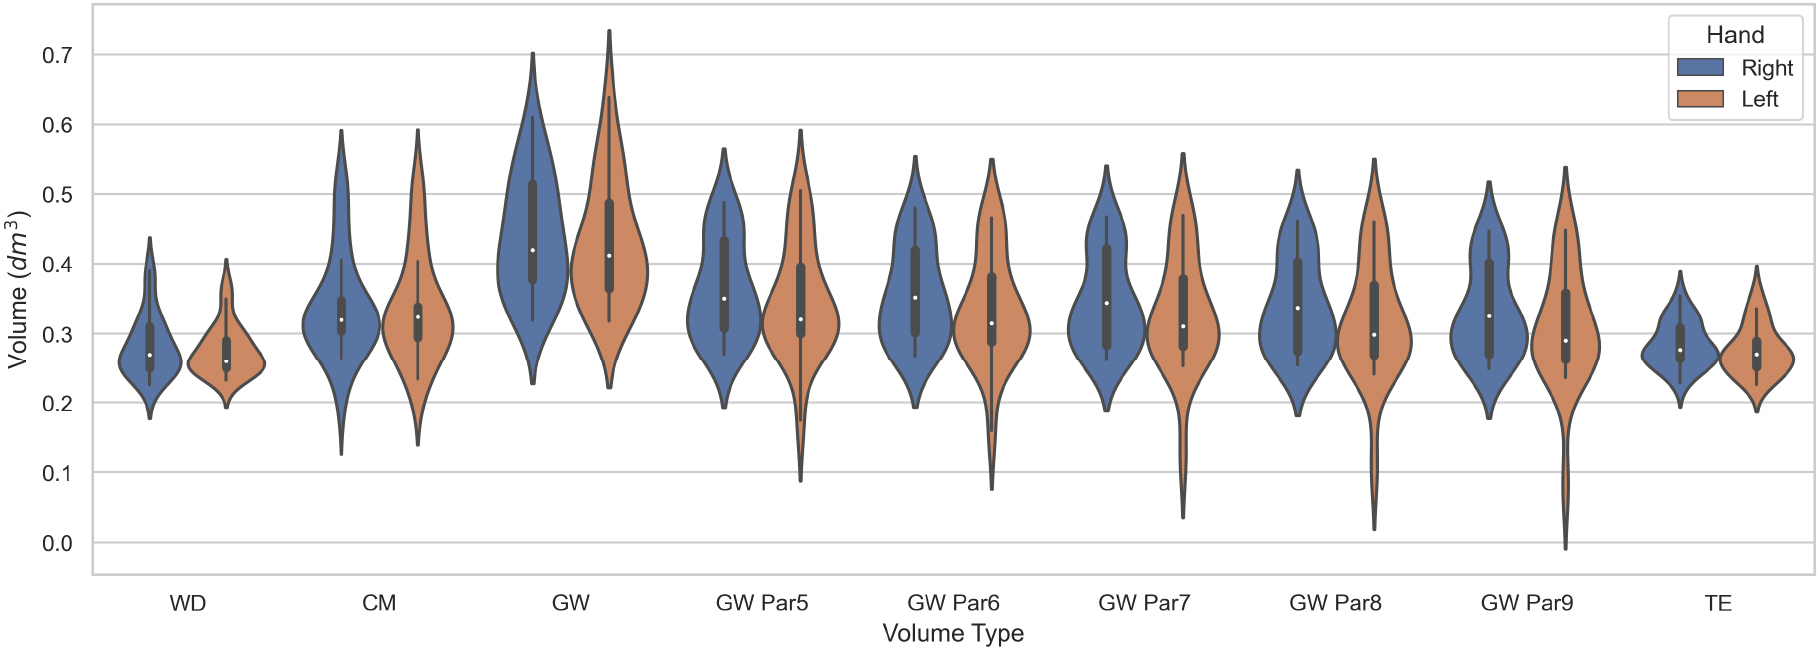
The descriptive statistics for each volume are included in Table 2 with additional statistics included in Appendix A. As general morphological consideration, there is a difference in the volumes of the right and left hands for the recorded subjects in all volumetry except CM, where the side difference is less prominent. The volume “GW Par9” is the “Estimated volume” of Cut 3D with nine partitions of the scanned object, while the remaining custom GW volumes were tested in the current investigation. The volume “GW” is the output of the Edit 3D program.
Figure 7.
Violin plots of the digital and clinical volumes distribution.
Statistical evaluation of the results was performed by
3.1Bland-Altman analysis
Figure 8.
Bias between WD and other volumetrics on right and left hands. Red dot is the systematic difference, while the line extents represent the limits of agreement (L.O.A.).
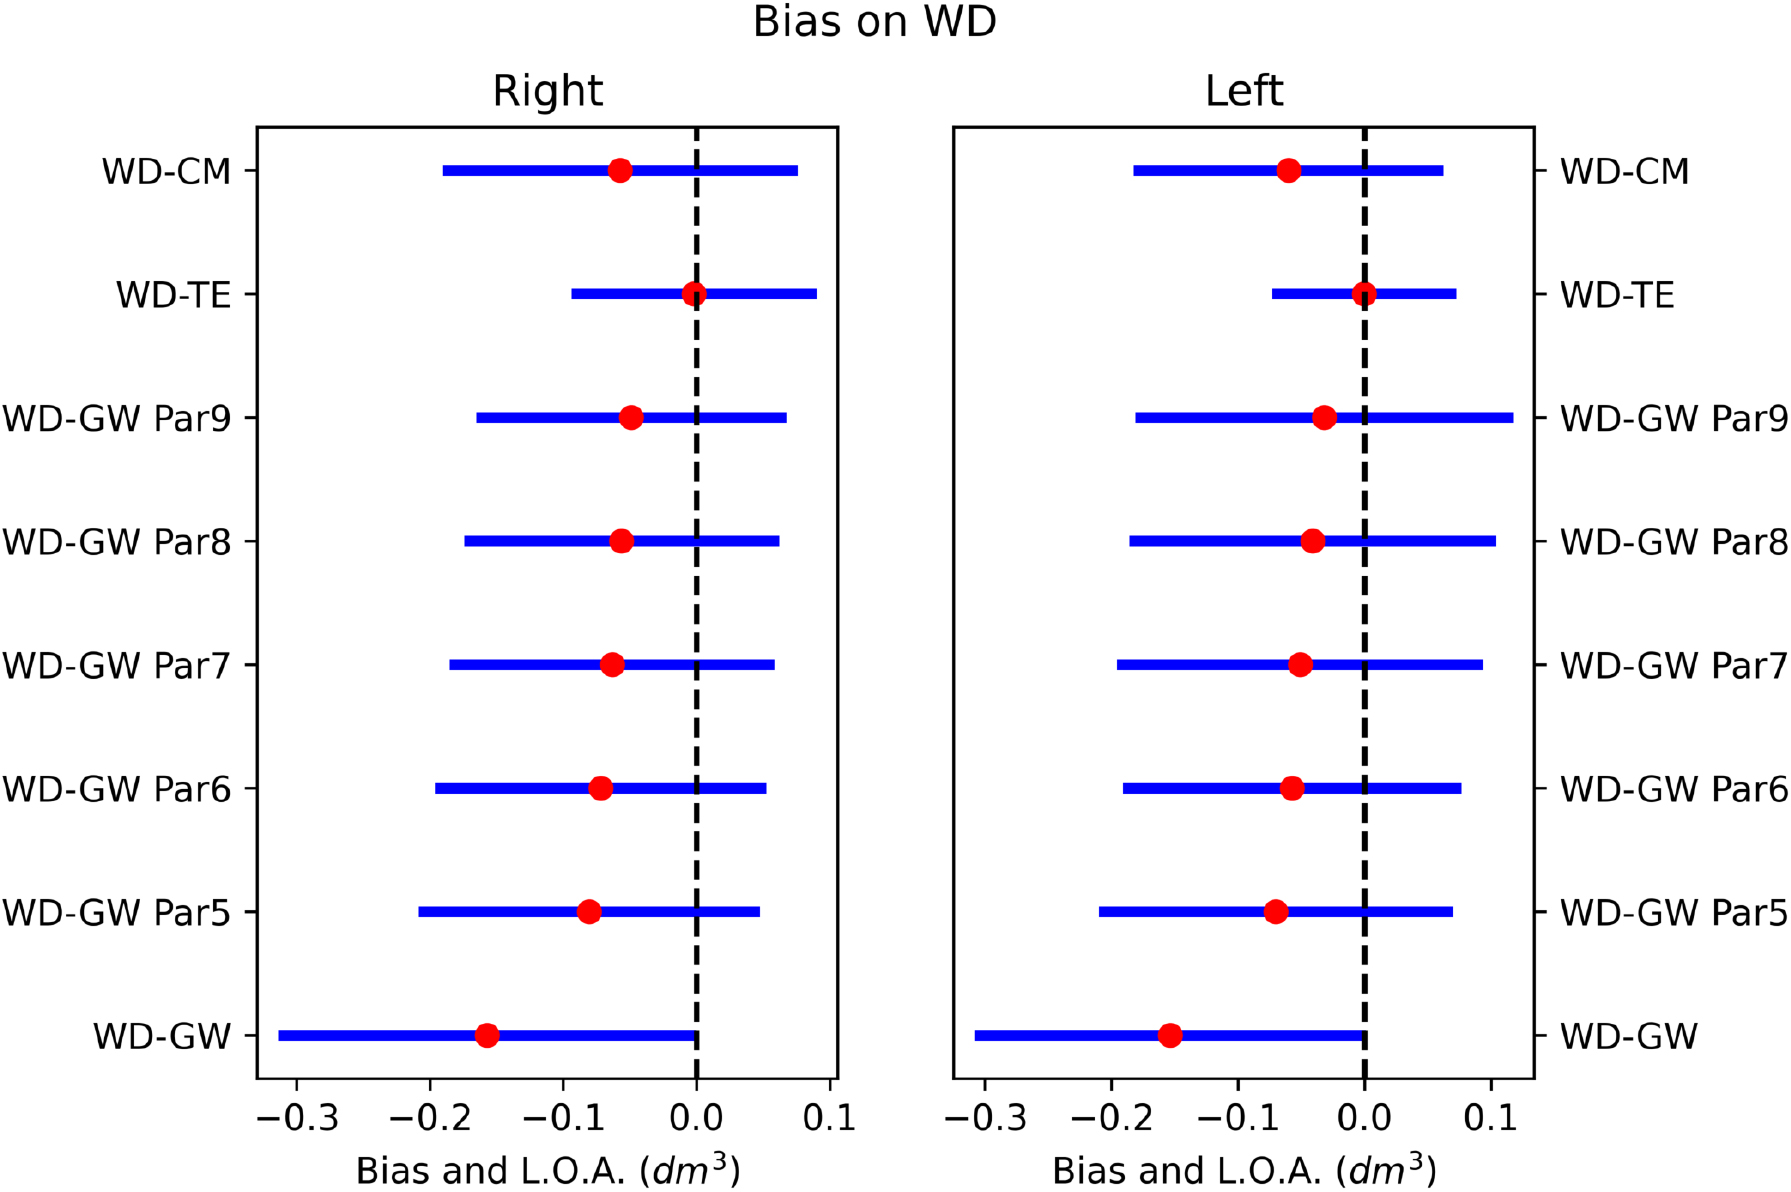
Figure 9.
Bias between CM and other volumetrics on right and left hands. Red dot is the systematic difference, while the line extents represent the limits of agreement (L.O.A.).
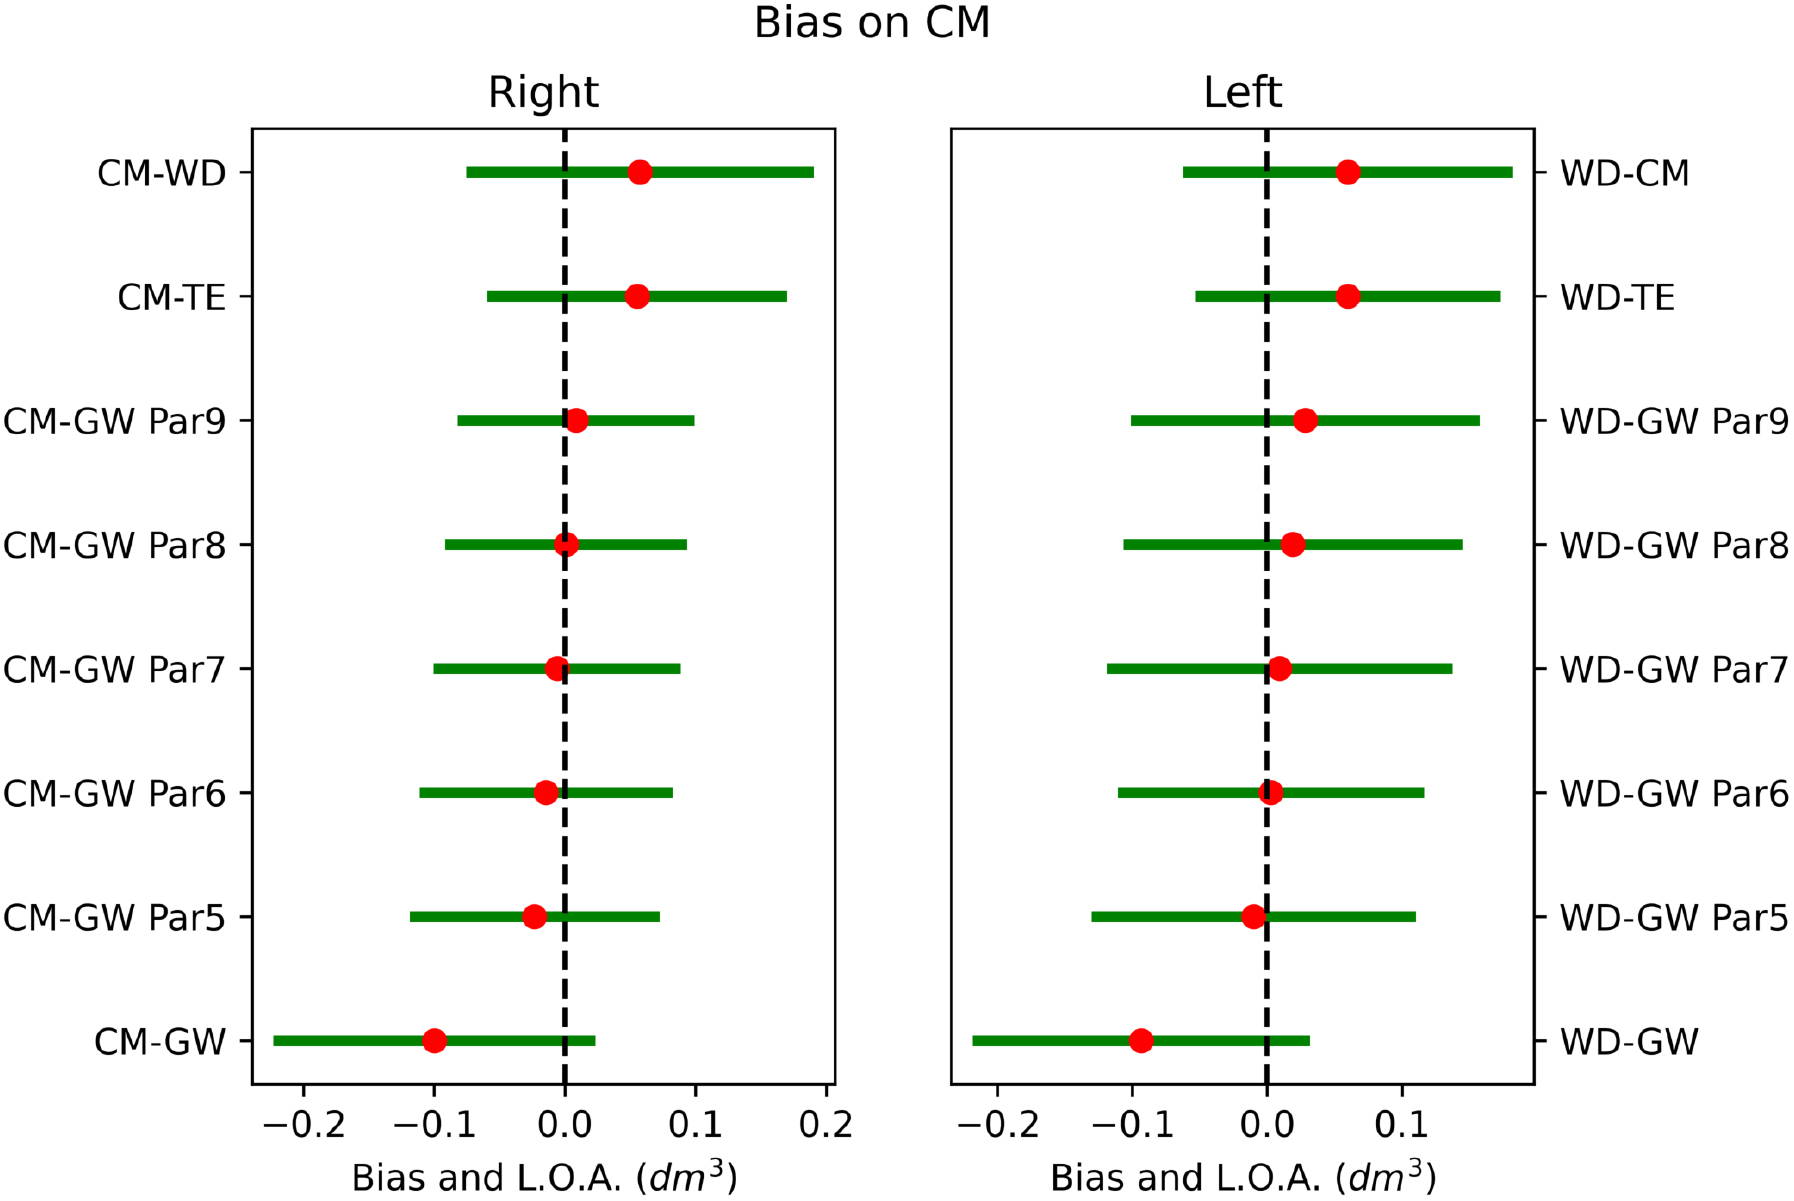
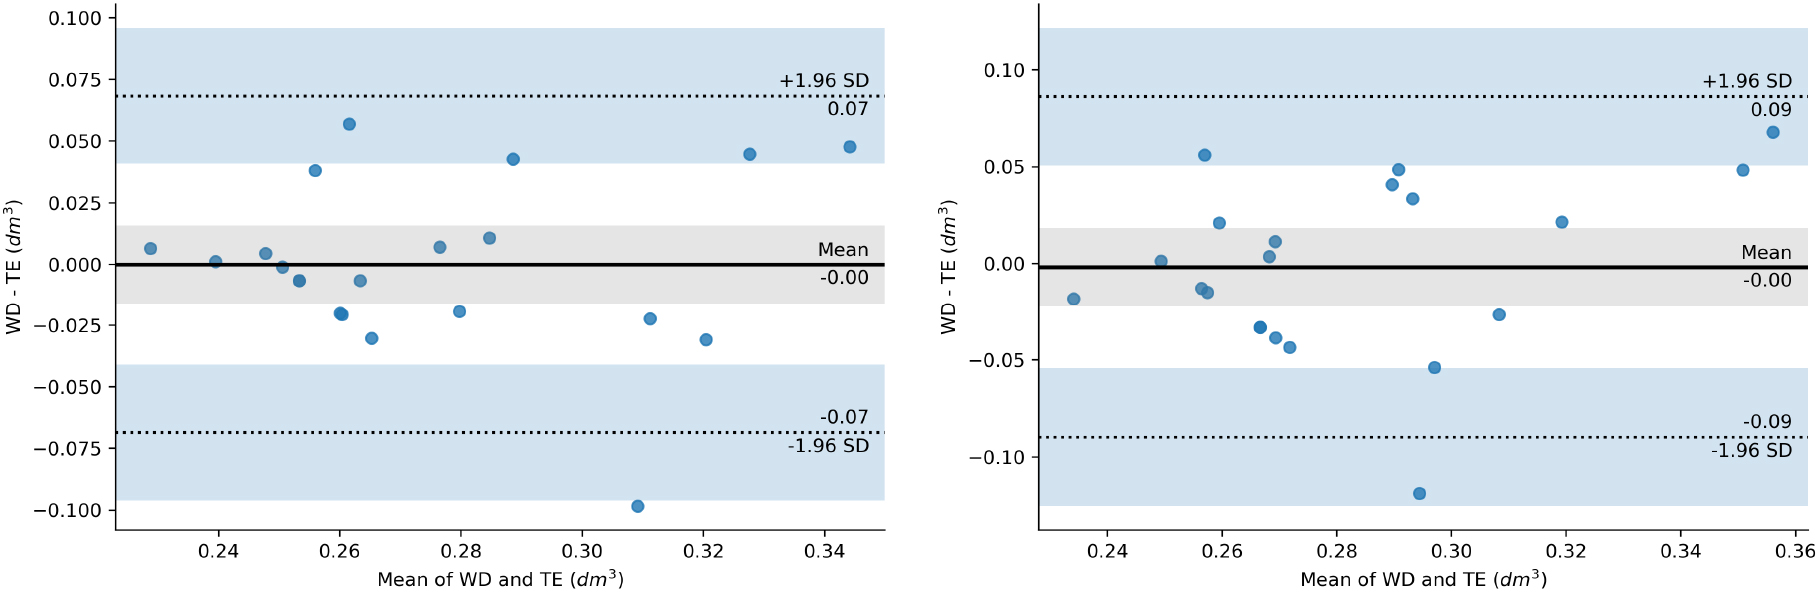
The agreement between methods was investigated through the Bland-Altman analysis to highlight the systematic errors. The complete analysis of the systematic errors between methodologies was illustrated graphically in Figs 8 and 9. The systematic differences were represented as red dots with range of agreement calculated as
Figure 10.
Bland-Altman mean difference plot between WD and TE on left hand (left image) and right hand (right image).
3.2Imprecision between methods
Figure 11.
Inherent imprecision between volumes of the left hand.
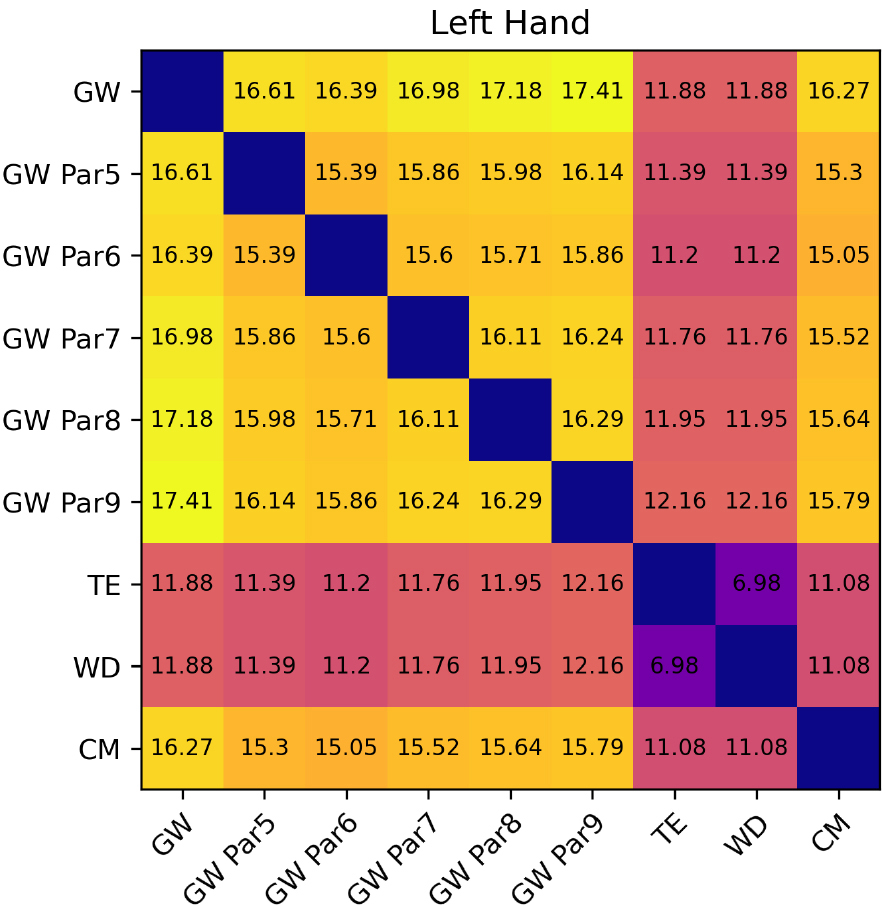
Figure 12.
Inherent imprecision between volumes of the right hand.
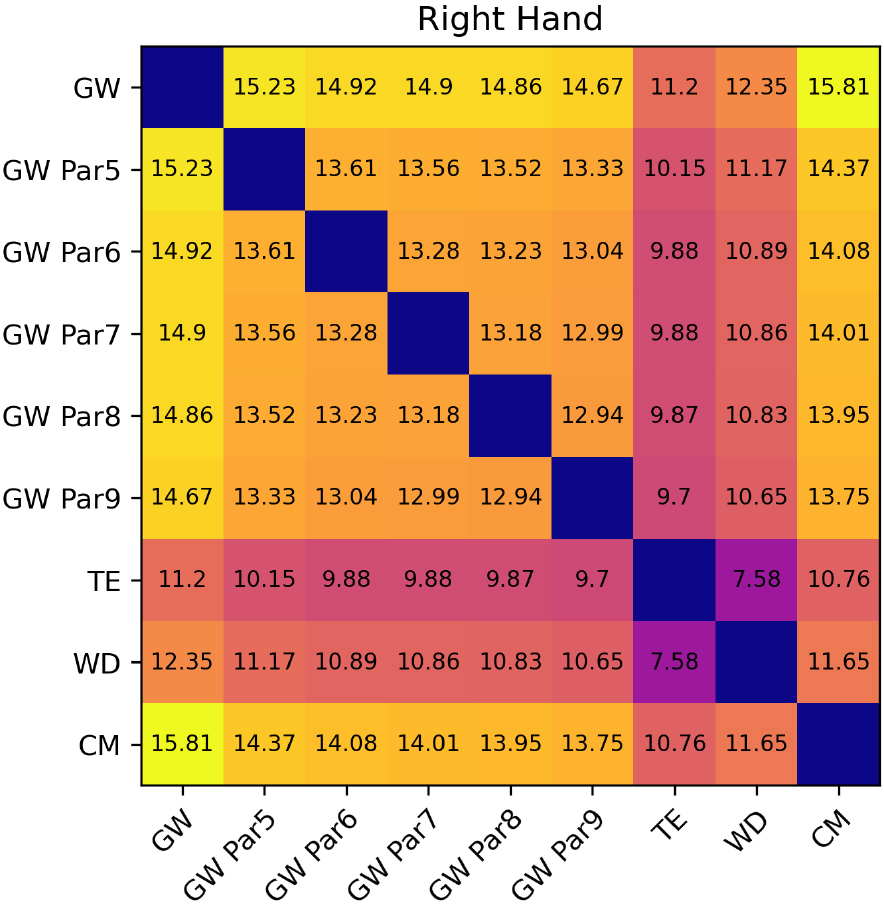
For WD and TE inherent imprecision of the methods could be estimated as
3.3Equivalence analysis
Figure 13.
TOST between WD and TE applying decreasing regulatory boundaries
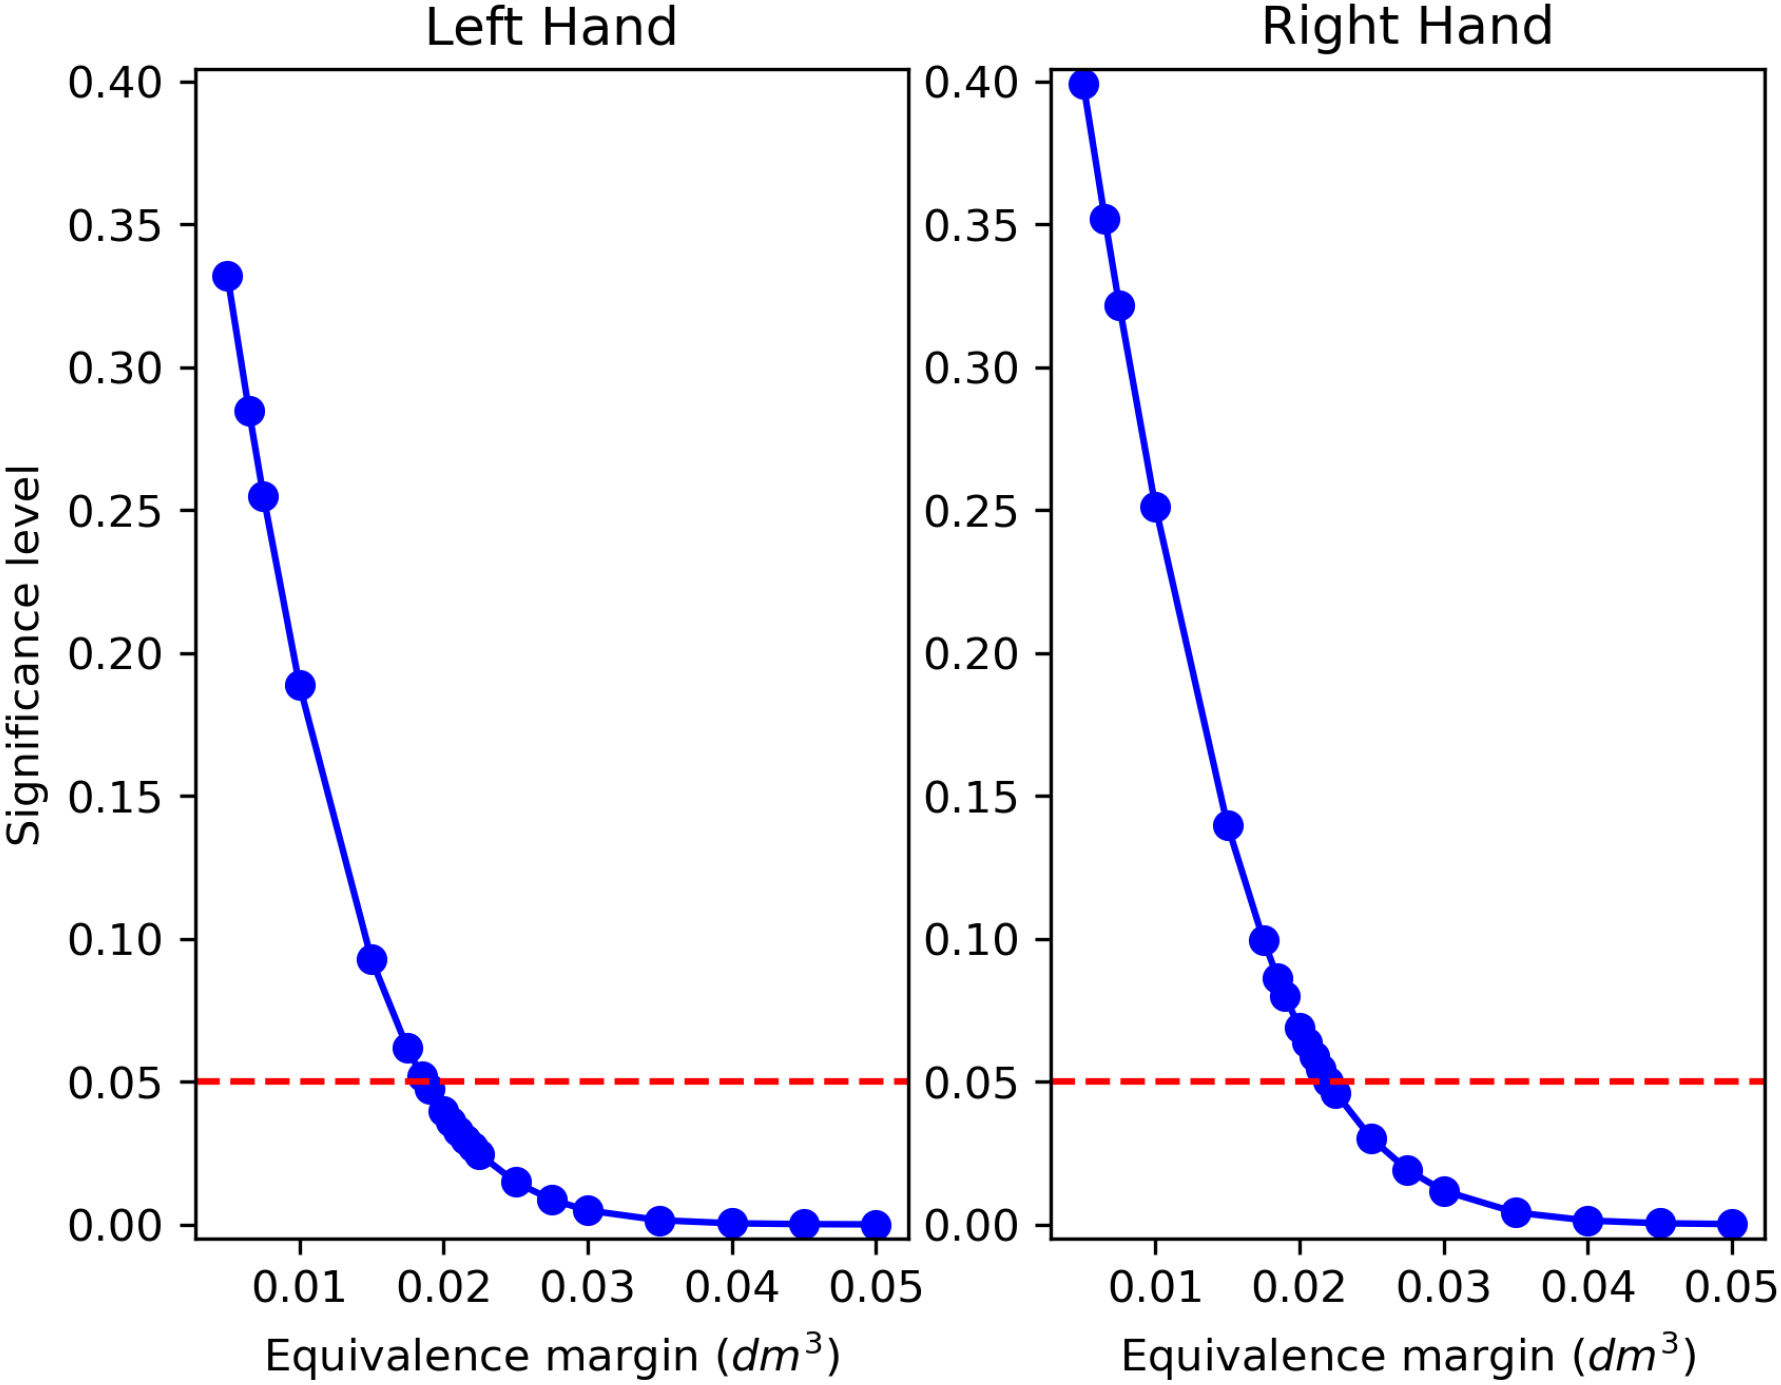
Figure 14.
TOST between CM and custom GW volumes applying decreasing regulatory boundaries
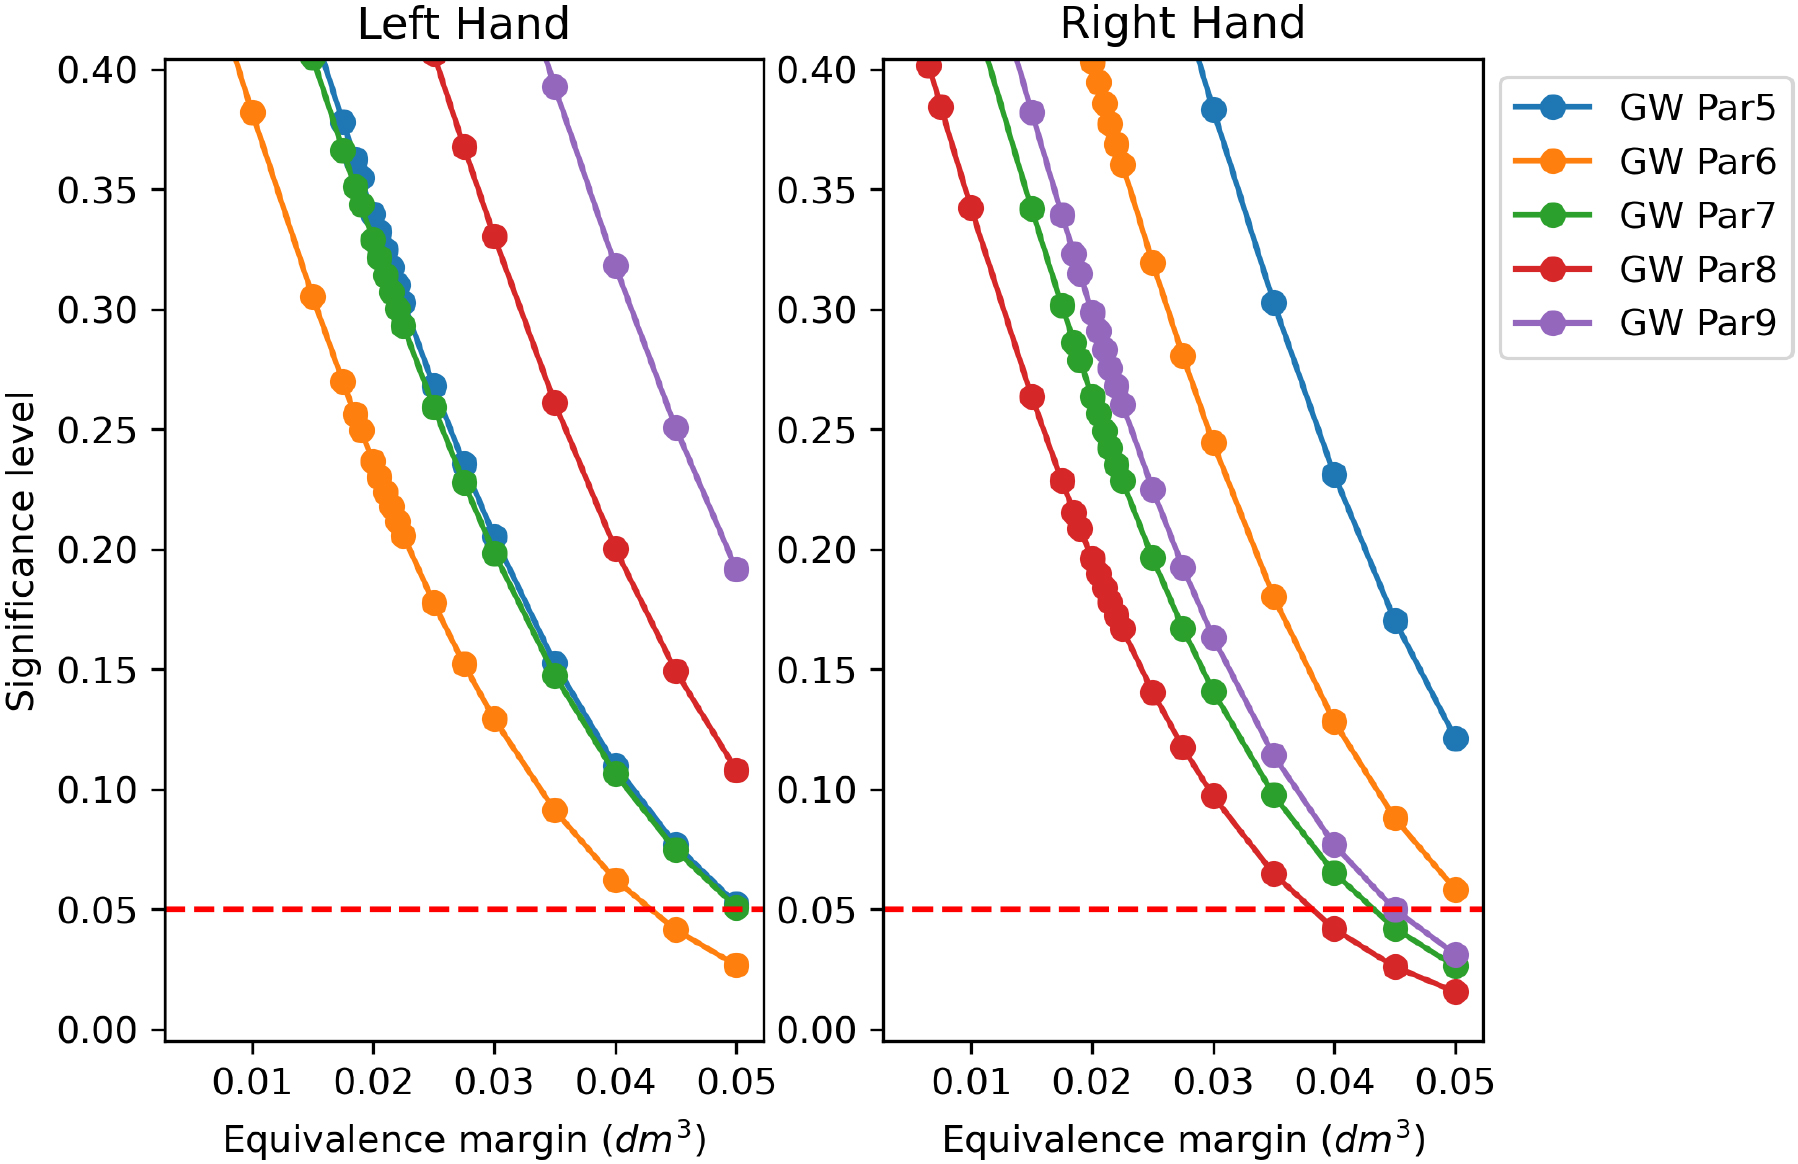
Figure 13 collects the TOST
4.Discussion
Conformity assessment between medical devices or procedures is essential to harmonize operational standards between centers. Recent literature proposed several ways to address this issue, as demonstrated in [42, 43]. In the present study, the digital volumetry of the hand has been compared to clinical methods by addressing systematic and random components of measurement errors in medical practice. Two major classes of digital volumes were investigated: volumes estimated from the envelope obtained by GW or by tessellation of the scanned shape. This latter procedure requires the identification of a parameter setting the resolution of cube edges. A calibration procedure has been proposed using a template object built from standard hand measures obtained by glove manufacturers. Employing the tuned parameter after calibration to fix the TE resolution, TE volumes were computed for all subjects. The digital TE volumes showed remarkable similarity to the WD clinically computed ones.
The proposed calibration using a simplified template object was conceived as a stand-alone operation without requiring experimental data collection. For this reason, an advantage of this calibration methodology is that after inserting average hand data, a computer manages the calculations in the back end. This calibration algorithm could be suitable for being included in digital volumetry programs, and the user might get the TE algorithm automatically adjusted. Intriguingly, also in [2], authors proposed an ellipsoid method to address hand volume. As a minor consideration regarding the calibration procedure, the average hand values were estimated on the size charts of gloves available for the US population (Table 1). In contrast, these values might be slightly lower in Europe. Adjusting the reported values to the average European hand for men or women, it might be possible to obtain even closer results to the clinical ground truth.
In Section 3.3 equivalence testing showed good accordance between TE and WD. The concept of equivalence is fundamental because it establishes the “interchangeability” of two measurements when one method could replace the other [44]. Upon accepting the alternative hypothesis of TOST, it could be concluded that the methods under investigation do not differ more than the equivalence margin
As the last remark, the software kit presented in [18] has been updated with the present results of the numerical experiments, introducing the tessellation TE volume optimized for the hand in the Cut 3D app. Additionally, the “Estimated volume” of the same program has been customized by replacing the previous fixed nine partitions volume with five custom GW-based volumes in the textual report, as shown in the current work. In [57], the authors quantified in 2.5$ per measured section the cost to assess the volume with the circumferential method, whereas the volume deducted from CT digital scans was evaluated at 100$. Costs included equipment, materials, and personnel employed. Indeed, free-of-charge software might facilitate the diffusion of digital volumetry, reducing the expenses of patient follow-up and management.
5.Conclusion
The current study investigated digital methods to evaluate hand volumes, comparing the outcomes to clinical procedures. The proposed tessellation algorithm was equivalent to the water displacement method at low equivalence margins. The imprecision of the methods was also the lowest among those tested. Custom gift-wrapping algorithms produced results closer to the clinical method based on circumferential measurements but less precise than the TE and WD pair. Statistical analysis determined that the tessellation algorithm could be considered a digital equivalent of water displacement for hand volumetrics at low tolerances. Numerical experiments also proved a fast and reliable experimental calibration scheme for adjusting the tessellation’s resolution. Future studies will evaluate the feasibility of such a methodology on pathological subjects.
Funding
This project has received funding from the European Union’s Horizon 2020 research and innovation program under the Marie Sklodowska Curie grant agreement No 860462.
Conflict of interest/competing interests
The authors declare that the research was conducted in the absence of any commercial or financial relationships that could be construed as a potential conflict of interest.
Ethics approval
The study was conducted in accordance with the national research committee and with the 1964 Helsinki Declaration and its later amendments or comparable ethical standards. The study was approved by the Institutional Review Board of Alessandria Hospital (PROLI-CAMA, decision number 0008662, April 20th, 2021).
Consent to participate
Informed consent was obtained from all individual participants included in the study.
Code availability
The TE and the custom GW at different partitions algorithms have been included in the latest version of the Cut 3D app (10.5281/zenodo.7243978).
The software is downloadable from Zenodo. The user guide is available at https://mn-visions.gitbook.io/software-kit-for-3dls-limb-volume-quantification/, including a video tutorial with the procedure for hand volume estimation.
Authors’ contributions
MN (manuscript draft and editing, digital volumes conceptualization and coding, numerical experiments, visualization, formal analysis, statistics), LL (manuscript draft and editing, clinical volumetry data collection and calculation), NF (manuscript revision), AdS (manuscript revision), MI (supervision, manuscript revision), LR (funding acquisition, project administration).
Acknowledgments
This project has received funding from the European Union’s Horizon 2020 research and innovation program under the Marie Sklodowska Curie grant agreement No 860462.
References
[1] | Pappalardo M, Starnoni M, Franceschini G, Baccarani A, De Santis G. Breast cancer-related lymphedema: Recent updates on diagnosis, severity and available treatments. Journal of Personalized Medicine. (2021) ; 11: (5): 402. |
[2] | Mayrovitz HN, Sims N, Hill CJ, Hernandez T, Greenshner A, Diep H. Hand volume estimates based on a geometric algorithm in comparison to water displacement. Lymphology. (2006) ; 39: (2): 95-103. |
[3] | Lee MJ, Boland RA, Czerniec S, Kilbreath SL. Reliability and concurrent validity of the perometer for measuring hand volume in women with and without lymphedema. Lymphatic Research and Biology. (2011) ; 9: (1): 13-18. |
[4] | Boland R, Adams R. Development and evaluation of a precision forearm and hand volumeter and measuring cylinder. Journal of Hand Therapy. (1996) ; 9: (4): 349-357. |
[5] | Sander AP, Hajer NM, Hemenway K, Miller AC. Upper-extremity volume measurements in women with lymphedema: A comparison of measurements obtained via water displacement with geometrically determined volume. Physical Therapy. (2002) ; 82: (12): 1201-1212. |
[6] | Campbell JL, Coyer FM, Osborne SR. The skin safety model: reconceptualizing skin vulnerability in older patients. Journal of Nursing Scholarship. (2016) ; 48: (1): 14-22. |
[7] | Taylor R, Jayasinghe UW, Koelmeyer L, Ung O, Boyages J. Reliability and validity of arm volume measurements for assessment of lymphedema. Physical Therapy. (2006) ; 86: (2): 205-214. |
[8] | Deltombe T, Jamart J, Recloux S, Legrand C, Vandenbroeck N, Theys S, et al. Reliability and limits of agreement of circumferential, water displacement, and optoelectronic volumetry in the measurement of upper limb lymphedema. Lymphology. (2007) ; 40: (1): 26-34. |
[9] | Meijer RS, Rietman JS, Geertzen JH, Bosmans JC, Dijkstra PU. Validity and intra-and interobserver reliability of an indirect volume measurements in patients with upper extremity lymphedema. Lymphology. (2004) ; 37: (3): 127-133. |
[10] | Invernizzi M, Runza L, De Sire A, Lippi L, Blundo C, Gambini D, et al. Integrating augmented reality tools in breast cancer related lymphedema prognostication and diagnosis. JoVE (Journal of Visualized Experiments). (2020) ; (156): e60093. |
[11] | McKinnon JG, Wong V, Temple WJ, Galbraith C, Ferry P, Clynch GS, et al. Measurement of limb volume: Laser scanning versus volume displacement. Journal of Surgical Oncology. (2007) ; 96: (5): 381-388. |
[12] | Armer JM. The problem of post-breast cancer lymphedema: Impact and measurement issues. Cancer Investigation. (2005) ; 23: (1): 76-83. |
[13] | Karges JR, Mark BE, Stikeleather SJ, Worrell TW. Concurrent validity of upper-extremity volume estimates: Comparison of calculated volume derived from girth measurements and water displacement volume. Physical Therapy. (2003) ; 83: (2): 134-145. |
[14] | de Sire A, Losco L, Lippi L, Spadoni D, Kaciulyte J, Sert G, et al. Surgical treatment and rehabilitation strategies for upper and lower extremity lymphedema: A comprehensive review. Medicina. (2022) ; 58: (7): 954. |
[15] | Kim G, Smith MP, Donohoe KJ, Johnson AR, Singhal D, Tsai LL. MRI staging of upper extremity secondary lymphedema: Correlation with clinical measurements. European Radiology. (2020) ; 30: (8): 4686-4694. |
[16] | Ridner S, Montgomery L, Hepworth J, Stewart B, Armer J. Comparison of upper limb volume measurement techniques and arm symptoms between healthy volunteers and individuals with known lymphedema. Lymphology. (2007) ; 40: (1): 35-46. |
[17] | Landau MJ, Kim JS, Gould DJ, Patel KM. Vectra 3D Imaging for Quantitative Volumetric Analysis of the Upper Limb: A Feasibility Study for Tracking Outcomes of Lymphedema Treatment. Plastic and Reconstructive Surgery. (2018) ; 141: (1): 80e-84e. |
[18] | Nascimben M, Lippi L, Fusco N, Invernizzi M, Rimondini L. A software suite for limb volume analysis applicable in clinical settings: upper limb quantification. Frontiers in Bioengineering and Biotechnology. (2022) ; 10. Available from: https://www.frontiersin.org/article/10.3389/fbioe.2022.863689. |
[19] | Committee E, et al. The diagnosis and treatment of peripheral lymphedema: 2016 consensus document of the International Society of Lymphology. Lymphology. (2016) ; 49: (4): 170-184. |
[20] | Nair D. Principles and Practice of decongestive lymphatic therapy. DeepesTissues: Wounds Australia newsletter. (2018) ; 30-31. |
[21] | Barber CB, Dobkin DP, Huhdanpaa H. The quickhull algorithm for convex hulls. ACM Transactions on Mathematical Software (TOMS). (1996) ; 22: (4): 469-483. |
[22] | PalmFlex. Glove Sizing. Available from: https://www.palmflex.com/glove-sizing.html. |
[23] | Buchholz B, Armstrong TJ. A kinematic model of the human hand to evaluate its prehensile capabilities. Journal of Biomechanics. (1992) ; 25: (2): 149-162. |
[24] | Prattichizzo D, Malvezzi M, Gabiccini M, Bicchi A. On the manipulability ellipsoids of underactuated robotic hands with compliance. Robotics and Autonomous Systems. (2012) ; 60: (3): 337-346. |
[25] | Dewaele G, Devernay F, Horaud R. Hand motion from 3d point trajectories and a smooth surface model. In: European Conference on Computer Vision. Springer; (2004) . pp. 495-507. |
[26] | Jia P, Li WL, Wang G, Li SY. Optimal grasp planning for a dexterous robotic hand using the volume of a generalized force ellipsoid during accepted flattening. International Journal of Advanced Robotic Systems. (2017) ; 14: (1): 1729881416687134. |
[27] | Barraza F, Arancibia M, Madrid E, Papuzinski C. General concepts in biostatistics and clinical epidemiology: Random error and systematic error. Medwave. (2019) ; 19: (7): e7687. |
[28] | Giavarina D. Understanding bland altman analysis. Biochemia Medica. (2015) ; 25: (2): 141-151. |
[29] | Batterham AM, George KP. Reliability in evidence-based clinical practice: A primer for allied health professionals. Physical Therapy in Sport. (2003) ; 4: (3): 122-128. |
[30] | Shechtman O. The coefficient of variation as an index of measurement reliability. In: Methods of clinical epidemiology. Springer; (2013) . pp. 39-49. |
[31] | Jensen AL, Kjelgaard-Hansen M. Method comparison in the clinical laboratory. Veterinary Clinical Pathology. (2006) ; 35: (3): 276-286. |
[32] | Munk A, Hwang J, Brown LD. Testing average equivalence – finding a compromise between theory and practice. Biometrical Journal: Journal of Mathematical Methods in Biosciences. (2000) ; 42: (5): 531-551. |
[33] | Schuirmann D. eOn hypothesis-testing to determine if the mean of a normal-distribution is contained in a known interval. In: Biometrics. vol. 37. INTERNATIONAL BIOMETRIC SOC 808 17TH ST NW SUITE 200, WASHINGTON, DC 20006-3910; (1981) . pp. 617-617. |
[34] | Yang H, Novick S, Burdick R. On FDA’s Approach to Demonstration of Analytical Similarity. PDA Journal of Pharmaceutical Science and Technology. (2016) . |
[35] | Kondratovich M, Yue L, Dawson J. Power approach versus two one-sided tests procedure in equivalence evaluation with diagnostic medical devices. In: Proceedings of the Annual Meeting of the American Statistical Association; 2001; Atlanta, Georgia; 2001. |
[36] | Shah RT, Makaryus MR, Kumar R, Singas E, Mayo PH. Simulation training for critical care airway management: Assessing translation to clinical practice using a small video-recording device. Chest. (2020) ; 158: (1): 272-278. |
[37] | Rozema JJ, Wouters K, Mathysen DG, Tassignon MJ. Overview of the repeatability, reproducibility, and agreement of the biometry values provided by various ophthalmic devices. American Journal of Ophthalmology. (2014) ; 158: (6): 1111-1120. |
[38] | Harris BU, Stewart S, Verma A, Hoen H, Stein ML, Wright G, et al. Accuracy of a portable pulse oximeter in monitoring hypoxemic infants with cyanotic heart disease. Cardiology in the Young. (2019) ; 29: (8): 1025-1029. |
[39] | Limentani GB, Ringo MC, Ye F, Bergquist ML, McSorley EO. Beyond the t-test: Statistical equivalence testing. Analytical Chemistry. (2005) ; 77: (11): 221-226. |
[40] | Lakens D, Delacre M. Equivalence testing and the second generation |
[41] | Sedgwick P. Limits of agreement (Bland-Altman method). Bmj. (2013) ; 346. |
[42] | Badnjević A, Pokvić LG, Deumić A, Bećirović LS. Post-market surveillance of medical devices: A review. Technology and Health Care. (2022) ; (6): 1315-1329. |
[43] | Temporiti F, Adamo P, Mandelli A, Buccolini F, Viola E, Aguzzi D, et al. Test-retest reliability of a photographic marker-based system for postural examination. Technology and Health Care; (Preprint): 1-8. |
[44] | Dong X, Tsong Y. Equivalence assessment for interchangeability based on two-sided tests. Journal of Biopharmaceutical Statistics. (2014) ; 24: (6): 1312-1331. |
[45] | Damstra RJ, Glazenburg EJ, Hop WC. Validation of the inverse water volumetry method: A new gold standard for arm volume measurements. Breast Cancer Research and Treatment. (2006) ; 99: (3): 267-273. |
[46] | Mayrovitz HN, Macdonald J, Davey S, Olson K, Washington E. Measurement decisions for clinical assessment of limb volume changes in patients with bilateral and unilateral limb edema. Physical Therapy. (2007) ; 87: (10): 1362-1368. |
[47] | de Sire A, Fusco N, Sajjadi E, Lippi L, Cisari C, Invernizzi M. Lymphedema rehabilitation using self-adaptive inelastic compression in breast cancer: A proof-of-principle study. Applied Sciences. (2021) ; 11: (4): 1901. |
[48] | O’Donnell TF Jr, Allison GM, Iafrati MD. A systematic review of guidelines for lymphedema and the need for contemporary intersocietal guidelines for the management of lymphedema. Journal of Vascular Surgery: Venous and Lymphatic Disorders. (2020) ; 8: (4): 676-684. |
[49] | Armer JM, Hulett JM, Bernas M, Ostby P, Stewart BR, Cormier JN. Best-practice guidelines in assessment, risk reduction, management, and surveillance for post-breast cancer lymphedema. Current Breast Cancer Reports. (2013) ; 5: (2): 134-144. |
[50] | Marotta N, Lippi L, Ammendolia V, Calafiore D, Inzitari MT, Pinto M, et al. Efficacy of kinesio taping on upper limb volume reduction in patients with breast cancer-related lymphedema: a systematic review of randomized controlled trials. European Journal of Physical and Rehabilitation Medicine. (2023) . |
[51] | Bulley C, Gaal S, Coutts F, Blyth C, Jack W, Chetty U, et al. Comparison of breast cancer-related lymphedema (upper limb swelling) prevalence estimated using objective and subjective criteria and relationship with quality of life. BioMed research international. (2013) ; 2013. |
[52] | Nascimben M, Lippi L, de Sire A, Invernizzi M, Rimondini L. Algorithm-based risk identification in patients with breast cancer-related lymphedema: A cross-sectional study. Cancers. (2023) ; 15: (2): 336. |
[53] | Lippi L, de Sire A, Losco L, Mezian K, Folli A, Ivanova M, et al. Axillary web syndrome in breast cancer women: What is the optimal rehabilitation strategy after surgery? A systematic review. Journal of Clinical Medicine. (2022) ; 11: (13): 3839. |
[54] | Borman P, Yaman A, Yasrebi S, ˙Inanlı AP, Dönmez AA. Combined complete decongestive therapy reduces volume and improves quality of life and functional status in patients with breast cancer-related lymphedema. Clinical Breast Cancer. (2022) ; 22: (3): e270-e277. |
[55] | Chachaj A, Małyszczak K, Pyszel K, Lukas J, Tarkowski R, Pudełko M, et al. Physical and psychological impairments of women with upper limb lymphedema following breast cancer treatment. Psycho-Oncology: Journal of the Psychological, Social and Behavioral Dimensions of Cancer. (2010) ; 19: (3): 299-305. |
[56] | Smoot B, Wong J, Cooper B, Wanek L, Topp K, Byl N, et al. Upper extremity impairments in women with or without lymphedema following breast cancer treatment. Journal of Cancer Survivorship. (2010) ; 4: (2): 167-178. |
[57] | Ho OA, Chu SY, Huang YL, Chen WH, Lin CY, Cheng MH. Effectiveness of vascularized lymph node transfer for extremity lymphedema using volumetric and circumferential differences. Plastic and Reconstructive Surgery Global Open. (2019) ; 7: (2). |
Appendices
Appendix A: Extended descriptive statistics
The following tables report extended descriptive statistics on the dataset for right (Table 3) and left hand volumetry (Table 4). For reasons of space, several terms were abbreviated: the mean was abbreviations as
Table 3
Right hand volumes descriptive statistics
| Custom GW (num. of partitions) | Clinical | ||||||||
|---|---|---|---|---|---|---|---|---|---|
| Stat | GW | Par 5 | Par 6 | Par 7 | Par 8 | Par 9 | TE | WD | CM |
|
| 0.438 | 0.362 | 0.353 | 0.344 | 0.338 | 0.33 | 0.283 | 0.281 | 0.339 |
| SE | 0.004 | 0.003 | 0.003 | 0.003 | 0.003 | 0.003 | 0.002 | 0.002 | 0.004 |
| CI | 0.446 | 0.368 | 0.359 | 0.351 | 0.344 | 0.336 | 0.286 | 0.285 | 0.346 |
| CI | 0.431 | 0.355 | 0.347 | 0.338 | 0.331 | 0.324 | 0.28 | 0.277 | 0.331 |
| SD | 0.084 | 0.071 | 0.068 | 0.068 | 0.067 | 0.065 | 0.033 | 0.044 | 0.075 |
| iqr | 0.137 | 0.125 | 0.118 | 0.139 | 0.129 | 0.131 | 0.045 | 0.06 | 0.044 |
| iqr | 0.101 | 0.093 | 0.088 | 0.103 | 0.095 | 0.097 | 0.033 | 0.044 | 0.033 |
| mad | 0.071 | 0.059 | 0.056 | 0.054 | 0.054 | 0.052 | 0.026 | 0.034 | 0.055 |
| mad | 0.088 | 0.073 | 0.07 | 0.068 | 0.068 | 0.065 | 0.033 | 0.043 | 0.069 |
| CV | 0.192 | 0.196 | 0.192 | 0.196 | 0.199 | 0.197 | 0.115 | 0.156 | 0.222 |
| RG | 0.291 | 0.218 | 0.213 | 0.206 | 0.208 | 0.199 | 0.125 | 0.165 | 0.301 |
| max | 0.61 | 0.488 | 0.48 | 0.467 | 0.462 | 0.447 | 0.354 | 0.39 | 0.509 |
| min | 0.319 | 0.27 | 0.267 | 0.262 | 0.254 | 0.248 | 0.229 | 0.225 | 0.208 |
| skew | 0.392 | 0.467 | 0.436 | 0.52 | 0.495 | 0.549 | 0.45 | 1.106 | 0.974 |
| kurt | 2.11 | 1.891 | 1.929 | 1.92 | 1.951 | 1.967 | 2.388 | 3.494 | 3.529 |
| JB | 1.232 | 1.84 | 1.667 | 1.966 | 1.821 | 1.989 | 1.036 | 4.495 | 3.564 |
| JB | 0.54 | 0.398 | 0.434 | 0.374 | 0.402 | 0.37 | 0.596 | 0.106 | 0.168 |
| Mo | 0.462 | 0.367 | 0.362 | 0.346 | 0.338 | 0.331 | 0.266 | 0.25 | 0.311 |
| Mo | 0.095 | 0.095 | 0.095 | 0.095 | 0.095 | 0.095 | 0.095 | 0.333 | 0.095 |
| med | 0.42 | 0.35 | 0.352 | 0.344 | 0.337 | 0.326 | 0.276 | 0.27 | 0.32 |
| 1% | 0.322 | 0.272 | 0.267 | 0.262 | 0.255 | 0.25 | 0.232 | 0.227 | 0.22 |
| 5% | 0.334 | 0.278 | 0.268 | 0.265 | 0.257 | 0.258 | 0.243 | 0.235 | 0.265 |
| 10% | 0.335 | 0.281 | 0.274 | 0.271 | 0.268 | 0.261 | 0.249 | 0.25 | 0.27 |
| 25% | 0.377 | 0.308 | 0.301 | 0.283 | 0.275 | 0.271 | 0.264 | 0.25 | 0.304 |
| 50% | 0.42 | 0.35 | 0.352 | 0.344 | 0.337 | 0.326 | 0.276 | 0.27 | 0.32 |
| 75% | 0.514 | 0.433 | 0.42 | 0.422 | 0.403 | 0.402 | 0.308 | 0.31 | 0.348 |
| 90% | 0.549 | 0.454 | 0.44 | 0.431 | 0.423 | 0.417 | 0.324 | 0.33 | 0.445 |
| 95% | 0.572 | 0.484 | 0.465 | 0.46 | 0.453 | 0.446 | 0.327 | 0.375 | 0.505 |
| 99% | 0.603 | 0.487 | 0.477 | 0.466 | 0.46 | 0.447 | 0.348 | 0.387 | 0.509 |
Table 4
Left hand volumes descriptive statistics
| Custom GW (num. of partitions) | Clinical | ||||||||
|---|---|---|---|---|---|---|---|---|---|
| Stat | GW | Par 5 | Par 6 | Par 7 | Par 8 | Par 9 | TE | WD | CM |
|
| 0.429 | 0.345 | 0.332 | 0.326 | 0.316 | 0.307 | 0.275 | 0.275 | 0.335 |
| SE | 0.004 | 0.004 | 0.004 | 0.004 | 0.004 | 0.004 | 0.002 | 0.002 | 0.004 |
| CI | 0.437 | 0.353 | 0.34 | 0.334 | 0.324 | 0.315 | 0.279 | 0.279 | 0.342 |
| CI | 0.42 | 0.338 | 0.325 | 0.319 | 0.308 | 0.299 | 0.272 | 0.272 | 0.328 |
| SD | 0.088 | 0.08 | 0.077 | 0.082 | 0.083 | 0.084 | 0.036 | 0.036 | 0.076 |
| iqr | 0.123 | 0.096 | 0.093 | 0.097 | 0.101 | 0.097 | 0.038 | 0.04 | 0.044 |
| iqr | 0.091 | 0.071 | 0.069 | 0.072 | 0.075 | 0.072 | 0.028 | 0.03 | 0.033 |
| mad | 0.07 | 0.062 | 0.059 | 0.061 | 0.062 | 0.062 | 0.027 | 0.028 | 0.056 |
| mad | 0.088 | 0.078 | 0.074 | 0.077 | 0.078 | 0.077 | 0.034 | 0.035 | 0.07 |
| CV | 0.206 | 0.231 | 0.232 | 0.251 | 0.261 | 0.272 | 0.129 | 0.13 | 0.228 |
| RG | 0.321 | 0.33 | 0.306 | 0.345 | 0.352 | 0.366 | 0.133 | 0.136 | 0.287 |
| max | 0.639 | 0.505 | 0.466 | 0.469 | 0.461 | 0.448 | 0.358 | 0.368 | 0.509 |
| min | 0.318 | 0.175 | 0.16 | 0.124 | 0.108 | 0.082 | 0.226 | 0.232 | 0.223 |
| skew | 0.758 | 0.336 | 0.185 | -0.063 | -0.113 | -0.357 | 0.742 | 1.2 | 0.899 |
| kurt | 2.735 | 2.904 | 2.879 | 3.36 | 3.465 | 3.972 | 2.782 | 3.769 | 3.184 |
| JB | 2.07 | 0.402 | 0.132 | 0.127 | 0.234 | 1.274 | 1.97 | 5.561 | 2.858 |
| JB | 0.355 | 0.818 | 0.936 | 0.938 | 0.89 | 0.529 | 0.373 | 0.062 | 0.24 |
| Mo | 0.381 | 0.309 | 0.299 | 0.286 | 0.279 | 0.274 | 0.257 | 0.25 | 0.329 |
| Mo | 0.095 | 0.095 | 0.095 | 0.095 | 0.095 | 0.095 | 0.095 | 0.333 | 0.095 |
| med | 0.412 | 0.321 | 0.315 | 0.311 | 0.299 | 0.291 | 0.27 | 0.26 | 0.324 |
| 1% | 0.319 | 0.193 | 0.179 | 0.15 | 0.135 | 0.112 | 0.227 | 0.234 | 0.225 |
| 5% | 0.323 | 0.269 | 0.253 | 0.253 | 0.241 | 0.236 | 0.233 | 0.24 | 0.234 |
| 10% | 0.329 | 0.281 | 0.271 | 0.267 | 0.263 | 0.256 | 0.237 | 0.25 | 0.266 |
| 25% | 0.365 | 0.3 | 0.288 | 0.282 | 0.269 | 0.262 | 0.251 | 0.25 | 0.295 |
| 50% | 0.412 | 0.321 | 0.315 | 0.311 | 0.299 | 0.291 | 0.27 | 0.26 | 0.324 |
| 75% | 0.487 | 0.396 | 0.382 | 0.379 | 0.37 | 0.359 | 0.289 | 0.29 | 0.338 |
| 90% | 0.55 | 0.468 | 0.459 | 0.448 | 0.445 | 0.429 | 0.322 | 0.31 | 0.428 |
| 95% | 0.568 | 0.48 | 0.463 | 0.464 | 0.446 | 0.439 | 0.336 | 0.35 | 0.497 |
| 99% | 0.624 | 0.5 | 0.466 | 0.468 | 0.458 | 0.446 | 0.354 | 0.364 | 0.507 |


