
Severity detection of COVID-19 infection with machine learning of clinical records and CT images
Abstract
BACKGROUND:
Coronavirus disease 2019 (COVID-19) is a deadly viral infection spreading rapidly around the world since its outbreak in 2019. In the worst case a patient’s organ may fail leading to death. Therefore, early diagnosis is crucial to provide patients with adequate and effective treatment.
OBJECTIVE:
This paper aims to build machine learning prediction models to automatically diagnose COVID-19 severity with clinical and computed tomography (CT) radiomics features.
METHOD:
P-V-Net was used to segment the lung parenchyma and then radiomics was used to extract CT radiomics features from the segmented lung parenchyma regions. Over-sampling, under-sampling, and a combination of over- and under-sampling methods were used to solve the data imbalance problem. RandomForest was used to screen out the optimal number of features. Eight different machine learning classification algorithms were used to analyze the data.
RESULTS:
The experimental results showed that the COVID-19 mild-severe prediction model trained with clinical and CT radiomics features had the best prediction results. The accuracy of the GBDT classifier was 0.931, the ROUAUC 0.942, and the AUCPRC 0.694, which indicated it was better than other classifiers.
CONCLUSION:
This study can help clinicians identify patients at risk of severe COVID-19 deterioration early on and provide some treatment for these patients as soon as possible. It can also assist physicians in prognostic efficacy assessment and decision making.
1.Introduction
Coronavirus disease 2019 (COVID-19) is a deadly viral infection that has spread rapidly around the world since its outbreak in 2019. According to a report from the World Health Organization, as of 25 May 2022, there have been more than 524 million confirmed cases of COVID-19, including more than 6.28 million deaths 0. The severity of COVID-19 can be classified into the following categories: mild, ordinary, severe, and critical [2]. Patients with severe COVID-19 may suffer from massive alveolar damage and respiratory failure, leading to death [3]. Therefore, early classification of COVID-19 and effective targeted treatment for critically ill patients can reduce the risk of complications. Early and automatic diagnosis will help countries all over the world provide timely treatment and quarantine. Hospitals can also offer more professional treatment for severe COVID-19 patients.
Nucleic acid screening, clinical features, epidemiological features, and imaging findings are basic for diagnosing COVID-19 [4]. After comparing the diagnostic effects of RT-PCR tests and chest computed tomography (CT) on the initial negative to positive diagnosis, AI [5] concluded that chest CT detection is faster. Chest CT is recommended as a routine test for surveillance and diagnosis of COVID-19 due to imaging features such as ground-glass opacity and consolidation on Chest CT used to determine SARS-CoV-2 infection-associated pneumonia [6]. A chest CT also assists physicians in identifying the early stages of lung infection [8] and is beneficial in helping governments to establish greater public health surveillance and response systems [10]. A combined assessment using clinical records and imaging features allows for a more accurate early diagnosis of patients with COVID-19.
Although some studies have constructed machine learning (ML) prediction models, to our knowledge, the current diagnosis of COVID-19 does not achieve satisfactory accuracy. Terwangne et al. [11] used 295 RT-PCR-positive COVID-19 patients data to develop a model based on the Bayesian network to predict the severity grading of COVID-19 patients and finally obtained a AUC of 83.8%. Yao et al. [12] developed a model to predict the severity of COVID-19 based on the SVM algorithm using data from 137 COVID-19 patients (75 severe, 62 mild) and finally obtained an accuracy of 81.48%.
Liang et al. [13] developed a model for predicting the severity of COVID-19 patients based on the SVM algorithm using data from 172 patients (60 severe) and finally obtained an average accuracy of 91.83%. Liang et al. [14] used data from 1590 (131 severe) patients to develop a model based on the LR algorithm for predicting clinical risk scores for the occurrence of critical illness in hospitalized patients with COVID-19, ultimately obtaining an AUC of 88% on the validation set.
Zhu et al. [15] used data from 127 patients (16 severe groups) to develop a model to assess the severity of infection in COVID-19 patients based on the LR algorithm, ultimately obtaining an AUC of 90.0%.
The above studies related to the severity classification of COVID-19 were based on clinical features only. They did not consider the influence of CT image feature factors on the classification of mild to severe disease. Because of this, we use clinical examination data and CT radiomics features to build a prediction model for mild and severe COVID-19 patients. The study aims to segment the region of interest in the lung, extract CT radiomics features based on the segmentation results, and train a machine learning prediction model using the clinical records and the extracted image features. In the following sections, data collection and modeling methods will be described first, followed by developing COVID-19 patient severity detection models using traditional and ensemble machine learning algorithms.
2.Materials and methods
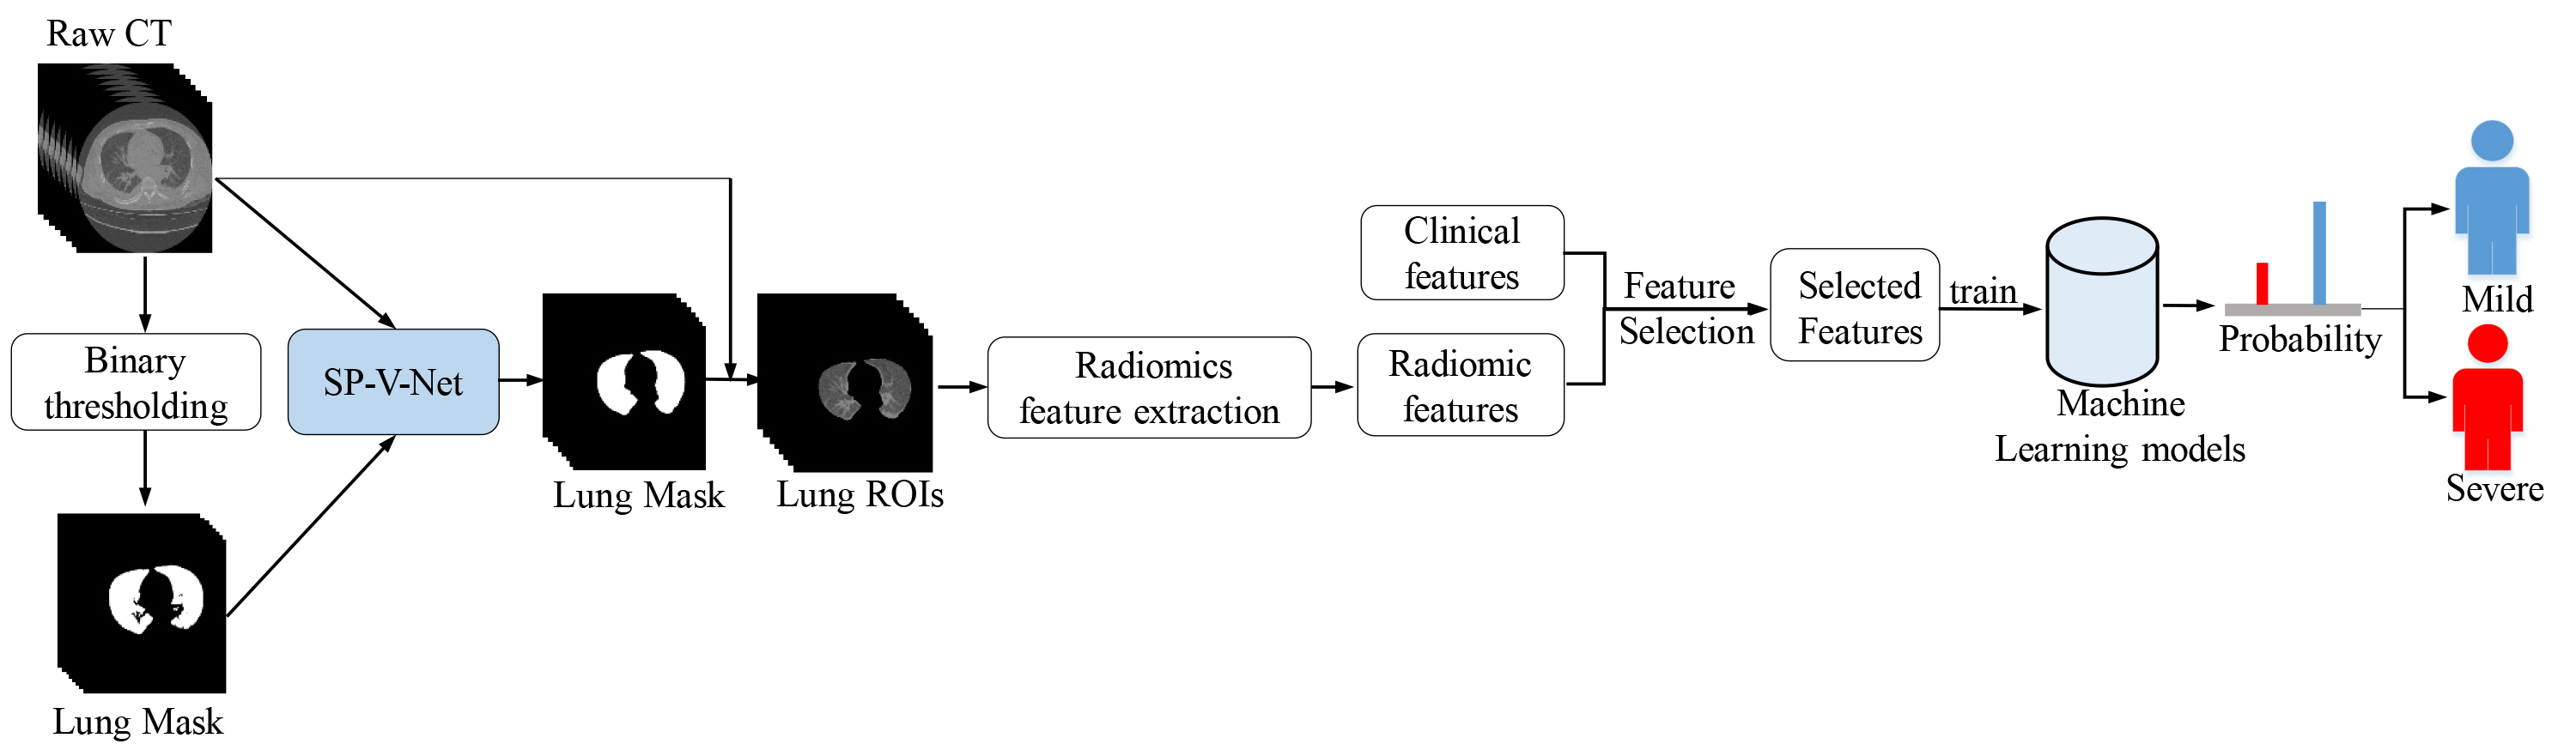
The clinical and chest CT data used for this retrospective study were collected by the Shanghai Public Health Clinical Center from 20 January to 29 May 29 2020. The Ethics Committee approved the retrospective study of the Shanghai Public Health Clinical Center. Figure 1 shows the overall flowchart we developed for detecting the severity of COVID-19. Firstly, SP-V-Net was used to segment the CT images to obtain the lung contours. Radiomics was used to extract the lung image features, which were combined with clinical features to build a mild-severe diagnostic model after feature screening.
The 427 clinical data collected were used for this study, including 387 patients with mild COVID-19 (mean age, 40.26
Table 1
Baseline characteristics of COVID-19 patients with mild and severe disease
| Features | Mild | Severe | |||
|---|---|---|---|---|---|
| PO2 | 14.38 | 10.91 | 0.084 | ||
| Age | 40.26 | 60.58 | 0.263 | ||
| Lactate dehydrogenase (LDH) | 218.98 | 347.85 | 0.000 | ||
| C-reactive protein (CRP) | 15.16 | 55.91 | 0.000 | ||
| APTT | 38.45 | 41.86 | 0.030 | ||
| eGFR | 117.36 | 104.16 | 0.150 | ||
| Blood sodium | 139.91 | 137.12 | 0.000 | ||
| Total cholesterol | 4.25 | 4.19 | 0.907 | ||
| PRO-BNP | 60.05 | 179.28 | 0.000 | ||
| PCO2 | 5.43 | 5.37 | 0.000 | ||
| Urea | 4.40 | 5.72 | 0.000 | ||
| White blood cells (WBC) | 5.48 | 5.43 | 0.204 | ||
| D-dimer | 0.54 | 2.19 | 0.000 | ||
| Lymphocyte count | 1.44 | 1.03 | 0.174 | ||
Figure 1.
Flowchart of our approach to building the COVID-19 severity diagnosis model.
By observing the basic situation of the clinical dataset, we found that some clinical features had missing data, and the number of missing data and the proportion of missing data for different features are shown in Table 2. To reduce the impact of missing data on the experimental results, we use the Multivariate Imputation by Chained Equation (MICE) [16] method to interpolate the missing data. MICE is a multiple interpolation method that works iteratively and can resolve the uncertainty of missing values by creating multiple interpolations. The data can be interpolated by variable by specifying an interpolation model for each variable. The MICE interpolation technique has better robustness and better accounts for uncertainty and is selected to treat missing data values.
Table 2
Features and missing values in the dataset
| Feature | Number of missing data values | % of missing data values on the total |
|---|---|---|
| C-reactive protein (CRP) | 122 | 28.18 |
| PRO-BNP | 100 | 23.09 |
| PCT | 25 | 5.77 |
| Total cholesterol | 15 | 3.46 |
| PO2 | 15 | 3.46 |
| PCO2 | 15 | 3.46 |
| eGFR | 6 | 1.39 |
| Urea | 5 | 1.15 |
| Lactate dehydrogenase (LDH) | 5 | 1.15 |
| Blood sodium | 4 | 0.92 |
| APTT | 3 | 0.69 |
| D-Dimer | 3 | 0.69 |
| White blood cells (WBC) | 1 | 0.23 |
| Tlymphocyte | 1 | 0.23 |
2.1CT radiomics features extraction
SP-V-Net [17] is a lung parenchyma segmentation model based on image deformation. The advantage of this model is that it uses 3D V-Net for end-to-end lung extraction and combines the spatial transform network (STN) module and prior shape knowledge to refine the V-Net output results so that the final segmentation results are closer to the ground-truth label. First, the threshold segmentation results were used as the lung lobes shape prior, combined with the gold standard data to train the SP-V-Net segmentation model. Second, lung lobes of each patient were segmented automatically by SP-V-Net; experienced operators confirmed the CT image segmentation results. Finally, we used the binary image of the segmentation result to multiply the original image to obtain all CT lung ROIs of 427 patients. Radiomics was used to extract the CT radiomics features from lung ROIs for machine learning; 120 features presented by Zwanenburg et al. [18] were measured. All of them may be related to COVID-19 classification are extracted for our analysis.
2.2Feature selection
The feature selection algorithm effectively reduces the feature number and also helps to improve accuracy in many cases [19]. Feature selection algorithms can effectively remove those unrelated features [20], which usually enhances the model’s generalization performance. We used the random forest to rank features and selected the top-ranked features. Due to the random nature of the Random Forest algorithm, we trained the model several times, choosing a certain number of features each time and using the intersection of the results of multiple experiments as the last selected features.
2.3Model selection
By comparing different classes of machine learning classifiers, we consider training the following classifier model to predict the severity of COVID-19.
AdaBoost (Adaptive Boosting) [21] is an iterative algorithm that trains different weak classifiers for the same training set by increasing the weights of misclassified data and decreasing the importance of correctly classified data. Finally, AdaBoost combines these weak classifiers linearly to form a robust classifier. GBDT (Gradient Boosted Decision Tree) [22] is an ensemble algorithm that produces a weak classifier in each iteration by multiple iterations. The total classifier is obtained by weighting and aggregating the weak classifiers, which improves prediction accuracy. MLP (Multilayer Perceptron) [23] is a feed-forward ANN containing at least three layers of neurons, trained with back-propagation supervised learning techniques, which can identify not linearly separable data. XGBoost (Extreme gradient boosting) [24] is a scalable tree-boosting machine learning system in all scenarios and can solve real-world scale problems using minimal resources. KNN (K-nearest neighbors) [25] is a simple and effective classification algorithm that performs classification by measuring the distance between different feature values. LR (Logistic Regression) [26] is a classical classification method in supervised learning and is often used to deal with regression problems in which the dependent variable is categorical. Logistic regression is often used to analyze medical research risk factors for a particular disease. NB (Naive Bayes) [27] is one of the most effective inductive learning algorithms in data mining and machine learning, and it has surprising performance in classification. RF (Random Forest) [28] is an ensemble algorithm that can solve the data imbalance problem by decision tree voting to get the final prediction and can be used for feature selection by providing the relative importance of different features in the classification process.
2.4Data sampling methods
Data imbalance is one of the current challenges in data analysis, which usually leads to over-fitting models. To further describe the data imbalance, we represent the minority class sample by using
(1)
When
(2)
There was also a data imbalance in this study, with 387 cases of mild disease and 40 cases of severe disease in the data we collected, with a data imbalance ratio of 9.675. To further address the effect of data imbalance on the experimental results, we sampled the data in three different ways (Under-sampling, Over-sampling, and Combination of over- and under-sampling methods) for all the data separately.
2.4.1Under-sampling methods
• ClusterCentroids [29] use KMeans to cluster each sample type separately, replacing the entire cluster of samples using the center of mass.
• RandUnder (Random Under Sampling) [30] randomly selects samples from the majority class samples for rejection.
• NearMiss [31] selected the most representative samples from most classes for training to alleviate the problem of information loss in random undersampling.
• TomekLink [32] represents the nearest pair of samples between different categories, which are nearest neighbors of each other and belong to different classes.
• ENN (Edited Nearest Neighbor) [33] traverses the samples of most classes, and if most of the k-nearest neighbor samples are not the same as their class, they are deleted.
• RENN (Repeated Edited Nearest Neighbor) keeps repeating the deletion process of ENN until it can no longer be deleted.
• CNN (Condensed Nearest Neighbor) [34] uses the nearest neighbor approach to iterate and determine whether a sample should be retained or rejected.
• OSS (One Side Sampling) [35] rejects noisy samples by using multiple TomekLink iterations.
• AllKNN [36] applies ENN multiple times and will change the number of nearest neighbors.
2.4.2Over-sampling methods
• RandOver (Random Over-Sampling) randomly samples from categories with few samples, and then adds the sampled samples to the data set.
• SMOTE (synthetic minority oversampling technique) [37] interpolates between a few classes of samples to generate additional samples.
• BorderSMOTE (Borderline Synthetic Minority Oversampling Technique) [38] first distinguishes the minority class samples located at the border and performs KNN sampling for these samples.
• KMeansSMOTE [39] first applies KMeans clustering and then oversamples using SMOTE.
• SVMSMOTE [40] uses the SVM classifier to generate support vectors to generate new minority class samples, which are then synthesized using SMOTE.
• ADASYN (adaptive synthetic sampling) [41] uses some mechanism to automatically determine how many synthetic samples need to be generated for each minority class sample.
2.4.3Combination of over- and under-sampling methods
• SMOTETomek (SMOTE with tomek links cleaning) [42] combines over and under sampling using SMOTE and Tomek links.
2.5Model training and evaluation
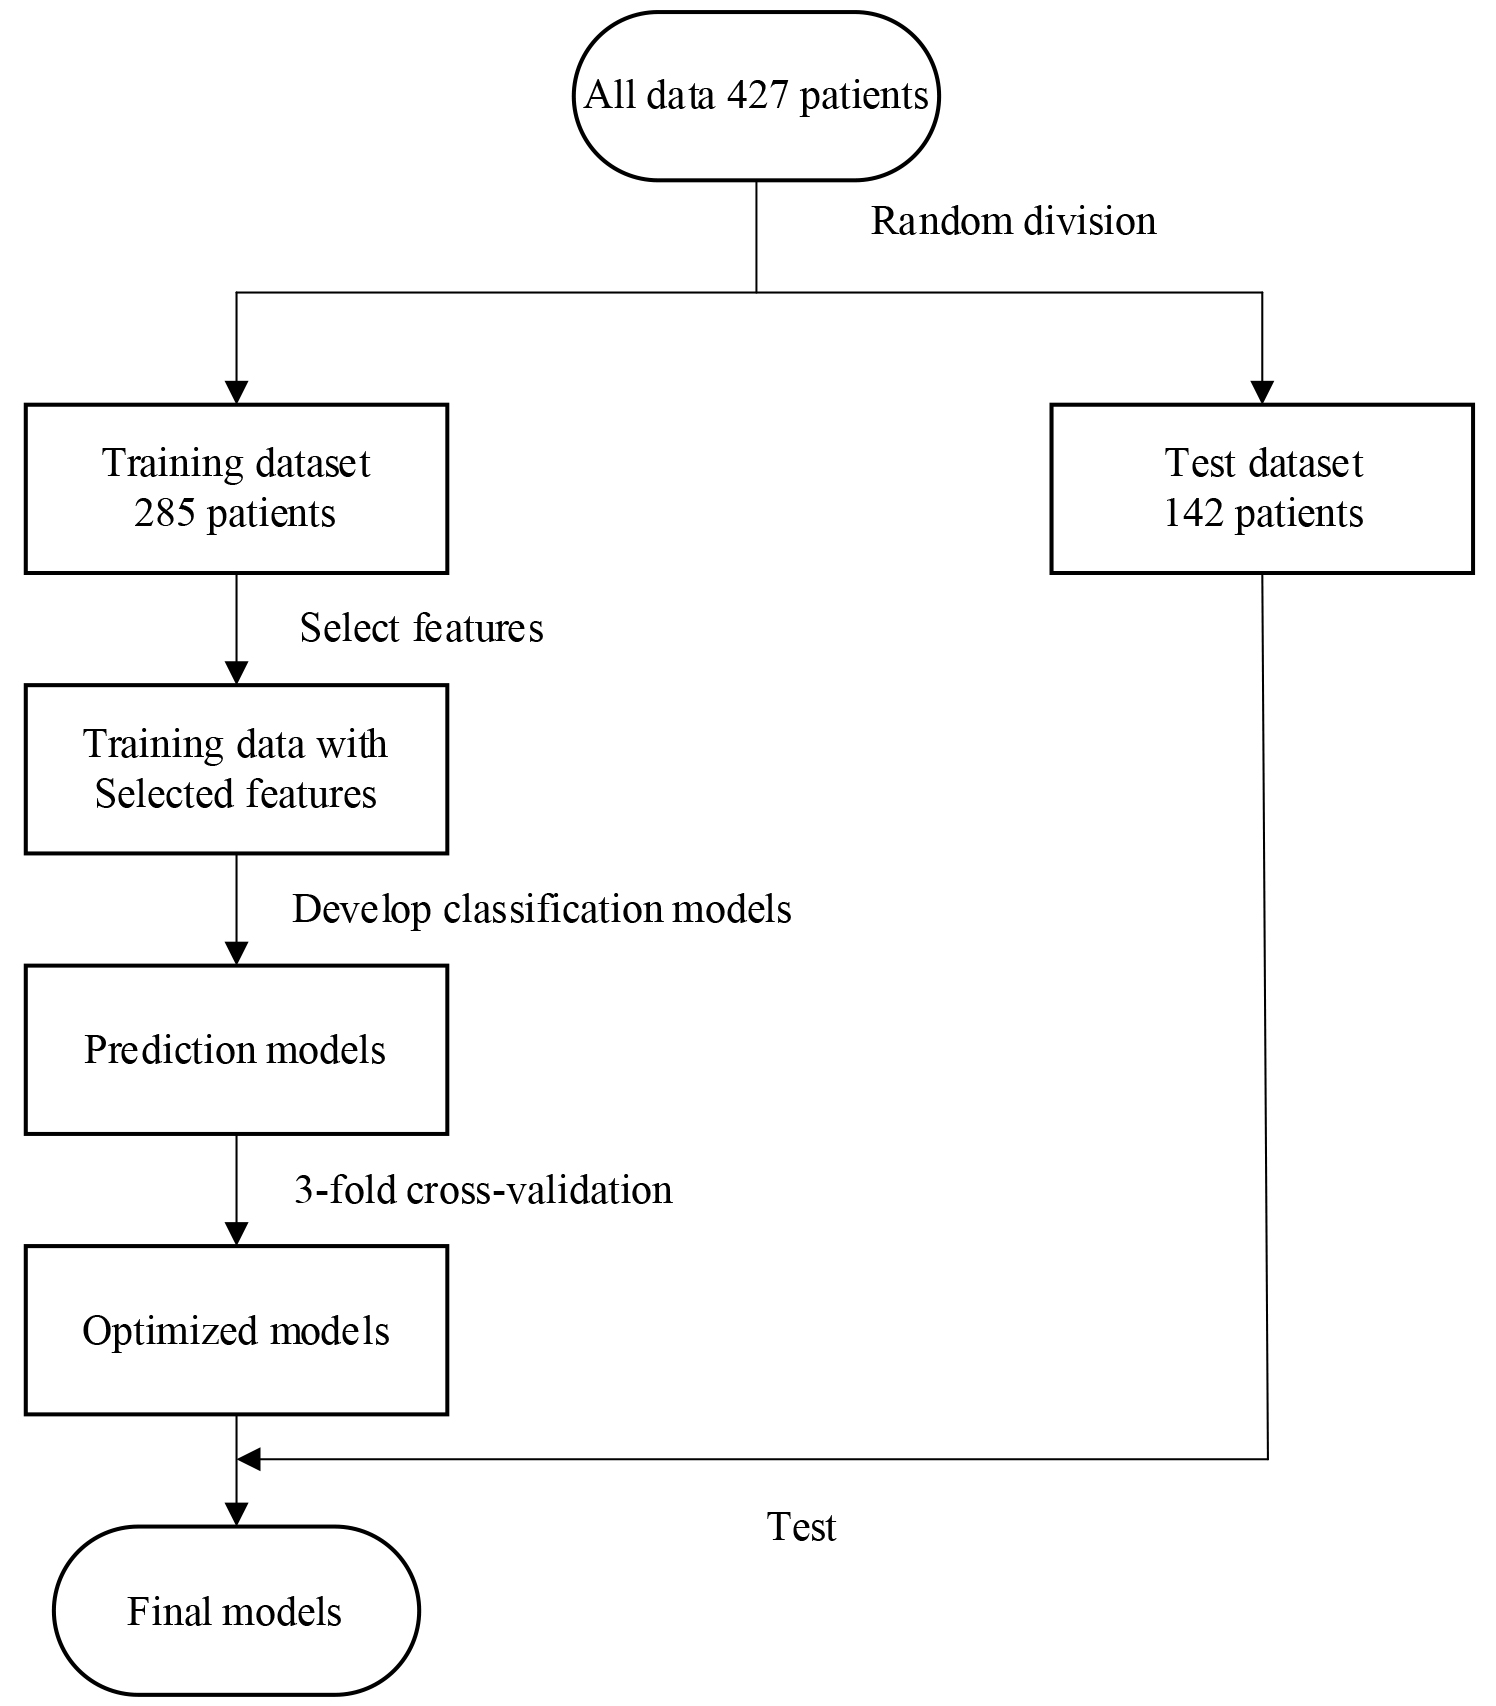
3-fold cross-validation was used to prove the performance of the model on the training data set. The training data consist of 67% of the total data; the test data consist of the remaining 33%. Among all 427 sets of patient data, 285 (258 mild, 27 severe) data sets were used as training data, and 142 (129 mild, 13 severe) data sets were used as test data. Finally, we used training data to train eight different machine learning algorithms and the trained models to predict the test data. Accuracy, f1-score, AUC, and AUCPRC were used to analyze the model’s performance. Figure 2 shows the workflow of our method.
Figure 2.
Overall training flowchart of the COVID-19 mild-severe disease prediction model.
To better measure the model’s effectiveness, we used different evaluation indicators to compare the multiple aspects. According to the confusion matrix, the following indicators were used to evaluate the performance of the model comprehensively:
TP, FP, TN, and FN stand for True Positive, False Positive, True Negatives, and False Negative respectively.
(3)
(4)
(5)
(6)
(7)
(8)
(9)
(10)
3.Results
3.1Feature selection
To further verify the effect of different features on machine learning prediction results, we performed 100 RandomForest feature sorting on clinical features, CT radiomics features, a mixture of clinical features, and CT radiomics features, respectively. The final mean value of 100 experimental results was calculated as the final feature importance ranking result. We further filtered the number of features that make different machine learning algorithms get optimal results based on the feature ranking results. The optimal number of feature combinations for different machine learning models is shown in Fig. 3.
Figure 3.
Number of features for each machine learning algorithm to obtain optimal prediction results.
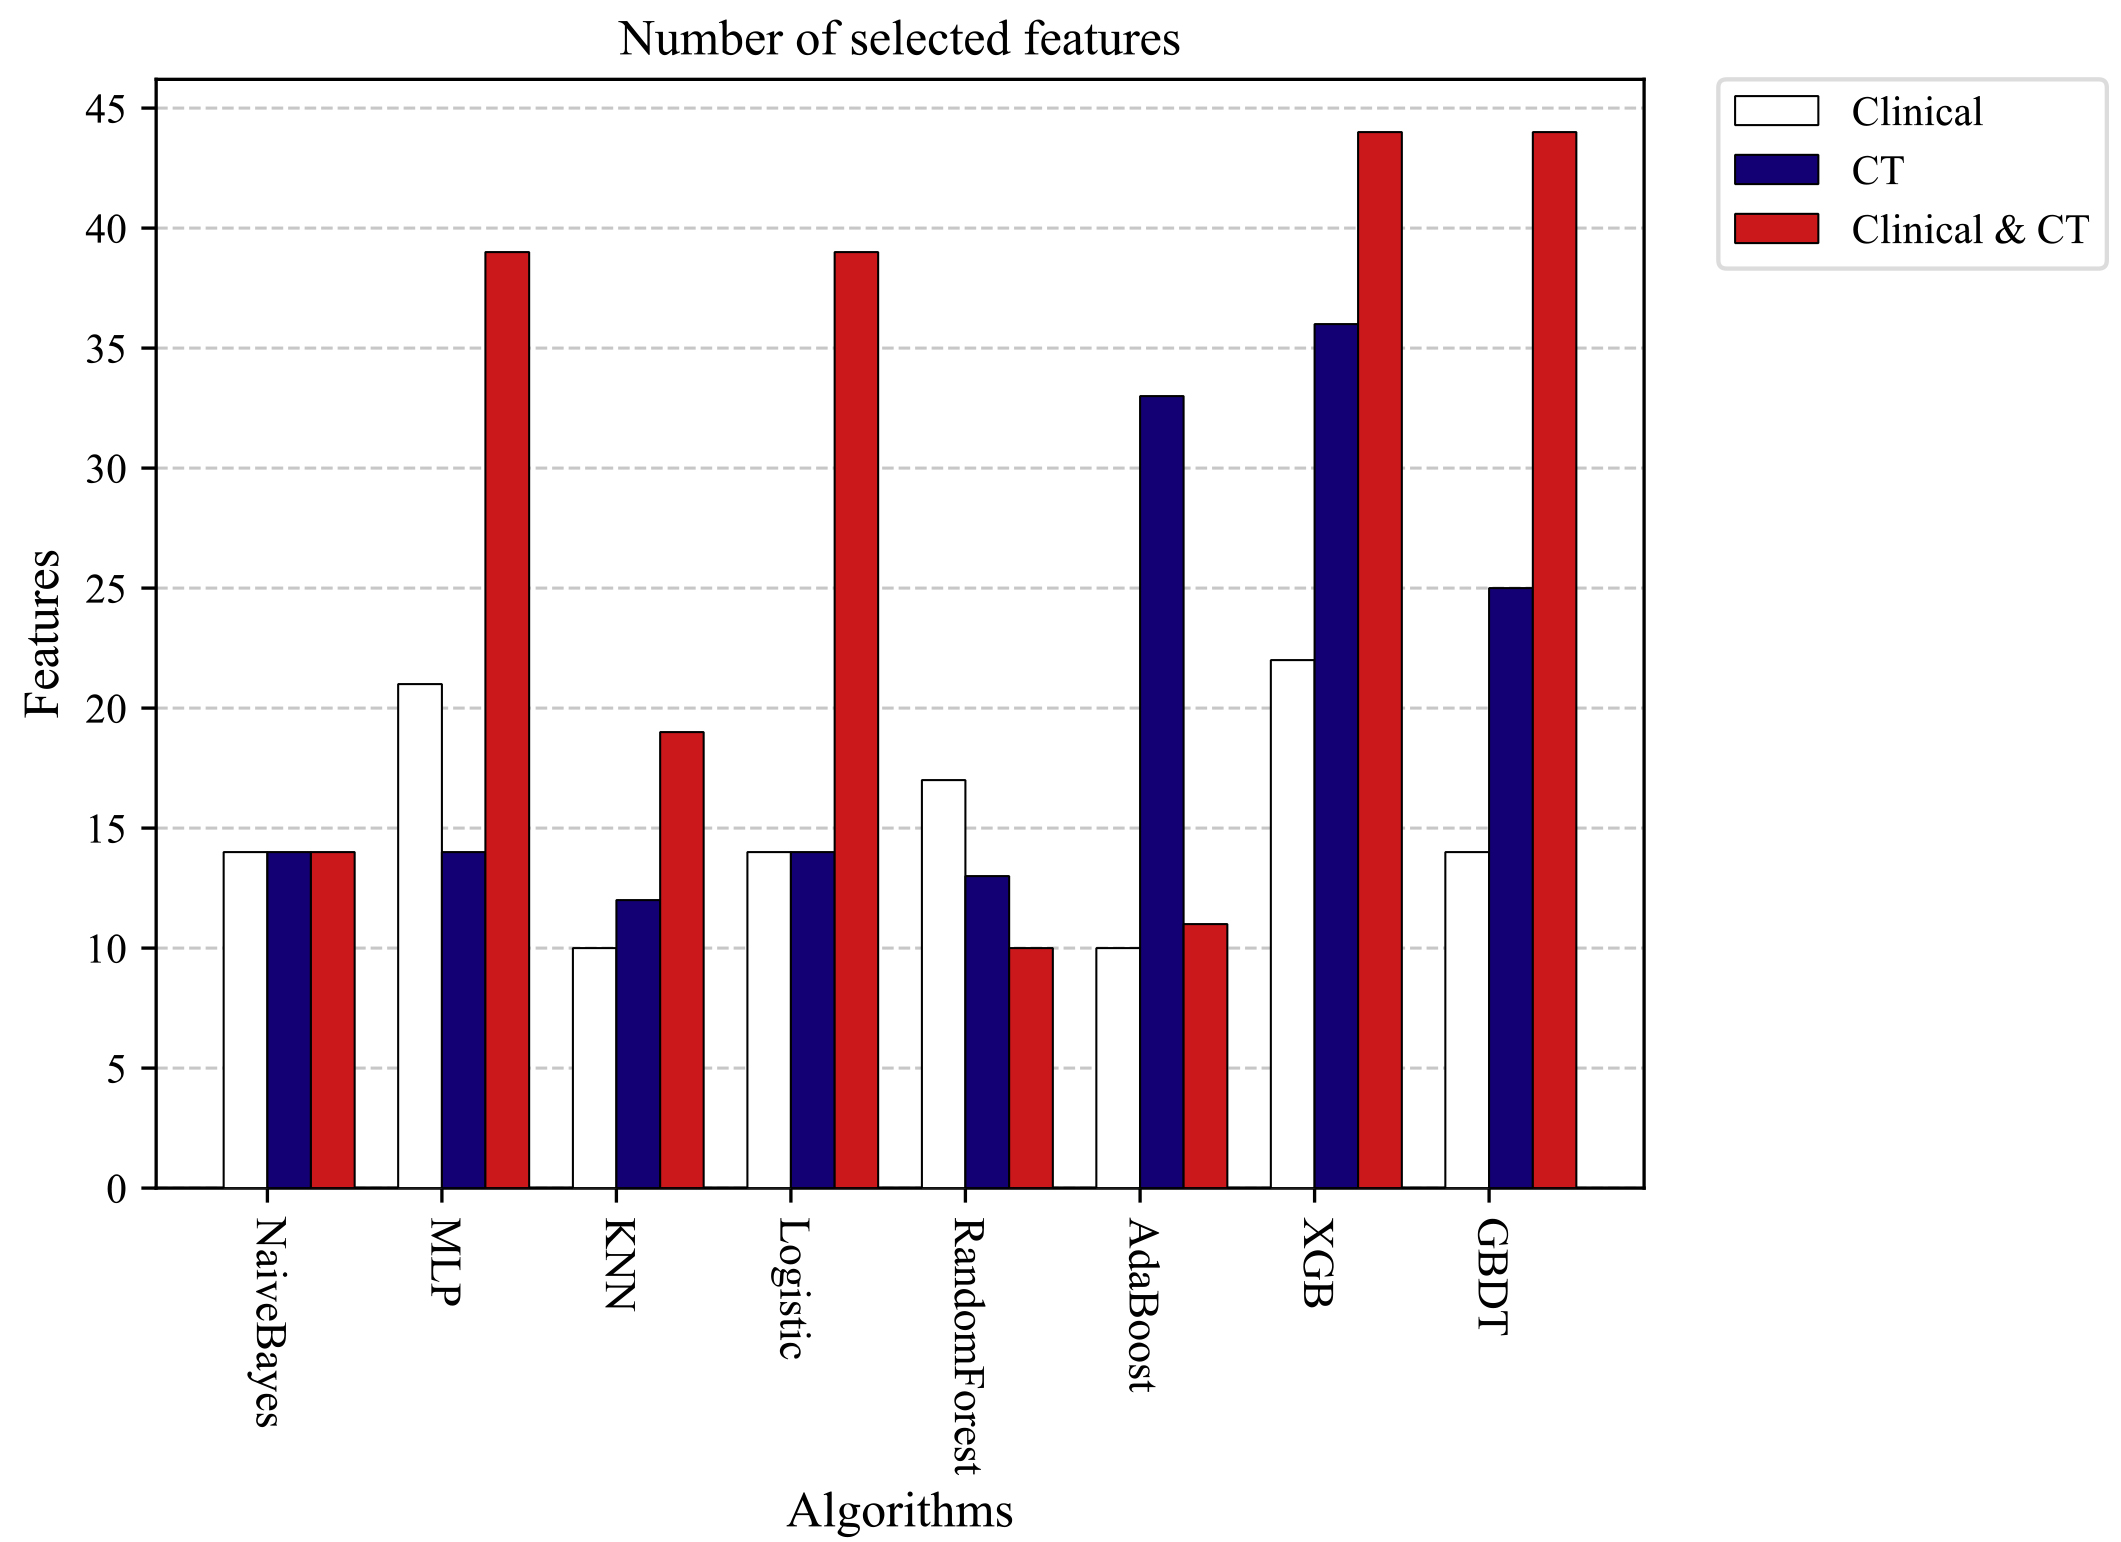
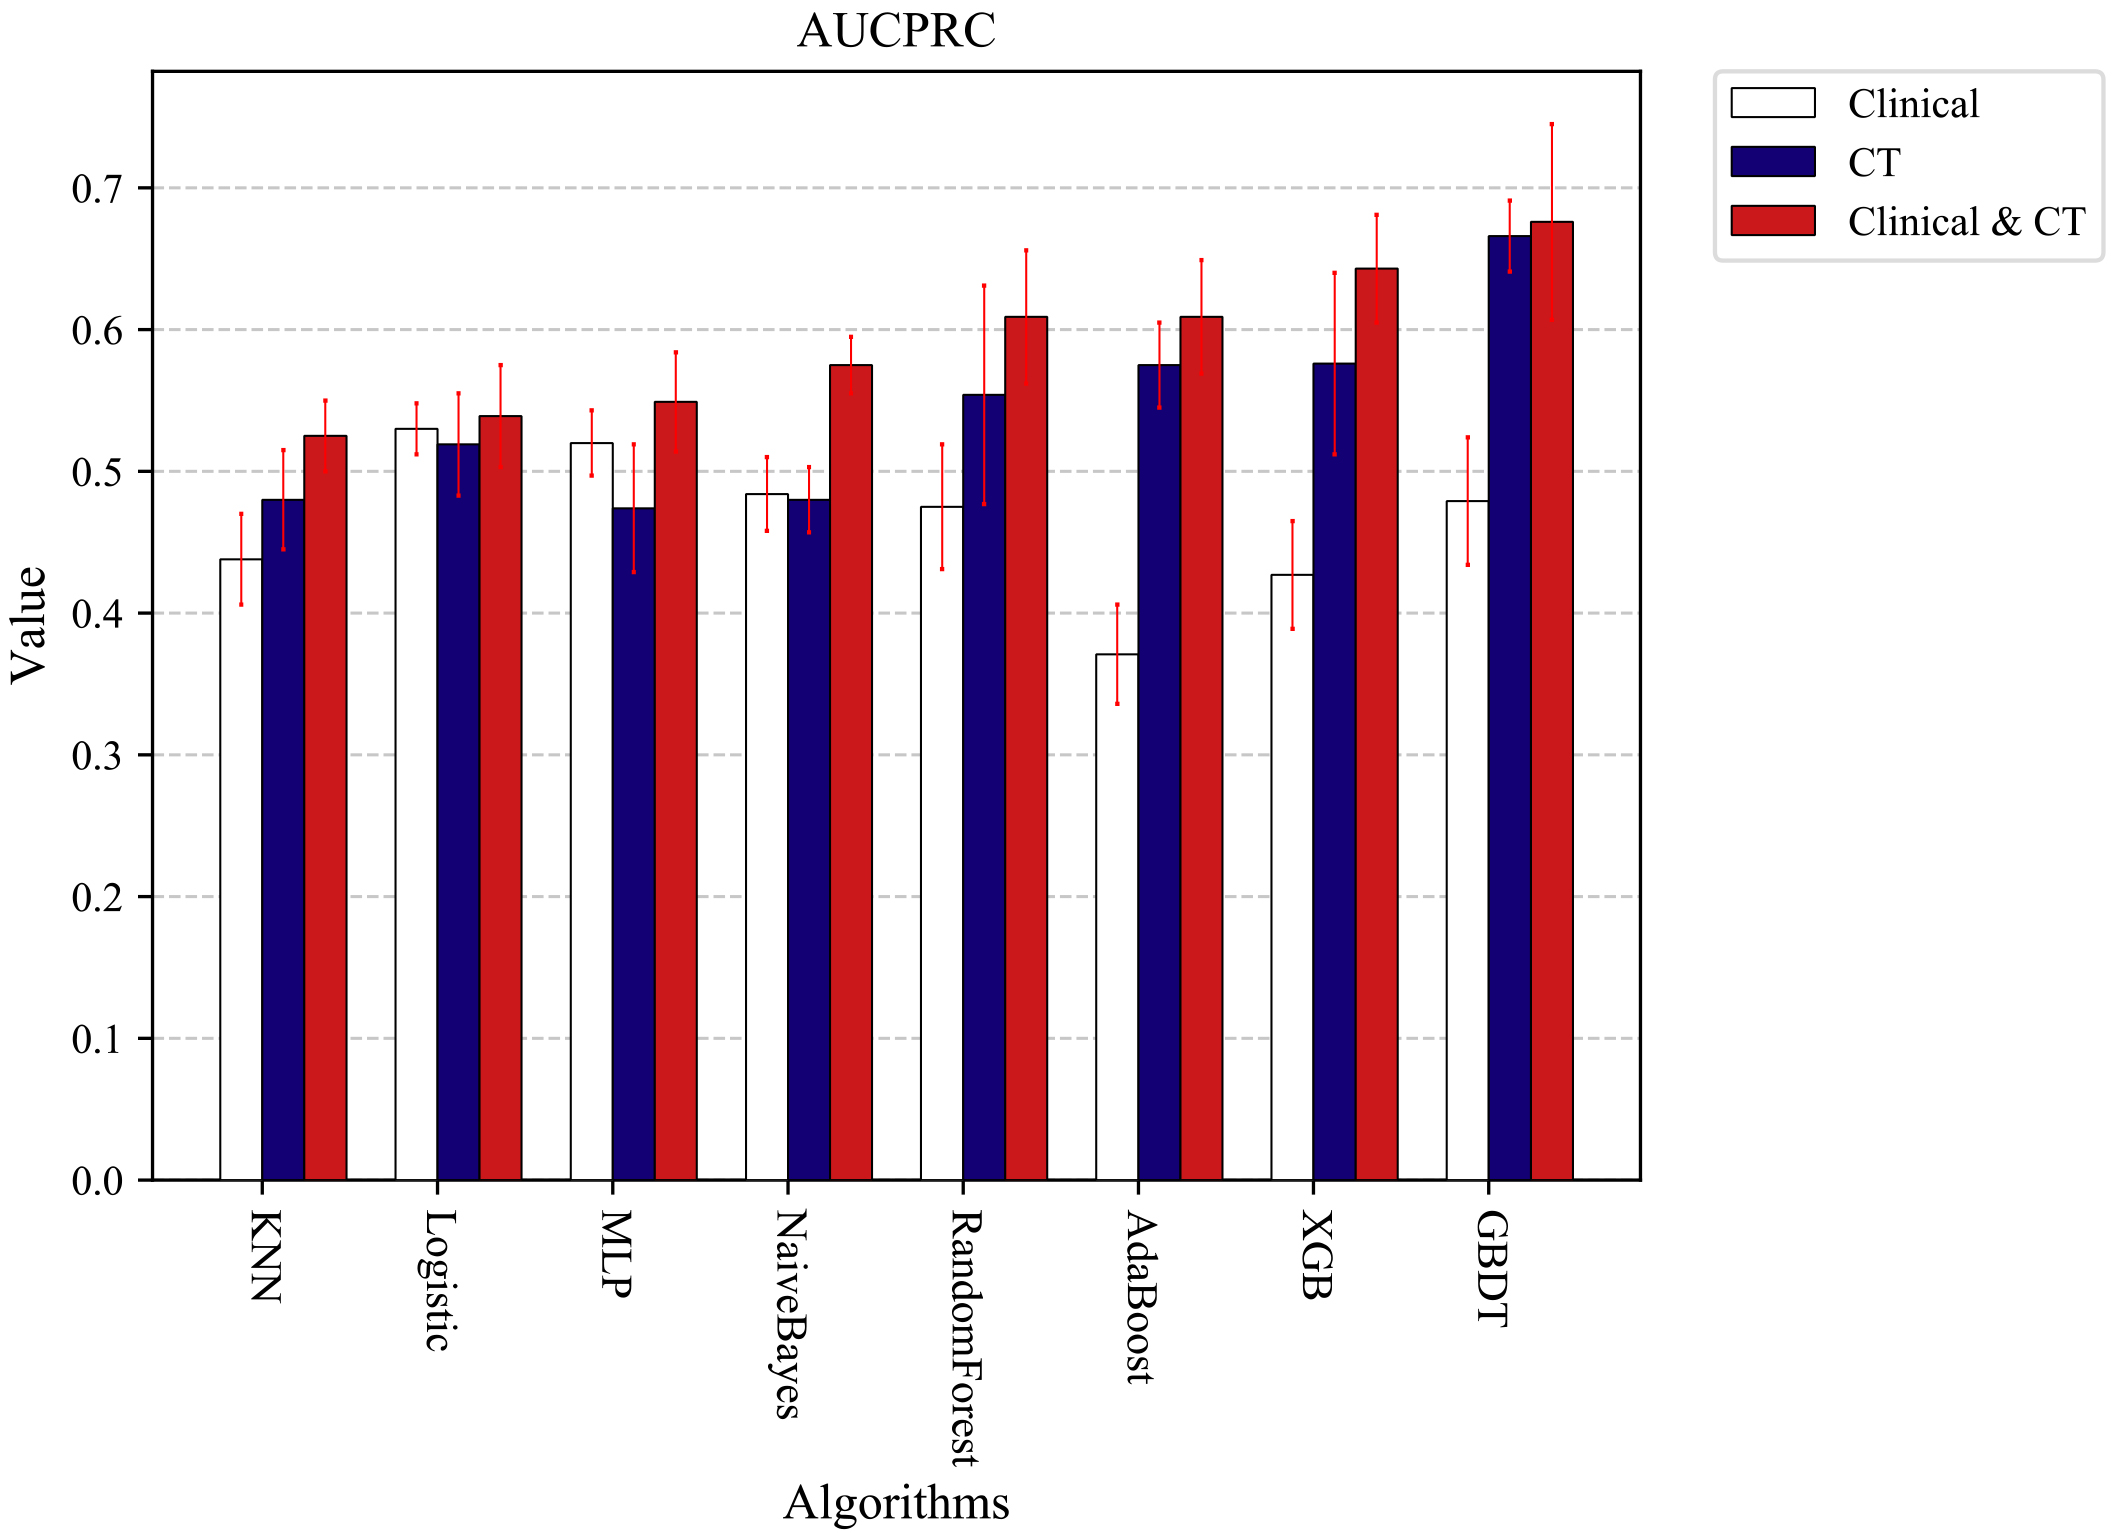
Figure 4.
Experimental results of AUCPRC obtained by various machine learning algorithms using different types of features.
The order of feature selection was sorted according to the score of the random forest algorithm from high to low. The feature importance scores of the clinical features and the CT extracted features are shown in Table 3. To get the best prediction results, we used gridSearchCV to optimize the parameters of each machine learning model. The optimal model parameters are shown in Table 4.
Table 3
Feature importance scores
| Feature name | Feature importance score |
|---|---|
| PO2 | 0.0513 |
| Age | 0.0264 |
| original_firstorder_Entropy | 0.0211 |
| original_glcm_SumEntropy | 0.0189 |
| PCT | 0.0180 |
| original_firstorder_RobustMeanAbsoluteDeviation | 0.0170 |
| Lactate dehy drogenase | 0.0168 |
| C-reactive protein | 0.0166 |
| original_glrlm_GrayLevelNonUniformityNormalized | 0.0164 |
| original_firstorder_Kurtosis | 0.0159 |
| original_firstorder_InterquartileRange | 0.0150 |
| original_glrlm_RunEntropy | 0.0150 |
| original_glcm_JointEnergy | 0.0147 |
| APTT | 0.0143 |
| original_glcm_JointEntropy | 0.0142 |
| original_firstorder_Skewness | 0.0140 |
| original_firstorder_Uniformity | 0.0135 |
| original_glszm_SmallAreaEmphasis | 0.0126 |
| original_glcm_Id | 0.0126 |
| eGFR | 0.0125 |
| original_glcm_InverseVariance | 0.0125 |
| Na | 0.0123 |
| original_glszm_SizeZoneNonUniformityNormalized | 0.0119 |
| Total cholesterol (TC) | 0.0115 |
| original_glszm_ZoneEntropy | 0.0104 |
| original_glszm_GrayLevelNonUniformityNormalized | 0.0098 |
| original_glszm_ZonePercentage | 0.0095 |
| original_firstorder_MeanAbsoluteDeviation | 0.0093 |
| original_glcm_MaximumProbability | 0.0092 |
| original_glcm_Idm | 0.0086 |
Table 4
The optimal model parameters
| Algorithm | Model parameters | Value |
|---|---|---|
| KNN | n_neighbors | 11 |
| p | 1 | |
| LR | Penalty | L2 |
| C | 1 | |
| class_weight | Balanced | |
| RF | class_weight | Balanced |
| Criterion | Entropy | |
| max_depth | 14 | |
| min_samples_leaf | 1 | |
| n_estimators | 65 | |
| XGB | learning_rate | 1 |
| n_estimators | 64 | |
| max_depth | 2 | |
| subsample | 0.8 | |
| reg_alpha | 0.1 | |
| reg_lambda | 1 | |
| GBDT | boosting_type | gbdt |
| colsample_bytree | 0.6 | |
| learning_rate | 1 | |
| n_estimators | 32 | |
| num_leaves | 50 | |
| objective | Binary | |
| reg_alpha | 0.1 | |
| reg_lambda | 10 | |
| subsample | 0.8 | |
| MLP | hidden_layer_sizes | 3 |
| Activation | Identity | |
| Solver | lbfgs | |
| learning_rate | Constant | |
| random_state | 2008 |
After parameter optimization and combining the optimal features, we trained the COVID-19 mild-severe prediction models with eight machine learning algorithms. Due to some imbalance in the experimental data, we finally chose the PRAUC value to verify the model’s goodness. Ten 3-fold cross-validation experiments were conducted separately, and the mean values were obtained as the final results of the experiments. Figure 4 shows the experimental results of AUCPRC obtained by each machine learning algorithm using different types of features. By comparing the experimental results, we can see that the final results obtained by different machine learning algorithms using the combined Clinical and CT radiomics features are higher than those obtained with clinical or CT radiomics features alone. The experimental results also further demonstrate the more accurate results of the machine learning classification model built using clinical and CT radiomics features. Therefore, to further verify the effect of data imbalance on the experimental results. We will select combined clinical and clinical feature data for further sampling experiments in the following experiments.
3.2Evaluation of diagnostic performance
In the following data sampling experiments, 3-fold cross-validation was used to divide the data, and then the divided data were combined with different sampling methods for the sampling experiments. The Under-sampling methods were used to sample 0.2, 0.4, 0.6, 0.8, and 1.0 times the majority of the data. The Over-sampling methods were used to sample 0.1, 0.2, 0.4, 0.6, and 0.8 times the majority of the data for the minority data. All sampling methods were performed on the training set data, and no processing was done on the test set data. Ten 3-fold cross-validation experiments were conducted separately, and the average of the ten experimental results was used as the final result. Figure 5 shows the results without the data sampling process. Figure 6 shows the optimal results after data sampling. By comparing Figs 5 and 6, it can be found that the model results still improve after sampling the data. RandomForest has the largest PRAUC value improvement of 3.7% after using the sampling method, and GBDT has the optimal PRAUC result of 0.697 in the used model after the sampling process.
Figure 5.
The optimal prediction results were obtained by each machine learning model trained using unsampled data.
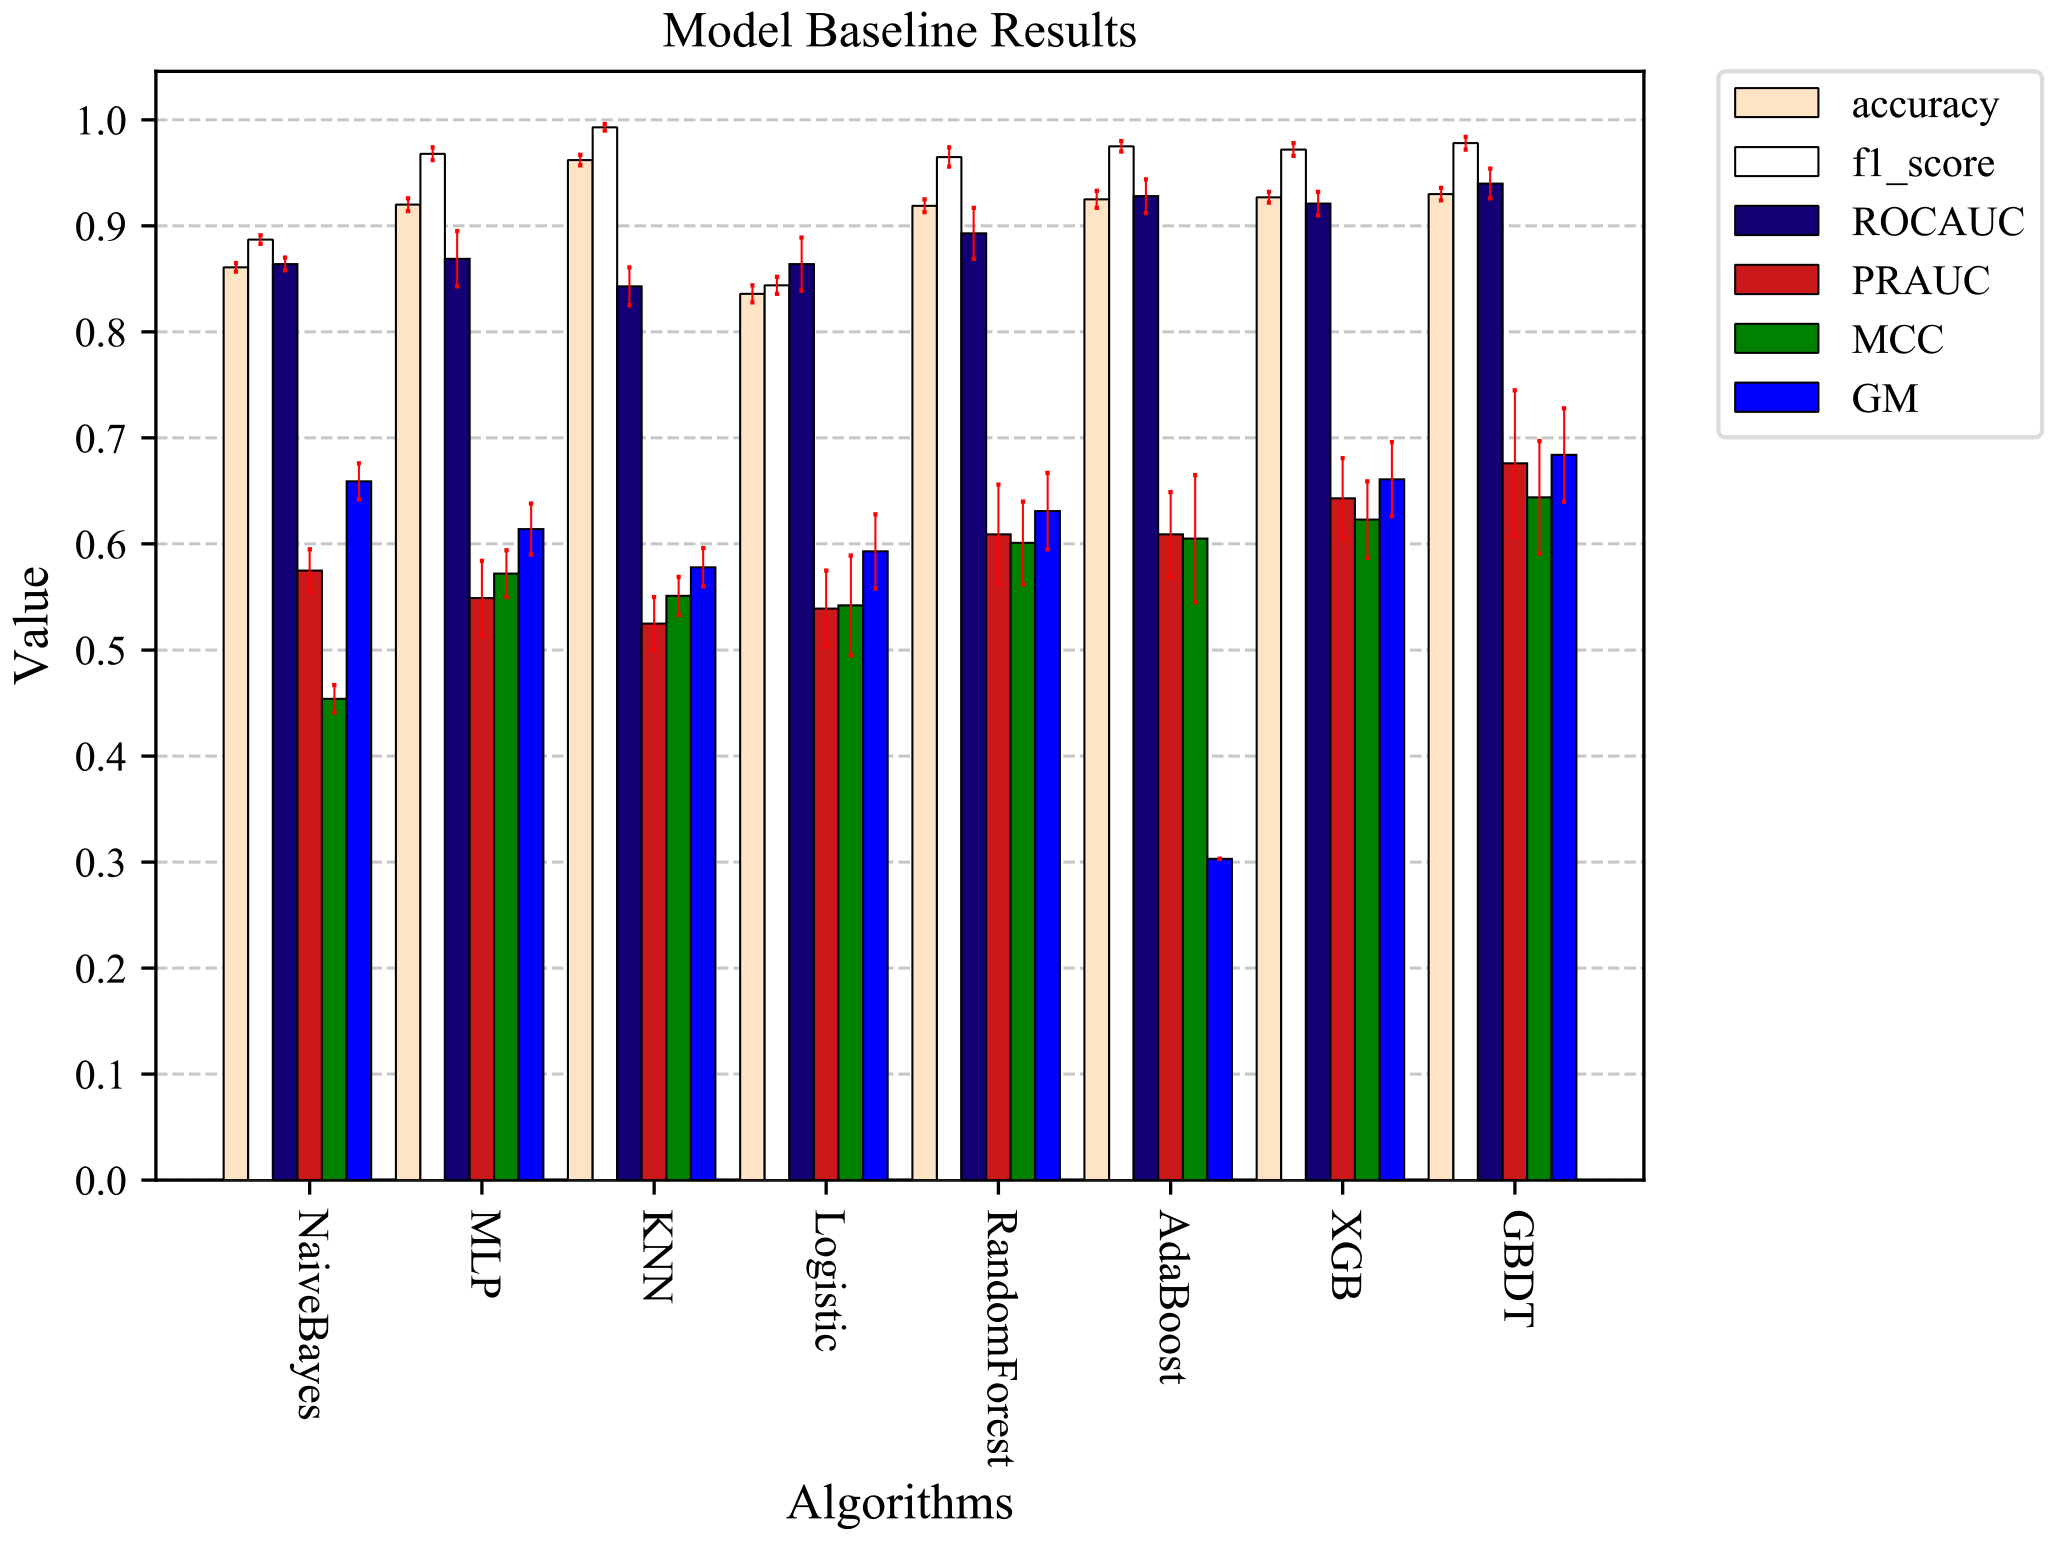
Figure 6.
The optimal prediction results were obtained by each machine learning model trained using sampled processed data.
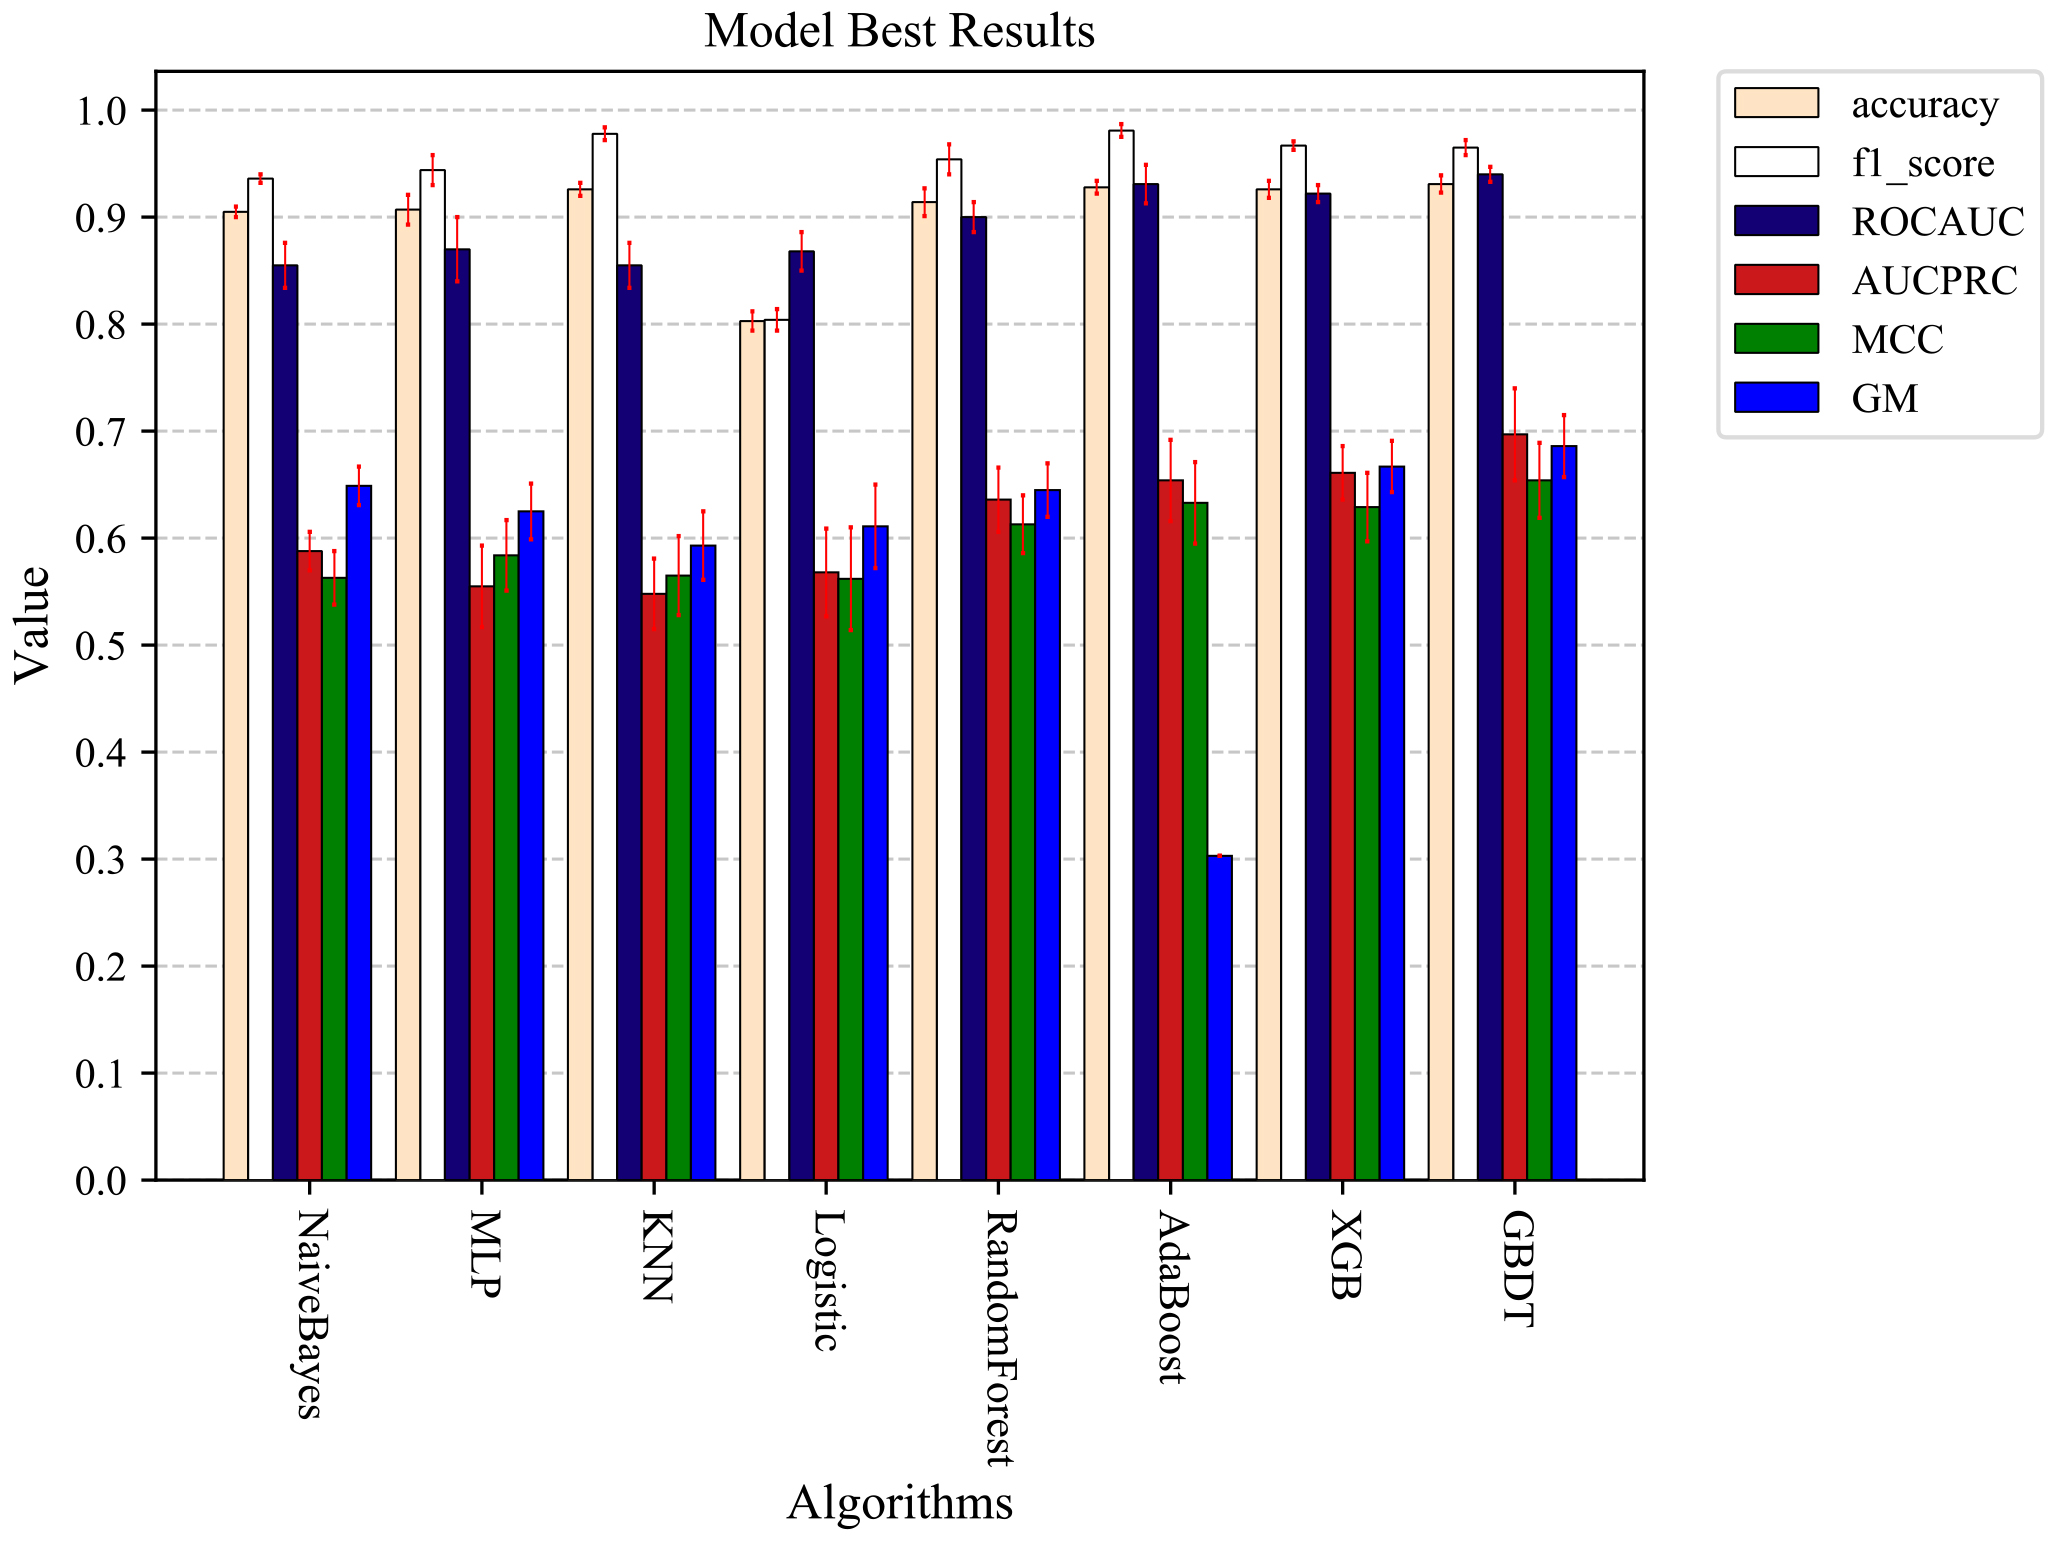
Table 5
The optimal prediction results of each machine learning model are obtained by training with data processed in different data sampling methods
| Model | Category | Method | Radio | Accuracy | f1-score | AUC | AUCPRC | MCC | GM |
|---|---|---|---|---|---|---|---|---|---|
| NB | ORG | 0.861 | 0.887 | 0.864 | 0.575 | 0.454 | 0.659 | ||
| Undersampling | NearMiss | 20 | 0.905 | 0.936 | 0.855 | 0.588 | 0.563 | 0.649 | |
| RandUnder | 80 | 0.864 | 0.889 | 0.865 | 0.577 | 0.452 | 0.663 | ||
| ClusterCentroids | 80 | 0.877 | 0.905 | 0.863 | 0.580 | 0.469 | 0.661 | ||
| Oversampling | BorderSMOTE1 | 100 | 0.835 | 0.852 | 0.867 | 0.579 | 0.431 | 0.662 | |
| BorderSMOTE2 | 40 | 0.838 | 0.858 | 0.865 | 0.579 | 0.437 | 0.660 | ||
| MLP | ORG | 0.920 | 0.968 | 0.869 | 0.549 | 0.572 | 0.614 | ||
| Undersampling | RandUnder | 80 | 0.915 | 0.959 | 0.868 | 0.552 | 0.575 | 0.615 | |
| ClusterCentroids | 80 | 0.916 | 0.965 | 0.869 | 0.554 | 0.567 | 0.614 | ||
| ENN | – | 0.907 | 0.944 | 0.870 | 0.555 | 0.584 | 0.625 | ||
| OSS | – | 0.917 | 0.962 | 0.870 | 0.554 | 0.569 | 0.610 | ||
| KNN | ORG | 0.928 | 0.993 | 0.843 | 0.525 | 0.551 | 0.578 | ||
| Undersampling | RandUnder | 40 | 0.926 | 0.978 | 0.864 | 0.549 | 0.559 | 0.591 | |
| ClusterCentroids | 80 | 0.927 | 0.991 | 0.849 | 0.526 | 0.542 | 0.570 | ||
| ENN | – | 0.929 | 0.982 | 0.853 | 0.541 | 0.554 | 0.581 | ||
| RENN | – | 0.923 | 0.969 | 0.854 | 0.537 | 0.552 | 0.583 | ||
| AllKNN | – | 0.926 | 0.978 | 0.855 | 0.548 | 0.565 | 0.593 | ||
| OSS | – | 0.930 | 0.991 | 0.844 | 0.532 | 0.557 | 0.582 | ||
| LR | ORG | 0.836 | 0.844 | 0.864 | 0.539 | 0.542 | 0.593 | ||
| Undersampling | ENN | – | 0.820 | 0.823 | 0.866 | 0.544 | 0.559 | 0.606 | |
| RENN | – | 0.803 | 0.804 | 0.868 | 0.568 | 0.562 | 0.611 | ||
| AllKNN | – | 0.818 | 0.818 | 0.868 | 0.553 | 0.563 | 0.613 | ||
| Oversampling | KMeansSMOTE | 100 | 0.890 | 0.920 | 0.864 | 0.558 | 0.567 | 0.610 | |
| SVMSMOTE | 40 | 0.857 | 0.872 | 0.863 | 0.556 | 0.563 | 0.608 | ||
| RF | ORG | 0.919 | 0.965 | 0.893 | 0.609 | 0.601 | 0.631 | ||
| Undersampling | ClusterCentroids | 60 | 0.921 | 0.965 | 0.906 | 0.629 | 0.598 | 0.635 | |
| ENN | – | 0.910 | 0.948 | 0.886 | 0.617 | 0.605 | 0.639 | ||
| AllKNN | – | 0.908 | 0.940 | 0.896 | 0.613 | 0.607 | 0.640 | ||
| CNN | – | 0.908 | 0.937 | 0.888 | 0.634 | 0.629 | 0.659 | ||
| OSS | – | 0.922 | 0.966 | 0.903 | 0.629 | 0.614 | 0.647 | ||
| Oversampling | RandOver | 20 | 0.917 | 0.956 | 0.901 | 0.629 | 0.611 | 0.646 | |
| SMOTE | 60 | 0.890 | 0.911 | 0.906 | 0.632 | 0.605 | 0.641 | ||
| KMeansSMOTE | 20 | 0.921 | 0.962 | 0.896 | 0.620 | 0.598 | 0.636 | ||
| SVMSMOTE | 20 | 0.914 | 0.954 | 0.900 | 0.636 | 0.613 | 0.645 | ||
| ADASYN | 20 | 0.908 | 0.940 | 0.898 | 0.612 | 0.611 | 0.645 | ||
| Over | SMOTETomek | 60 | 0.891 | 0.916 | 0.900 | 0.632 | 0.619 | 0.657 | |
| AdaBoost | ORG | 0.925 | 0.975 | 0.928 | 0.609 | 0.605 | 0.303 | ||
| Undersampling | RandUnder | 80 | 0.924 | 0.973 | 0.929 | 0.623 | 0.610 | 0.303 | |
| ClusterCentroids | 80 | 0.918 | 0.968 | 0.926 | 0.611 | 0.604 | 0.303 | ||
| TomekLinks | – | 0.928 | 0.981 | 0.931 | 0.654 | 0.633 | 0.303 | ||
| Oversampling | RandOver | 40 | 0.922 | 0.956 | 0.928 | 0.620 | 0.607 | 0.303 | |
| SMOTE | 40 | 0.911 | 0.942 | 0.917 | 0.616 | 0.617 | 0.303 | ||
| SVMSMOTE | 40 | 0.917 | 0.951 | 0.916 | 0.623 | 0.601 | 0.303 | ||
| Over | SMOTETomek | 20 | 0.920 | 0.964 | 0.922 | 0.620 | 0.601 | 0.303 | |
| XGB | ORG | 0.927 | 0.972 | 0.921 | 0.643 | 0.623 | 0.661 | ||
| Undersampling | ClusterCentroids | 80 | 0.926 | 0.967 | 0.922 | 0.661 | 0.629 | 0.667 | |
| Oversampling | SVMSMOTE | 20 | 0.924 | 0.967 | 0.917 | 0.655 | 0.632 | 0.667 | |
| GBDT | ORG | 0.930 | 0.978 | 0.940 | 0.676 | 0.644 | 0.684 | ||
| Undersampling | ClusterCentroids | 80 | 0.931 | 0.975 | 0.939 | 0.680 | 0.637 | 0.674 | |
| OSS | – | 0.932 | 0.974 | 0.938 | 0.679 | 0.635 | 0.672 | ||
| Oversampling | RandOver | 40 | 0.931 | 0.970 | 0.942 | 0.694 | 0.660 | 0.696 | |
| KMeansSMOTE | 40 | 0.932 | 0.971 | 0.940 | 0.680 | 0.640 | 0.677 | ||
| SVMSMOTE | 40 | 0.931 | 0.965 | 0.940 | 0.697 | 0.654 | 0.686 |
To further verify the final results of each machine learning algorithm under different sampling methods and sampling ratios, we collated all the results after sampling, and the final experimental results are shown in Table 5. By analyzing the experimental results in Table 5, we can find that the final results obtained by different models combined with different sampling methods and sampling ratios are different. The experimental results of all eight machine learning experiments were further improved after using the data after data sampling and processing. RandomForest obtained the largest AUCPRC value improvement of 2.7% for the data after sampling with SVMSMOTE. GBDT got the largest AUCPRC value of 0.697 among the eight machine learning prediction models after sampling with SVMSMOTE. GBDT used the RandOver sampling method to make the final combined performance optimal among the eight different machine learning algorithms, the accuracy is 0.931, the AUC is 0.942, and the AUCPRC is 0.694. The results can also provide some reference value for data imbalance experiments combining different algorithms and sampling methods to optimize the experimental results.
4.Discussion
The purpose of this study was to develop a diagnostic model for predicting the severity of patients with COVID-19. Using clinical features and CT radiomics features, the optimal prediction accuracy of 0.932 and AUC value of 0.942 were obtained for the diagnostic model based on the GBDT algorithm after data sampling processing and feature selection. The model can assist clinicians in screening patients with severe COVID-19, providing more medical resources for these patients, and can also be used to improve patient prognosis decisions and assess prognostic treatment outcomes.
Several studies have been conducted to build diagnostic models for the severity of COVID-19 patients using machine learning algorithms, and details of the diagnostic models are shown in Table 6. These studies used patients’ clinical features to build diagnostic models and did not consider the impact of CT radiomics features on model prediction performance. In our study, to further validate the effect of CT radiomics features on the prediction model’s performance, we segmented the ROI on the chest CT by using SP-V-Net and extracted the CT radiomics features on the ROI. Experiments were performed separately using clinical features, CT radiomics features, and a mixture of both. Figure 4 shows that the COVID-19 mild-severe prediction model built by using a mixture of features of both has better performance.
Table 6
Comparison of machine learning-based methods for COVID-19 mild and severe diagnostic studies
| Study | Features | ML approaches | Sample size | Performance |
|---|---|---|---|---|
| Terwangne et al. [11] | clinical | Bayesian | 295 patients ( | AUC of 83.8% |
| Yao et al. [12] | clinical | SVM | 137 patients (75 severe) | Accuracy of 81.48% |
| Zhao et al. [13] | clinical | SVM | 172 patients (60 severe) | Accuracy of 91.38% |
| Liang et al. [14] | clinical | LR | 1590 patients (131 severe) | AUC of 88% |
| Zhu et al. [15] | clinical | LR | 127 patients (16 severe) | AUC of 90.0% |
| Our method | clinical | GBDT | 427 patients (40 severe) | Accuracy of 0.931 and |
| AUC of 0.942 |
The data imbalance problem was widely present in many real-world decision problems, and in medical diagnosis models, the data imbalance problem can have a negative impact on experimental results. The problem of data imbalance in the studies of Liang et al. [14] and Zhu et al. [15] was not addressed. In our research, to reduce the impact of the data imbalance problem on the prediction results, we sampled the data using three different data sampling methods. By comparing Figs 5 and 6, it can be found that the prediction results of different models were still further improved after the data imbalance treatment. In this study, the optimal prediction results were obtained using integrated models such as GBDT, AdaBoost, and XGB combined with the data after sampling. These classifiers all used integrated learning techniques to improve the accuracy of individual classifiers and overall classifier performance. And related studies have demonstrated that the model prediction performance can be further improved by using integrated models when dealing with data imbalance problems [43].
By further feature ranking and screening of a mixture of CT radiomics features and clinical features, we found that PO2, age, PCT, LDH, and CRP were the five most important clinical risk factors with the most severe degree of prognostic observation for patients with COVID-19, and this result was also consistent with previous related studies. Studies have shown that older age, elevated PCT, LDH, and CRP are all important correlates of the severity of COVID-19 [17]. More important is the continued importance of image features extracted from chest CT to diagnose mild to severe disease in patients with COVID-19. The combination of clinical features and chest CT extracted features has a good performance in diagnosing the severity of COVID-19. COVID-19 patients have specific chest CT image features, including ground-glass opacities (GGO), multifocal patchy consolidation, or interstitial changes in the peripheral distribution [44]. The increase in lesion volume, gross glass volume, and other volumes also provided the possibility for the model to predict the severity of COVID-19.
Machine learning algorithms are now widely used in complementary medical diagnosis and are playing an increasingly important role. Catic et al. [45] built prenatal diagnosis classification models using Artificial Neural Networks (ANNs) artificial neural networks to help physicians in their daily work, eventually obtaining feedforward neural networks with an average accuracy of 89.6% and feedback of 98.8%. Begic et al. [46] applied machine learning algorithms to diagnose congenital heart defects, obtaining a diagnostic accuracy of 94.28% by making the model built by SVM. Stokes et al. [47] applied the trained machine learning model to diagnose and refer to bronchitis and pneumonia. They obtained a 93% AUC value model performance by using decision trees. In our study, the COVID-19 mild-severe diagnostic model built using the GBDT algorithm obtained optimal predictive performance with an accuracy of 93.2% and an AUC of 94.2%. Compared with the above three studies, the model we developed also has good performance in diagnosing mild and severe COVID-19, which can assist physicians in the early detection of severe COVID-19 patients and provide them with better medical resources, and this study has better clinical significance. ML can help improve disease-specific diagnostic systems’ reliability, performance and accuracy. The research and application of ML in the medical field are also increasing, and the related research will provide more convenience for doctors and patients.
The present study still has some limitations that need to be considered. First, the number of patients with COVID-19 is relatively small, limiting the accuracy of the predictive model. Second, the diversity of data in our study is limited, all subjects are Chinese COVID-19 patients, and the results may not be fully applicable to data from other countries. Third, the number of severe patients’ data is small, and the mild and severe patients’ data are imbalanced. We need to collect more COVID-19 patient data, especially severe patients. Further research is still required.
5.Conclusions
This study proves that the COVID-19 mild-severe prediction model based on features extracted from chest CT and clinical characteristics can effectively differentiate the severity of COVID-19 patients and can provide helpful insights for early diagnosis of patients with COVID-19 mild-severe disease. And the prediction models based on both chest CT features and clinical features had higher prediction performance than those built using the two different types of data alone. The results could help clinicians more effectively assess the severity of COVID-19 patients and stratify patients for treatment to reduce potential mortality and ease the burden of care.
Acknowledgments
This research was funded by Henan Science and Technology Development Plan 2022 (grant number 222102210219) and Zhengzhou University of Light Industry (grant number 2019ZCKJ228).
Ethics statement
The study was conducted in accordance with the Declaration of Helsinki and approved by the Institutional Review Board (or Ethics Committee) of the Shanghai Public Health Clinical Center (YJ-2020-S035-01, approval on 22 February 2020).
References
[1] | WHO Coronavirus (COVID-19) Dashboard Data [WHO (COVID-19) Homepage]. World Health Organization; 2022 [updated 2022 May 25; cited 2022 May 26]. Available from: https://covid19.who.int/. |
[2] | Jin X, Pang B, Zhang J, Liu Q, Yang Z, Feng J, et al. Core outcome set for clinical trials on coronavirus disease 2019 (COS-COVID). Engineering. (2020) ; 6: (10): 1147-52. |
[3] | Xu Z, Shi L, Wang Y, Zhang J, Huang L, Zhang C, et al. Pathological findings of COVID-19 associated with acute respiratory distress syndrome. The Lancet Respiratory Medicine. (2020) ; 8: (4): 420-2. |
[4] | Shi H, Han X, Jiang N, Cao Y, Alwalid O, Gu J, et al. Radiological findings from 81 patients with COVID-19 pneumonia in Wuhan, China: A descriptive study. The Lancet Infectious Diseases. (2020) ; 20: (4): 425-34. |
[5] | Ai T, Yang Z, Hou H, Zhan C, Chen C, Lv W, et al. Correlation of chest CT and RT-PCR testing for coronavirus disease 2019 (COVID-19) in China: A report of 1014 cases. Radiology. (2020) ; 296: (2): E32-E40. |
[6] | Zu ZY, Jiang MD, Xu PP, Chen W, Ni QQ, Lu GM, et al. Coronavirus disease 2019 (COVID-19): A perspective from China. Radiology. (2020) ; 296: (2): E15-E25. |
[7] | Lei J, Li J, Li X, Qi X. CT imaging of the 2019 novel coronavirus (2019-nCoV) pneumonia. Radiology. (2020) ; 295: (1): 18-. |
[8] | Kanne JP. Chest CT findings in 2019 novel coronavirus (2019-nCoV) infections from Wuhan, China: key points for the radiologist. Radiological Society of North America; (2020) . 16-7. |
[9] | Pan Y, Guan H. Imaging changes in patients with 2019-nCov. Springer; (2020) . 3612-3. |
[10] | Ng M-Y, Lee EY, Yang J, Yang F, Li X, Wang H, et al. Imaging profile of the COVID-19 infection: Radiologic findings and literature review. Radiology: Cardiothoracic Imaging. (2020) ; 2: (1): e200034. |
[11] | de Terwangne C, Laouni J, Jouffe L, Lechien JR, Bouillon V, Place S, et al. Predictive accuracy of COVID-19 world health organization (Who) severity classification and comparison with a bayesian-method-based severity score (epi-score). Pathogens. (2020) ; 9: (11): 880. |
[12] | Yao H, Zhang N, Zhang R, Duan M, Xie T, Pan J, et al. Severity detection for the coronavirus disease 2019 (COVID-19) patients using a machine learning model based on the blood and urine tests. Frontiers in cell and developmental biology. (2020) . 683. |
[13] | Zhao C, Bai Y, Wang C, Zhong Y, Lu N, Tian L, et al. Risk factors related to the severity of COVID-19 in Wuhan. International Journal of Medical Sciences. (2021) ; 18: (1): 120. |
[14] | Liang W, Liang H, Ou L, Chen B, Chen A, Li C, et al. Development and validation of a clinical risk score to predict the occurrence of critical illness in hospitalized patients with COVID-19. JAMA Internal Medicine. (2020) ; 180: (8): 1081-1089. |
[15] | Zhu Z, Cai T, Fan L, Lou K, Hua X, Huang Z, et al. Clinical value of immune-inflammatory parameters to assess the severity of coronavirus disease 2019. International Journal of Infectious Diseases. (2020) ; 95: : 332-9. |
[16] | Van Buuren S, Groothuis-Oudshoorn K. mice: Multivariate imputation by chained equations in R. Journal of Statistical Software. (2011) ; 45: : 1-67. |
[17] | Zhao C, Xu Y, He Z, Tang J, Zhang Y, Han J, et al. Lung segmentation and automatic detection of COVID-19 using radiomic features from chest CT images. Pattern Recognition. (2021) ; 119: : 108071. |
[18] | Zwanenburg A, Leger S, Vallières M, Löck S. Image biomarker standardisation initiative. arXiv preprint arXiv:161207003. 2016. |
[19] | Koller D, Sahami M. Toward optimal feature selection. Stanford InfoLab; (1996) . |
[20] | Zhu F, Li X, Tang H, He Z, Zhang C, Hung G-U, et al. Machine learning for the preliminary diagnosis of dementia. Scientific Programming. (2020) ; 2020. |
[21] | Bahad P, Saxena P, editors. Study of adaboost and gradient boosting algorithms for predictive analytics. International Conference on Intelligent Computing and Smart Communication 2019; Springer; (2020) . |
[22] | Lusa L. Gradient boosting for high-dimensional prediction of rare events. Computational Statistics & Data Analysis. (2017) ; 113: : 19-37. |
[23] | Neagoe V-E, Ciotec A-D, Cucu G-S, editors. Deep convolutional neural networks versus multilayer perceptron for financial prediction. 2018 International Conference on Communications (COMM); IEEE; (2018) . |
[24] | Chen T, Guestrin C, editors. Xgboost: A scalable tree boosting system. Proceedings of the 22nd acm sigkdd international conference on knowledge discovery and data mining; (2016) . |
[25] | Chen Z, Zhou LJ, Da Li X, Zhang JN, Huo WJ. The Lao text classification method based on KNN. Procedia Computer Science. (2020) ; 166: : 523-8. |
[26] | Luo C-L, Rong Y, Chen H, Zhang W-W, Wu L, Wei D, et al. A logistic regression model for noninvasive prediction of AFP-negative hepatocellular carcinoma. Technology in Cancer Research & Treatment. (2019) ; 18: : 1533033819846632. |
[27] | Battineni G, Sagaro GG, Nalini C, Amenta F, Tayebati SK. Comparative machine-learning approach: A follow-up study on type 2 diabetes predictions by cross-validation methods. Machines. (2019) ; 7: (4): 74. |
[28] | Pal M. Random forest classifier for remote sensing classification. International Journal of Remote Sensing. (2005) ; 26: (1): 217-22. |
[29] | Singh H, Kaur K. New method for finding initial cluster centroids in K-means algorithm. International Journal of Computer Applications. (2013) ; 74: (6). |
[30] | Tahir MA, Kittler J, Yan F. Inverse random under sampling for class imbalance problem and its application to multi-label classification. Pattern Recognition. (2012) ; 45: (10): 3738-50. |
[31] | Mani I, Zhang I, editors. kNN approach to unbalanced data distributions: a case study involving information extraction. Proceedings of workshop on learning from imbalanced datasets; ICML; (2003) . |
[32] | Tomek I. Two modifications of CNN. IEEE Trans Systems, Man and Cybernetics. (1976) ; 6: : 769-72. |
[33] | Wilson DL. Asymptotic properties of nearest neighbor rules using edited data. IEEE Transactions on Systems, Man, and Cybernetics. 1972(3): 408-21. |
[34] | Hart P. The condensed nearest neighbor rule (corresp).. IEEE Transactions on Information Theory. (1968) ; 14: (3): 515-6. |
[35] | Kubat M, Matwin S, editors. Addressing the curse of imbalanced training sets: one-sided selection. Icml; (1997) ; Citeseer. |
[36] | Tomek I. AN EXPERIMENT WITH THE EDITED NEAREST-NIEGHBOR RULE. (1976) . |
[37] | Chawla NV, Bowyer KW, Hall LO, Kegelmeyer WP. SMOTE: Synthetic minority over-sampling technique. Journal of Artificial Intelligence Research. (2002) ; 16: : 321-57. |
[38] | Han H, Wang W-Y, Mao B-H, editors. Borderline-SMOTE: a new over-sampling method in imbalanced data sets learning. International conference on intelligent computing; Springer; (2005) . |
[39] | Last F, Douzas G, Bacao F. Oversampling for imbalanced learning based on k-means and smote. arXiv preprint arXiv:171100837. (2017) . |
[40] | Nguyen HM, Cooper EW, Kamei K. Borderline over-sampling for imbalanced data classification. International Journal of Knowledge Engineering and Soft Data Paradigms. (2011) ; 3: (1): 4-21. |
[41] | He H, Bai Y, Garcia EA, Li S, editors. ADASYN: Adaptive synthetic sampling approach for imbalanced learning. 2008 IEEE International Joint Conference on Neural Networks (IEEE World Congress on Computational Intelligence); IEEE; (2008) . |
[42] | Batista GE, Bazzan AL, Monard MC, editors. Balancing Training Data for Automated Annotation of Keywords: a Case Study. WOB; (2003) . |
[43] | Galar M, Fernandez A, Barrenechea E, Bustince H, Herrera F. A review on ensembles for the class imbalance problem: Bagging-, boosting-, and hybrid-based approaches. IEEE Transactions on Systems, Man, and Cybernetics, Part C (Applications and Reviews). (2011) ; 42: (4): 463-484. |
[44] | Chung M, Bernheim A, Mei X, Zhang N, Huang M, Zeng X, et al. CT imaging features of 2019 novel coronavirus (2019-nCoV). Radiology. (2020) ; 295: (1): 202-7. |
[45] | Catic A, Gurbeta L, Kurtovic-Kozaric A, Mehmedbasic S, Badnjevic A. Application of neural networks for classification of patau, edwards, down, turner and klinefelter syndrome based on first trimester maternal serum screening data, ultrasonographic findings and patient demographics. Bmc Medical Genomics. (2018) ; 11: (1): 19. |
[46] | Begic E, Gurbeta Pokvic L, Begic Z, Begic N, Dedic M, Mrsic D, Badnjevic AFROM. Heart murmur to echocardiography-congenital heart defects diagnostics using machinelearning algorithms. Psychiatria Danubina. (2021) ; 33: (suppl 13): 236-246. |
[47] | Stokes K, Castaldo R, Franzese M, Salvatore M, Fico G, Pokvic LG, Pecchia L. A machine learning model for supporting symptom-based referral and diagnosis of bronchitis and pneumonia in limited resource settings. Biocybernetics and Biomedical Engineering. (2021) ; 41: (4): 1288-1302. |


