
Detection of COVID-19 Infection in CT and X-ray images using transfer learning approach
Abstract
BACKGROUND:
The infection caused by the SARS-CoV-2 (COVID-19) pandemic is a threat to human lives. An early and accurate diagnosis is necessary for treatment.
OBJECTIVE:
The study presents an efficient classification methodology for precise identification of infection caused by COVID-19 using CT and X-ray images.
METHODS:
The depthwise separable convolution-based model of MobileNet V2 was exploited for feature extraction. The features of infection were supplied to the SVM classifier for training which produced accurate classification results.
RESULT:
The accuracies for CT and X-ray images are 99.42% and 98.54% respectively. The MCC score was used to avoid any mislead caused by accuracy and F1 score as it is more mathematically balanced metric. The MCC scores obtained for CT and X-ray were 0.9852 and 0.9657, respectively. The Youden’s index showed a significant improvement of more than 2% for both imaging techniques.
CONCLUSION:
The proposed transfer learning-based approach obtained the best results for all evaluation metrics and produced reliable results for the accurate identification of COVID-19 symptoms. This study can help in reducing the time in diagnosis of the infection.
1.Introduction
The World Health Organisation (WHO) declared the infection caused by severe acute respiratory syndrome coronavirus (SARS-CoV-2) a global pandemic as the infection spread rapidly throughout the globe. SARS-CoV-2 was renamed COVID-19 by the WHO on Feb 11, 2020 [1]. The presence or absence of protective immunity due to infection or vaccination will affect future transmission and illness severity [2]. The issues caused by COVID-19 are highly complex, which can lead to the severe infections of the lungs and can spread to other organs. The symptoms of COVID-19 take 11–12 days to develop after infection [3, 4]. The timely identification of COVID-19 is much necessary else; it can cause severe issues to humans. The radiographic imaging tools for detection of COVID-19 are Computed Tomography (CT) and X-ray [5]. The computer-based analysis is quite demanding for the analysis of this infection as there is a lot of burdens nowadays on the medical system. In such a situation, computer analysis can save the time and burden of the doctors. The researchers are working across the globe for finding the best feasible solution to accurately detect the COVID-19 infection using computer-based analysis. The infections caused by viral pneumonia infections and COVID-19 are almost comparable [6]. Thus the detection of COVID-19 becomes a tedious task as features of COVID-19 overlaps with the other inflammatory diseases of the lung, including different types of pneumonia. The incorrect detection of COVID-19 may lead to the danger of life. Machine Learning-based methods are detecting the infection quite accurately as proposed in the available literature, but these approaches need handcrafted features for training [7, 8]. The features are extracted using some predefined methods and are then supplied to the classifier for learning [9].
Deep learning-based approaches [10, 11, 12] are gaining considerable attention for computer-based detection of COVID-19 as these approaches are capable of extracting the features on their own and produce more reliable result [13, 14]. Performing the specific task in one domain by using the knowledge acquired from other domain is termed transfer learning [15]. In transfer learning-based approaches, the knowledge is transferred from a source to target for improving the task-specific efficiency of the target [17].
The transfer learning-based methods are categorized into three categories, namely 1) Inductive transfer learning, 2) Transductive transfer learning, and 3) Unsupervised transfer learning. The task of source and target are same in inductive transfer learning while in transductive learning, the task of source and target are different. The unsupervised transfer learning is same as inductive learning, but the target tasks are unsupervised. The machine learning and deep learning approaches which utilized transfer learning showed remarkable improvement in the classification task. These methods reveal the features of the infection, which are not clearly visible in the original images as a better understanding of pathophysiology related to COVID-19 is important to improve the treatment process.
The convolutional neural network (CNN) architectures have shown good efficiency in classifying the infected images [18]. CNN-based binary classifier was used by Asnaoui and Chaw [19] to classify the CT images for detecting the infection. RCNN-based classification technique was proposed by Zreik et al. [20] to classify the coronary artery plaque. Li et al. developed the Cov-Net model to extract the features of COVID-19 and showed a remarkable improvement in the classification of infected images. Melanoma dermoscopy images were classified by Hagerty et al. [21] with remarkable accuracy using the deep learning-based method. VGG-16-based model for identification of lung infection was proposed by Li et al. [22]. Identification of thoracic diseases was made with the incorporation of DenseNet model [23]. An Inception Net-based model was used by Wang et al. [24] to identify abnormalities of COVID-19. An accuracy of 85.20% was achieved by classifying 1065 CT images. Resnet-based transfer learning technique was proposed by Ayrton, who achieved validation accuracy of about 96%. U-Net ++-based model was used by Chen et al. [25] for covid-1p classification, and the accuracy achieved was 98.85%. The pretrained U-net architecture for segmentation of 3D Lung images was used by Zheng et al. [26] and then they applied the DL method for determination of COVID-19 infection. The accuracy obtained by them was 95.9%. A CT analysis method for detection of COVID-19 infection using artificial intelligence was proposed by Gozes et al. [27]. Recently, DCNN-based structure was presented by Linda et al. [28] for detection of COVID-19 from chest X-ray images. The proposed model classified X-ray and CT images with significant increment in the results as compared with other methods. The results were compared using various evaluation metrics. To avoid the ambiguity caused by some metrics, additional metrics are used to confirm the effectiveness of results. Accuracy and F score sometimes misleads the classification judgment [29], so Matthews correlation coefficient (MCC) is used for better understanding [30]. The proposed classifier learns the features with the help of transfer learning and produces remarkable results for both CT as well as X-ray images. The main advantage of the proposed technique is the reduction in training time and requirement of fewer data along with remarkable improvement in image evaluation statistics. Finding a faster method to identify COVID-19 infected images is the driving force behind our endeavour. In order to save medical professionals’ time, it can aid in the automatic detection of COVID-19 images.
2.Methodology
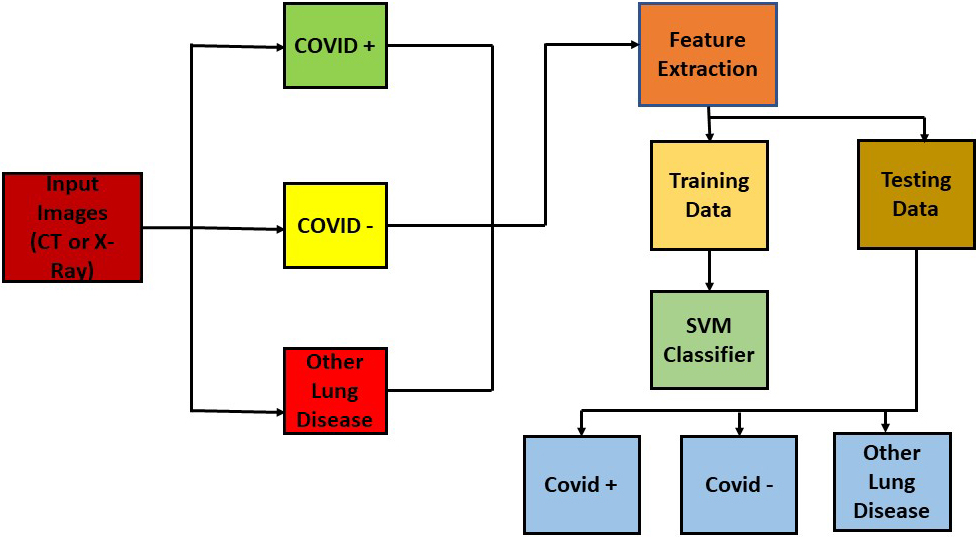
The CT and X-Ray images in the presented work are classified using a transfer learning-based method because both image modalities are utilised to identify COVID-19 symptoms. In this work, the SVM classifier [29] is utilised for classification. The features of the images were extracted using MobileNet V2 architecture. The SVM classifier efficiently classified the infected images after receiving the derived features. The feature extraction process also utilised a number of different networks for comparison. As a comparison tool, the SVM classifier also received the characteristics that were retrieved by several network designs. Transfer learning was used to expedite the classification of photos that were important from a medical standpoint. The pipeline of the suggested work is depicted in Fig. 2.
Figure 1.
Graphical abstract.
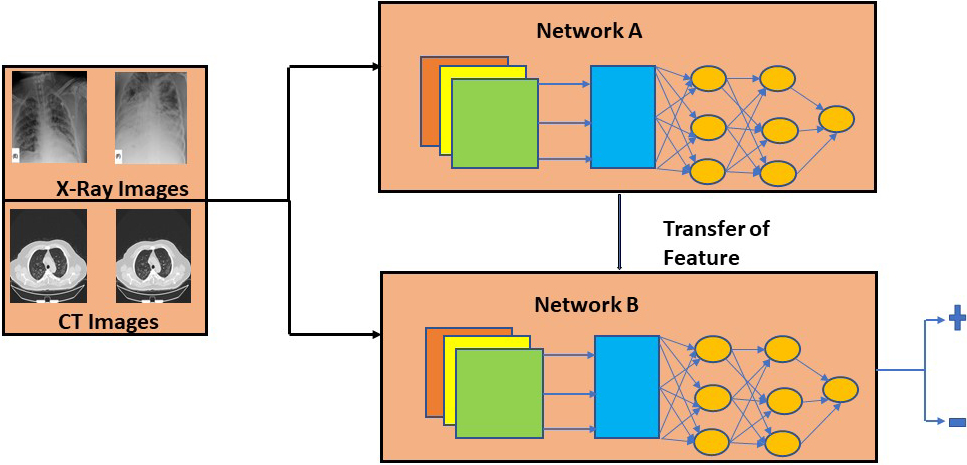
Figure 2.
Pipeline of the proposed work.
Transfer learning eliminates the requirement to train the classifier from scratch since it makes use of the knowledge amassed by a network on a large training dataset with labels that are readily available [30]. In the field of machine and deep learning, transfer learning is a type of design process. Deep learning models typically extract the features of edges in the earliest layers for applications linked to computer vision. The specific features linked to the particular purpose for which the network is designed are extracted by the intermediary layers. Typically, the last layers in a transfer learning approach are taught. This method has the benefit of saving time while training large networks and removing the requirement for big training datasets. Thus, the expertise acquired by one network to do a particular task is utilised to complete a different task. We trained an SVM classifier for the classification of CT and X-ray images infected by COVID-19 using the knowledge gathered by the MobileNet model and other state of the art models for comparison. The entire transfer learning process is depicted in Fig. 3.
Figure 3.
Feature transfer using transfer learning.
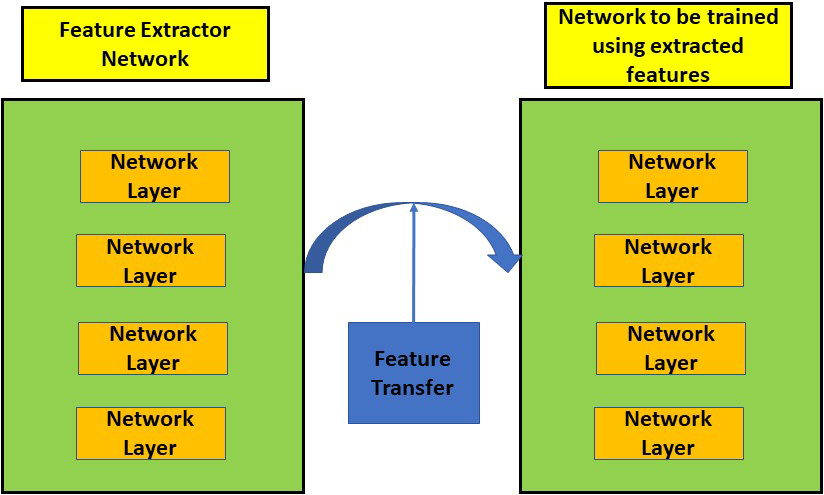
Figure 4.
Depthwise separable convolution block.
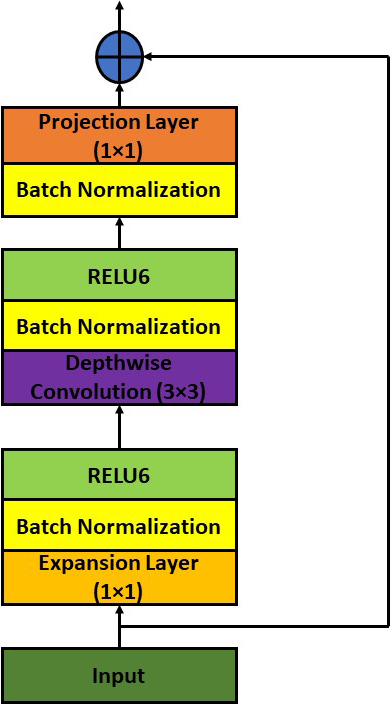
Figure 5.
MobileNet V2 architecture for classification.
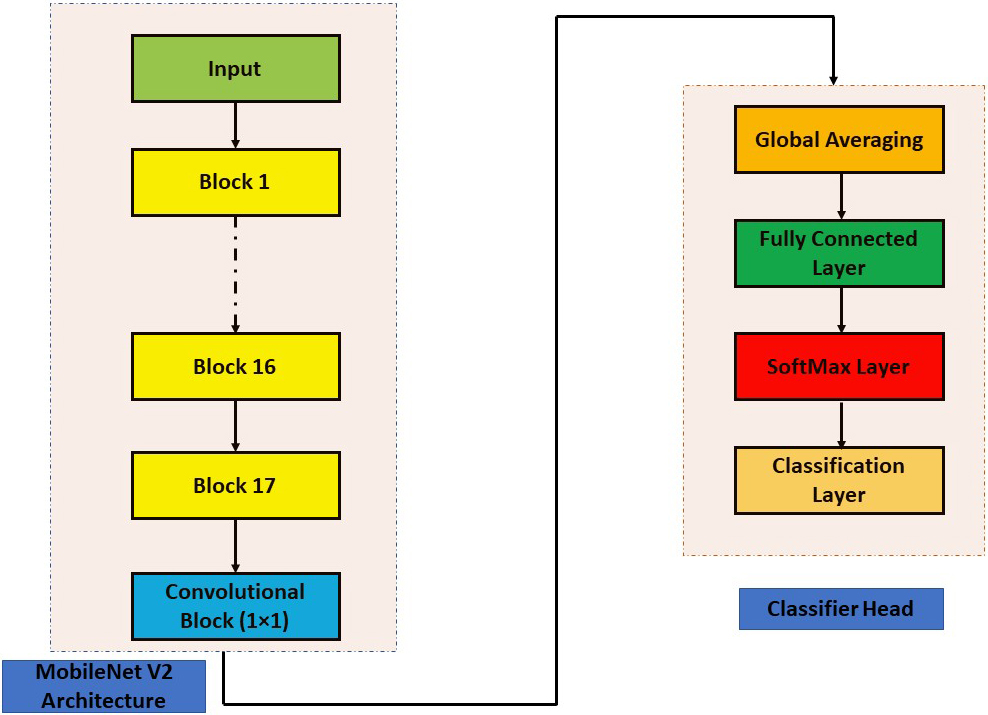
2.1MobileNet V2
The next-generation architecture for all-purpose computer vision applications is called MobileNet V2 [31] and was created by Google Brain. Low power and low latency models from the MobileNet family are employed to complete a variety of computer vision use cases. The depthwise separable convolution [33] is the fundamental building element for MobileNet V1 [32]. The linear bottlenecks between the layers and the shortcut connections between the bottleneck blocks are included in MobileNet version 2. The in-between inputs and outputs are encoded by the bottlenecks. The middle layers are responsible for converting lower-level components like pixels to higher-level images like images. Figure 5 depicts the MobileNet V2 bottleneck block that is still in place. Expansion Layer, Depth Wise Convolutional Layer, and Projection Layer are the names of the layers. Depth-wise convolution is incorporated, and each input channel receives a single filter. A pointwise 1
Depth wise convolution with one filter per input channel (input depth) can be written as:
(1)
Where
(2)
Equation (2) is the sum of depthwise convolution and 1
The SVM classifier receives the MobileNetV2 features that were finely extracted. The prime strength of the SVM is its non-probabilistic nature. It separates data across a decision boundary determined by only a small subset of the data. The subset of data which supports the decision boundary are known as support vectors. The other data does not have any effect in determining the position of the boundary. The SVM problem can be understood as a basic optimization problem in which a decision boundary is evaluated which gives maximum distance between the classes. It first finds the hyperplane that has the maximum margin and this hyperplane is used to predict the class of new data object. The equation of hyperplane is given as:
The polynomial kernel function was used to train the SVM. The data was split in to the ratio of 80:20 for training and testing. The MobileNet V2 extracted the features of COVID-19 from CT as well as X-Ray images. Both types of image features extracted by MobileNet V2 were fed to the SVM classifier for training. The SVM effectively classified the COVID-19 infected images for both modalities, i.e. CT and X-ray. Other five networks were also used to supply the extracted features to the SVM classifier for identification of images. These networks are Shufflenet, Alexnet, Darknet, Resnet and Inception Net V3. The presented work clearly finds the better method among the compared methods for better identification of COVID-19 infected images. SVM was used as a common platform for all networks. Thus better network can be judged based on the results provided by the SVM. According to the pathological studies of the lung on the autoptic tissues for COVID-19 and viral pneumonia, the widespread thrombosis with microangiopathy and vascular angiogenesis are the main discriminators for texture variations which are efficiently captured by the proposed method [22, 27].
3.Dataset used
3.1X-ray dataset
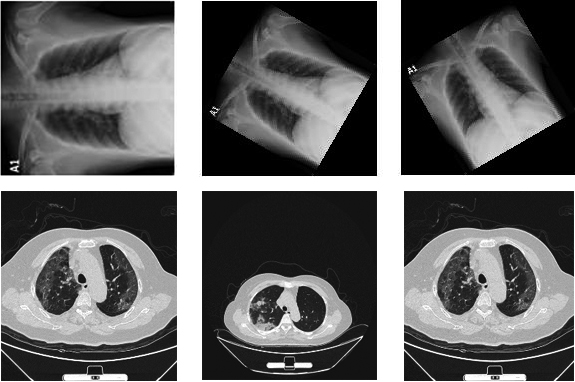
The dataset used in this paper is obtained from the COVID-19 radiography database of Kaggle [32] which consists of 219 chest X-ray images of COVID-19 positive patients, 1341 images of normal chest X-rays and 1345 images of viral pneumonia infection. In addition to this, 301 images were taken from the GitHub repository of Cohen [33]. To increase the data for training, we augmented the data using data augmentation techniques as the deep learning networks need a large amount of dataset to be trained. The data was rotated at the angles of 30
3.2CT dataset
The CT dataset is acquired from CT scans for COVID-19 classification database of Kaggle [34]. The database consists of images collected from Union Hospital (HUST-UH) and Liyuan hospital (HUST-LH). The database consists of 5705 non-informative CT (NiCT) images, 4001 positive CT (pCT) images and 9979 negative CT (nCT). Figure 6 shows the sample images of COVID-19 infection.
Figure 6.
Sample images of COVID (
The dataset was resized according to the input requirement of each network. For Mobilenet V2, Shufflenet and Resnet the images were resized to 224
4.Results
Table 1
Evaluation metric comparison of CT images
| Networks | Accuracy | F1 | F2 | MCC |
|---|---|---|---|---|
| Mobilenet V2 [45] | 0.9942 | 0.99 | 0.9890 | 0.9852 |
| Alexnet [46] | 0.9611 | 0.9391 | 0.9643 | 0.9125 |
| Darknet [47] | 0.9805 | 0.9716 | 0.9834 | 0.9606 |
| InceptionV3 [48] | 0.9761 | 0.9635 | 0.9740 | 0.9461 |
| Shufflenet [49] | 0.9817 | 0.9702 | 0.9777 | 0.9587 |
| Resnet [50] | 0.9756 | 0.9629 | 0.9707 | 0.9448 |
Table 2
Evaluation metric comparison of X-Ray images
| Networks | Accuracy | F1 | F2 | MCC |
|---|---|---|---|---|
| Mobilenet V2 | 0.9854 | 0.9770 | 0.9815 | 0.9657 |
| Alexnet | 0.9556 | 0.9298 | 0.9601 | 0.9001 |
| Darknet | 0.9705 | 0.9587 | 0.9540 | 0.9379 |
| InceptionV3 | 0.9667 | 0.9483 | 0.9683 | 0.9249 |
| Shufflenet | 0.9702 | 0.9588 | 0.9542 | 0.9380 |
| Resnet | 0.9611 | 0.9391 | 0.9643 | 0.9125 |
Figure 7.
Evaluation metrics comparison of CT images.
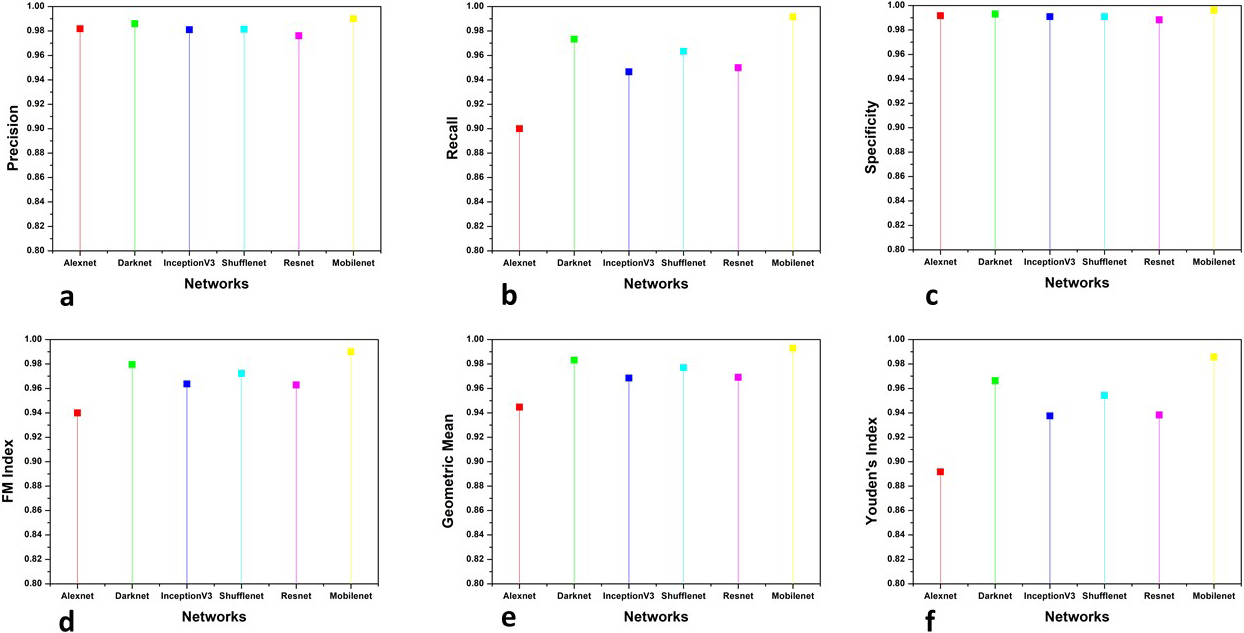
Figure 8.
Evaluation metrics comparison of X-Ray images.
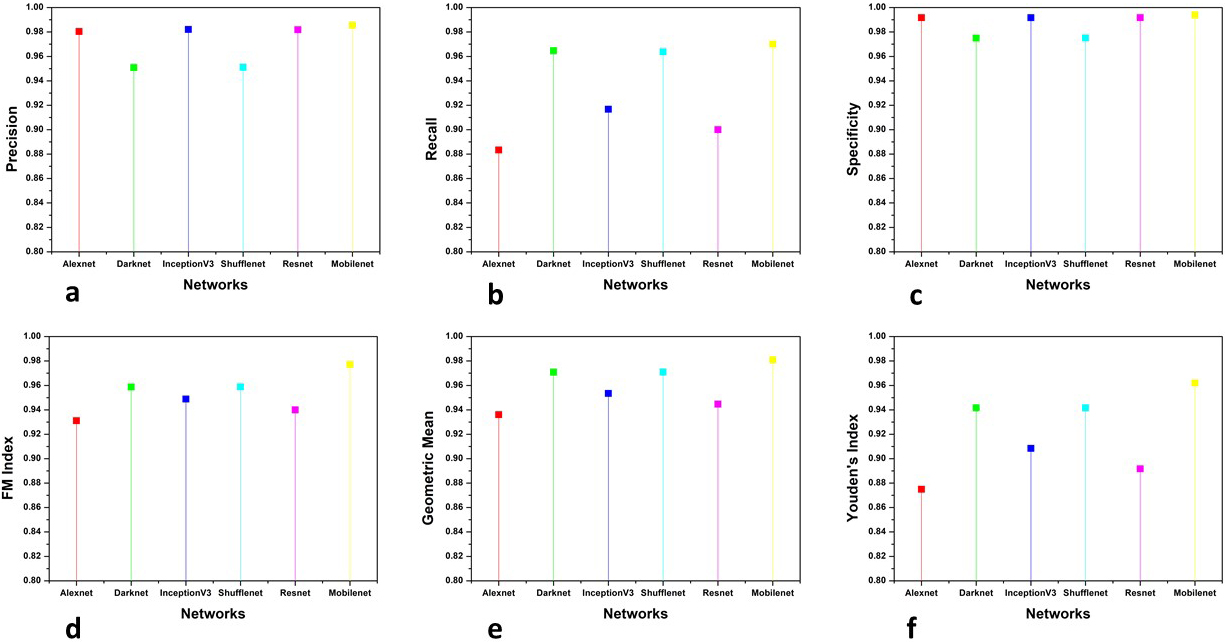
This section presents the analysis of the comparative results obtained by the proposed and other existing classifiers models. The models used for comparison are Alexnet, Resnet101, Inception V3, Darknet and ShuffleNet. The results obtained are shown in three categories 1) The comparison of accuracy, F scores and MCC, 2) The parameters whose value should be minimum for achieving good performance and, 3) other parameters for firm confirmation of results obtained. The results are categorised into the above-mentioned categories to make them more suitable for analysis. The accuracy, F scores and MCC are evaluated together because the literature review suggests that accuracy and F scores can sometimes mislead the evaluation of classification results. So MCC is used to confirm the reliability of the results as mathematically it takes all four parameters of confusion matrix in a more balanced manner. The second category is of those parameters which should attain minimum value to confirm the effectiveness of classification. Six more evaluation metrics are used for the firm affirmation of results. Tables 1 and 2 show the accuracy, F scores and MCC values obtained by the classifiers for CT and X-Ray images, respectively. Figures 7 and 8 show the results obtained by other parameters which confirm the robustness of results obtained by the proposed method for both modalities.
5.Discussion
The prime focus of this research is to detect the COVID-19 infection through computer-aided analysis. The accurate analysis and detection of COVID-19 infection are quite necessary in the current scenario as the pandemic has placed the whole world in an unprecedented situation by its life-threatening effects. The classifiers segregate the data into COVID (
5.1Quantitative analysis
Accuracy is a measure of accurate identification of the class of a pixel. The evaluation of correctly identified pixels is made using accuracy. Accuracy is computed using the following equation:
(3)
The accuracy for both modalities shows an improvement of more than 1.5%. The distribution of data is not taken into account by the accuracy so the F-score [35] is a better parameter for judging the classification efficiency. It is given by the following equation:
(4)
and
(5)
Where
(6)
MCC has shown a remarkable improvement of respectively 2.6% and 3.8% for CT and X-ray images. This signifies the better classification ability of the proposed model as the MCC has achieved the highest score along with the accuracy and F-scores.
For more analysis and a better understanding of results, we used six additional evaluation metrics for examining the obtained results. Precision, Recall, Specificity, FM index, Geometric mean and Youden’s index values are used to compare the results of classification by various methods. Precision [37] which is also known as Positive prediction value (PPV) is the ratio of positive samples which were correctly classified to the total number of samples predicted as positive. It is given by the following equation:
(7)
Recall or sensitivity is given as the ratio of positive correctly classified samples to the total number of positive samples. It is also known as true positive rate (TPR) and hit rate. The following equation represents recall:
(8)
The recall is the ability of a model to find all relevant cases within a dataset while the ability of a classification model to identify only the relevant data points is termed precision. A good margin improves the values of precision and recall in both image modalities. Specificity, which is also termed inverse recall or true negative rate (TNR) is expressed as the fraction of correctly classified negative samples to the total count of negative samples. Specificity is expressed mathematically as:
(9)
Fowlkes-Mallows Index (FM Index) [38] gives a more accurate representation of unrelated data. The higher value of FM Index gives more significant similarity between classified and ground truth data. It is given by the following equation:
(10)
The prime goal of the classification process is to improve sensitivity without sacrificing the specificity. This is quite a tough task for imbalanced datasets. Thus Geometric Mean (GM) [39] represents the aggregation of both metrics using the following equation:
(11)
The values obtained by the Specificity, FM and GM has shown considerable improvement shown in the figure. The higher values of sensitivity and specificity indicate that the true values of positive and negative classified samples are greater in the results obtained by the classifier. Thus the classifier is said to have predicted the COVID (
(12)
Where
The proposed method classified the COVID-19 infected images with good accuracy which is supported by several other evaluation metrics [41, 42, 43, 44]. This method is time efficient and accurate as compared with the several methods. Moreover, the computation cost is less as compared to other methods because of depth wise separable convolution. Lesser number of convolution multiplications tends to save the spatial resolution of the patterns in the images.
6.Conclusion
The COVID-19 pandemic has caused a large number of deaths across the globe. The early and accurate diagnosis is necessary for the treatment of this infection. The current need in the diagnosis of COVID-19 is to save the precious time of doctors and to reduce the burden on the present medical system. In conclusion, a transfer learning-based approach is presented in this work for accurate identification of COVID-19 in CT and X-ray images. This work proposes a computer-aided analysis of accurate detection of COVID-19 infected images. The features finely extracted by MobileNet V2 model paved the way for this research. The obtained results were evaluated using the well-known evaluation metrics, and to the best of our knowledge, no study till now has not compared their method using such a large number of metrics. The advantage of this comparison is that we can be quite sure about the reliability of our results. MCC was used because sometimes accuracy and F score misleads the prediction of classification as mathematically it is a perfect balance between all four parameters of the confusion matrix. Youden’s Index, which is quite a trustworthy statistical measure for the medical image analysis, shows outstanding improvement, which proves the medical effectiveness of the results obtained by the proposed model. The CT scan and X-ray facilities are common in most medical organisations. Thus the proposed method can help for initial identification of the The infections caused by viral pneumonia infections and COVID-19 are almost comparable disease. We believe that with the increase in the dataset, the effectiveness of the classification process can be further improved.
Funding
The authors did not receive funding to carry out this research.
Availability of data and materials
Not applicable.
Code availability
Not applicable.
Ethics statement
Due to the nature of the study, formal consent and ethical approval were not required.
Conflict of interest
The authors declare that they have no conflict of interest.
References
[1] | Rawle MJ, Bertfield DL, Brill SE. Atypical presentations of COVID-19 in care home residents presenting to secondary care: A UK single centre study. Aging. Med. (2020) 17; agm2.12126. doi: 10.1002/agm2.12126. |
[2] | Manolis AS, Manolis TA, Manolis AA, Papatheou D, Melita H. COVID-19 Infection: Viral Macro- and Micro-Vascular Coagulopathy and Thromboembolism/Prophylactic and Therapeutic Management. J Cardiovasc Pharmacol Ther. (2020) 14; 107424842095897. doi: 10.1177/1074248420958973. |
[3] | Loey M, Smarandache F, M. Khalifa NE. Within the Lack of Chest COVID-19 X-ray Dataset: A Novel Detection Model Based on GAN and Deep Transfer Learning. Symmetry. (2020) 20; 12: : 651. doi: 10.3390/sym12040651. |
[4] | Huang AT, Garcia-Carreras B, Hitchings MDT, Yang B, Katzelnick LC, Rattigan SM, et al. A systematic review of antibody mediated immunity to coronaviruses: Kinetics, correlates of protection, and association with severity. Nat Commun. (2020) ; 11: : 4704. doi: 10.1038/s41467-020-18450-4. |
[5] | Jamshidi M, Lalbakhsh A, Talla J, Peroutka Z, Hadjilooei F, Lalbakhsh P, et al. Artificial Intelligence and COVID-19: Deep learning approaches for diagnosis and treatment. IEEE Access. (2020) ; 8: : 109581–95. doi: 10.1109/ACCESS.2020.3001973. |
[6] | Stokes K, Castaldo R, Franzese M, Salvatore M, Fico G, Pokvic LG, et al. A machine learning model for supporting symptom-based referral and diagnosis of bronchitis and pneumonia in limited resource settings. Biocybernetics and Biomedical Engineering. (2021) ; 41: : 1288–302. doi: 10.1016/j.bbe.2021.09.002. |
[7] | Sumit Tripathi NS. Denoising of Magnetic Resonance Images Using Discriminative Learning-based Deep Convolutional Neural Network. (2021) ; Pre-press: 1–16. doi: 10.3233/THC-212882. |
[8] | Sumit Tripathi, Neeraj Sharma. Computer-aided Automatic Approach for Denoising of Magnetic Resonance Images. Computer Methods in Biomechanics and Biomedical Engineering: Imaging & Visualization. doi: 10.1080/21681163.2021.1944914. |
[9] | Tripathi S, Prakash R, Melkani N, Kumar S. Study of Bayes Theorem for Classification of Synthetic Aperture Data [Internet]. In: 2015 Second International Conference on Advances in Computing and Communication Engineering. Dehradun, India: IEEE; (2015) [cited 2021 24]. pp. 187–91. doi: http://ieeexplore.ieee.org/document/7306676/doi: 10.1109/ ICACCE.2015.54. |
[10] | Tripathi S, Sharan TS, Sharma S, Sharma N. An augmented deep learning network with noise suppression feature for efficient segmentation of magnetic resonance images. IETE Technical Review. (2021) ; 0: : 1–14. doi: 10.1080/02564602.2021.1937349. |
[11] | Tripathi S, A. Verma NS. Augmented Deep Learning Architecture to Effectively Segment the Cancerous Regions in Biomedical Images. In: 2020 IEEE International Symposium on Sustainable Energy, Signal Processing and Cyber Security (iSSSC), 2020 2020. pp. 1–6. doi: 10.1109/iSSSC50941.2020.9358876. |
[12] | Tripathi S, Sharan TS, Sharma S, Sharma N. Segmentation of Brain Tumour in MR Images Using Modified Deep Learning Network [Internet]. In: 2021 8th International Conference on Smart Computing and Communications (ICSCC). Kochi, Kerala, India: IEEE; (2021) [cited 2021 24]. pp. 1–5. doi: 10.1109/ICSCC51209.2021.9528298. |
[13] | Tripathi S, Verma A, Sharma N. Automatic segmentation of brain tumour in MR images using an enhanced deep learning approach. Computer Methods in Biomechanics and Biomedical Engineering: Imaging & Visualization. (2020) ; 10: : 1–10. doi: 10.1080/21681163.2020.1818628. |
[14] | Tripathi S, Sharma N. Computer-based segmentation of cancerous tissues in biomedical images using enhanced deep learning model. IETE Technical Review. (2021) ; 7: : 1–15. doi: 10.1080/02564602.2021.1994044. |
[15] | Pan SJ, Yang Q. A survey on transfer learning. IEEE Trans. Knowl. Data Eng. (2010) ; 22: : 1345–59. doi: 10.1109/TKDE.2009.191. |
[16] | Hussain M, Bird JJ, Faria DR. A Study on CNN Transfer Learning for Image Classification [Internet]. In: Lotfi A, Bouchachia H, Gegov A, Langensiepen C, McGinnity M, editors. Advances in Computational Intelligence Systems. Cham: Springer International Publishing; (2019) [cited 2020 3]. pp. 191–202. doi: 10.1007/978-3-319-97982-3_16. |
[17] | Tripathi S, Pandey DC. Discriminative Learning Based Dual Channel Denoising Network For Removal of Noise from MR Images [Internet]. In: 2022 10th International Conference on Emerging Trends in Engineering and Technology – Signal and Information Processing (ICETET-SIP-22). Nagpur, India: IEEE; (2022) [cited 2022 4]. pp. 1–5. doi: 10.1109/ICETET-SIP-2254415.2022.9791662. |
[18] | Sharan TS, Tripathi S, Sharma S, Sharma N. Encoder modified u-net and feature pyramid network for multi-class segmentation of cardiac magnetic resonance images. IETE Technical Review. (2021) ; 4: : 1–13. doi: 10.1080/02564602.2021.1955760. |
[19] | El Asnaoui K, Chawki Y. Using X-ray images and deep learning for automated detection of coronavirus disease. Journal of Biomolecular Structure and Dynamics. (2020) ; 22: : 1–12. doi: 10.1080/07391102.2020.1767212. |
[20] | Zreik M, van Hamersvelt RW, Wolterink JM, Leiner T, Viergever MA, Isgum I. A Recurrent CNN for Automatic Detection and Classification of Coronary Artery Plaque and Stenosis in Coronary CT Angiography. IEEE Trans. Med. Imaging (2019) ; 38: : 1588–98. doi: 10.1109/TMI.2018.2883807. |
[21] | Hagerty JR, Stanley RJ, Almubarak HA, Lama N, Kasmi R, Guo P, et al. Deep learning and handcrafted method fusion: Higher diagnostic accuracy for melanoma dermoscopy images. IEEE J. Biomed. Health Inform. (2019) ; 23: : 1385–91. doi: 10.1109/JBHI.2019.2891049. |
[22] | Li L, Qin*2 L, Xu1a Z, Yin3 Y, Wang3 X, Kong3 B, Bai3 J, Lu3 Y, Fang3 Z, Song3 Q, Cao3 K, Liu4 D, Wang5 G, Xu6 Q, Fang1a X, Zhang1a S, Xia1a J, Xia J. Artificial Intelligence Distinguishes COVID-19 from Community Acquired Pneumonia on Chest CT. doi: 10.1148/radiol.2020200905. |
[23] | Ho TK, Gwak J. Multiple feature integration for classification of thoracic disease in chest radiography. Applied Sciences. (2019) 2; 9: : 4130. doi: 10.3390/app9194130. |
[24] | Wang S, Kang B, Ma J, Zeng X, Xiao M, Guo J, et al. A deep learning algorithm using CT images to screen for Corona Virus Disease (COVID-19) [Internet]. Infectious Diseases (except HIV/AIDS); (2020) [cited 2020 22]. doi: 10.1101/2020.02.14.20023028. |
[25] | Chen J, Wu L, Zhang J, Zhang L, Gong D, Zhao Y, et al. Deep learning-based model for detecting 2019 novel coronavirus pneumonia on high-resolution computed tomography: a prospective study [Internet]. Infectious Diseases (except HIV/AIDS); (2020) [cited 2020 22]. doi: 10.1101/2020.02.25.20021568. |
[26] | Zheng C, Deng X, Fu Q, Zhou Q, Feng J, Ma H, et al. Deep Learning-based Detection for COVID-19 from Chest CT using Weak Label [Internet]. Infectious Diseases (except HIV/AIDS); (2020) [cited 2020 22]. doi: 10.1101/2020.03.12.20027185. |
[27] | Ophir Gozes, Ma’ayan Frid-Adar, Hayit Greenspan, Patrick D. Browning, Huangqi Zhang, Wenbin Ji, Adam Bernheim, and Eliot Siegel. Rapid AI Development Cycle for the Coronavirus (COVID-19) Pandemic: Initial Results for Automated Detection & Patient Monitoring using Deep Learning CT Image Analysis. doi: arXiv:2003.05037. |
[28] | Wang L, Wong A. COVID-Net: A Tailored Deep Convolutional Neural Network Design for Detection of COVID-19 Cases from Chest X-Ray Images. arXiv:2003.09871 [cs, eess] [Internet] 2020 11 [cited 2020 3]. doi: http://arxiv. org/abs/2003.09871. |
[29] | Chicco D, Jurman G. The advantages of the Matthews correlation coefficient (MCC) over F1 score and accuracy in binary classification evaluation. BMC Genomics. (2020) ; 21: : 6. doi: 10.1186/s12864-019-6413-7. |
[30] | Hoffman MM. The MCC-F1 curve: a performance evaluation technique for binary classification. 17. |
[31] | Agarap AF. Deep Learning using Rectified Linear Units (ReLU). arXiv:1803.08375 [cs, stat] [Internet] 2019 7 [cited 2020 22]. doi: http://arxiv.org/abs/1803.08375. |
[32] | Rahman T. COVID-19 Radiography Database [Internet]. (2020) . doi: https://www.kaggle.com/tawsifurrahman/covid19-radiography-database. |
[33] | COVID-19 image data collection. [Internet]. doi: https://github.com/ieee8023/covid-chestxray-dataset. |
[34] | CT scans for COVID-19 classification. [Internet]. doi: https://www.kaggle.com/azaemon/preprocessed-ct-scans-for-covid19. |
[35] | Goutte C, Gaussier E. A Probabilistic Interpretation of Precision, Recall and F-Score, with Implication for Evaluation [Internet]. In: Losada DE, Fernández-Luna JM, editors. Advances in Information Retrieval. Berlin, Heidelberg: Springer Berlin Heidelberg; (2005) [cited 2020 3]. pp. 345–59. doi: 10.1007/978-3-540-31865-1_25. |
[36] | Boughorbel S, Jarray F, El-Anbari M. Optimal classifier for imbalanced data using Matthews Correlation Coefficient metric. PLoS ONE. (2017) 2; 12: : e0177678. doi: 10.1371/journal.pone.0177678. |
[37] | Villmann T, Kaden M, Lange M, Sturmer P, Hermann W. Precision-Recall-Optimization in Learning Vector Quantization Classifiers for Improved Medical Classification Systems [Internet]. In: 2014 IEEE Symposium on Computational Intelligence and Data Mining (CIDM). Orlando, FL, USA: IEEE; (2014) [cited 2020 22]. pp. 71–7. doi: 10.1109/CIDM.2014.7008150. |
[38] | Ioan Tabus CDG aneanu. Cluster Structure Inference Based on Clustering Stability with Applications toMicroarray Data Analysis.EURASIP Journal on Applied Signal Processing. (2004) ; 1: : 64–80. |
[39] | Ralescu A, Díaz I, Rodríguez-Muñiz LJ. A classification algorithm based on geometric and statistical information. Journal of Computational and Applied Mathematics. (2015) ; 275: : 335–44. doi: 10.1016/j.cam.2014.07.012. |
[40] | Ruopp MD, Perkins NJ, Whitcomb BW, Schisterman EF. Youden index and optimal cut-point estimated from observations affected by a lower limit of detection. Biom. J. (2008) ; 50: : 419–30. doi: 10.1002/bimj.200710415. |
[41] | Jaiswal A, Gianchandani N, Singh D, Kumar V, Kaur M. Classification of the COVID-19 infected patients using DenseNet201 based deep transfer learning. Journal of Biomolecular Structure and Dynamics. (2020) 3; 1–8. doi: 10.1080/07391102.2020.1788642. |
[42] | Chen X, Sun W, Xu D, Ma J, Xiao F, Xu H. Temporal changes of quantitative CT findings from 102 patients with COVID-19 in Wuhan, China: A longitudinal study. THC. (2021) 25; 29: : 297–309. doi: 10.3233/THC-218027. |
[43] | Wang H, Sun B, Li X, Wang Y, Yang Z. Clinical analysis of severe COVID-19 patients. THC. (2022) 25; 30: : 225–34. doi: 10.3233/THC-228021. |
[44] | Liu M, Lv W, Yin B, Ge Y, Wei W. The human-AI scoring system: A new method for CT-based assessment of COVID-19 severity. THC. (2021) 29; 30: : 1–10. doi: 10.3233/THC-213199. |
[45] | Howard AG, Zhu M, Chen B, Kalenichenko D, Wang W, Weyand T, et al. MobileNets: Efficient Convolutional Neural Networks for Mobile Vision Applications. arXiv:1704.04861 [cs] [Internet] 2017 16 [cited 2020 22]. doi: http://arxiv.org/abs/1704.04861. |
[46] | Krizhevsky A, Sutskever I, Hinton GE. ImageNet classification with deep convolutional neural networks. Commun. ACM. (2017) 24; 60: : 84–90. doi: 10.1145/3065386. |
[47] | Omar ZM, Ibrahim J. An Overview of Darknet, Rise and Challenges and Its Assumptions. (2020) ; 88. |
[48] | Szegedy C, Vanhoucke V, Ioffe S, Shlens J, Wojna Z. Rethinking the Inception Architecture for Computer Vision [Internet]. 2015 11 [cited 2022 4]. doi: http://arxiv.org/abs/1512.00567. |
[49] | Zhang X, Zhou X, Lin M, Sun J. ShuffleNet: An Extremely Efficient Convolutional Neural Network for Mobile Devices [Internet]. 2017 7 [cited 2022 4]. doi: http://arxiv.org/abs/1707.01083. |
[50] | He K, Zhang X, Ren S, Sun J. Deep Residual Learning for Image Recognition. arXiv:1512.03385 [cs] [Internet] 2015 10 [cited 2019 23]. doi: http://arxiv.org/abs/1512.03385. |


