
Classification of epileptic seizure using feature selection based on fuzzy membership from EEG signal
Abstract
BACKGROUND:
Feature selection is a technology that improves the performance result by eliminating overlapping or unrelated features.
OBJECTIVE:
To improve the performance result, this study proposes a new feature selection that uses the distance between the centers.
METHODS:
This study uses the distance between the centers of gravity (DBCG) of the bounded sum of the weighted fuzzy memberships (BSWFMs) supported by a neural network with weighted fuzzy membership (NEWFM).
RESULTS:
Using distance-based feature selection, 22 minimum features with a high performance result are selected, with the shortest DBCG of BSWFMs removed individually from the initial 24 features. The NEWFM used 22 minimum features as inputs to obtain a sensitivity, accuracy, and specificity of 99.3%, 99.5%, and 99.7%, respectively.
CONCLUSIONS:
In this study, only the mean DBCG is used to select the features; in the future, however, it will be necessary to incorporate statistical methods such as the standard deviation, maximum, and normal distribution.
1.Introduction
Epilepsy, affecting 0.6%–1.0% of the total population, is a condition in which a portion of the nerve cells that make up the human brain are damaged and seizures repeatedly occur owing to excessive electrical discharge from the cerebral cortex [1, 2]. Partial epilepsy is called epilepsy when excessive seizures occur only in one part of the brain, and generalized epilepsy occurs throughout the brain [3]. A condition is diagnosed as epilepsy when seizures in the brain occur recursively for a long period without any special cause [4].
Nonlinear techniques such as correlation dimensions and the Lyapunov exponents have been used to extract the complexity from EEG signal [5, 6, 7]. EEG signal was decomposed into timefrequency domains by a discreet wavelet transforms (DWTs) [8, 9]. In addition, the coefficients produced by the wavelet transformation (WT) are used as inputs for the adaptive neuro-fuzzy inference system (ANFIS) [10]. Some models of epileptic seizure classification have been developed that combine wavelet coefficients with an artificial neural network [11] and a support vector machine [12]. Subasi extracted features based on the wavelet coefficients and for the extracted features used a classification model called a mixture of experts [13]. In addition, Polat classified epileptic seizures using Fourier transforms and a principal component analysis [14]. Convolutional neural networks have also been used for detecting epileptic seizures based on functional near-infrared spectroscopy signal [15], a recurrence quantification analysis [16], and a multi-channel time-series [17]. In addition, deep neural networks have been used to detect epileptic seizures with higher order statistics [18] and different feature scaling techniques [19]. However, as disadvantages of these two models, the initial features are used without a feature selection and cannot provide interpretable general rules, such as fuzzy rules for epileptic seizure classification.
Feature selection has become an important subject in machine learning and pattern recognition [20, 21, 22]. A good feature selection allows benefits such as reduced computational costs or an improved performance result by eliminating unnecessary or noisy features. The rapid increase in data used for learning has also recently led to problems in the learning process [23, 24]. As one of the major problems, large amounts of data are less relevant to each other, which often leads to a misclassification and increases in classification errors as a result of learning using poor data [25, 26].
This study proposes a new distance-based feature selection using an existing neural network with weighted fuzzy membership (NEWFM) [27, 28] to improve the performance result of both normal and epileptic seizure EEG signal. An NEWFM has the bounded sum of weighted fuzzy memberships (BSWFMs) that can indicate the differences in the graphical characteristics between normal and epileptic seizure EEG signal. This study is largely composed of two parts, the first part of which processes the EEG signal, and the second part classifies normal and epileptic seizure EEG signal by selecting the minimum features. In the signal processing section, the WT produces a wavelet coefficient that eliminates noise from the EEG signal. A statistical technique has been used to extract features from wavelet coefficients to be used as inputs.
Feature selection uses the DBCG of the BSWFMs generated by the learning process of the NEWFM to obtain the minimum features that represent the best performance result.
The remainders of this study are organized as follows. Section 2 describes the experimental data, wavelet transformation, and statistical techniques. It also describes the NEWFM. Section 3 then details the NEWFM-based feature selection techniques proposed in this study. Section 4 describes the performance result obtained using feature selection and compares the performance result before and after feature selection. Finally, Section 5 provides some concluding remarks regarding this study.
2.Overview of the epileptic seizure classification model
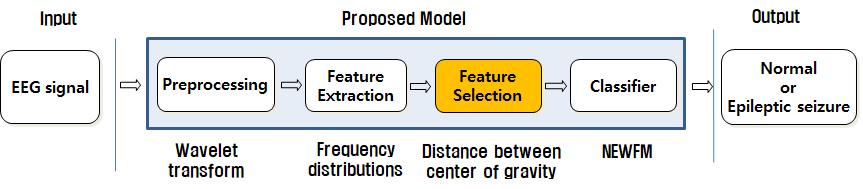
As can be seen from the epileptic seizure classification model shown in Fig. 1, the frequency distribution and frequency variation are features extracted from the wavelet coefficients generated from an EEG signal. From the extracted features, the minimum features representing the best performance result were selected using a distance-based feature selection technique.
Figure 1.
Normal and epileptic seizure classification model.
2.1Experimental data
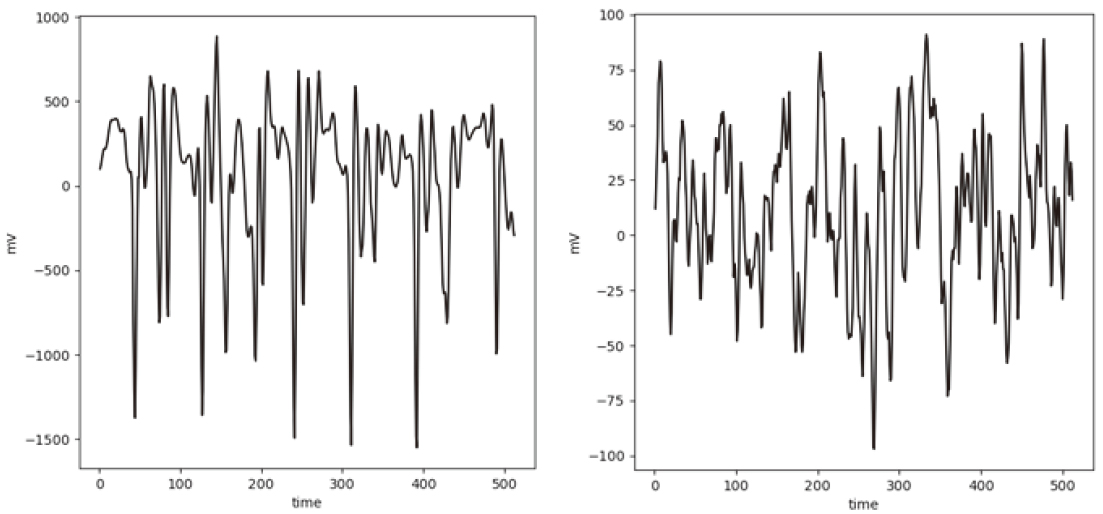
In this study, the EEG signal tested by Andrzejak [29] was applied to classify both normal and epileptic seizure EEG signal. The experimental data are divided into five groups of experiments (A, B, C, D, and E) [29]. All experimental groups included 100 single channels EEG signal sections. This study used two groups of experiments A and E applied by Subasi [13]. Experiment A is made up of normal EEG signal from a healthy subject, and Experiment E is made up of epileptic seizure EEG signal from a subject with epilepsy symptoms. The experimental datasets used in this study are listed in Table 1. Each episode in the experimental group consisted of 512 points. Figure 2 shows example normal and epileptic seizure EEG signal.
Table 1
Number of training and test set
| Class | Training set | Test set | Total set |
|---|---|---|---|
| Normal EEG signal | 300 | 500 | 800 |
| Epileptic seizure EEG signal | 300 | 500 | 800 |
| Total | 600 | 1000 | 1600 |
Figure 2.
Examples of epileptic seizure (left) and normal (right) EEG signal.
2.2Wavelet transforms (WTs) and feature extraction
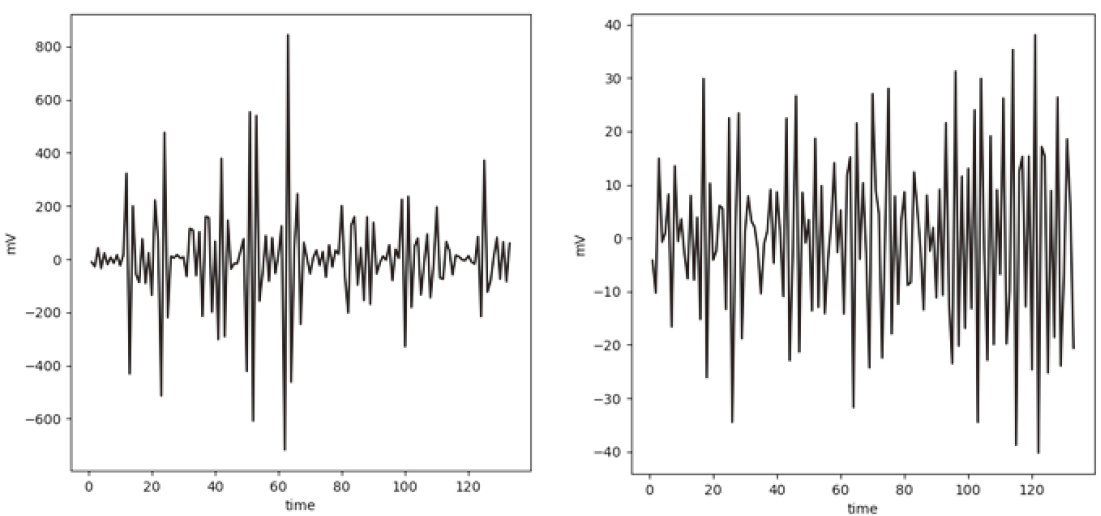
WTs are transformation technologies that represent the time and frequency components of a signal, and frequency components vary over time [8, 10, 11]. Typically, Fourier transforms represent frequency components assuming that the signal does not change over time. In contrast, WT is a technique applied to signal processing regions to represent frequency and time components of signals whose frequency components change over time. Using experimental data tested by Andrzejak and Subasi, in this study, Daubechies 4 wavelet transforms (WTs), at a 5-point scale, as described in Fig. 3, were applied to extract the wavelet coefficients, the detail coefficient (g[n]), and the approximation coefficient (a[n]) [4]. Figure 4 shows episodes of wavelet transformed normal and epileptic seizure EEG signal.
Table 2
Description of features
| No | Description of features |
|---|---|
| 1 | Mean of absolute g[n] and a[n] in Fig. 3 |
| 2 | Average power of g[n] and a[n] in Fig. 3 |
| 3 | Standard deviation of g[n] and a[n] in Fig. 3 |
| 4 | Ratio of absolute mean of g[n] and a[n] of adjacent scale-levels in Fig. 3 |
| 5 | Median g[n] and a[n] in Fig. 3 |
Figure 3.
Decomposition of wavelet transform.
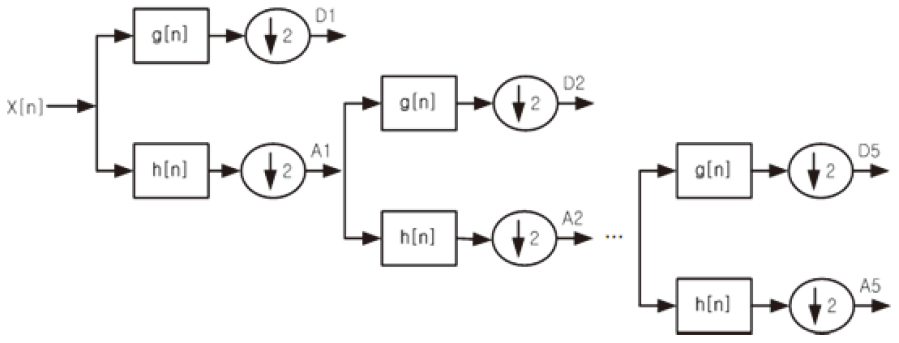
Figure 4.
Examples of wavelet transformed epileptic seizure (left) and normal (right) EEG signal.
The wavelet coefficients were extracted from the initial 24 features to be used as input by the statistical techniques in Table 2 [30]. The initial 24 features are listed in Table 3. (1), (2), and (5) in Table 2 indicate the EEG signal frequency distribution [13]. In addition, (3) and (4) in Table 2 refer to frequency variations for the EEG signal [13].
2.3Neural networks with weighted fuzzy membership (NEWFM)
An NEWFM is a type of fuzzy neural networks that use the BSWFMs [27, 28]. The NEWFM is composed of three layers: class, hyperbox, and input in Fig. 5. An
Figure 5.
Structure of NEWFM.
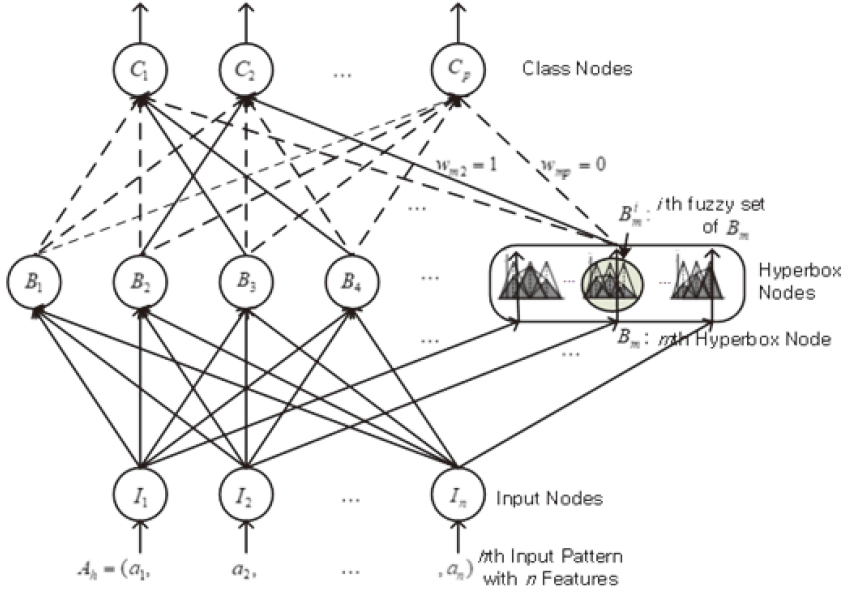
Figure 6.
Example of before and after an adjust (
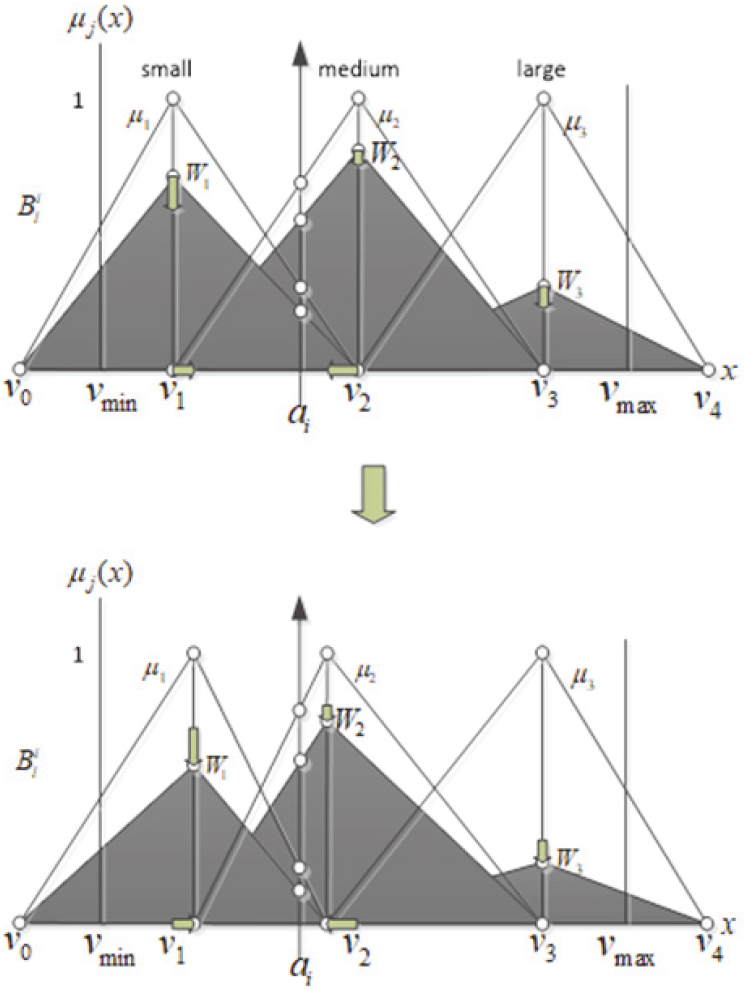
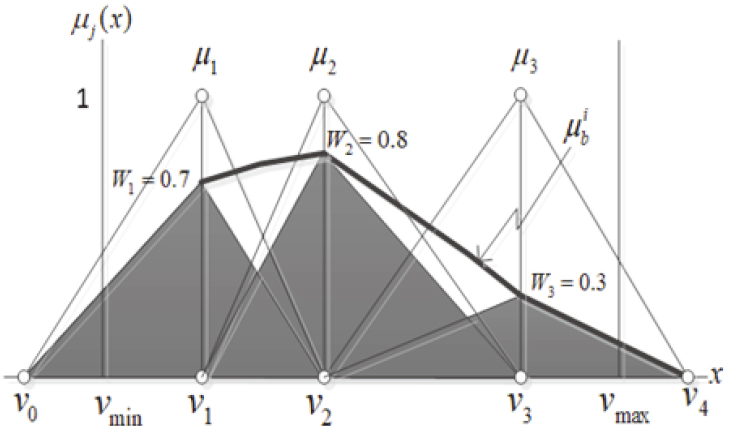
Figure 7.
Example of three BSWFMs.
An adjust (
(1)
Both BSWFMs can graphically show the difference between normal and epileptic seizure EEG signal for each feature. In Fig. 8, the fuzzy values of fuzzy membership functions
Table 3
Detailed descriptions of features based on wavelet coefficients
| Wavelet coefficients | No. in Table 2 | Mean | Min | Max | Standard deviation | Selected |
|---|---|---|---|---|---|---|
| ac(5) | 1 | 20.11 | 19.78 | 20.44 | 0.11 | Yes |
| ac(5) | 5 | 13.41 | 12.98 | 13.53 | 0.10 | Yes |
| ac(5) | 2 | 11.17 | 10.39 | 12.56 | 0.52 | Yes |
| dc(2) | 2 | 8.81 | 8.51 | 8.94 | 0.10 | Yes |
| dc(4) | 4 | 8.29 | 7.75 | 8.67 | 0.26 | Yes |
| dc(3) | 4 | 8.28 | 7.58 | 9.46 | 0.52 | Yes |
| dc(4) | 1 | 7.68 | 7.46 | 7.80 | 0.09 | Yes |
| dc(5) | 4 | 7.58 | 7.31 | 7.86 | 0.18 | Yes |
| dc(5) | 2 | 6.87 | 6.44 | 7.93 | 0.53 | Yes |
| dc(2) | 1 | 6.80 | 6.55 | 7.27 | 0.17 | Yes |
| dc(5) | 1 | 6.40 | 5.99 | 6.77 | 0.27 | Yes |
| dc(3) | 1 | 6.31 | 6.26 | 6.38 | 0.03 | Yes |
| dc(2) | 3 | 6.26 | 6.12 | 6.37 | 0.09 | Yes |
| dc(4) | 3 | 4.72 | 4.54 | 5.00 | 0.09 | Yes |
| dc(3) | 3 | 4.67 | 4.50 | 4.81 | 0.06 | Yes |
| dc(2) | 5 | 4.57 | 3.32 | 6.15 | 0.90 | Yes |
| dc(5) | 3 | 4.52 | 3.90 | 5.36 | 0.32 | Yes |
| dc(4) | 5 | 4.23 | 2.61 | 6.70 | 1.27 | Yes |
| ac(5) | 3 | 4.02 | 3.88 | 4.11 | 0.07 | Yes |
| dc(4) | 2 | 1.87 | 1.81 | 1.97 | 0.05 | Yes |
| dc(3) | 5 | 0.66 | 0.56 | 0.82 | 0.08 | Yes |
| dc(3) | 2 | 0.57 | 0.56 | 0.57 | 0.00 | Yes |
| dc(5) | 5 | 0.49 | 0.23 | 0.80 | 0.25 | No |
| dc(2) | 2 | 0.24 | 0.23 | 0.24 | 0.00 | No |
The numbers in parentheses mean the level of wavelet coefficients. As examples, dc(2) denotes the detailed coefficients, and ac(2) denotes the approximation coefficients, at level 2.
Figure 8.
BSWFMs-based on inference system.
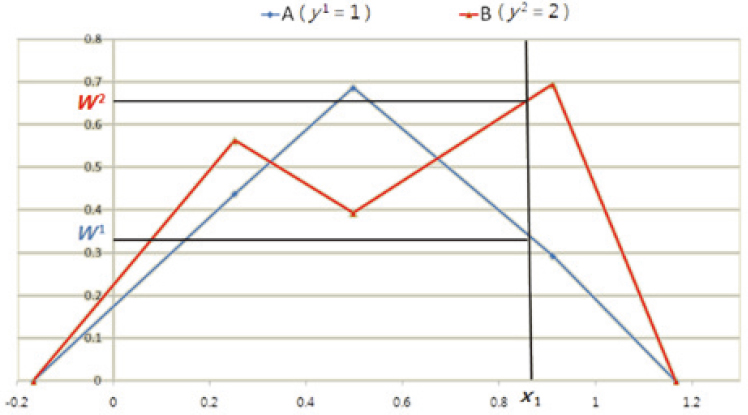
Table 4
Performance results without feature selection
| Class | Results | |
|---|---|---|
| Epileptic seizure EEG signal (300) | TP | FN |
| 288 | 12 | |
| Normal EEG signal (300) | FP | TN |
| 0 | 300 | |
2.4Feature selection based on distance
To overcome misclassification and classification errors as a result of learning using poor data, and to improve the performance result, NEWFM uses the DBCG of the BSWFMs to select features that eliminate less relevant data from a large amount of data. This study was carried out using an NEWFM from the initial 24 features. Using the DBCG of the BSWFMs generated through this learning, the feature selection was carried out in four steps.
Step 1 The values of
Step 2 Using the normalized BSWFM, the centers of gravity for the BSWFM of the normal and epileptic seizure EEG signal are derived.
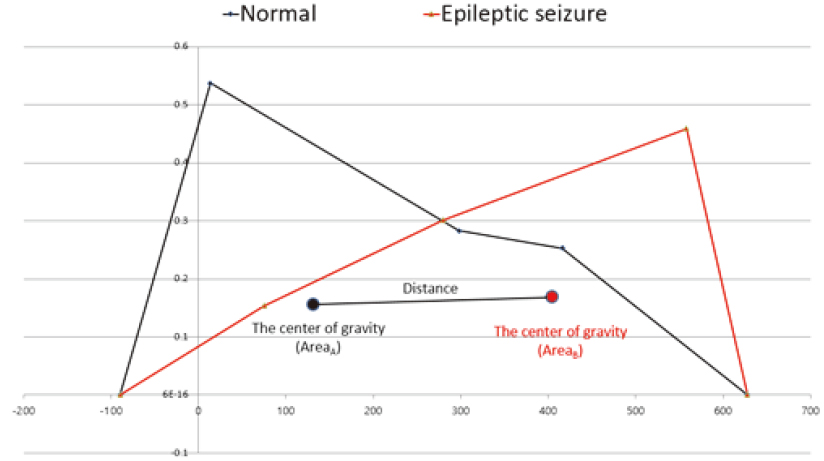
Step 3 The DBCG of the BSWFMs is derived in Fig. 9, and the DBCGs for the BSWFMs for 24 features are as shown in Table 3.
Step 4 The performance result is compared by individually removing features with the lowest mean DBCG of the BSWFMs.
In Step 4, the performance result is obtained by removing the features with the lowest mean individually based on the results of Table 3. As the results indicate, the performance result was the highest when 22 among the initial 24 features were removed with coefficients dc(2) and dc(5) remaining.
Table 5
Performance results with feature selection
| Class | Results | |
| Epileptic seizure EEG signal (300) | TP | FN |
| 298 | 2 | |
| Normal EEG signal (300) | FP | TN |
| 1 | 299 | |
Table 6
Comparison of performance results
| Sensitivity | Specificity | Accuracy | |
|---|---|---|---|
| Subasi [13] | 95% | 94% | 94.5% |
| Without feature selection [30] | 95% | 100% | 97.5% |
| With feature selection | 99.3% | 99.7% | 99.5% |
Figure 9.
DBCG of BSWFMs.
3.Experimental results
The sensitivity, accuracy, and specificity, defined in (2), were used to evaluate the performance result in this study. Here, a true positive (TP) denotes that an epileptic seizure EEG signal is classified properly as an epileptic seizure EEG signal, a false negative (FN) denotes that it is classified as a normal EEG signal, a false positive (FP) denotes that it is falsely classified as an epileptic seizure EEG signal, and a true negative (TN) denotes that it is classified as a normal EEG signal. In this study, the performance result obtained from the 22 minimum features selected through the feature selection based on the DBCG of the BSWFMs, and the performance result obtained from the 24 initial features, are compared in Tables 4–6. Although 0.3% were lower in specificity, 3.3% and 1.5% were higher in sensitivity and accuracy, respectively.
(2)
4.Concluding remarks
In this study, using feature selection based on the DBCG of the BSWFMs through this learning of the NEWFM, the least important features were removed individually. Eliminating each of these least important features individually while selecting the minimum features for epileptic seizure classification was proposed to obtain the best performance result. Using this feature selection, 22 minimum features obtained from 24 initial features were used as input to the NEWFM to achieve the best performance result. Feature selection based on the DBCG of the BSWFMs minimizes the number of features and enables the highest performance result by eliminating those features that are unnecessary or adversely affect the classification results. NEWFM has an advantage that it takes long time (more than 1 week) to learn data for learning process, however, it takes very short time (less than 1 second) to make a result for classification process.
The sensitivity, accuracy, and specificity when using feature selection based on the DBCG of the BSWFMs were 99.3%, 99.5%, and 99.7%, respectively, which are 3.3% and 1.5% higher and 0.3% lower than those obtained without using feature selection (at 96%, 98%, and 100%), respectively.
In this study, only the mean DBCG was used to select the features; in the future, however, it will be necessary to incorporate statistical methods such as the standard deviation, maximum, and normal distribution using the maximum based on the results listed in Table 3.
Acknowledgments
This work was supported by the National Research Foundation of Korea (NRF) grant funded by the Korean government (MSIT) (No. NRF-2019R1F1A1055423).
Conflict of interest
None to report.
References
[1] | Admi H, Shaham B. Living with epilepsy: ordinary people coping with extraordinary situations. Qualitative Health Research. (2007) ; 17: (9): 1178-87. |
[2] | Lorenzo F, Carmen B, Federico M, Francesca P, Renzo G, Claudia M. Automatic detection and sonification of nonmotor generalized onset epileptic seizures: Preliminary results. Brain Research. (2019) ; 1721: : 146341. |
[3] | Alain GT, Martin T, Bertrand CT, Timoleon CK. Generalized synchronization of regulate seizures dynamics in partial epilepsy with fractional-order derivatives. Chaos, Solitons & Fractals. (2020) ; 132: : 109553. |
[4] | Michael SP, Jingxiao J, Ronnie ST, Atul M. Pharmacoresistance with newer anti-epileptic drugs in mesial temporal lobe epilepsy with hippocampal sclerosis. Epilepsy Research. (2017) ; 137: : 56-60. |
[5] | Shayegha F, Sadria S, Amirfattahia R, Ansari-Aslb K. A model-based method for computation of correlation dimension, Lyapunov exponents and synchronization from depth-EEG signals. Computer Methods and Programs in Biomedicine. (2014) ; 113: (1): 323-37. |
[6] | Zhang Q, Hu Y, Potter T, Li R, Quach M, Zhang Y. Establishing functional brain networks using a nonlinear partial directed coherence method to predict epileptic seizures. Journal of Neuroscience Methods. (2020) ; 329: : 108447. |
[7] | Ghosh D, Dutta S, Chakraborty S. Multifractal detrended cross-correlation analysis for epileptic patient in seizure and seizure free status. Chaos, Solitons & Fractals. (2014) ; 67: : 1-10. |
[8] | Sharma M, Bhurane AA, Acharya UR. MMSFL-OWFB: A novel class of orthogonal wavelet filters for epileptic seizure detection. Knowledge-Based Systems. (2018) ; 160: : 265-77. |
[9] | Raghu S, Sriraam N, Temel Y, Rao SV, Hegde AS, Kubben PL. Performance evaluation of DWT based sigmoid entropy in time and frequency domains for automated detection of epileptic seizures using SVM classifier. Computers in Biology and Medicine. (2019) ; 110: : 127-43. |
[10] | Güler İ, Übeyli ED. Adaptive neuro-fuzzy inference system for classification of EEG signals using wavelet coefficients. Journal of Neuroscience Methods. (2005) ; 148: (2): 113-21. |
[11] | Kocadagli O, Langari R. Classification of EEG signals for epileptic seizures using hybrid artificial neural networks based wavelet transforms and fuzzy relations. Expert Systems with Applications. (2017) ; 88: : 419-34. |
[12] | Kumar Y, Dewal ML, Anand RS. Epileptic seizure detection using DWT based fuzzy approximate entropy and support vector machine. Neurocomputing. (2014) ; 133: : 271-9. |
[13] | Subasi A. EEG signal classification using wavelet feature extraction and a mixture of expert model. Expert Systems with Applications. (2007) ; 32: : 1084-93. |
[14] | Polat K, Güneş S. Artificial immune recognition system with fuzzy resource allocation mechanism classifier, principal component analysis and FFT method based new hybrid automated identification system for classification of EEG signals. Expert Systems with Applications. (2008) ; 34: : 2039-48. |
[15] | Rosas-Romero R, Guevara E, Peng K, Nguyen DK, Lesage F, Pouliot P, Lima-Saad WE. Prediction of epileptic seizures with convolutional neural networks and functional near-infrared spectroscopy signals. Computers in Biology and Medicine. (2019) ; 111: : 103355. |
[16] | Gao X, Yan X, Gao P, Gao X, Zhang S. Automatic detection of epileptic seizure based on approximate entropy, recurrence quantification analysis and convolutional neural networks. Artificial Intelligence in Medicine. (2020) ; 102: : 101711. |
[17] | Wei Z, Zou J, Zhang J, Xu J. Automatic epileptic EEG detection using convolutional neural network with improvements in time-domain. Biomedical Signal Processing and Control. (2019) ; 53: : 101551. |
[18] | Sharma R, Pachori RB, Sircar P. Seizures classification based on higher order statistics and deep neural network. Biomedical Signal Processing and Control. (2020) ; 59: : 101921. |
[19] | Thara DK, PremaSudha BG, Xiong F. Auto-detection of epileptic seizure events using deep neural network with different feature scaling techniques. Pattern Recognition Letters. (2019) ; 128: : 544-50. |
[20] | Sharmin S, Shoyaib M, Ali AA, Khan MAH, Chae O. Simultaneous feature selection and discretization based on mutual information. Pattern Recognition. (2019) ; 91: : 162-74. |
[21] | Zeng Z, Wang X, Yan F, Chen Y. Local adaptive learning for semi-supervised feature selection with group sparsity. Knowledge-Based Systems. (2019) ; 181: : 104787. |
[22] | Wang H, Tan L, Niu B. Feature selection for classification of microarray gene expression cancers using Bacterial Colony Optimization with multi-dimensional population. Swarm and Evolutionary Computation. (2019) ; 48: : 172-81. |
[23] | Bolón-Canedo V, Alonso-Betanzos A. Ensembles for feature selection: A review and future trends. Information Fusion. (2019) ; 52: : 1-12. |
[24] | Barddal JP, Enembreck F, Gomes HM, Bifet A, Pfahringer B. Boosting decision stumps for dynamic feature selection on data streams. Information Systems. (2019) ; 83: : 13-29. |
[25] | Tang X, Dai Y, Xiang Y. Feature selection based on feature interactions with application to text categorization. Expert Systems with Applications. (2019) ; 120: : 207-16. |
[26] | Yin Q, Zhang J, Wu S, Li H. Multi-view clustering via joint feature selection and partially constrained cluster label learning. Pattern Recognition. (2019) ; 93: : 380-91. |
[27] | Lee S-H. Feature selection based on the center of gravity of BSWFMs using NEWFM. Engineering Applications of Artificial Intelligence. (2015) ; 45: : 482-7. |
[28] | Lee S-H. Development of ventricular fibrillation diagnosis method based on neuro-fuzzy systems for automated external defibrillators. International Journal of Fuzzy Systems. (2017) ; 19: : 440-51. |
[29] | Andrzejak RG, Lehnertz K, Mormann F, Rieke C, David P, Elger CE. Indications of nonlinear deterministic and finite dimensional structures in time series of brain electrical activity: Dependence on recording region and brain state. Physical Review E. (2001) ; 64: : 061907. |
[30] | Jang S-W, Lee S-H. Detection of epileptic seizures using wavelet transform, peak extraction and psr from eeg signals. Symmetry. (2020) ; 12: (8): 1239. |
[31] | Lim JS. Finding features for real-time premature ventricular contraction detection using a fuzzy neural network system. IEEE Transactions on Neural Networks. (2009) ; 20: (3): 522-7. |


