
Quantitative metabolic characteristics in the peritumoral region of gliomas at 7T
Abstract
BACKGROUND:
The determination of tumor peripheral is of great significance in clinical diagnosis and treatment.
OBJECTIVE:
In this study, we aim to obtain the metabolic condition in tumor peripheral of gliomas in vivo at 7T.
METHODS:
C6 glioma cells were implanted into the right basal ganglia of Sprague-Dawley (SD) rats under stereotactic guided to create the glioma models. The models were sequentially undergone MRI and MRS examination on an 7T MR scanner designed for animals 7 days after the operation. Neuro metabolites were investigated from the center of the tumor, solid part of the tumor, peritumoral region, and contralateral white matter, and be quantified using the LCmodel software. Glial fibrillary acidic protein (GFAP) immunohistochemistry and conventional hematoxylin and eosin (HE) staining were performed after the imaging protocol.
RESULTS:
Our results found that the inositol (Ins) and taurine (Tau) significantly defected in tumor peripheral compared to both tumor solid and normal tissues (
CONCLUSIONS:
This study revealed that Ins, Tau, and Glx have the potential to provide specific biomarkers for the location of tumor peripheral of glioma.
1.Introduction
Glioma is the most common primary brain tumor, which also leads to the greatest number of average years of life lost to cancer compared with other tumors [1]. There is a tropesis in the malignant brain glioma to infiltrate the surrounding white matter several distances from the tumor core [2]. The grade, classification, invasion, and prognosis of surgical treatment and radiation therapy are closely associated with the biochemical characteristics of different areas of glioma [3]. Histopathology is regarded as the “gold standard” diagnostic investigation in clinical practice [4]. However, such analysis demands surgical procedures with a potential danger k of morbidity and mortality. Detailed morphological information can be provided by conventional MRI, and this technique is the basis for the initial, non-invasive evaluation of glioma patients [5]. Conventional MRI, however, lacks adequate precision and can often provide confusing or misleading characteristics.
In this study, we used MRI and single-voxel
2.Methods
2.1Animals
Female SD rats were purchased from the Laboratory Animal Center of the Medical College of Shantou University (Shantou, China). They were housed in standard raising condition and provided ad libitum access to water and food. All experimental protocols were authorized by the Ethics Committee of Shantou University Medical College and all experiments were conducted in accordance with guidelines from the Chinese Animal Welfare Agency. Every effort has been made to alleviate animal cruelty and to reduce the amount of animals used.
2.2Experimental design
Seventeen female SD rats, weighing 230–250 g, were randomized into two groups. All rats were habited for 7 days prior to the experiment. Prior to operation, each rat underwent 8 h of solid-food fasting and 4 h of liquid fasting. Rats of the glioma group (
2.3Tumor cell lines
The C6 glioma cell strain obtained from American Type Culture Collection (CLL107, Rockville, MD) were incubated in DMEM/F12 (1:1) (Gibco, USA), provided with 10% fetal bovine serum and penicillin/streptomycin, in a 5% CO
2.4Surgical technique
Rats were anesthetized by intra-abdominal injection of 10% chloral hydrate solution at a dose of 1.65 ml/250 g body weight. After their cranial regions had been shaved and sterilized with a betadine solution, rats were ensconced on a sterile field in a prone position. The operation was performed using a stereotaxic apparatus (RWD Life Science, China). A midline incision approximately 1.5 cm in length was introduced in the skin over the skull and, using the micro-drill of the dentist (Osada, Japan), a small burhole was made at the coordinates 3 mm to the right of the sagittal suture and 1.0 mm to the front of the lambdoid suture. A 22-gauge, 10-
2.5MRI and MRS acquisition
(1) Rats were anesthetized using 10% chloral hydrate solution and subsequently, less than 1.5–2 percent of isoflurane was maintained in oxygenated air delivered through a mask. Anesthetized rats were ensconced in a prone position with the head fixed on a palate holder fitted with an adjustable nose cone. Using a water-heated animal blanket, the body temperature was tracked and maintained at 36–37
2.6MRS data analysis
The LCmodel as defined by Provencher was used to analyze in vivo proton spectrum [7]. This software can calculates the best fit to the experimental spectrum as a linear combination of model spectra. Raw FID data were applied as standard data input. With no further T1 and T2 correction, the water-suppressed time-domain data between 0.2 and 4.0 ppm was analyzed. The basis set includes 17 individual metabolites. For absolute quantification of the metabolic concentrations, signal intensities were processed using water scaling. The sums of various metabolites (NAA+NAAG, Glu+Gln(Glx), GPC+PCh and Cr+PCr) are also estimated in addition to individual metabolites. The reliability of metabolite quantification was estimated by the standard deviations of the fits, which were expressed as the percent standard deviation (%SD) of the estimated concentration by Cramer-Rao lower bounds (CRLB) in LCmodel. Our criterion for reliability of the spectral fit was
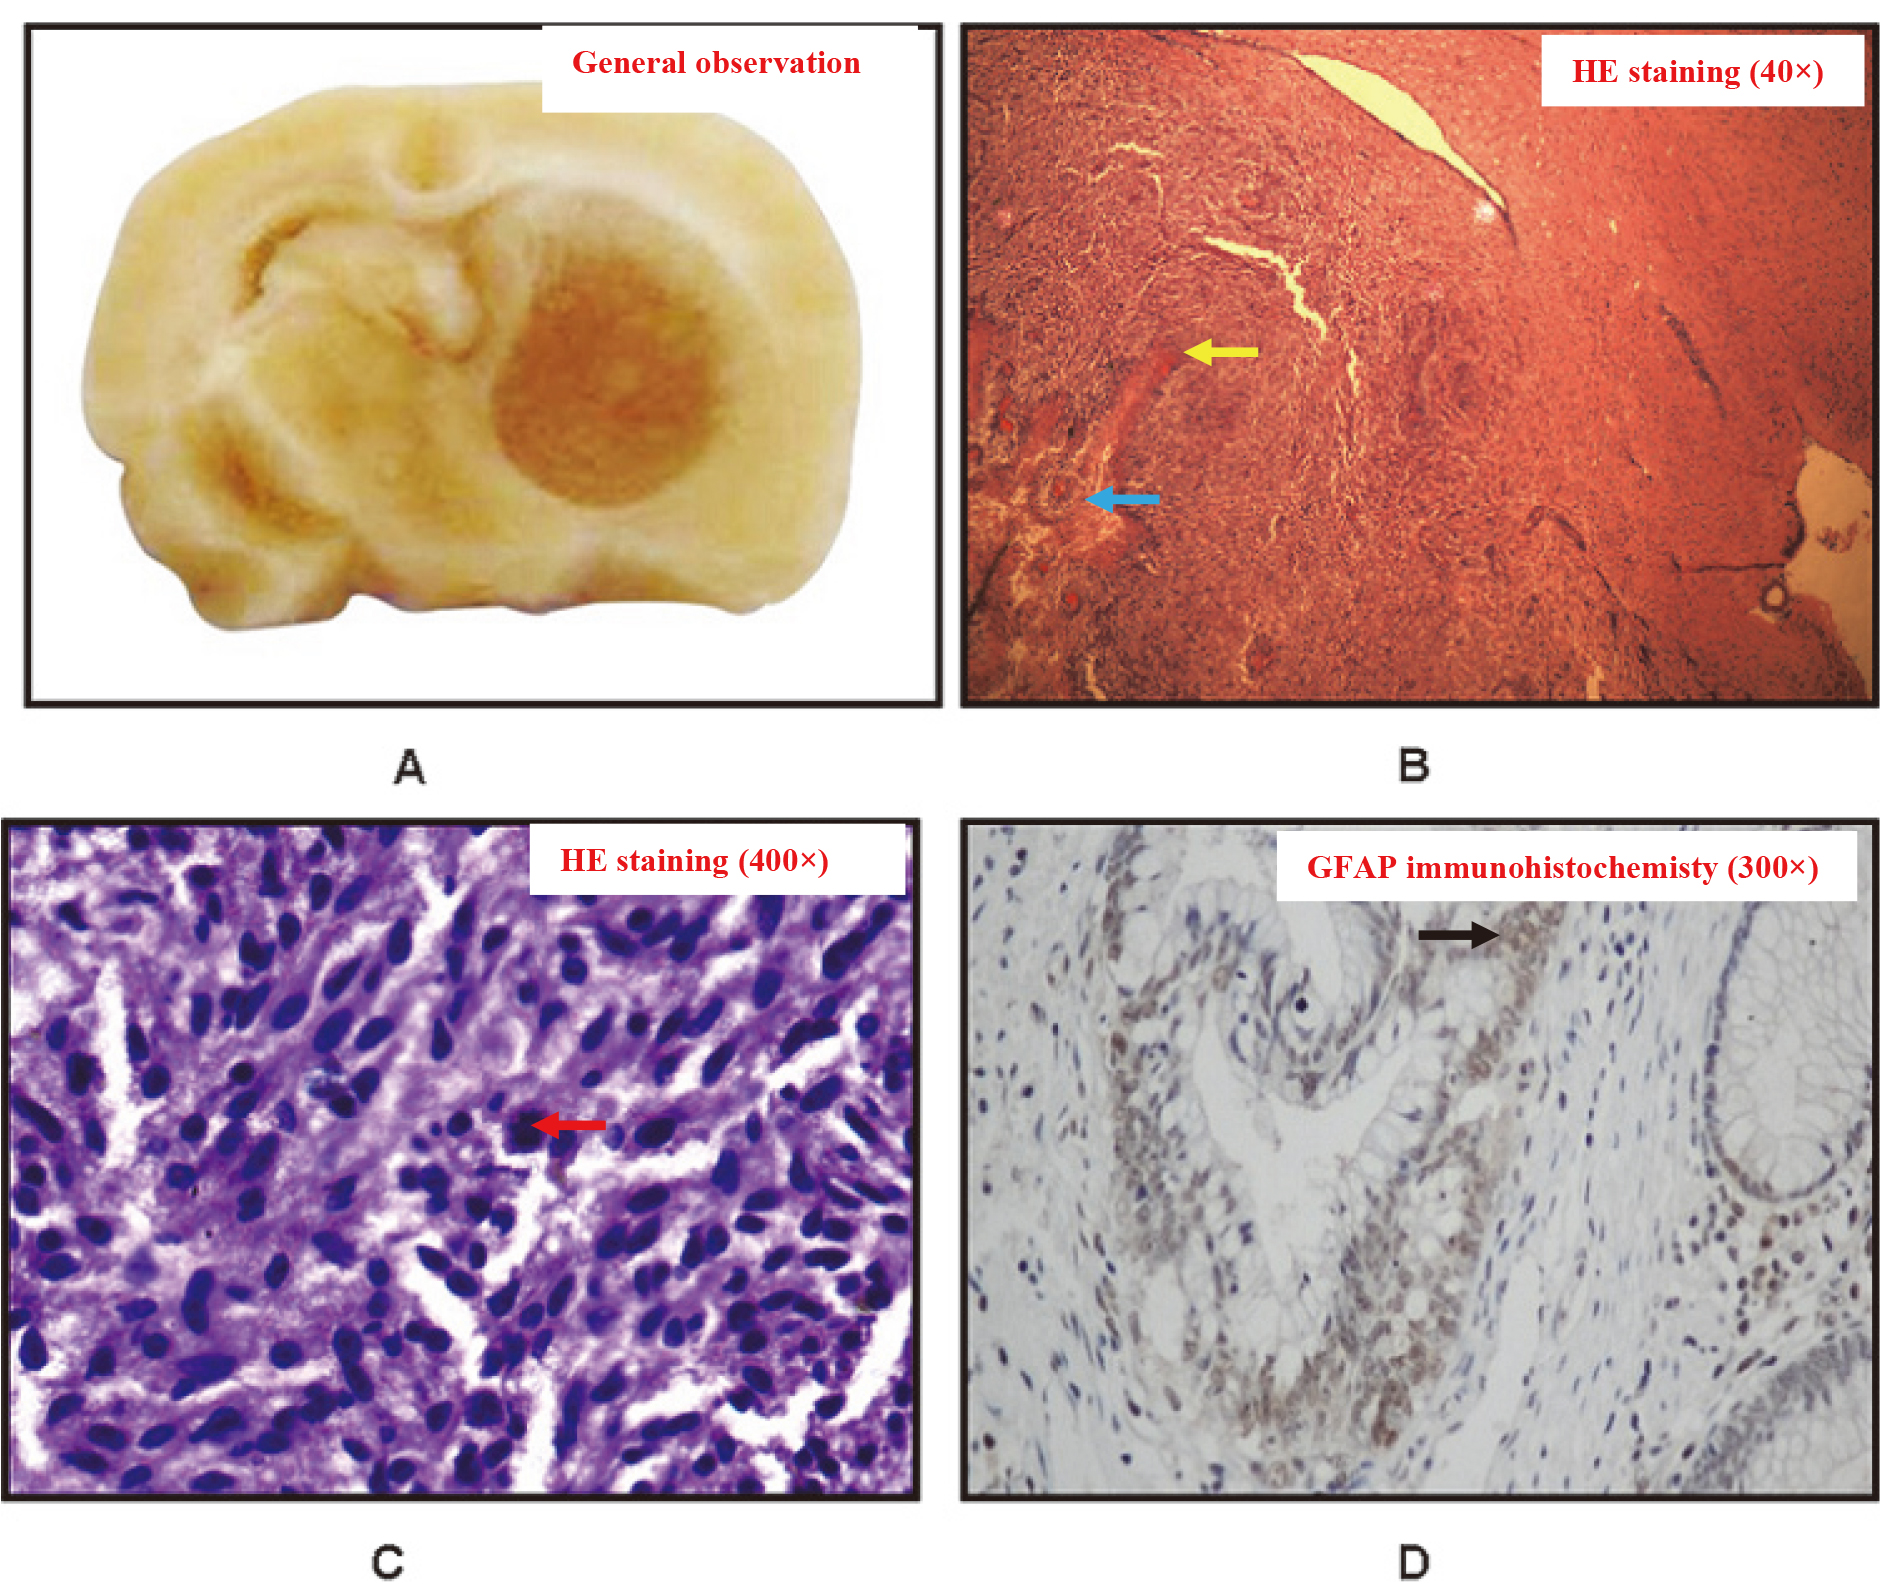
Figure 1.
A, pathology sections of the glioma group with a semitransparent tumor in the right basal ganglia region. B, HE staining of the glioma with a central necrosis, peritumoral edema, and tissue invasion at 40
2.7Histopathological analysis
Rats were euthanized for histopathological examination upon termination of the MRI and MRS scans. Each rat thorax was opened quickly and the right atrium was incised, following anesthesia by intraperitoneal injection with a 10% chloral hydrate solution. In the rats’ circulation, a cannula inserted into the left ventricle was injected into standard saline and supplemented by 4 percent paraformaldehyde. The entire brain tissue was removed and put into 10% methanol when the perfuse flowing from the right atrium was clear. The tumor tissue was fixed with 10% formaldehyde, and the paraffin was embedded routinely. The sections were stained with HE. The number, density and necrosis of tumor cells were observed under light microscope. Paraffin block was embedded routinely, and sections were stained with SP immunohistochemical method. The concentration of primary antibody (1:100), DAB staining, hematoxylinre staining and sealing were observed under light microscope. The results showed that brown yellow or brown particles in the nucleus or (and) cytoplasm were positive.
2.8Statistical analysis
One-way ANOVA followed by the Student-Newman-Keuls posttest was applied to test for differences in neuronal metabolite concentrations among the different areas. All procedures were carried out using SPSS version 17 for Windows (SPSS Inc., Chicago, IL, USA). The difference between the two groups was considered statistically significant at
3.Results
After glioma cell injection, rats in the glioma group exhibited abnormal behavior compared to the controls. Initially, glioma-group rats manifested depression, decreased aggression, and decreased activity. Later, these rats demonstrated obvious weight loss, and exhibited symptoms of hemiplegia, hemorrhage around the orbits, epilepsy, and dyspraxia. The median survival for the glioma group was 15 days. None of the rats in the control group died through the study.
No evidence of cross-sectional tumors was shown in the histopathological review of the control group. Histopathological examination of the glioma group implanted with C6 glioma cells revealed that all developed brain tumors (Fig. 1A). The tumors showed highly cellular, well-defined lesions of invasion into the white matter with compression of the surrounding structures (Fig. 1B). A mild degree of angiogenesis (yellow arrow) was also demonstrated by these lesions. Necrosis (blue arrow) was also evident in the tumor center. At high imaging power, polymorphic malformed nuclei (red arrow) could be seen with clearly karyo mitosis, and polykaryocyte were observed within the tumors (Fig. 1C). The glia marker GFAP ((black arrow)) confirmed that these tumors were gliomas (Fig. 1D).
In MR images, the C6 gliomas of rats in the experimental group were mildly hypointense in T1-weighted images and hyperintense in T2-weighted images (Fig. 2A and B). There were obvious mixed signals in the tumor center that corresponded to the tumor necrosis that was apparent in the subsequent pathological examination. A T1-weighted image obtained after contrast agent injection showed obvious signal enhancement within the tumor (Fig. 2C). By light microscopy, the HE sections showed that the gliomas were surrounded by infiltrated and edematous tissues (Fig. 1C). However, in T2-weighted images the peritumoral edema was less obvious, and differences in signal intensity in structural MR images were not significant between the peritumoral area and contralateral white matter.
Table 1
Metabolite concentrations (umol/g,means
| ROI | No | NAA | Cho | tCR | Lac | Ins | Tau | Ala | Gln | Glu | Glx |
|---|---|---|---|---|---|---|---|---|---|---|---|
| TC | 10 | 0.57 | 0.58 | 1.35 | 7.14 | 3.42 | 3.78 | 1.47 | 1.23 | 1.93 | 2.29 |
| TSP | 10 | 2.12 | 1.18 | 3.00 | 3.23 | 0.73 | 3.66 | 1.26 | 1.57 | 6.54 | 4.18 |
| PNT | 10 | 5.37 | 1.02 | 4.06 | 4.09 | 1.45 | 1.88 | 0.77 | 4.94 | 3.323 | 8.38 |
| CW | 10 | 5.53 | 0.83 | 5.00 | 0.20 | 3.06 | 5.24 | 1.08 | 2.51 | 5.02 | 6.46 |
ROIs, regions of interest; No, number of observations; TC, tumor center; TSP, solid part of tumor; PNT, apparently normal peritumoral tissue; CW, contralateral white-matter.
Table 2
Statistical significance (
| ROI | ROI | NAA | Cho | tCR | Lac | Ins | Tau | Ala | Gln | Glu | Glx |
|---|---|---|---|---|---|---|---|---|---|---|---|
| CW | TC | 0.000* | 0.134 | 0.000* | 0.008* | 0.993 | 0.415 | 0.197 | 0.710 | 0.001* | 0.000* |
| PNT | 0.996 | 0.995 | 0.053 | 0.393 | 0.018* | 0.009 | 0.139 | 0.004* | 0.150 | 0.012* | |
| TSP | CW | 0.000* | 0.000* | 0.000* | 0.000* | 0.523 | 0.306 | 0.016 | 0.210 | 0.009* | 0.003* |
| PNT | 0.000* | 0.998 | 0.012* | 0.998 | 0.000* | 0.016* | 0.694 | 0.016* | 0.812 | 0.000* | |
| TC | TSP | 0.000* | 0.001* | 0.000* | 0.106 | 0.987 | 1.000 | 0.977 | 0.007* | 0.419 | 0.002* |
| PNT | 0.000* | 0.819 | 0.000* | 0.734 | 0.036* | 0.019* | 0.721 | 0.243 | 0.005* | 0.000* |
ROIs, regions of interest; TC, tumor center; TSP, solid part of tumor; PNT, apparently normal peritumoral tissue; CW, contralateral white-matter; *,
Figure 2.
A, axial T1-weighted images of the glioma group. B, axial T2-weighted images of the glioma group. C, axial T1-weighted image after contrast administration of the glioma group. D, the regions of interest in the brain of MRS was outlined by different colour squares.
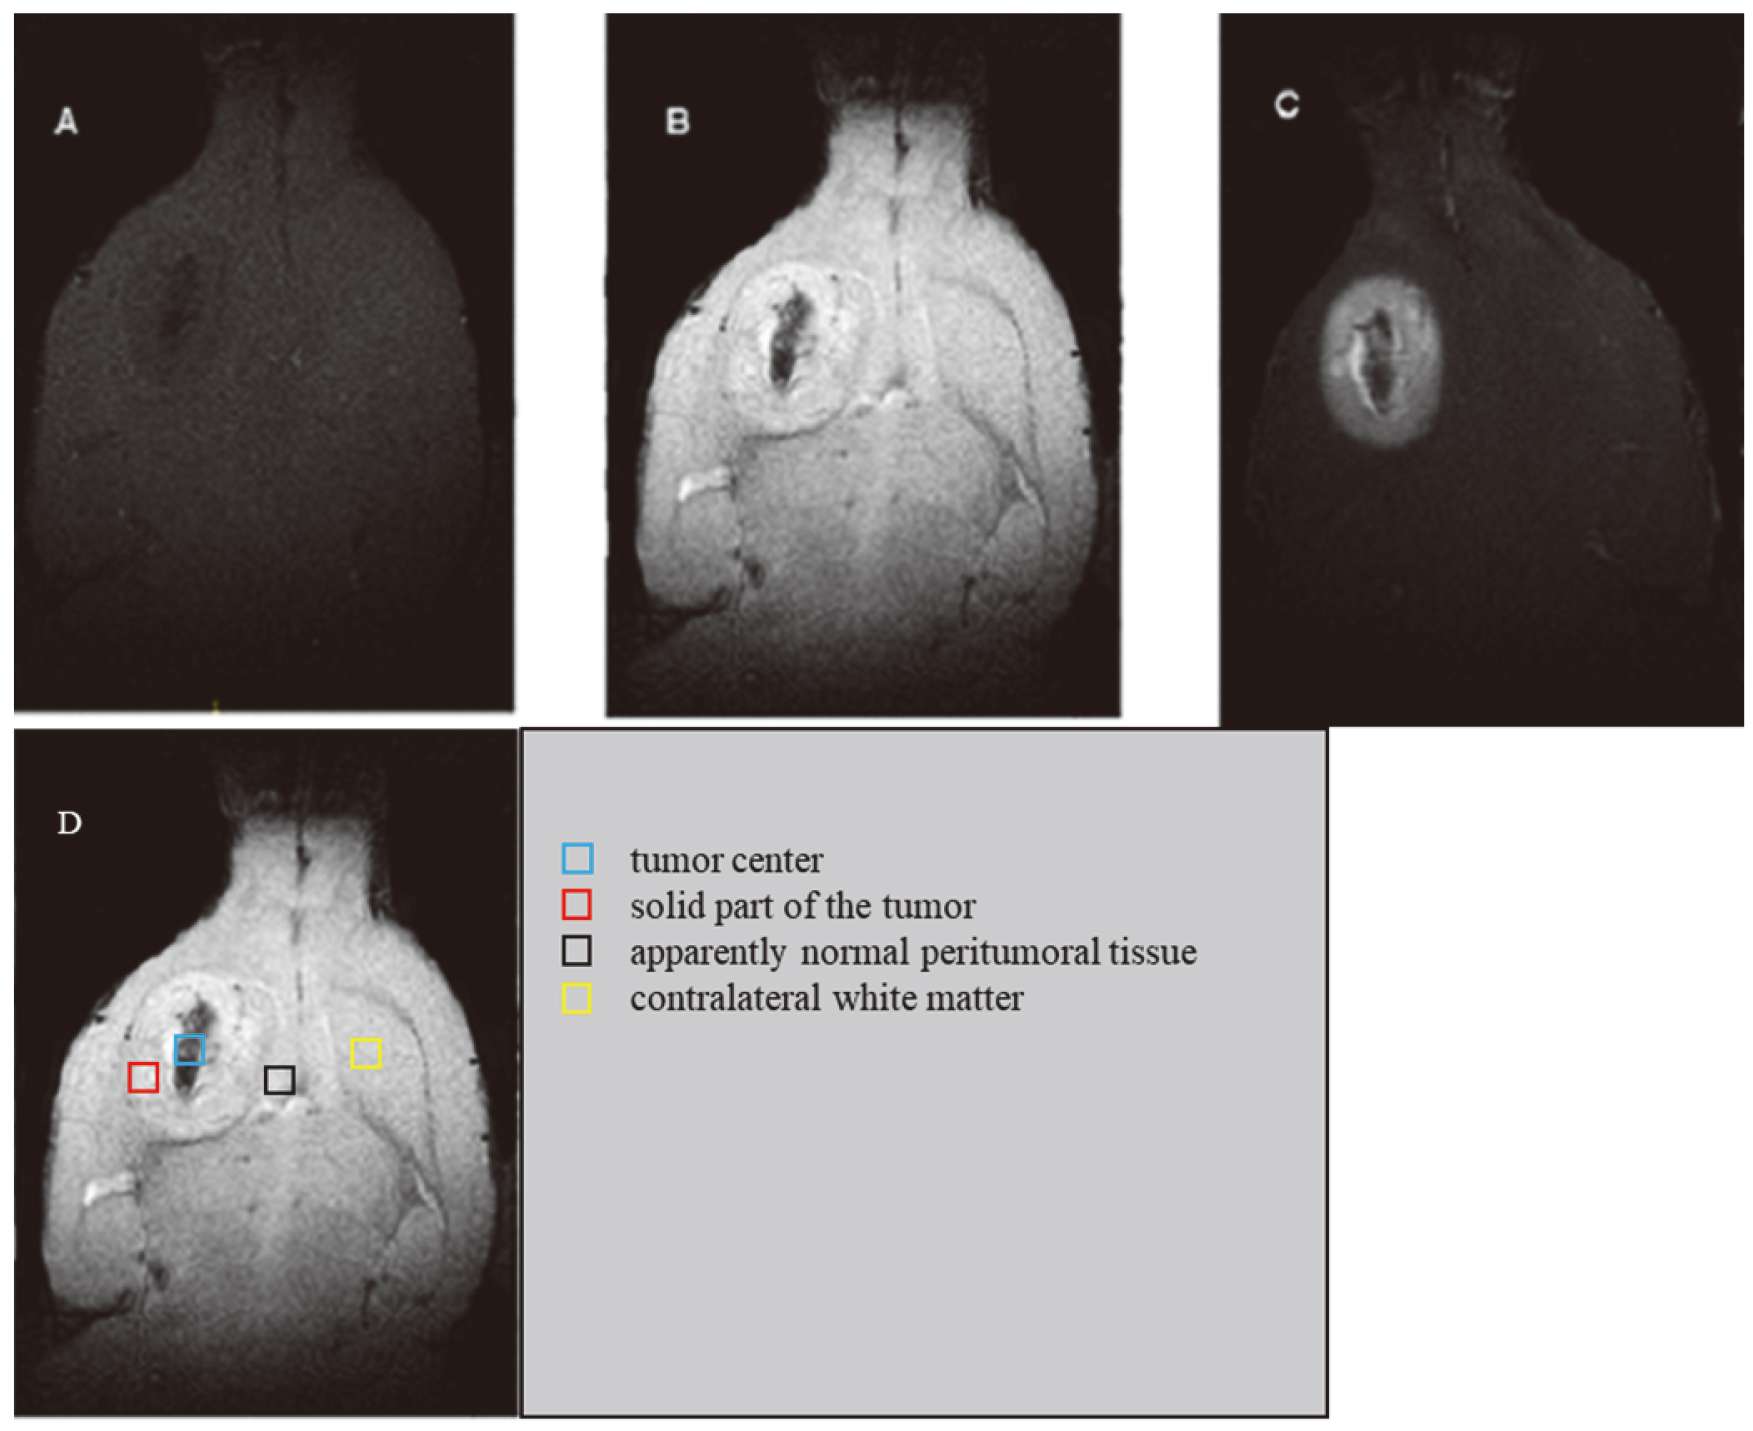
Figure 3.
Proton MR spectra (A–D) from selected ROIs in the glioma group: A, tumor center; B, solid part of tumor; C, apparently normal peritumoral tissue; D, contralateral white matter.
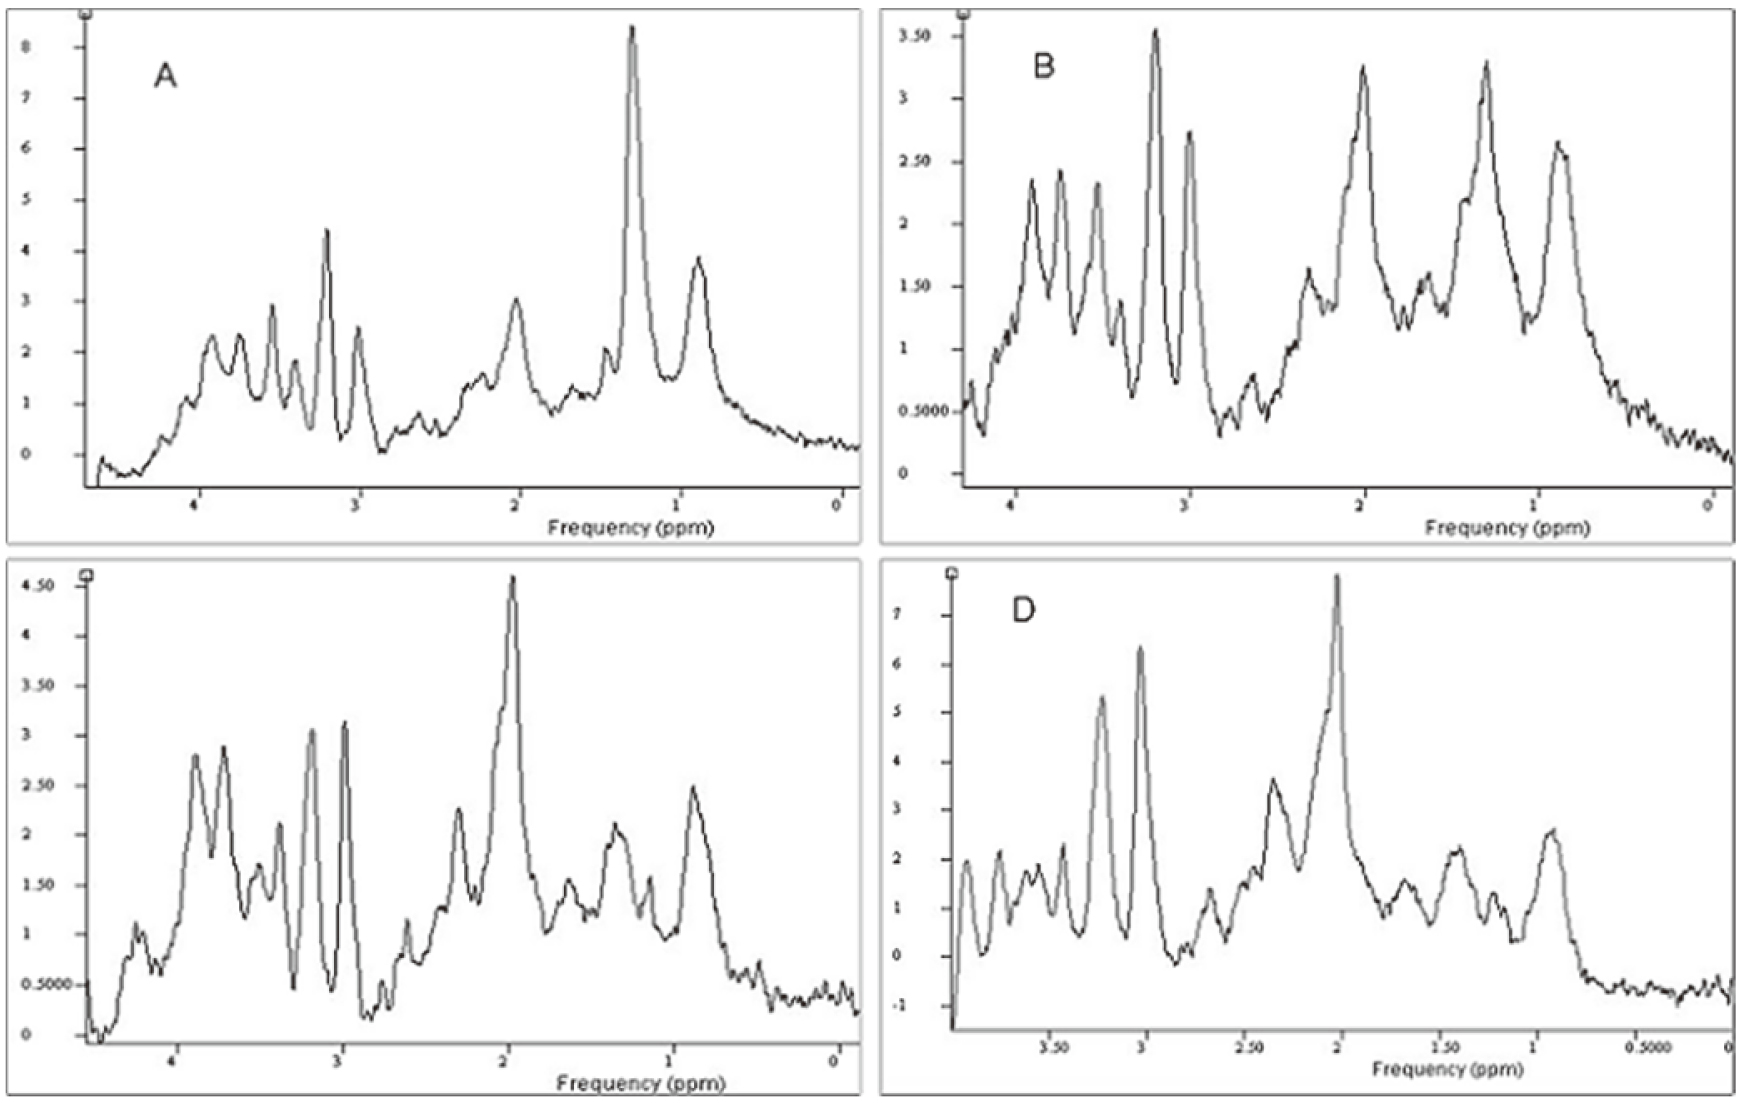
Representative proton MR spectroscopy spectra in four different areas are shown in Fig. 3. Tables 1 and 2 show the statistical analysis of six main metabolite concentrations quantified by LCModel in different areas of the glioma. Gradual elevations in the levels of NAA and tCr were observed from the tumor center to the contralateral white matter. There were significant differences in NAA concentration between the tumor center and other areas of glioma (solid tumor, apparently normal peritumoral tissue, and contralateral white matter,
4.Discussion
Determination of the peritumoral region in glioma has drawn more and more attention in recent years [8, 9, 10]. On routine MR imaging, the peritumoral area (so-called uncertain zone) often appears morphologically normal [11, 12]. In this study we use 7.0T, make further investigation that the important Tau, Ins, and Glx can likely supply specific information about the potential location of the glioma border.
Tau is synthesized only in glial cells [13], which may explain its detection in gliomas. It protects against tissue damage in a variety of in vivo and in vitro models [14, 15]. Ins typically increases in glial tumors compared to normal brain tissue, and is usually greater in low-grade astrocytomas than in high-grade gliomas or metastases [16]. We found significant differences in Tau and Ins between the apparently normal peritumoral tissue and other three areas, with the lowest level of Tau and Ins occurring in the tumor periphery. Important variations in Ins and Tau between the peripheral region of the tumor and the three other areas were found. Tau and Ins possess higher water solubility than any other metabolites acquired in this study, and they are thus more easily affected by water. If peritumoral edema is prominent, although it is not obvious on conventional MRI, the increase in interstitial water may “dilute” the Tau signal and Ins peak on MRS. We preliminarily presume that Tau and Ins are potential
Currently, there is increased attention in the origin of the peaks at 2.35 ppm and 3.76 ppm that correspond to Gln and Glu or pooled as ‘Glx’ (Glx
5.Conclusions
This study demonstrates that Ins, Tau, and Glx have the potential to provide specific biomarkers for the location of tumor peripheral of glioma. 7T
Acknowledgments
This work was supported by the Science and Technology Program of Fujian Province of China (No. 2017D017), The Joint Funds for the Health and Education of Fujian Province, China (No. 2019-WJ-31), and the Institute of Respiratory Diseases, Xiamen Medical College (No. HXJB-6 and 15); the Funds for International Cooperation and Exchange of the National Natural Science Foundation of China (No. 82020108016); the National Natural Science Foundation of China (No. 31870981); the Grant for Key Disciplinary Project of Clinical Medicine under the Guangdong High-level University Development Program (No. 002-18120302); the Natural Science Foundation of Guangdong Province (No. 2018A030307057).
Conflict of interest
The authors declare that there is no conflict of interest regarding the publication of this paper.
References
[1] | Burnet NG, Jefferies SJ, Benson RJ, et al., Years of life lost (YLL) from cancer is an important measure of population burden–and should be considered when allocating research funds. Br J Cancer. (2005) ; 92: (2): 241-5. |
[2] | Wang W, Steward CE, Desmond PM. Diffusion tensor imaging in glioblastoma multiforme and brain metastases: the role of p, q, L, and fractional anisotropy. AJNR Am J Neuroradiol. (2009) ; 30: (1): 203-8. |
[3] | Simões RV, Ortega-Martorell S, Delgado-Goñi T. Improving the classification of brain tumors in mice with perturbation enhanced (PE)-MRSI. Integrative Biology. (2012) ; 4: : 183-191. |
[4] | Shang HB, Zhao WG, Zhang WF. Preoperative assessment using multimodal functional magnetic resonance imaging techniques in patients with brain gliomas. Turk Neurosurg. (2012) ; 22: (5): 558-65. |
[5] | Shen G, Xu L, Xu M, et al., 1H-MR spectroscopy guided gamma knife radiosurgery for treatment of glioma. Turk Neurosurg. (2012) ; 22: (6): 690-4. |
[6] | Zou QG, Xu HB, Liu F, et al., In the assessment of supratentorial glioma grade: the combined role of multivoxel proton MR spectroscopy and diffusion tensor imaging. Clin Radiol. (2011) ; 66: (10): 953-60. |
[7] | Cuellar-Baena S, Morais LMTS, Cendes F, et al., Manual and semi-automatic quantification of in vivo1H-MRS data for the classification of human primary brain tumors. Brazilian Journal of Medical and Biological Research. (2011) ; 44: (4): 345-353. |
[8] | Sijens PE, Oudkerk M. 1H chemical shift imaging characterization of human brain tumor and edema. Eur Radiol. (2002) ; 12: : 2056-2061. |
[9] | Di Costanzo A, Scarabino T, Trojsi F, et al. Multiparametric 3T MR approach to the assessment of cerebral gliomas: tumor extent and malignancy. Neuroradiology. (2006) ; 48: : 622-631. |
[10] | McKnight TR, von dem Bussche MH, Vigneron DB, et al. Histopathological validation of a three-dimensional magnetic resonance spectroscopy index as a predictor of tumor presence. J Neurosurg. (2002) ; 97: : 794-802. |
[11] | Majos C, Alonso J, Aguilera C, et al: Proton magnetic resonance spectroscopy 1H MRS of human brain tumours: assessment of differences between tumour types and its applicability in brain tumour categorization. Eur Radiol. (2003) ; 13: : 582-591. |
[12] | Meyerand ME, Pipas JM, Mamourian A, et al: Classification of biopsy confirmed brain tumors using single-voxel MR spectroscopy. Am J Neuroradiol. (1999) ; 20: : 117-123. |
[13] | Assadian S, Aliaga A, Del Maestro RF, et al. FDG-PET imaging for the evaluation of antiglioma agents in a rat model. Neuro-Oncol. (2008) ; 10: : 292-299. |
[14] | Cantin AM. Taurine modulation of hypochlorous acid-induced lung epithelial cell injury in vitro. J Clin Invest. (1994) ; 93: : 606-614. |
[15] | Chao CC, Hu S, Sheng WS, Bu D, Bukrinsky MI, Peterson PK. Cytokine-stimulated astrocytes damage human neurons via a nitric oxide mechanism. Glia. (1996) ; 16: : 276-284. |
[16] | Castillo M, Smith JK, Kwock L. Correlation of myo-inositol levels and grading of cerebral astrocytomas. AJNR Am J Neuroradiol. (2000) ; 21: (9): 1645-9. |
[17] | Davies NP. et al. Non-invasive detection of glycine as a biomarker of malignancy in childhood brain tumours using in-vivo1H MRS at 1.5 tesla confirmed by ex-vivo high-resolution magic-angle spinning NMR. NMR Biomed. (2010) ; 23: : 80-7. |
[18] | Danbolt NC. Glutamate uptake. Prog Neurobiol. (2001) ; 65: : 1-105. |
[19] | Martinez-Hernandez A, Bell KP, Norenberg MD. Glutamine synthetase: glial localization in brain. Science. (1977) ; 195: : 1356-1358. |
[20] | Ye ZC, Rothstein JD, Sontheimer H. Compromised glutamate transport in human glioma cells: reduction-mislocalization of sodium-dependent glutamate transporters and enhanced activity of cystine-glutamate exchange. Neurosci. (1999) ; 19: : 10767-10777. |
[21] | Sykova E. Extrasynaptic volume transmission and diffusion parameters of the extracellular space. Neuroscience. (2004) ; 129: : 861-876. |


