
An auricular division method based on ASM algorithm
Abstract
BACKGROUND:
Auricular acupuncture point (AAP) therapy is an important part of traditional Chinese medicine and is featured with a sophisticated location method based on the division of auricular subzones.
OBJECTIVE:
This study aimed to realize the automatic computerized division on the relatively small area of the research object which has long been considered difficult.
METHOD:
We propose a novel method based on the active shape model algorithm and the “Name and location of AAPs” issued by the World Federation of Acupuncture-Moxibustion Societies (WFAS STANDARD-002:2013).
RESULTS:
The experimental results showed that the subzones of the auricle could be divided for the location of AAPs using the proposed method automatically and efficiently. The average Hausdorff distance and Euclid distance of landmarks between the machine and the manual positioning were 6.28
CONCLUSIONS:
The proposed method might provide benefits for further development of therapeutic and educational applications of AAPs.
1.Introduction
Auricular acupuncture point (AAP) therapy is an important part of traditional Chinese medicine (TCM). Stimulating AAPs can dredge meridians and activate qi and blood [1, 2]. Therefore, auricular divisions can be regarded as the basis of treatment. However, the automatic computerized division has long been considered difficult due to the relatively small area of the research object. It is still in the stage of manual drawing in the traditional teaching of AAPs [3].
According to the “Name and location of AAPs” issued by the World Federation of Acupuncture-Moxibustion Societies (WFAS STANDARD-002:2013) [4], 63 auricular subzones of the anterolateral auricle have been located. Most AAPs are directly located in the auricular subzones [5]. Therefore, auricular division is one of the most basic content and of great significance to AAP location. A quick and accurate auxiliary method needs to be developed, which can provide benefits for further development of therapeutic and educational applications of AAPs.
Target localization based on image recognition and detection has been widely researched with the development of machine vision and image processing technology. Studies on ear images mostly focused on ear recognition, segmentation and detection [6, 7, 8]. For example, Li et al. [9] used the improved gradient vector flow snake (GVF snake) algorithm to realize the automatic detection and segmentation of external auricular contour. Li et al. [10] introduced a normalization method and verified its influence on feature extraction and ear image recognition. Gao and Mu [11] used the active shape model (ASM) algorithm to realize ear contour detection. To sum up, these studies focused mainly on external auricular profile detection, human ear normalization, and feature extraction and recognition. However, no studies were performed on the automatic division and location of AAPs.
As a model-based feature matching method, the ASM algorithm has been widely used in face recognition, eye state detection, medical image segmentation and extraction [12, 13, 14, 15]. It has iteratively evolved with the statistical shape information as a priori knowledge to obtain the shape of the test image [16]. The advantages of ASM are as follows: less iteration and better robustness performance. Furthermore, it is especially suitable for recognizing and locating objects with a similar shape. Face recognition technology has been employed to realize facial acupoint locations using the ASM algorithm [14].
Inspired by previous findings [14], this study proposed locating auricular divisions using the ASM algorithm combined with WFAS STANDARD-002:2013. This method might help achieve not only the location of the auricle but also the divisions of auricular subzones. The main innovations of this study were as follows: (1) the feature points of landmarks were creatively selected according to WFAS STANDARD-002:2013; (2) the evenly spaced interpolation method was used to finish auricular divisions.
2.Proposed method
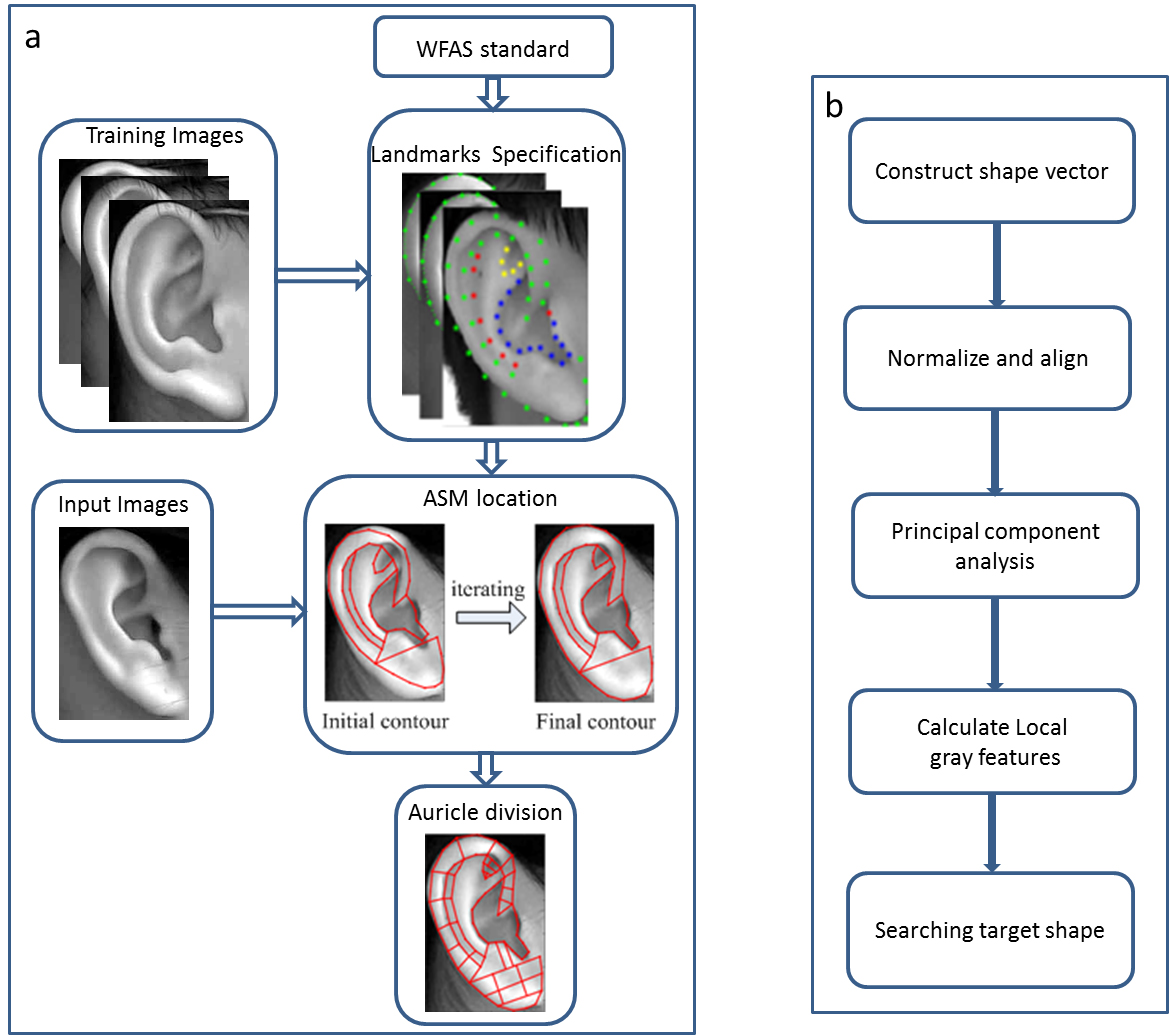
In this study, using the ASM algorithm combined with WFAS STANDARD-002:2013, a division method was proposed to realize the divisions of auricular subzones. The main flow diagram is shown in Fig. 1. A training set was built, followed by landmark specification combined with WFAS STANDARD-002:2013 to construct a point distribution model (PDM). Next, the ASM algorithm was used to finish the location of auricles. Finally, the points with the same interval space were inserted and connected with the line to divide the subzones. The key steps of the proposed method were as follows.
Figure 1.
Flow diagram of the proposed method. (a) Detailed steps of the method; (b) detailed step of the ASM location.
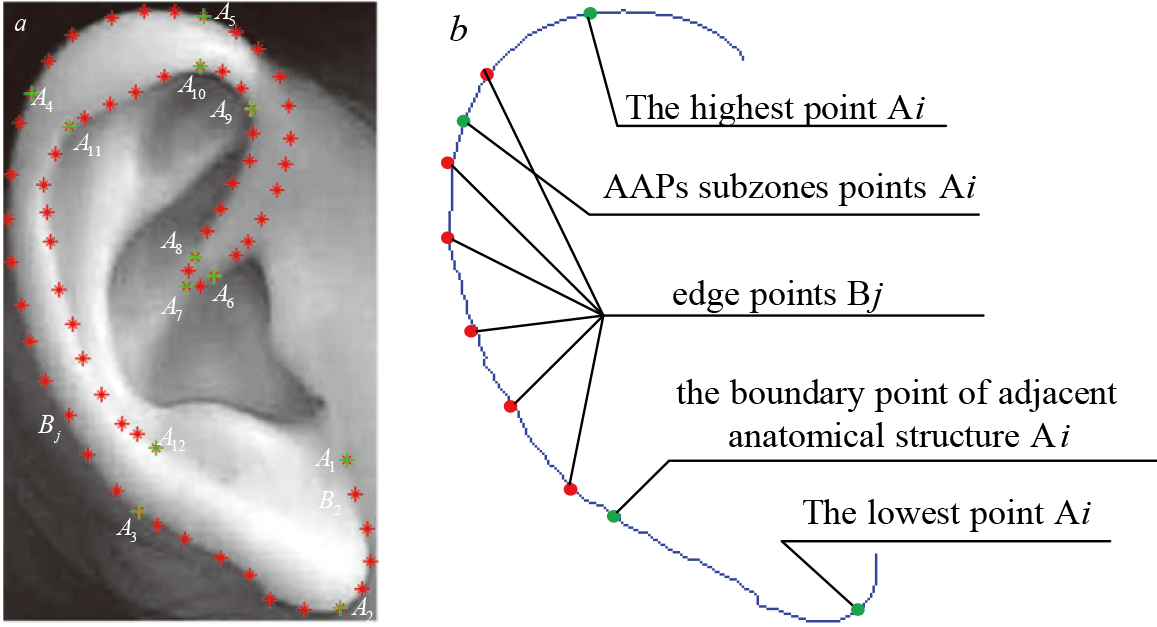
2.1Landmark specification
Landmarks are very important to the ASM algorithm. In the proposed method, the specification was that all the landmarks were divided into two types. One was the special point
Figure 2.
Indication of landmark specification on the external ear outline. (a) Indication of two types of landmarks; the green is the special point
2.2Active shape model location
The ASM algorithm diagram to locate the whole auricle is shown in Fig. 1b.
(1) Let
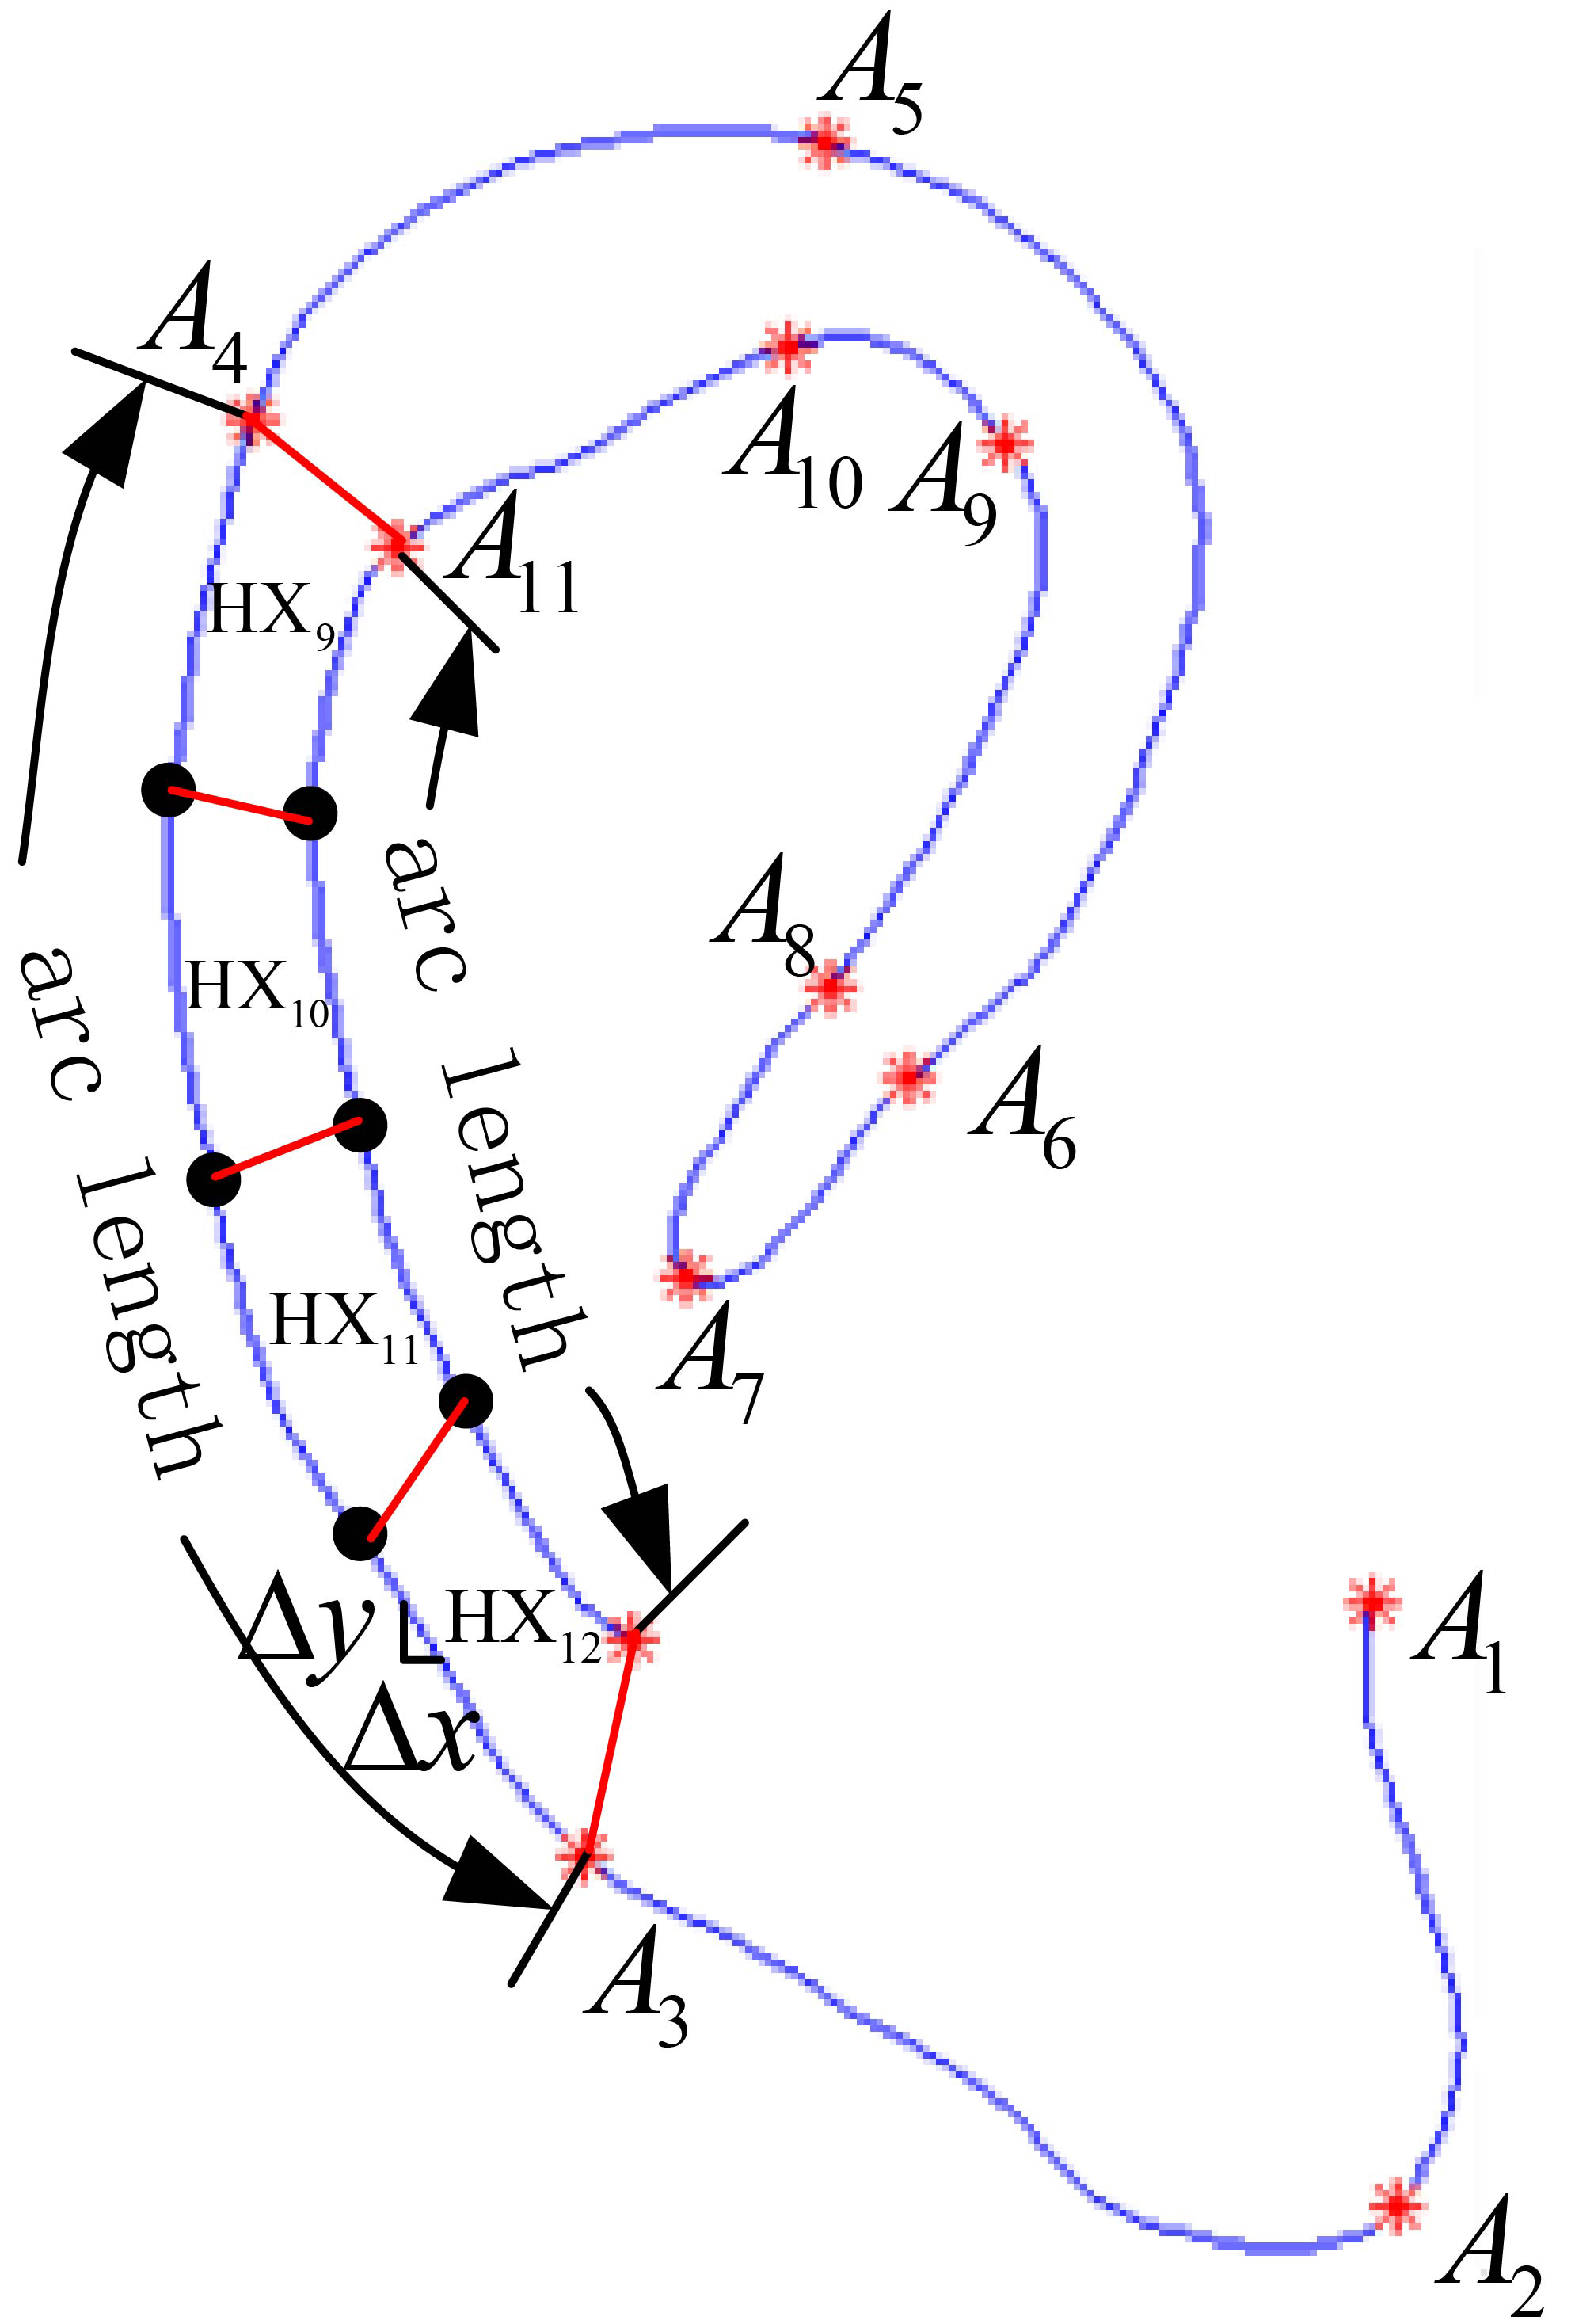
Figure 3.
Indication of helix divisions.
(2) All the shape vectors
(3) The principal component analysis (PCA) method was applied to reduce the dimension of the shape vectors to get the statistical model, including calculating the mean shape
(4) Local gray features
(5) The initial contour was added to the test image to locate the auricle shape using Mahalanobis distance
2.3Auricular division
After matching the target shape, the steps of auricular divisions were as follows:
(1) Extract the coordinates of the special points
(2) Calculate the contour arc length between the special points
(3) Interpolate evenly spaced points on the arcs.
(4) Draw a line to connect the correlated auricular points to complete the divisions.
For example, a diagram of the helix division is shown in Fig. 3.
3.Method
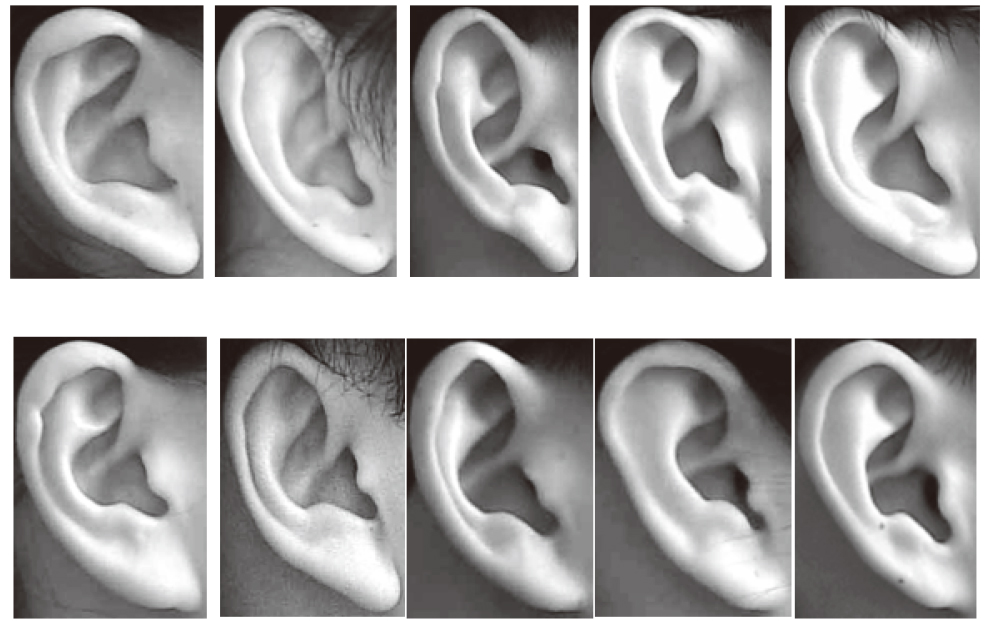
In this study, 30 images were selected from ear image library 2 of the University of Science and Technology Beijing human ear recognition laboratory; the images were segregated into the training set and the test set. Since the training images were not relatively enough, the test images were selected in the training sets too. Alternatively, training was conducted with 20 images and then the model was applied to the remaining 10 images. Some training set images are shown in Fig. 4. All the experiments were run on MATLAB 2010b.
Figure 4.
Part images in the training set.
Two experiments were designed to satisfy the actual needs of TCM teaching or professionals. One was the total auricular division and the other was the part auricular division. Other classical segmentation methods were used to locate the auricle compared with the proposed method. Euclid distance (ED) and Hausdorff distance (HD) were used as the criteria to evaluate the similarity in the division results, and the manual landmarks were treated as the ground truth in this study so as to test the accuracy of the division performed using the proposed method.
3.1Auricular division experiments
According to WFAS STANDARD-002:2013, 65 feature points were selected as landmarks to construct PDM, as explained in Section 2.1. The training experiment of the ASM algorithm is shown in Fig. 5. Figure 5a shows the training sample set before shape vector alignment. Figure 5b is the sample set after alignment by the Procrustes analysis. Figure 5c is the auricle mean model obtained after PCA dimension reduction.
Figure 5.
Training experiment of the ASM algorithm. (a) PDM before alignment; (b) PDM after alignment; and (c) average model.
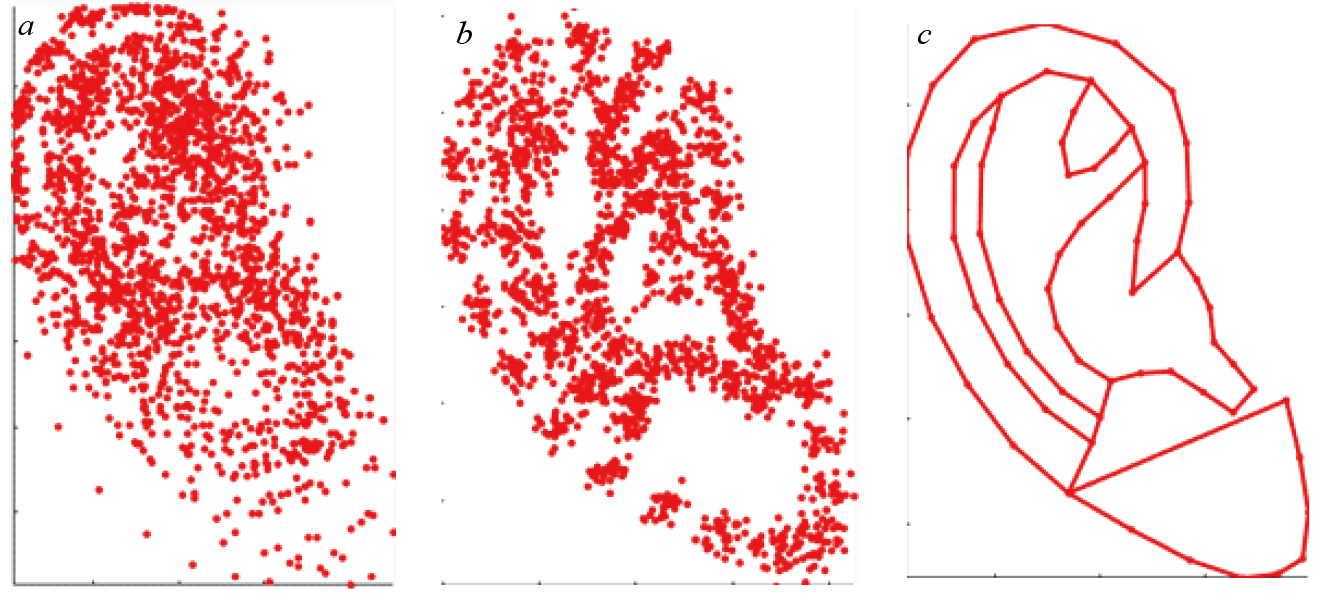
Figure 6.
Some auricular division results of test images.

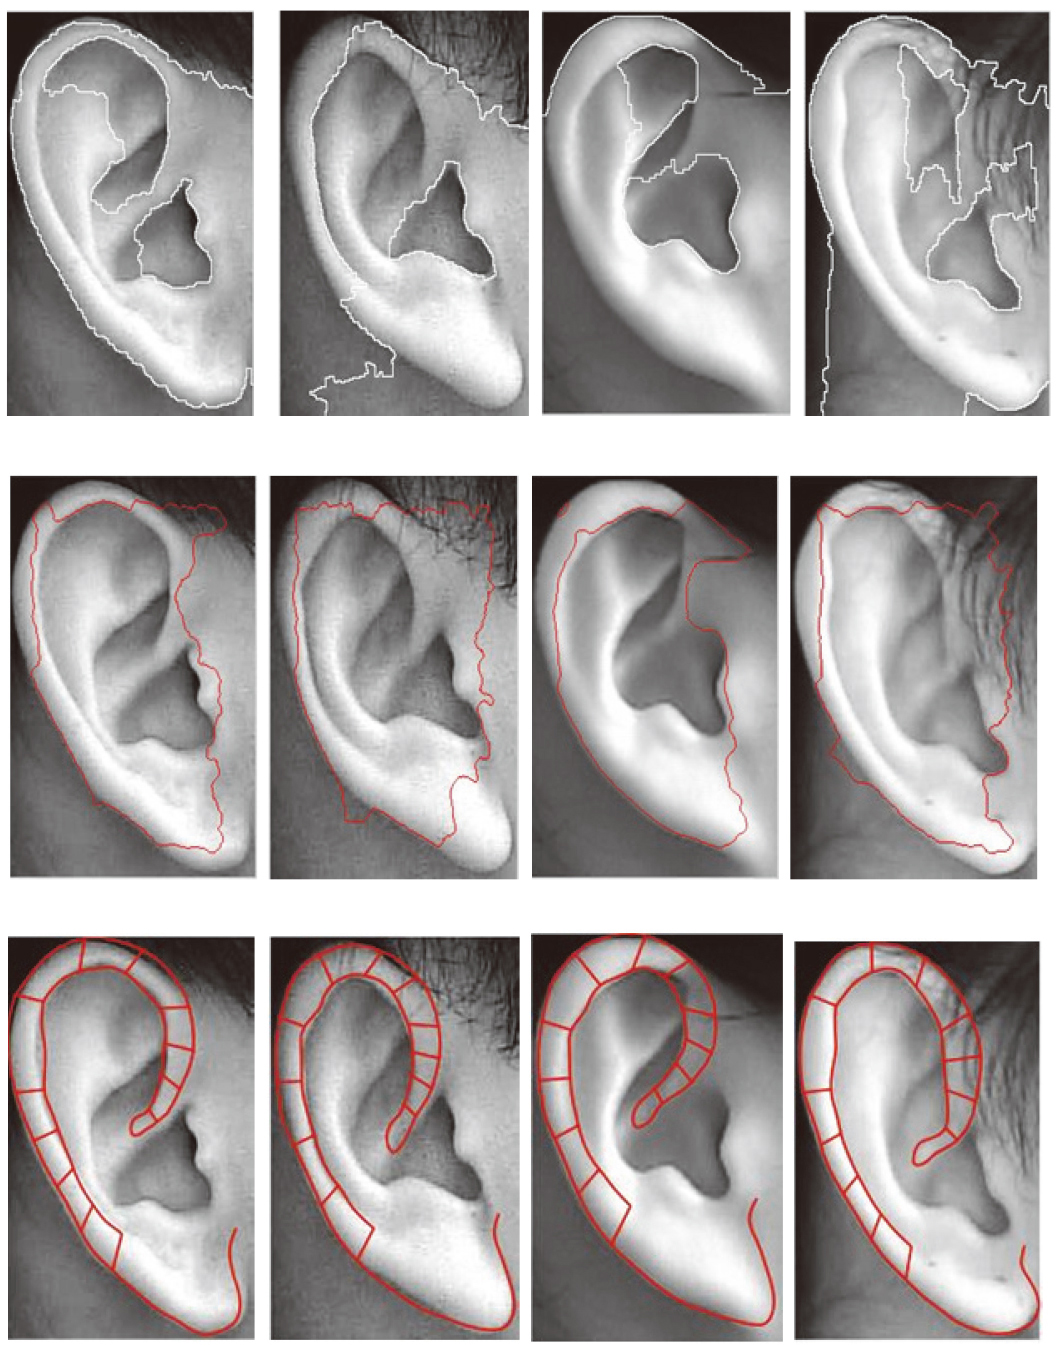
Figure 7.
Comparison of the helix division of three methods: the first row shows the results of the watershed method, the second row shows the results of the level set method, and the last row shows the divisions of the proposed method.
Affine transformation of translating, scaling or rotation can make the initial position as closer as it can be to the object image. In this study, affine parameters of the initial position were set to 0 for translation, 0
After the ASM location, the coordinates of special points were extracted. According to WFAS STANDARD-002:2013, the coordinates could be further divided into 12 regions of the helix, 5 regions of the scapha, 5 regions of the triangular fossa and 3 regions on the surface of the antitragus. The evenly spaced points were interpolated on the arcs to finish the subzones. In addition, the earlobe was divided into seven regions by drawing mutually perpendicular lines after connecting the related evenly spaced points. Thus, 32 auricular subzones on the surface of the auricle were divided, including helix, scapha, triangular fossa, antitragus and earlobe. Some of the results are shown in Fig. 6. The proposed method could accomplish a satisfying division of the auricle.
3.2Part division
Certain anatomical structure divisions could also be realized according to the user’s needs. Meanwhile, the proposed method was also compared with other popular segmentation methods, such as level set method [17, 18] and watershed method [19]. The seeds of the watershed method were set many times to find the best segmentation.
Figure 7 shows the helix divisions of four different images using the aforementioned methods The first row shows the results of the watershed method, whose two seeds are (65,56) and (72,113) and the threshold are 0.2555 and 0.0625, respectively. The second row shows the results of the level set method, whose initial contour is a circle its center coordinates are the center of the image and the radius is set to 80. The last row shows the divisions of the proposed method. Based on the results shown in Fig. 7, it could be concluded that the level set method and the watershed method led to failure segmentation, and the proposed method could not only locate the helix but also divide the subzones.
3.3Experimental evaluation
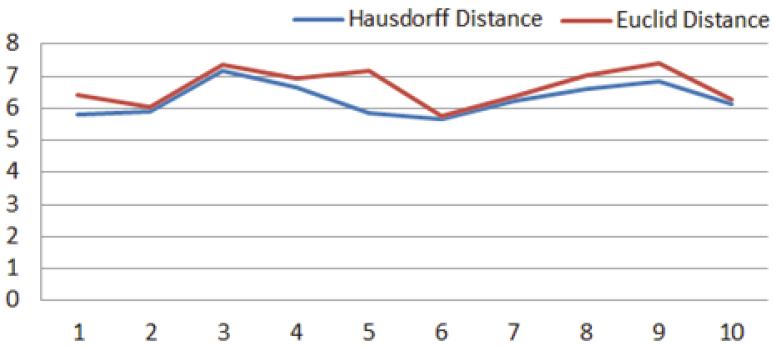
In this study, ED and HD served as evaluation indexes by comparing the location results of the proposed method with these points marked by hand. ED is often used to record the distance between the two vectors. The smaller the ED, the greater the similarity between the two vectors. HD is a measure to describe the similarity between two sets of points, which measures the maximum mismatch between the two sets of points. The evaluation chart is shown in Fig. 8. The horizontal axis has 10 test images and the vertical axis has the values of ED and HD. The average ED and HD of these test images were 6.67
Figure 8.
Evaluation chart of ED and HD.
4.Discussion
The division of auricular subzones was basically realized in this study by combining the ASM algorithm and WFAS STANDARD-002:2013. The experimental results showed that the proposed method was feasible technically. As shown in Fig. 5, the delineation of the auricle shape was in good agreement with not only the edges, such as the outline of the external ear and the auricular concha, but also the anatomical boundary with the indistinct edges such as the anthelix, scapha or ear lobe. As shown in Fig. 6, the proposed method could realize certain anatomical structure divisions satisfactorily according to the user’s needs compared with the other segmentation methods. Mahalanobis distance was used as the iterative formula. It could eliminate the variance and correlation between the different dimensions of the sample, and was a dimensionless measure compared with other distance measurements.
The reasons for the findings were analyzed. First, the ASM algorithm was suitable for the segmentation of similar shapes and successfully applied to ventricles, face recognition and so on. Therefore, it was a good choice to locate the human ear which had a comparable shape. However, other popular segmentation methods could not realize a good delineation because their evolution was decided only by the gray gradient or the threshold, but not by the feature points. Second, the landmarks were divided into two categories under the guidance of WFAS STANDARD-002:2013: the special point
Further studies are needed to optimize the proposed method, mainly in the following aspects: (1) it costs much more time and patience to construct the PDM of the anatomical structure of the auricle according to WFAS STANDARD-002:2013. On the contrary, the accuracy of most auricular partitions was not high due to manual calibration. It is necessary to further seek automatic or semi-automatic algorithms to mark the landmarks. (2) At present, the research is still in the preliminary stage. This study only realized part partition, and the training ear images was relatively less. The algorithm only preliminarily proved the feasibility of the proposed method, and still a large gap exists in terms of the realization of accurate positioning of all the AAPs. Hence seeking and optimizing the best suitable method will be a potential research direction in the future.
5.Conclusions
This study proposed an auricular division method by combining the ASM algorithm with WFAS STANDARD-002:2013 automatically and efficiently. The average HD and ED of landmarks between the machine and the manual positioning were 6.28
Acknowledgments
The authors gratefully acknowledge the support of The University of Science and Technology Beijing Human Ear Recognition Laboratory and the Chinese National Natural Science Foundation (82074550).
Conflict of interest
None to report.
References
[1] | Cheng JT, Ear point therapy for all diseases (4th Edition) [M]. Henan: Henan science and Technology Press, (2017) : 1-7. |
[2] | Liu JH, Xu YY, Xu GZ, et al. Auricular Medicine Is the “Bridge” of the Integrated Traditional Chinese Medicine and Western Medicine. Chinese Journal of Integrated Traditional and Western Medicine. (2019) ; 39: (6): 750-752. |
[3] | Chen PB, Yang XF, Wang XG, et al. The Application of Graphic Teaching Method in the Teaching of Auricular Acupuncture Positioning. Asia-Pacific Traditional Medicine. (2019) ; 15: (6): 214-215. |
[4] | Auricular Acupuncture Point (WFAS STANDARD-002: 2012). World Journal of Acupuncture Moxibustion. (2013) ; 23: (3): 12-21. |
[5] | General Administration of quality supervision, inspection and Quarantine of the people’s Republic of China. GB/T 13734-2008 Name and location of auricular points [S]. Beijing: China Standard Press, (2008) . |
[6] | Hassaballah M, Alshazly H, Ali AA. Robust local oriented patterns for ear recognition. Multimedia Tools and Applications, (2020) (2). |
[7] | Ma J, Li Y, Liu H, et al. Improving segmentation accuracy for ears of winter wheat at flowering stage by semantic segmentation. Computers and Electronics in Agriculture. (2020) ; 176: : 105662. |
[8] | Ganapathi II, Prakash S, Dave IR, et al. Unconstrained ear detection using ensemblebased convolutional neural network model. Concurrency and Computation: Practice and Experience, (2020) . |
[9] | Li YB, Huang ZX, Zhang HJ, et al. An Automatic Ear Detection Method Based on Improved GVF Snake. Pattern Recognition and Artificial Intelligence. (2010) ; 23: (4): 552-559. |
[10] | Li SJ, Feng J, Niu JC, et al. The Research of The Impact of Normalization for Feature Extraction and Recognition on Ear Biomitrice Recognition. Computer Knowledge and Technology. (2008) ; 4: (36): 2984-2985. |
[11] | Gao SX, Mu ZC. On Image Normalization in Ear Recognition. Control Engineering of China. (2008) (1): 18-21. |
[12] | Yang Y. A Study on ASM-Based Lung Edge Extraction[D]. Liaoning: Northeastern University, (2015) . |
[13] | Huang F, You QF, Yang JJ. Hand bone extraction method research based on ASM. Computer Engineering and Applications. (2016) ; 52: (3): 164-168, 219. |
[14] | Chang ML. Research on Facial Acupuncture Point Positioning Method Based on Feature Point Location Algorithm. Beijing: Beijing University of Technology, (2017) . |
[15] | Yi J, Wang BL, Liu SX, et al. Research on Face Localization Method Combining ASM Algorithm and Edge Detection. China CIO News. (2015) ; (12): 125-127. |
[16] | Cootes TF, Taylor CJ, Cooper DH, et al. Active shape models-their training and application. Computer Vision and Image Understanding. (1995) ; 61: (1): 38-59. doi: 10.1006/cviu.1995.1004. |
[17] | Li CM, Xu C, Gui C, et al. Distance Regularized Level Set Evolution and Its Application to Image Segmentation. IEEE Transactions on Image Processing A Publication of the IEEE Signal Processing Society. (2010) ; 19: (12): 3243. doi: 10.1109/TIP.2010.2069690. |
[18] | Zhang KH, Zhang L, Zhang S. A variational multiphase level set approach to simultaneous segmentation and bias correction. 2010 IEEE International Conference on Image Processing. (2010) ; 4105-4108. doi: 10.1109/ICIP.2010.5651554. |
[19] | Watson, Alistair, Imeson. segmentation of images using the watershed method. ((2008) ). doi: US20050013483 A1. |


