
Bioinformatics analysis of Myelin Transcription Factor 1
Abstract
BACKGROUND AND OBJECTIVE:
We aimed to further study the role of Myelin Transcription Factor 1(MyT1) in tumor and other diseases and epigenetic regulation, and better understand the regulatory mechanism of MyT1.
METHODS:
Using bioinformatics analysis, the structure and function of MyT1sequence were predicted and analyzed using bioinformatics analysis, and providing a theoretical basis for further experimental verification and understanding the regulatory mechanism of MyT1. The first, second and third-level structures of MyT1 were predicted and analyzed by bioinformatics analysis tools.
RESULTS:
MyT1 is found to be an unstable hydrophilic protein, rather than a secretory protein, with no signal peptide or trans-membrane domain; total amino acids located on the surface of the cell membrane. It contains seven zinc finger domains structurally. At sub-cellular level, MyT1 is localized in the nucleus. The phosphorylation site mainly exists in serine, and its secondary structure is mainly composed of random coils and alpha helices; the three-dimensional structure is analyzed by modeling.
CONCLUSIONS:
In this study, the structure and function of MyT1 protein were predicted, thereby providing a basis for subsequent expression analysis and functional research; it laid the foundation for further investigation of the molecular mechanism involved in the development of diseases.
1.Introduction
A large number of transcription factors exist in an organism, acting as trans-acting factors. They occur in different signal transduction pathways, and can specifically regulate gene expression with cis-acting factors; thereby influence various biochemical and physiological activities, thereby regulating various biochemical and physiological activities. Myelin transcription factor (Myt)/Neural zinc finger (NZF) proteins constitute a unique family of transcription factors that play an important role in differentiation of a mass of cell types. Myt/NZF family proteins are mainly expressed in the developing nervous system and have characteristic CCHHC-type zinc finger motifs as DNA-binding domains [1].
Myelin proteins account for 30% of the total myelin sheath mass, and the protein (PLP) and myelin basic protein (MBP) are the main myelin proteins in central nervous system, constituting 80% of the total myelin content in the central nervous system [2]. MyT1 is a DNA binding protein that binds to the promoter of PLP gene in oligodendrocyte precursor cells and may regulate the transcription of myelin protein gene [3].
In the normal physiological state, MyT1 acts as a transcription factor mainly expressing in the development of the central nervous system cells [4, 5], and mediates the formation of myelin and the proliferation and differentiation of oligodendrocyte [6, 7, 8]. MyT1 also exists in some subgroups of neural precursor and mature neurons [9]. MyT1’s DNA binding domain has a special CCHHC (Cys-X4-Cys-His-X7-His-X5-Cys) structure [10], which can identify a target sequence with “AAGTT” as the core, specifically bind to various neural development-related gene promoters [11], raise HDAC Sin3B or LSD1 to form a complex [12, 13], regulate gene expression by changing the histone modification characteristics of related genes, and promote the neuronal differentiation and proliferation of cells [14]. In situ hybridization studies have shown that the expression of MyT1 in the progenitor cells and the precursor of the neurons after mitosis in the peripheral and central nervous system begins at the beginning of neurogenesis [15]. It has been found that MyT1 can directly inhibit different somatic lineage programs other than neuron programs and play its role in promoting neurons [16]. In addition, overexpression of POU3F2, ASCL1, and MyT1 genes in fibroblasts have been shown to induce them into neurons [17]; some studies have shown similar phenomena in melanoma A375 cells [18], indicating MyT1 as a cell fate-determining gene that plays a key role in the differentiation and reprogramming of neurons. MyT1 has been pointed out as a powerful inhibitory protein that can recognize the open state of chromatin around the target gene by recruiting HDAC protein Sin3b, inhibit the expression of related genes by inhibiting the fate of a variety of non-neuronal cells, and promote the development of neurons and maintenance of biological characteristics by inhibiting the activation of Notch signal [16, 19]. These results indicate MyT1 as an important regulatory gene in the development of nerve cells.
With the rapid development of bioinformatics, the use of bioinformatics-related software for rapid and effective analysis has become the mainstream research methodology in the field of gene structure and function. Comprehensive analysis of MyT1 by bioinformatics methods would be helpful to obtain more information and provide more detailed data for its functional genomics research.
2.Materials and methods
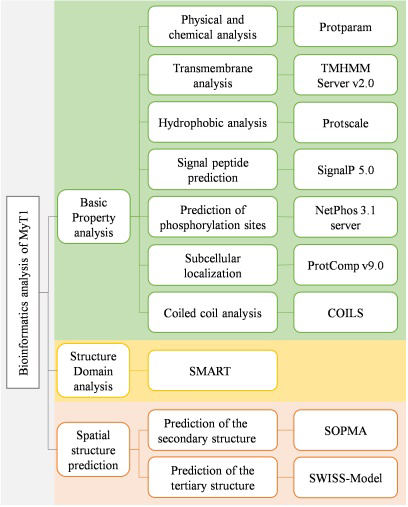
The first, second and third-level structures of MyT1 were predicted and analyzed by bioinformatics analysis tools. The flowchart of the methods is shown in Fig. 1, and the software name and address are shown in Table 1.
Table 1
Software name and address
| The name of the software | Use function | The URL |
|---|---|---|
| Protparam | Physical and chemical analysis | |
| TMHMM | Transmembrane analysis | |
| ProtScale | Hydrophobic analysis | |
| SignalP 5.0 | Signal peptide prediction | |
| NetPhos 3.1 server | Prediction of phosphorylation sites | |
| ProtComp v9.0 | Subcellular localization | |
| COILS | Coiled coil analysis | |
| SMART | Structure domain analysis | |
| SOPMA | Protein secondary structure prediction | |
| SWISS-Model | Protein tertiary structure prediction |
Figure 1.
Flowchart of the methods.
2.1The basic property analysis of MyT1
2.1.1Physical and chemical analysis
According to the physical and chemical properties of amino acids, we can analyze the unknown proteins in electrophoresis experiments, as well as the physical and chemical properties of known proteins. We used ExPASy ProtParam to analyze the physicochemical properties of MyT1 [20]. ExPASY can analyze the basic properties of proteins.
2.1.2Transmembrane analysis
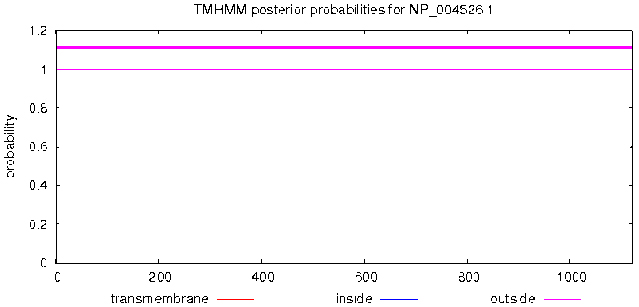
The protein contains transmembrane region, which suggests that it may act as a membrane receptor or a membrane protein localized on the membrane. TMHMM is a program based on Markov model to predict the transmembrane helix, which can be used to predict the transmembrane region and the inner and outer membrane region. We used TMHMM Server v.2.0 to predict transmembrane domain [21]. The parameter settings: Output format choose Extensive, with graphics.
2.1.3Hydrophobic/hydrophilic analysis
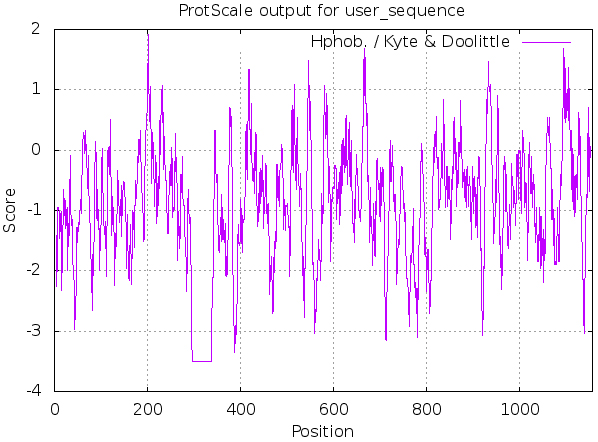
Hydrophobicity of amino acids reflects protein folding. Hydrophobic regions appear in potential transmembrane regions and play an important role in maintaining the tertiary structure of proteins (such as maintaining the structure of biofilm). The hydrophilicity and hydrophobicity of proteins can provide reference for the identification of protein transmembrane regions. ProtScale was used for hydrophobic/hydrophilic analysis [20].
The parameter settings: Amino acid scale choose HPhotb. /Kyte and Doolittle; Window size choose 9; Relative weight of the window edges compared to the window center in 100%; There is no need to normalize the scale from 0 to 1.
2.1.4Signal peptide prediction
Signal peptide is the N-terminal amino acid sequence of secretory protein polypeptide chain, which is used to guide protein transmembrane translocation. It is generally composed of 20
The parameter settings: Organism group choose Eukarya; Output format choose Long output.
2.1.5Phosphorylation sites prediction
Protein phosphorylation refers to the process of transferring phosphate groups from one compound to another by enzymatic reaction. It is a universal regulation mode existing in organisms and plays an extremely important role in the process of cell signal transmission. We used NetPhos 3.1 Server [23] to predict protein phosphorylation sites. Netphos used neural network to predict phosphorylation sites.
The parameter settings: Residues to predict choose all three; Output format choose classical; Choose Generate graphics.
2.1.6Subcellular localization
Protein surface is directly exposed to organelle environment, which is determined by sequence folding process, which depends on amino acid composition. Therefore, it is possible to predict subcellular localization by amino acid composition. ProtComp v9.0 was used to check sub-cellular localization.
2.1.7Coiled coil analysis
Coiled coil is a structural model existing in many natural proteins. Many proteins with coiled coil structure have important biological functions, such as transcription factors in the regulation of gene expression. We used COILS [24] for curl helix analysis. COILS compared the sequence with the known parallel double stranded coil database to obtain the similarity score, and then calculated the probability of the sequence forming the coiled coil.
The parameter settings: Window width choose all; matrix chose MTIDK; 2.5 fold weighting of positions a, d chose no.
2.2Structural domain analysis
Domain is a kind of structural level between secondary and tertiary structure. It is the basic structural unit of protein tertiary structure, which cannot be changed and is the core of gene. We used SMART [25] for structure domain analysis. SMART is a tool for protein family comparison based on Hidden Markov chain algorithm. It provides protein sequences and queries their domains and transmembrane domains in domain database.
The parameter settings: we choose PFAM domains.
2.3Spatial structure prediction
2.3.1Predict protein secondary structure
Secondary structure refers to the regular local structural elements such as alpha-helical and beta-turn. Different amino acid residues have different tendency to form different secondary structural elements. Most of the algorithms for predicting protein secondary structure are based on the known three-dimensional structure and secondary structure of protein, and the prediction methods are constructed by artificial neural network and genetic algorithm. Sopma is a self optimizing prediction method with band comparison, which integrates several independent secondary structure prediction methods into “consistent prediction results”. We used SOPMA [26] to predict protein secondary structure.
The parameter settings: Number of conformational states choose 4 (Helix, Sheet, Turn, Coil); Similarity threshold choose 8; Window width choose 17.
2.3.2Homology modeling of protein tertiary structure
According to the data in the database established by the analysis of the structure and function of natural protein, the spatial structure and biological function of a certain amino acid sequence can be predicted. Protein structure prediction can be used to determine the three-dimensional shape of protein according to its amino acid sequence. SWISS-MODEL is an automated protein comparison modeling server, which is used to predict protein structure models We used SWISS-MODEL [27] for homology modeling of protein tertiary structure. SWISS-MODEL is an automatic online software for predicting protein tertiary structure by homologous modeling method. The credibility range of GMQE (global model quality estimation) is 0–1, and the higher the value, the better the quality.
3.Results
3.1The basic property analysis of MyT1
3.1.1Physical and chemical analysis
ExPASy ProtParam was used, the result shows that MyT1 encodes 1157 amino acids, the most abundant amino acid is glutamic acid, the relative molecular weight is 126447.96, the isoelectric point (pI) is 4.91, negative, the molecular formula C
Table 2
Prediction of the amino acid composition of MyT1
| Amino acid species* | Amino acid | Number* | Ratio |
|---|---|---|---|
| Acidic amino acid | Glu (E) | 152 | 13.1% |
| Asp (D) | 61 | 5.3% | |
| Basic amino acid | Arg (R) | 55 | 4.8% |
| Lys (K) | 78 | 6.7% | |
| His (H) | 36 | 3.1% | |
| Non-polar R amino acid | Ala (A) | 86 | 7.4% |
| Val (V) | 43 | 3.7% | |
| Leu (L) | 88 | 7.6% | |
| Ile (I) | 33 | 2.9% | |
| Trp (W) | 4 | 0.3% | |
| Met (M) | 18 | 1.6% | |
| Phe (F) | 22 | 1.9% | |
| Pro (P) | 76 | 6.6% | |
| R with polar uncharged amino acid | Asn (N) | 37 | 3.2% |
| Cys (C) | 31 | 2.7% | |
| Gln (Q) | 46 | 4.0% | |
| Gly (G) | 81 | 7.0% | |
| Ser (S) | 134 | 11.6% | |
| Thr (T) | 57 | 4.9% | |
| Tyr (Y) | 19 | 1.6% |
Amino acid species: Amino acid can be divided into four groups according to the properties of R-group. Number: The number of the specific amino acids in MyT1 protein. Ratio: The percentage of occurrences of the specific amino acids in MyT1 protein.
3.1.2Transmembrane analysis
TMHMM Server v.2.0 was used, as shown in Fig. 2, the MyT1 has no transmembrane domain and the total amino acids are located on the surface of cell membrane.
Figure 2.
Prediction of transmembrane of MyT1.
3.1.3Hydrophobic/hydrophilic analysis
ProtScale was used, as shown in Fig. 3 and Table 3, MyT1 was found to be hydrophilic, the sum number of hydrophilic amino acid residues is
Table 3
The hydrophobic and hydrophilic amino acid residue positions situations of MyT1
| Position of most hydrophilic amino acid residue | Value | Position of most hydrophobic amino acid residue | Value | The numerical sum of hydrophilic amino acid residue | The numerical sum of hydrophobic amino acid residue |
| 298 | 203 | 1.911 | | 94.52 |
Figure 3.
Prediction of hydrophobic/hydrophilic of MyT1.
3.1.4Signal peptide prediction
SignalP-5.0 server was used, it is shown in Fig. 4, there is no signal peptide in MyT1.
Figure 4.
Signal peptide prediction of MyT1.
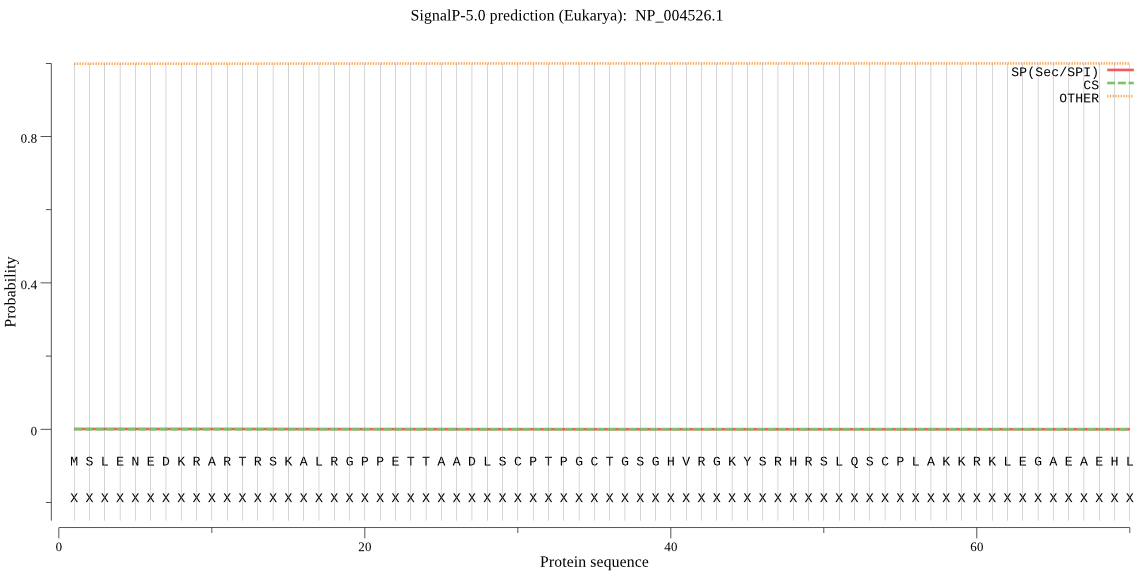
Figure 5.
Prediction of phosphorylation sites of MyT1.
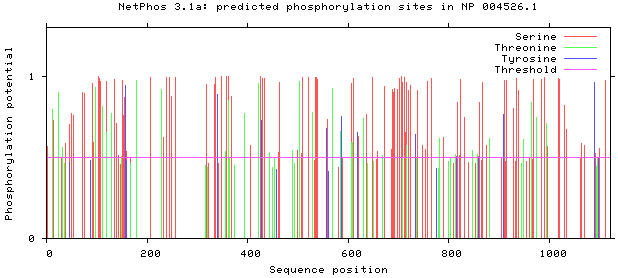
3.1.5Phosphorylation sites prediction
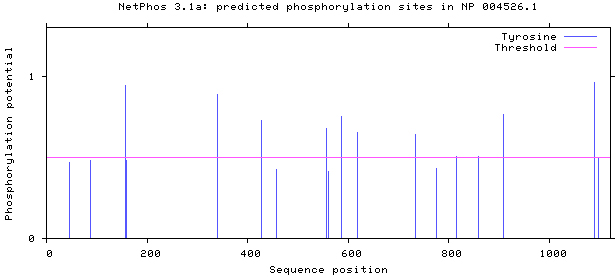
NetPhos 3.1 server was used, as shown in Figs 5–8. There are 34 threonine, 108 serine and 11 tyrosine sites in the potential phosphorylation sites of MyT1.
Figure 6.
Prediction of serine phosphorylation sites.
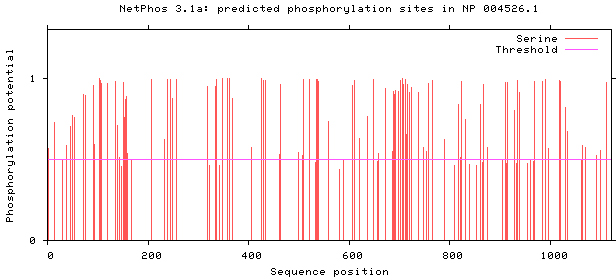
Table 4
The subcellular localization of MyT1
| Location weights | LocDB | PotLocDB | Neural Nets | Pentamers | Integral |
| Nuclear | 10.0 | 3.0 | 0 | 0.66 | 9.03 |
| Plasma membrane | 0 | 0 | 0.95 | 0 | 0.65 |
| Extracellular | 0 | 0 | 0.95 | 0.44 | 0.05 |
| Cytoplasmic | 0 | 0 | 0 | 1.93 | 0 |
| Mitochondrial | 0 | 0 | 0 | 1.73 | 0 |
| Endoplasm. retic. | 0 | 0 | 0 | 0.28 | 0 |
| Peroxisomal | 0 | 0 | 0.95 | 0 | 0.07 |
| Golgi | 0 | 0 | 0.15 | 0.26 | 0 |
| Chloroplast | 0 | 0 | 0 | 0.06 | 0 |
| Vacuolar | 0 | 0 | 0 | 0.01 | 0.19 |
Figure 7.
Prediction of tyrosine phosphorylation sites.
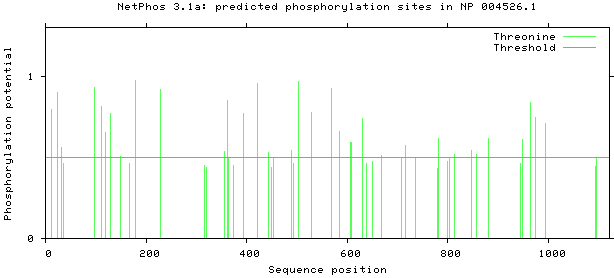
Figure 8.
Prediction of threonine phosphorylation sites.
3.1.6Subcellular localization
ProtComp v9.0 was used, as shown in Table 4. MyT1 is located in nuclear at subcellular level.
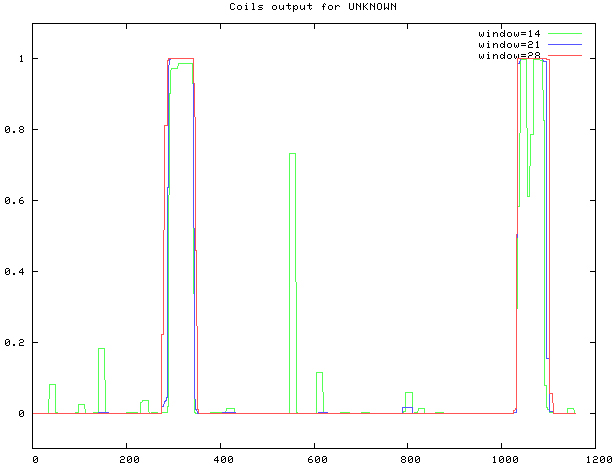
3.1.7Coiled coil analysis
COILS was used, as shown in Fig. 10. The coiled coil is at sites 291–344, 1033–1091.
3.2Structural domain analysis
SMART was used, as shown in Fig. 9 and Table 5. MyT1 has seven zinc finger domains.
Table 5
Position of MyT1 Conservative structural domain
| Name | Start | End | E-value |
|---|---|---|---|
| Pfam:zf-C2HC | 65 | 93 | 4.1e-13 |
| Pfam:zf-C2HC | 477 | 504 | 1.6e-11 |
| Pfam:zf-C2HC | 521 | 549 | 1.9e-13 |
| Pfam:MYT1 | 596 | 652 | 1.6e-25 |
| Pfam:MYT1 | 651 | 827 | 4.2e-53 |
| Pfam:zf-C2HC | 835 | 863 | 1.1e-15 |
| Pfam:zf-C2HC | 879 | 907 | 1.2e-15 |
| Pfam:zf-C2HC | 928 | 956 | 1.1e-13 |
| Pfam:zf-C2HC | 981 | 1009 | 4.1e-13 |
Figure 9.
Prediction of conservative structural domain of MyT1.

Figure 10.
Prediction of MyT1 Coiled coil.
3.3Prediction of spatial structure
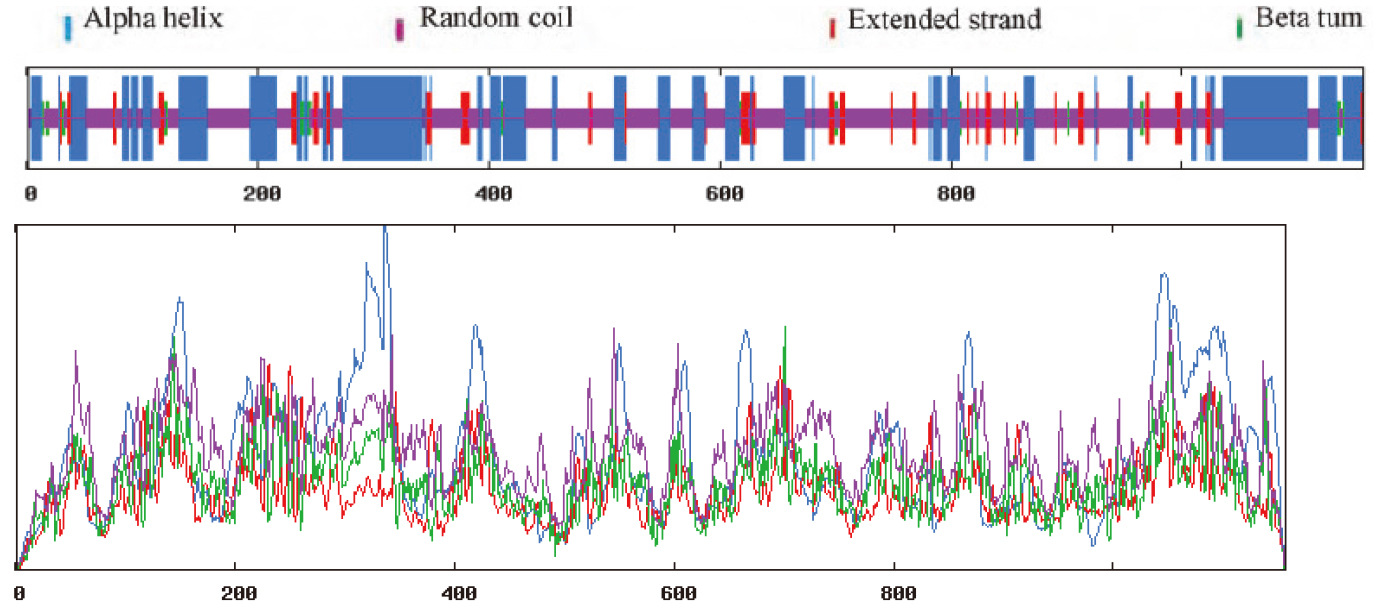
3.3.1Predict protein secondary structure
SOPMA was used, as shown in Fig. 11. The secondary structure consisted of 36.99% alpha-helical, 7.95% extended strand, 2.25% beta-turn and 52.81% random coil.
Figure 11.
Prediction of the secondary structure of MyT1.
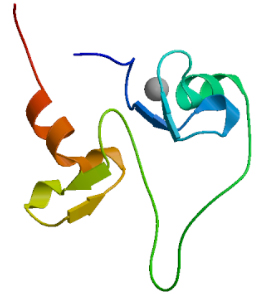
3.3.2Homology modeling of protein tertiary structure
SWISS MODEL was used, as shown in Fig. 12. The score of GMQE is 0.04.
Figure 12.
The tertiary structure prediction of MyT1.
The present study showed that MyT1encodesed 1157 amino acids, the most abundant amino acid is glutamic acid, the relative molecular weight was 126447.96, the isoelectric point (pI) was 4.91, negative, the molecular formula C
4.Conclusion
MyT1 is an important regulatory gene in the development of nerve cells and plays a vital role in their differentiation and reprogramming. Comprehensive analysis of MyT1 with bioinformatics approach helps to obtain more structural information and biological functions that will potentially yield benefit to functional genomics studies.
We studied the structure and function of MyT1 based on bioinformatics, the results show that t MyT1 is found to be an unstable hydrophilic protein, rather than a secretory protein, with no signal peptide or trans-membrane domain. The total amino acids are located on the surface of the cell membrane. It contains seven zinc finger domains structurally. At sub-cellular level, MyT1 is localized in the nucleus. The phosphorylation site mainly exists in serine, and its secondary structure is mainly composed of random coils and alpha helices; the three-dimensional structure is analyzed by modeling.
In conclusion, MyT1 is an unstable hydrophilic protein, which may be induced by environmental conditions. Furthermore, we can judge that transcription regulation may be induced by environmental conditions. There is no trans-membrane domain, demonstrating that it is not a secretory protein, which is consistent with its biological function as a transcription factor. Zinc finger domains regulate gene expression, cell differentiation, and embryonic development at the level of transcription and translation. It has abundant phosphorylation sites, which may be activated by phosphorylation and regulate the expression of secondary response genes. The nucleus is where it resides and functions form. Irregular curl is its main fold while the proportion of
Acknowledgments
This work was supported by a project grant from the Tianjin Key Technology R&D Program (No. 17ZXRGGX00020) and the National Natural Science Foundation of China (Grand No. 81801240).
Conflict of interest
None to report.
References
[1] | Matsushita F, Kameyama T, Kadokawa Y, et al. Spatiotemporal expression pattern of Myt/NZF family zinc finger transcription factors during mouse nervous system development. Dev Dyn. (2014) ; 243: (4): 588-600. doi: 10.1002/dvdy.24091. Epub 2013 Dec 19. |
[2] | Campagnoni AT, Macklin WB. Cellular and molecular aspects of myelin protein gene expression. Mol Neurobiol. (1988) ; 2: (1): 41-89. doi: 10.1007/BF02935632. |
[3] | Emery B, Agalliu D, Cahoy JD, et al. Myelin gene regulatory factor is a critical transcriptional regulator required for CNS myelination. Cell. (2009) ; 138: (1): 172-85. doi: 10.1016/j.cell.2009.04.031. |
[4] | Kim JG, Armstrong RC, Agoston D, et al. Myelin transcription factor 1 (Myt1) of the oligodendrocyte lineage, along with a closely related CCHC zinc finger, is expressed in developing neurons in the mammalian central nervous system. J Neurosci Res. (1997) ; 50: (2): 272-90. doi: 10.1002/(SICI)1097-4547(19971015)50:2<272::AID-JNR16>3.0.CO;2-A. |
[5] | Wrathall JR, Li W, Hudson LD. Myelin gene expression after experimental contusive spinal cord injury. J Neurosci. (1998) ; 18: (21): 8780-93. doi: 10.1523/JNEUROSCI.18-21-08780.1998. |
[6] | Spassky N, Goujet-Zalc C, Parmantier E, et al. Multiple restricted origin of oligodendrocytes. J Neurosci. (1998) ; 18: (20): 8331-43. doi: 10.1523/JNEUROSCI.18-20-08331.1998. |
[7] | Sim FJ, Zhao C, Penderis J, et al. The age-related decrease in CNS remyelination efficiency is attributable to an impairment of both oligodendrocyte progenitor recruitment and differentiation. J Neurosci. (2002) ; 22: (7): 2451-9. doi: 10.1523/JNEUROSCI.22-07-02451.2002. |
[8] | Nielsen JA, Berndt JA, Hudson LD, et al. Myelin transcription factor 1 (Myt1) modulates the proliferation and differentiation of oligodendrocyte lineage cells. Mol Cell Neurosci. (2004) ; 25: (1): 111-23. doi: 10.1016/j.mcn.2003.10.001. |
[9] | Romm E, Nielsen JA, Kim JG, et al. Myt1 family recruits histone deacetylase to regulate neural transcription. J Neurochem. (2005) ; 93: (6): 1444-53. doi: 10.1111/j.1471-4159.2005.03131.x. |
[10] | Gamsjaeger R, Swanton MK, Kobus FJ, et al. Structural and biophysical analysis of the DNA binding properties of myelin transcription factor 1. J Biol Chem. (2008) ; 283: (8): 5158-67. doi: 10.1074/jbc.M703772200. Epub 2007 Dec 11. |
[11] | Gamsjaeger R, O’Connell MR, Cubeddu L, et al. A structural analysis of DNA binding by myelin transcription factor 1 double zinc fingers. J Bio Chem. (2013) ; 288: (49): 35180-91. doi: 10.1074/jbc.M113.482075. Epub 2013 Oct 6. |
[12] | Romm E, Nielsen JA, Kim JG, et al. Myt1 family recruits histone deacetylase to regulate neural transcription. J Neurochem. (2005) ; 93: (6): 1444-53. doi: 10.1111/j.1471-4159.2005.03131.x. |
[13] | Yokoyama A, Igarashi K, Sato T, et al. Identification of myelin transcription factor 1 (MyT1) as a subunit of the neural cell type-specific lysine-specific demethylase 1 (LSD1) complex. J Biol Chem. (2014) ; 289: (26): 18152-62. doi: 10.1074/jbc.M114.566448. Epub 2014 May 14. |
[14] | Kameyama T, Matsushita F, Kadokawa Y, et al. Myt/NZF family transcription factors regulate neuronal differentiation of P19 cells. Neurosci Lett. (2011) ; 497: (2): 74-9. doi: 10.1016/j.neulet.2011.04.033. Epub 2011 Apr 22. |
[15] | Matsushita F, Kameyama T, Marunouchi T. NZF-2b is a novel predominant form of mouse NZF-2/MyT1, expressed in differentiated neurons especially at higher levels in newly generated ones. Mech Dev. (2002) ; 118: (1-2): 209-13. doi: 10.1016/s0925-4773(02)00250-2. |
[16] | Mall M, Kareta MS, Chanda S, et al. Myt1l safeguards neuronal identity by actively repressing many non-neuronal fates. Nature. (2017) ; 544: (7649): 245-249. doi: 10.1038/nature21722. Epub 2017 Apr 5. |
[17] | Pang ZP, Yang N, Vierbuchen T, et al. Induction of human neuronal cells by defined transcription factors. Nature. (2011) ; 476: (7359): 220-3. doi: 10.1038/nature10202. |
[18] | Zhang H, Wei M, Jiang Y, et al. Reprogramming A375 cells to induced resembled neuronal cells by structured overexpression of specific transcription genes. Mol Med Rep. (2016) ; 14: (4): 3134-44. doi: 10.3892/mmr.2016.5598. Epub 2016 Aug 8. |
[19] | Romm E, Nielsen JA, Kim JG, et al. Myt1 family recruits histone deacetylase to regulate neural transcription. J Neurochem. (2005) ; 93: (6): 1444-53. doi: 10.1111/j.1471-4159.2005.03131.x. |
[20] | Gasteiger E, Hoogland C. Gattiker A, et al. Protein Identification and Analysis Tools on the ExPASy Server, in Walker JM. The Proteomics Protocols Handbook[M].Totowa NJ: Humana Press, (2005) ; 571-607. |
[21] | Krogh A, Larsson B, von Heijne G, et al. Predicting transmembrane protein topology with a hidden Markov model: application to complete genomes. J Mol Biol. (2001) ; 305: (3): 567-80. doi: 10.1006/jmbi.2000.4315. |
[22] | Almagro Armenteros JJ, Tsirigos KD, Sønderby CK, et al. SignalP 5.0 improves signal peptide predictions using deep neural networks. Nat Biotechnol. (2019) ; 37: (4): 420-423. doi: 10.1038/s41587-019-0036-z. Epub 2019 Feb 18. |
[23] | Blom N, Sicheritz-Pontén T, Gupta R, et al. Prediction of post-translational glycosylation and phosphorylation of proteins from the amino acid sequence. Proteomics. (2004) ; 4: (6): 1633-49. doi: 10.1002/pmic.200300771. |
[24] | Lupas A, Van Dyke M, Stock J. Predicting coiled coils from protein sequences. Science. (1991) ; 252: (5009): 1162-4. doi: 10.1126/science.252.5009.1162. |
[25] | Letunic I, Bork P. 20 years of the SMART protein domain annotation resource. Nucleic Acids Res. (2018) ; 46: (D1): D493-D496. doi: 10.1093/nar/gkx922. |
[26] | Geourjon C, Deléage G. SOPMA: significant improvements in protein secondary structure prediction by consensus prediction from multiple alignments. Comput Appl Biosci. (1995) ; 11: (6): 681-4. doi: 10.1093/bioinformatics/11.6.681. |
[27] | Waterhouse A, Bertoni M, Bienert S, et al. SWISS-MODEL: homology modelling of protein structures and complexes. Nucleic Acids Res. (2018) ; 46: (W1): W296-W303. doi: 10.1093/nar/gky427. |


