
Research on the classification of lymphoma pathological images based on deep residual neural network
Abstract
BACKGROUND:
Malignant lymphoma is a type of tumor that originated from the lymphohematopoietic system, with complex etiology, diverse pathological morphology, and classification. It takes a lot of time and energy for doctors to accurately determine the type of lymphoma by observing pathological images.
OBJECTIVE:
At present, an automatic classification technology is urgently needed to assist doctors in analyzing the type of lymphoma.
METHODS:
In this paper, by comparing the training results of the BP neural network and BP neural network optimized by genetic algorithm (GA-BP), adopts a deep residual neural network model (ResNet-50), with 374 lymphoma pathology images as the experimental data set. After preprocessing the dataset by image flipping, color transformation, and other data enhancement methods, the data set is input into the ResNet-50 network model, and finally classified by the softmax layer.
RESULTS:
The training results showed that the classification accuracy was 98.63%. By comparing the classification effect of GA-BP and BP neural network, the accuracy of the network model proposed in this paper is improved.
CONCLUSIONS:
The network model can provide an objective basis for doctors to diagnose lymphoma types.
1.Introduction
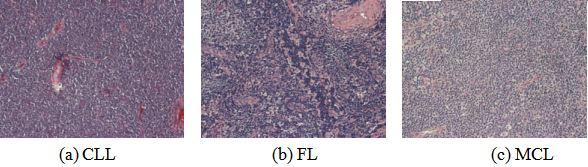
Malignant lymphoma is a disease in which lymphocytes undergo malignant lesions and form malignant tumors, accounting for about 50% of malignant blood diseases [1, 2]. The etiology of malignant lymphoma is complex and its pathological morphology is diverse [3]. Only in the classification standards of the World Health Organization (WHO), there are nearly 100 kinds of known malignant lymphomas [4], among which the most typical ones were chronic lymphocytic leukemia (CLL), follicular lymphoma (FL), and mantle cell lymphoma (MCL). The pathological images are shown in Fig. 1. In recent years, the morbidity and mortality of malignant lymphoma have been on the rise year by year. According to the analysis report on the prevalence of malignant tumor in China by the National Cancer Center in 2015, the mortality rate of malignant lymphoma in China was 2.39 per 100 000 population, accounting for the 10th death number of all malignant tumors, seriously threatening the physical and mental health and life safety of human beings [5]. It is important to determine the type of lymphoma for clinical treatment and prognosis [6, 7].
Figure 1.
Pathological image samples of three types of lymphoma.
The pathological analysis is the “gold standard” for the accurate diagnosis of lymphoma types [8]. Clinicians generally judge lymphoma types by observing Hematoxylin-Eosin (HE) staining pathological section images [9]. However, this method has three disadvantages. First, there is a shortage of professional doctors who read photos and their diagnostic level is uneven, which increases the working pressure of doctors with more images. Second, the long-term observation images easily cause visual fatigue caused by misdiagnosis and missed diagnosis; Third, the diagnostic conclusion is determined by the subjective consciousness of pathologists, and different doctors may have distinct opinions, leading to inconsistent diagnostic results. Therefore, an automatic classification technology is urgently needed to alleviate the above problems.
With the advent of deep learning technology, the method of using a deep neural network to automatically extract and classify lymphoma image features gradually becomes mature. In this paper, the BP neural network model and based on BP neural network and genetic algorithm (GA-BP) optimization were compared. A ResNet-50 based residual network model was used to classify CLL, FL, and MCL lymphoma types, hoping to provide a reference basis for pathologists to correctly determine lymphoma types.
2.Related work
Realized the automatic classification of lymphoma pathological images has important research value for clinical treatment. However, due to the lack of public data sets and the complex characteristics of pathological images, the research progress of automatic classification technology is very difficult. In recent years, researchers have put forward many solutions for the automatic classification of lymphoma pathological images. In the late 1990s, Ruschenburg et al. [10] used the classification tree method in decision trees to classify low-grade Non-Hodgkin lymphoma (NHL) and myoepithelial sialadenitis. In 2010, Orlov et al. [11] used the global features of pathological images to realize the classification of FL, CLL, MCL through the WND-CHARM classifier. In 2011, Zorman et al. [12] realized the classification of lymphoma pathological images with a symbol-based machine learning method. In 2015, Ting et al. [13] proposed an improved SVM classification algorithm for seven types of lymphoma pathological images, which effectively improved the classification accuracy.
In 2019, Guan et al. [14] proposed the application of Inception-V3 network architecture to classify NHL, squamous cell carcinoma, and other pathological images, the overall classification accuracy reached 89.62%. Brousset et al. [15] used different architectures in the convolution neural network (CNN) such as VGGNet and GoogLeNet to distinguish between FL and diffuse large B cell lymphoma (DLBCL), the results showed that a simple CNN model could be used to assist pathologists in the diagnosis of lymphoma. In 2020, Biaosheng et al. [16] proposed the Faster R-CNN method to obtain a higher accuracy of 96% for the recognition and classification of lymphoma pathological images.
To sum up, many scholars have been carried out a lot of research on lymphoma image classification, which laid a theoretical and practical foundation for the study of malignant lymphoma tissue pathological image classification in this paper. With the development of deep learning in the field of image classification [17, 18], researching on automatic classification technology based on deep learning to assist doctors in diagnosis has important application value.
3.Methods
The traditional image classification technology is to extract image features by human and segment image tissues by threshold method to achieve the purpose of assisting doctors in recognition. This method can improve the accuracy of judgment to a certain extent, but still has the defect of subjective judgment by human. With the development of machine learning, using machine learning techniques to extract the feature dimension reduction and classification by BP neural network output can classification results, giving the doctor diagnosed the opinion, but still exist manually to extract the features of the limitations of the method, by manually extracting image features can’t good screen out the most representative, so the classification accuracy cannot meet the clinical application value. The emergence of the CNN in deep learning solves the above problems. This method can automatically extract image features and input them to the output results of the classifier. Moreover, it has good generalization ability and robustness.
The study of CNN originated in the 1980s to 1990s, and the earliest CNN was the Lenet-5 network [19]. Due to the over-fitting phenomenon, network models such as the AlexNet network [20] and the VGG network [21] were gradually generated. Network-level of deepening enhances the accuracy of the model, but followed by the disappearance of the gradient and explosion model convergence.
In 2015, Hekaiming et al. [22] proposed a new network architecture model-Deep residual neural network model (ResNet), which solves the problem of gradient disappearance. Based on this, resnet-50 was selected as the infrastructure to realize the classification of CLL, FL, and MCL lymphoma. The ResNet-50 network model adopts the residual idea, which can not only optimize the number of network layers but also reduce the number of training parameters without affecting the accuracy, which is conducive to the optimization of the network model. The model have 50 layer includes an input layer, four residual blocks, a full connection layer, among them, the four residual blocks contains 48 convolution layer. To solve the problem of small data sets and prevent overfitting, in this paper, the data enhancement method of image transformation is used to process the image and then input to the ResNet-50 network for training and testing. The algorithm process diagram is shown in Fig. 2.
Figure 2.
Algorithm process diagram.
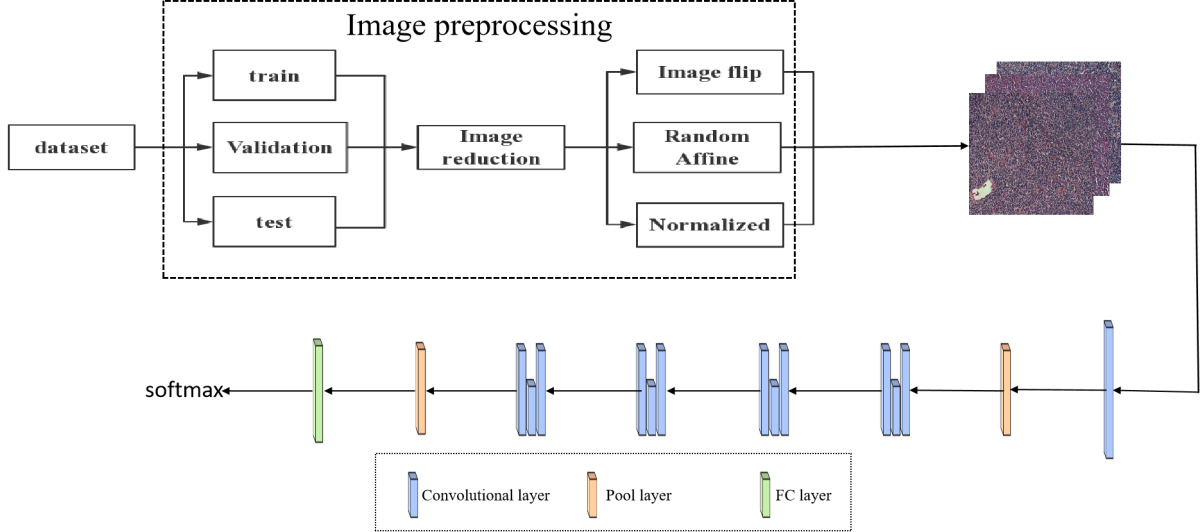
3.1Image preprocessing
In this paper, 374 pathological images were used, including CLL, FL, and MCL lymphoma types. Each image size is 1388
Before the training, the whole data set was randomly divided into a training set, validation set, and test set according to 6:2:2. Among them, the training set is used for model training and learning, the validation set is used for parameter adjustment and model optimization, and the test set is used to test the generalization performance of the model.
To obtain more data on the training set, extract better image features, and prevent the overfitting phenomenon of the model, image preprocessing is usually done before the training.
Image transformation is one of the most basic and direct processing methods in data enhancement. In this paper, the image is enhanced used inversion, affine transformation, and size adjustment. Among them, image flipping and size adjustment are simple operations in a two-dimensional plane, while affine transformation is a linear transformation from a two-dimensional plane to a two-dimensional plane, and its expression is shown in Eq. (1).
(1)
3.2BP neural network
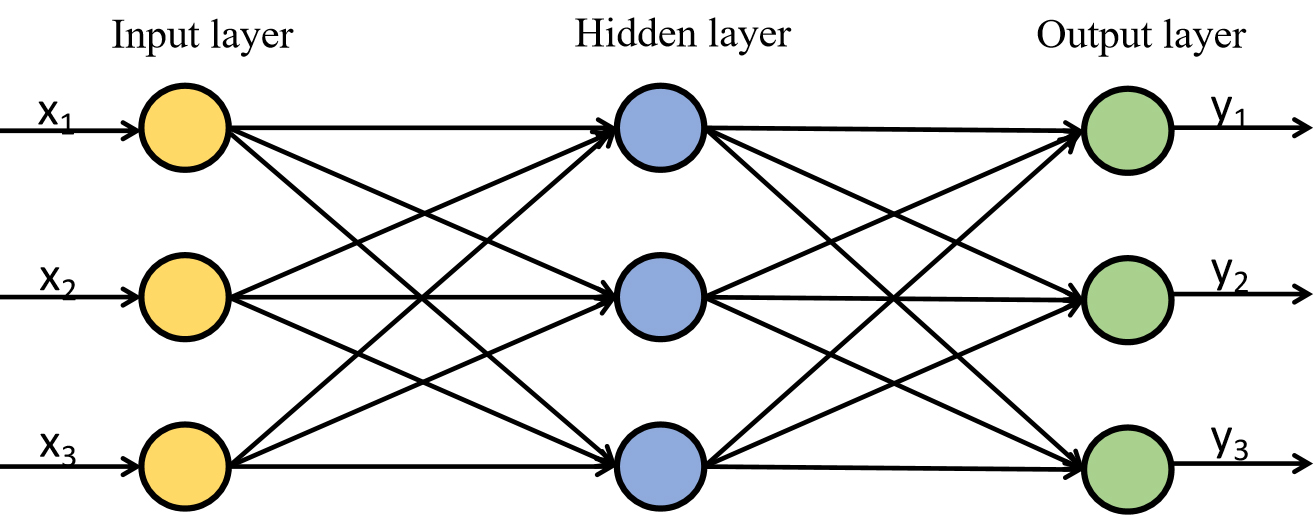
BP neural network was proposed by a group of scientists led by Rumelhart and McCelland in 1986 [23]. The network consists of three layers of the input layer, hidden layer, and output layer. It is a multi-layer feedforward network trained by an error backpropagation algorithm. The network structure is illustrated in Fig. 3.
Figure 3.
BP neural network structure diagram.
3.3GA-BP neural network
As an optimization method of local search, the BP network is often prone to fall into the local extreme value of the problem to be solved when solving the overall extreme value of complex problems, which leads to the decrease of network learning accuracy and ended in failure. Because a genetic algorithm (GA) has a global search, and can deal with more than one individual in the group at the same time. Therefore, the GA-BP network is proposed, which is composed of BP neural network structure, genetic algorithm optimization, and BP neural network prediction. By improving network weight and updating bias parameters, it can not only effectively improve the output accuracy of network prediction, but also reduce the training burden of the network and improve the convergence speed of the BP neural network.
3.4ResNet-50 network
Figure 4.
Residual block structure.
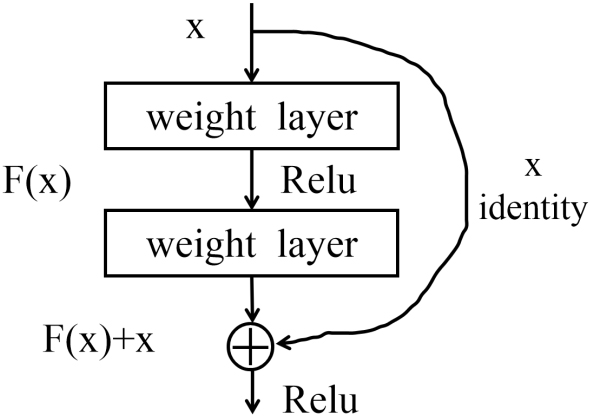
The basic structure of the ResNet-50 network is the residual block unit, and the structure of the residual block is shown in Fig. 4. A basic residual block includes the convolution layer, batch normalization, and ReLU activation function. Assuming that the initial input is
(2)
In the formula, the calculation results are completed jointly by the quick connection and forward propagation, and the quick connection can be established by skipping one or more layers. If you don’t add a shortcut connection,
3.5Network model design
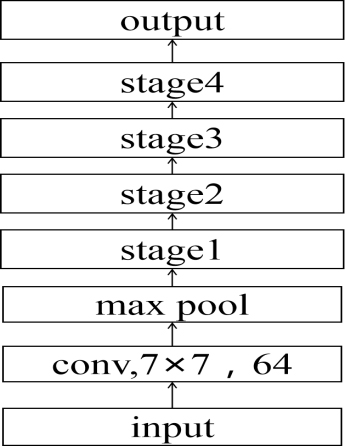
In this paper, the resnet-50 network architecture is adopted to realize lymphoma pathological image classification. As the network architecture is based on residual blocks, the model can extract deeper features to improve accuracy. In the process of ResNet-50 convolution using the ReLu activation function and the cross-entropy function is used to calculate loss value, between each convolution layer and activation function contains a BN layer, applications of BN layers to speed up network training and convergence speed. The network model structure is shown in Fig. 5, and the structure of each module is shown in Table 1. The value of each network parameter is shown in Table 2.
Table 1
Stage structure
| Name | Layers |
|---|---|
| Stage 1 |
|
| Stage 2 |
|
| Stage 3 |
|
| Stage 4 |
|
Table 2
Training parameter values
| Type | Value/type |
|---|---|
| Epoch | 100 |
| Lr | 0.0001 |
| Batch_size | 32 |
| Num_classes | 3 |
| Loss function | Cross Entropy |
Figure 5.
ResNet-50 network architecture.
4.Experimental results
4.1Experimental platform and data set
The experiment was trained in the environment of Intel (R) Xeon (R) Gold 5220 CPU and GeForce RTX 2080 Ti GPU, using the pytorch framework. The programming language is python. The data enhancement algorithm is implemented by pcharm’s transform function. The experimental data in this paper are from the data set published on Kaggle’s official website [11], including three types of lymphoma: CLL, FL, and MCL. A total of 374 images are saved in TIF format.
4.2Results
In this paper, the images are processed and input into the ResNet-50 network for training. Initially, the learning rate is set to 0.0001 and batch_size is 32. By adjusting the parameters to obtain the optimal model, finally, the test set is input into the optimal model for classification.
4.3Comparison and analysis
Table 3
Comparison of lymphoma pathological image classification based on different architectures
| Model | Input size | Accuracy |
|---|---|---|
| BP | 512 | 96% |
| GA-BP | 512 | 97.7% |
| ResNet-50 | 512 | 98.63% |
To test and evaluate the performance of the ResNet-50 network, BP neural network, and GA-BP neural network were selected as comparison models to experiment on the same data set. Taking the accuracy rate (ACC) as the test index, the calculation formula is shown in Eq. (3), and the experimental results are shown in Table 3. Among them, TP stands for true positive, the number of positive samples that are predicted to be positive; TN is a true negative, the number of negative samples that are predicted to be negative; FP is a false positive, the number of negative samples that are predicted to be positive; FN is a false negative example, the number of negative examples predicted by positive samples. In this paper, each class represents its own positive sample, and the remaining classes represent negative samples.
(3)
As the experimental results in this paper are multi-classified, the average accuracy rate is adopted as the final evaluation index.
As can be seen from Table 3, the accuracy of the ResNet-50 network is significantly higher than the BP neural network and GA-BP neural network in the lymphoma pathological images data set, with a better classification effect. A paired
Table 4
Paired
| Model | ||
|---|---|---|
| BP | 8.281 | |
| GA-BP | 7.800 |
5.Discussion
CLL, FL, and MCL are common types of malignant lymphoma with highly heterogeneous pathological morphology. It is of great significance to correctly identify the three types of lymphoma in terms of clinical treatment and prognosis. CLL [24] is a clonal proliferation disease of B lymphocytes, which is composed of small lymphocytes similar to normal lymphocytes. FL [25] is derived from B cells in the follicular germinal center, which is characterized by follicular growth of small and large lymphocytes. MCL [26] is a kind of tumor formed by the translocation of the landmark chromosome t(11:14) leading to the overexpression of cyclin that promotes cell proliferation, the tumor cell is composed of small and medium-sized B lymphocytes which are similar to central cells in morphology, and the nucleus usually presents irregular deformation. It can be seen that the histopathological images of the three types of malignant lymphoma show differences in morphological, textural and other characteristics, the deep learning method can be used to realize the classification of lymphoma.
In recent years, deep learning technology has made a lot of progress in lymphoma classification, but there are still have some difficulties hindering the further development of the research. Firstly, lymphoma has few public data sets, and most studies are conducted on private data sets, making it difficult to compare its technologies. Secondly, the magnitude of the data set is small. Compared with traditional classification methods, deep learning needs enough data support. Only when the data set is large enough can it show the technical advantages of deep learning. Thirdly, the pathological morphology of lymphoma is complex and diverse, and there are multiple diseases crossing phenomenon in the actual clinical diagnosis, which increased the difficulty of lymphoma classification. In view of the above problems, it is necessary to improve on the basis of pursuing technology in the future.
With the development of artificial intelligence, more and more powerful deep learning algorithms will be proposed, which can provide strong support for further research on the automatic classification of lymphoma histopathological images.
6.Conclusion
In this paper, image transformation technology was used to preprocess the data set, and deep learning technology was used to realize the classification of lymphoma pathological images under the ResNet-50 network model. Compared with BP neural network and GA-BP neural network, the classification results were significantly improved, which can provide references basis for doctors to determine the type of lymphoma in clinical practice. While this article using ResNet-50 network can achieve better classification accuracy, but it is only on CLL, FL, MCL classification of three types of lymphoma, and it is still difficult to classify the histopathological images of some lymphoma with similar morphology but different treatment regiments and prognosis. Later still need to add other types of lymphoma pathological image classification recognition, to increase the persuasive
Acknowledgments
This research was supported by the National Key R&D Program of China (Grant No. 2019YF-C0119700), the National Natural Science Foundation of China (Grant No. 61872225), and the Shandong Province Key R&D Project (Grant No. 2017GGX10139).
Conflict of interest
None to report.
References
[1] | Wang QS, Wang LY, W P. Analysis of survival and prognostic factors in patients with malignant lymphoma after autologous hematopoietic stem cell transplantation[J]. The Practical Journal of Cancer. (2020) ; 35: (5): 756-759. |
[2] | Zeng Y, Liu Y. Prognosis of patients with malignant lymphoma treated by autologous hematopoietic stem cell transplantation. Laboratory Medicine and Clinical. (2020) ; 17: (9): 1205-1208. |
[3] | Lu DY, Liu JF, Xiao XL, et al. Study on the ICD-10 coding for malignant lymphoma. Chinese Medical Record. (2018) ; 19: (08): 34-36. |
[4] | Swerdlow SH, Cook JR. As the world turns, evolving lymphoma classifications – past, present and future. Human Pathology. (2019) ; 95: : 55-77. doi: 10.1016/j.humpath.2019.08.019. |
[5] | Zheng RS, Sun KX, Zhang SW, et al. Report of cancer epidemiology in China, 2015. Chinese Journal of Oncology. 2019(1); 19-28. |
[6] | Hu J, Xu J, Yu M, et al. An integrated prognosis model of pharmacogenomic gene signature and clinical information for diffuse large B-cell lymphoma patients following CHOP-like chemotherapy. Journal of Translational Medicine. (2020) ; 18: (6769): 265-276. doi: 10.1186/s12967-020-02311-1. |
[7] | Makita S, Maruyama D, Maeshima AM, et al. A comparison of clinical staging using the Lugano versus Ann Arbor classifications in Japanese patients with Hodgkin lymphoma. Asia-Pacific Journal of Clinical Oncology. (2019) ; 16: (3): 108-114. doi: 10.1111/ajco.13248. |
[8] | Chatani S, Hasegawa T, Kato S, et al. Image-guided core needle biopsy in the diagnosis of malignant lymphoma: comparison with surgical excision biopsy. European Journal of Radiology. (2020) ; 127. doi: 10.1016/j.ejrad.2020.108990. |
[9] | Jin L, Shi F, Chun Q, et al. Artificial Intelligence Neuropathologist for Glioma Classification using Deep Learning on Hematoxylin and Eosin StainedSlide images and Molecular Markers. Neuro-Oncology. (2020) . doi: 10.1093/neuonc/. |
[10] | Ruschenburg I, Kneitz S, Brinck U, et al. Myoepithelial sialadenitis versus low-grade non-Hodgkin’s lymphoma of the salivary gland in FNAB: is discrimination by means of an image processing system possible? In vivo (Athens, Greece). (1999) ; 13: (6): 515-518. |
[11] | Orlov NV, Chen WW, Eckley DM, et al. Automatic classification of lymphoma images with transform-based global features. IEEE Transactions on Information Technology in Biomedicine. (2010) ; 14: (4): 1003-1013. doi: 10.1109/TITB.2010.2050695. |
[12] | Zorman M, Sánchez de la Rosa JL, Dinevski D. Classification of follicular lymphoma images: a holistic approach with symbol-based machine learning methods. Wiener Klinische Wochenschrift. (2011) ; 123: (23–24): 700-709. doi: 10.1007/s00508-011-0091-z. |
[13] | Yan T, Liu Q, Wei Q, et al. Classification of lymphoma cell image based on improved SVM. Lecture Notes in Electrical Engineering. (2015) ; 332: : 199-208. doi: 10.1007/978-3-662-45657-6_21. |
[14] | Guan Q, Wan XC, Lu HT, et al. Deep convolutional neural network Inception-v3 model for differential diagnosing of lymph node in cytological images: a pilot study. Annals of Translational Medicine. (2019) ; 7: (14). doi: 10.21037/atm.2019.06.29. |
[15] | Brousset P, Syrykh C, Abreu A, et al. Diagnosis and classification assistance from lymphoma microscopic images using deep learning. Hematological Oncology. (2019) ; 37: : 138-138. doi: 10.1002/hon.97_2629. |
[16] | Sheng BS, Zhou M, Hu MH, et al. A blood cell dataset for lymphoma classification using faster R-CNN. Biotechnology & Biotechnological Equipment. (2020) ; 34: (1): 413-420. doi: 10.1080/13102818.2020.1765871. |
[17] | Al-Sarayreh M, Reis M, Yan WQ, et al. Potential of deep learning and snapshot hyperspectral imaging for classification of species in meat. Food Control. (2020) ; 117: : 46-61. doi: 10.1016/j.foodcont.2020.107332. |
[18] | Mahbod A, Schaefer G, Wang CL, et al. Transfer learning using a multi-scale and multi-network ensemble for skin lesion classification. Computer Methods and Programs in Biomedicine. (2020) ; 193. doi: 10.1016/j.cmpb.2020.105475. |
[19] | Yann LC, Yoshua B. Convolutional networks for images, speech, and time series. The handbook of brain theory and neural networks. Cambridge: MIT Press, (1998) . |
[20] | Krizhevsky A, Sutskever I, Hinton GE. ImageNet classification with deep convolutional neural networks. Communications of the ACM. (2017) ; 60: (6): 84-90. doi: 10.1145/3065386. |
[21] | Simonyan K, Zisserman A. Very Deep Convolutional Networks for Large-Scale Image Recognition. Computer ence. (2014) ; 1409. |
[22] | He K, Zhang X, Ren S, et al. Deep Residual Learning for Image Recognition. IEEE Conference on Computer Vision & Pattern Recognition. IEEE Computer Society. (2016) . doi: 10.1109/CVPR.2016.90. |
[23] | Tian HR, Wang PX, Kevin T, et al. An IPSO-BP neural network for estimating wheat yi-eld using two remotely sensed variables in the Guanzhong Plain, PR China. Computers and Electronics in Agriculture. (2020) ; 169. doi: 10.1016/j.compag.2019.105180. |
[24] | Corbingi A, Innocenti I, Tomasso A, et al. Monoclonal gammopathy and serum immunogl-obulin levels as prognostic factors in chronic lymphocytic leukaemia. British Journal of Haema-tology. (2020) ; 190: (6): 901-908. doi: 10.1111/bjh.16975. |
[25] | Lipof JJ, Barr PM. Early progression of follicular lymphoma: biology and treatment. Hematology/oncology Clinics of North America. (2020) ; 34: (4): 757-769. doi: 10.1016/j.hoc.2020.02.009. |
[26] | Tessoulin B, Bouabdallah K, Burroni B, et al. Safety and efficacy of temsirolimus in combination with three different immuno-chemotherapy regimens in relapse and refractory mantle cell lymphoma, final results of the T3 phase IB trial of the LYSA. Annals of Hematology. (2020) ; 99: (8): 1771-1778. doi: 10.1007/s00277-020-04159-3. |


