
Establishment of a personalized fetal growth curve model
Abstract
BACKGROUND:
Fetal weight is one of the important indicators for judging whether fetal growth and development are normal. Fetal weight exceeding the normal range may lead to poor delivery outcomes.
OBJECTIVE:
We aimed to establish a personalized fetal growth curve in order to effectively monitor fetal growth during pregnancy. Fetal weight can be monitored while fetal growth and development are assessed.
METHODS:
This study retrospectively analyzed the birth weight and ultrasound database of 3,093 newborns delivered at normal term. The personalized fetal growth curve model was generated based on the birth weight formula established by Gardosi combined with the proportional weight equation.
RESULTS:
(1) The average birth weight of the single fetus at normal term was 3,457g. (2) According to the regression results of the proportion of fetal weight in full-term pregnancy and gestational week, the proportional weight equation is Weight%
CONCLUSIONS:
In this study, the normal birth weight of newborns and normal range of fetal weight can be estimated by using the personalized fetal growth curve model.
1.Introduction
Fetal weight is one of the important indexes to judge whether fetal growth and development is normal or not. If a fetus is underweight and malnourished during pregnancy, it will become less resistant to infectious and parasitic diseases after birth [1]. Conversely, it can lead to obstructing labor and stillbirth. Therefore, fetal weight monitoring plays a guide role in fetal growth and the mode of delivery of pregnant women in the third trimester of pregnancy.
Small for gestational age (SGA) refers to a fetus whose weight or abdominal circumference estimated by ultrasound is below the 10th percentile of the fetus of the same gestational age, while large for gestational age (LGA) refers to fetal whose weight or abdominal circumference estimated by ultrasound is higher than the 90th percentile of the fetus of the same gestational age [2].
In the international community, WHO and INTERGROWTH-21st projects have established uncustomized fetal growth curves [3, 4]. The NICHD project established a customized fetal growth curve based on pregnant women in 12 medical centers in the United States [5]. However, the fetal growth curve was not established only for the Chinese population, and some methods over diagnosed SGA fetus in China. Therefore, the fetal growth curve of other countries cannot be used to monitor fetal growth in China. In the past decade in China, there have been semi-customized growth curves based on Chinese population and customized growth curves for fetuses in southern China, but there is a lack of customized growth curves for pregnant women of different sizes [6, 7].
In 1994, Gardosi [8] studied the birth weight of newborns in Nottingham, UK, and the results showed that factors significantly affecting the birth weight of newborns included gestational age, fetal sex, weight of the first diagnosis of the pregnant woman, height of the pregnant woman, race and birth number. Gardosi also used Hadlock’s formula [9] to represent the relationship between normal fetal weight and gestational age, and converted it into a function of the percentage of fetal weight during pregnancy and fetal weight at term and gestational age. This study used Gardosi’s [8] estimation of the neonatal birth weight formula (TOW) as the foundation, combined with the normal proportional weight equation (Weight%) and fetal weight range that was obtained from the analysis of fetal birth weight and B ultrasound data during pregnancy of normal pregnant women in the People’s Hospital. Finally, the fetal personalized growth curve model was obtained as shown in Eq. (1). EFW is estimated fetal weight at 22–40 weeks (in g).
(1)
2.Methods
2.1Statistical analysis
SPSS for Windows 23.0 was used for statistical analysis of all data. Independent sample
Python was used to establish the formula of the proportional weight equation. The least square method was used to estimate the parameters of the regression model from the angle of error fitting. Polynomial fitting regression method is selected in this study.
Table 1
Mean parameters and standard deviation of normal pregnant women and fetuses
| Mean newborn weight (g) | Mean height (cm) | Mean delivery days (days) | Mean weight of pregnant women before pregnancy (g) |
|---|---|---|---|
| 3350.7 | 162.7 | 276.6 | 65.1 |
Notes: Data are given as mean
2.2Study population
In this study, 3,093 normal pregnant women without pathological factors who gave birth at the People’s Hospital from April l, 2014 to December 31, 2019 were selected for analysis. The recorded information of pregnant women included: ultrasound results at 22–40 weeks of pregnancy: Date, head circumference, abdominal circumference, gestational week of fetal delivery, sex of the fetal and newborn’s birth weight, etc. Data from pregnant women who deliver at term (37–42 weeks of gestation) were analyzed. The mean and standard deviation of their height, pre-pregnancy weight, days of delivery, and neonatal weight were taken as outlined below. The results are shown in Table 1.
2.3Formula for estimating birth weight
In this study, the formula of neonatal estimated birth weight studied by Gardosi [8] was used as the basis for studying the personalized fetal weight growth curve in China. The formula is as follows:
(2)
TOW was 40 weeks (280 days) of Term Optimal Weight (in g). C is the average birth weight of the population of 3478.4 g, which is a constant term.
The gtao is the adjusted value of gestation week: gtao
The stao is the adjusted value of pregnant women’s gender: When sex
The wtao is the adjusted value of pregnant women’s weight: wtao
The htao is the adjusted value of pregnant women’s height: htao
The ptao is the adjusted value of pregnant women’s parity:
2.4Proportional weight equation
The INTERGROWTH-21st standards developed by the University of Oxford in the UK fully matches the child growth standards of the World Health Organization [9]. A database of ultrasound information during pregnancy was analyzed for 3,093 single pregnancies. The latest fetal weight estimation Eq. (3) published by INTERGROWTH-21st was used to estimate the actual intrauterine weight of fetuses at different gestational weeks [4]. The average intrauterine weight and the actual average birth weight of the fetus were classified according to the gestational age. The mean fetal weight between 22 and 41 weeks of gestation were obtained.
(3)
HC is the uterine height of the pregnant woman, AC is the abdominal circumference, and EFW is the fetal weight.
In 1994, Gardosi obtained the fetal weight of each gestational week according to Hadlock’s formula [10]. According to Hadlock’s formula, the formula model of normal proportional weight equation was established:
(4)
Among them, Weight% refers to the percentage of fetal weight from 22 to 41 weeks of pregnancy relative to full-term fetus. GA is gestational week. a, b, c and d are coefficients.
By dividing the fetal weight predicted by Eq. (4) by the weight at 280 days and fitting the cubic polynomial of gestational age, the polynomial formula of the ratio of Y
The optimal range for determining the normal proportional weight equation can be determined by monitoring fetal weight to determine whether the fetus is smaller or larger than gestational age. According to the mean value and SD of fetal weight in polynomial model, Eq. (5) can be used to calculate the percentile weight required for any given gestational age [11]:
(5)
K is the corresponding percentile for Gaussian distribution. Mean is the mean value of the ideal birth weight of the fetus in the population, and SD is the standard deviation of the ideal birth weight of the fetus in the population. The percentiles for 10% and 90% need K
3.Results
3.1The regression coefficient of proportional weight equation
According to the ultrasound data of pregnant women mainly concentrated from 22 to 37 weeks, the fetal weight of different gestational weeks was obtained by using Eq. (3). The mean and standard deviation of the fetal weight of pregnant women from 22 to 41 weeks were obtained by combining the birth weight of newborns concentrated from 38 to 41 weeks according to the classification of gestational weeks.
The ideal fetal weight at 40 weeks was TOW
Figure 1.
The curve of fetal weight as a percentage of full-term weight over gestational age.
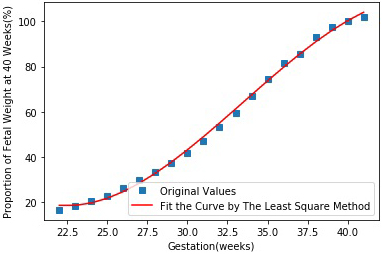
Curve fitting analysis of y
Table 2
Curve fitting analysis results of fetal weight ratio changing with gestational age
| Fitting method | Constant a | Coefficient b | Coefficient c | Coefficient d |
| |
|---|---|---|---|---|---|---|
| Polynomial fitting | 500.9 | 1.727 | 98 |
Table 3
Pregnant woman B enters information at the hospital during the second trimester
| Ultrasound gestational age (days) | Last menstrual period gestational age (days) | Maternal height (cm) | Weight at first visit (kg) | Parity |
| 170 | 168 | 165 | 65 | 0 |
According to the results in Table 3, the coefficient of the proportional weight equation was obtained, and Eq. (6) was obtained:
(6)
3.2Determine the range of proportionality of fetal weight growth
The population studied in this paper, the CV of full-term variation is 350.29/3350.7 about 10%. According to Eq. (5), the 90th and 10th percentiles of fetal full-term weight is:
(7)
The normal range of fetal weight was
The relationship between normal fetal weight proportion and gestational age is as follows:
Equation of the 10th centile of fetal weight proportion:
(8)
Equation of the 90th centile of fetal weight proportion:
(9)
3.3Application of personalized fetal growth curve
According to Eqs (2), (6), (8) and (9), an easy-to-operate personalized fetal growth curve model was created. It was assumed that pregnant woman B entered information at (24
Table 4
Output information of personalized fetal growth curve model
| Revised weight (g) | Estimation of neonatal birth weight (g) | The optimal range of expected fetal weight (g) |
|---|---|---|
| 67.6 | 3546 | 3085 |
As shown in Table 3, the difference between the pregnant women’s ultrasound gestational week and last menstrual period gestational age was (170–168) days, that is, two more days than the 280 days expected for delivery. If a pregnant woman’s weight is 65 kg and height is 165 cm in the second pregnancy, the following information can be displayed through the program, as shown in Table 4.
As shown in Table 4, the estimated birth weight of the newborn was 3546
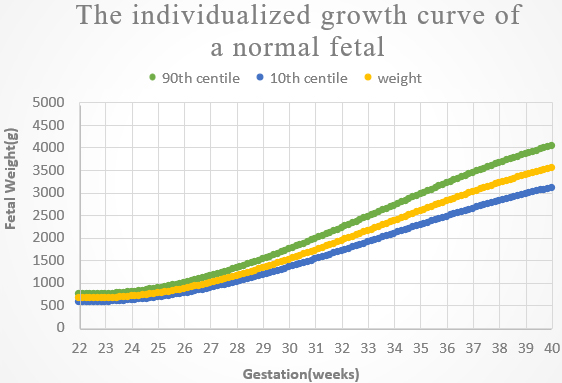
The personalized fetal growth curve of pregnant woman B is shown in Fig. 2 below. The horizontal axis is gestational age and the vertical axis is fetal weight during pregnancy. From the bottom up, customized curves of the 10th, 50th, and 90th percentiles of fetal growth weight with gestational age were presented.
Figure 2.
Schematic diagram of personalized fetal growth curve results of pregnant woman B.
4.Discussion
The personalized fetal growth curve model is obtained by combining the Gardosi estimated formula of normal newborns birth weight with the formula of normal proportional weight equation studied in this paper. This curve has been used to clinical diagnosis in foreign countries. Hadlock’s formula is still embedded in the domestic B-ultrasound instrument, which is not very accurate for the monitoring of fetal growth changes of pregnant women in China in 2020. In this study, a personalized fetal growth curve was established for Chinese pregnant women.
As the average gestational week of actual fetal delivery is about 39 weeks, and the actual average birth weight is 3350 g, which is similar to the estimated average fetal weight of 3369 g based on B-ultrasound at 39 weeks. According to the INTERGROWTH-21st project published in 2014 [12], the fetal full-term birth weight was 3380 g according to the international standard of fetal weight, which was similar to the results of this study. Therefore, it is effective to use the average fetal weight of each gestational week as the basis for studying the proportional weight equation.
The PRB/NICHD Detroit study confirms previous observations that maternal ethnicity, height, weight, and parity and fetal sex are factors affecting birth weight and fetal growth, hence, they should be considered when defining fetal growth potential [13]. Sovio et al. confirmed many previous observations that pregnancies identified as SGA only by a customized growth standard had higher rates of complications than non-SGA pregnancies [14, 15]. The main finding of Sovio’s study in 2020 is that the Hadlock equation and reference provided superior prediction of extremes of birth weight percentile compared with the INTERGROWTH-21st equation and reference [16]. In this study, we used the epidemiological factors of pregnant women to calculate the growth potential of the fetus combined with the formula of proportional fetal weight growth established by Hadlock formula as the original model to obtain the personalized growth curve model, which is of great significance.
5.Conclusions
The establishment of personalized fetal growth curve model is the most valuable result of clinical application in this study. In 22 weeks of pregnancy, doctors can input their height, weight at first visit, parity, gestation factors in model, and the customized fetal growth curve as a standard for evaluating the growth and development of the fetus. Fetal weight is normal between the 10th and 90th percentile curve. If outside the normal range, that is defined as SGA or LGA. Appropriate criteria for assessing fetal growth and birth weight are essential for good clinical care, and with increasing evidence that adverse outcomes associated with fetal growth may be avoided.
Acknowledgments
This research was supported by National Key R&D Program of China (2019YFC0119700), Bill & Melinda Gates Foundation (OPP1148910), Beijing International Science and Technology Cooperation Base for Intelligent Physiological Measurement and Clinical Transformation.
Conflict of interest
None to report.
References
[1] | Chai J. A Brief Analysis of the significance of B-ultrasound data in pregnancy for the prediction of fetal weight. Family Psychologist, 2014(10): 465. |
[2] | Fetal Medicine Group, Perinatal Medicine Branch of Chinese Medical Association, obstetrics Group, Obstetrics Branch of Chinese Medical Association. Expert Consensus on fetal growth restriction (2019 edition). doi: 10.3760/cma.j.issn.1007-9408.2019.06.001. |
[3] | Villar J, Ismail LC, Victora CG, et al. International standards for newborn weight, length, and head circumference by gestational age and sex: the newborn cross-sectional study of the INTERGROWTH-21st project. The Lancet, (2014) , 384: (9946): 857–868. |
[4] | Stirnemann J, Villar J, Salomon LJ, et al. International estimated fetal weight standards of the INTERGROWTH-21st project. Ultrasound Obstet Gynecol, (2017) , 49: (4): 478–486. |
[5] | Buck Louis GM, Grewal J, Albert PS, et al. Racial/ethnic standards for fetal growth: the NICHD fetal growth studies. American Journal of Obstetrics and Gynecology, (2015) , 213: (4): 449.e1–449.e41. |
[6] | Mikolajczyk RT, Zhang J, Betran AP, et al. A global reference for fetal-weight and birth-weight percentiles. Obstetric Anesthesia Digest, (2012) , 32: (2): 131. |
[7] | Cheng YKY, Lu J, Leung TY, et al. Prospective assessment of INTERGROWTH-2lst and World Health Organization estimated fetal weight reference curves. UItrasound Obstet Gynecol, (2018) , 51: (6): 792–798. doi: 10.1002/uog.17514. |
[8] | Gardosi JO, Mongelli M, Wilcox M, et al. An adjustable fetal weight standard. Ultrasound in Obstetrics and Gynecology, (1995) , 6: (3): 168–174. |
[9] | Papageorghiou AT, Kennedy SH, Salomon LJ, et al. The INTERGROWTH-21st, fetal growth standards: toward the global integration of pregnancy and pediatric care. American Journal of Obstetrics and Gynecology, (2018) , 218: (2): S630–S640. |
[10] | Hadlock FP, Harrist RB, Martinez-Poyer J. In utero analysis of fetal growth: a sonographic weight standard. Radiology, (1991) , 181: (1): 129–133. |
[11] | Salomon LJ, Bernard JP, Ville Y. Estimation of fetal weight: reference range at 20–36 weeks’ gestation and comparison with actual birth-weight reference range. Ultrasound in Obstetrics and Gynecology, (2007) , 29. |
[12] | Villar, José, Ismail LC, Victora CG, et al. International standards for newborn weight, length, and head circumference by gestational age and sex: the newborn cross-sectional study of the INTERGROWTH-21st project. The Lancet, (2014) , 384: (9946): 857–868. |
[13] | Tarca AL, Romero R, Gudicha DW, et al. A new customized fetal growth standard for African American women: the PRB/NICHD detroit study. American Journal of Obstetrics and Gynecology, (2018) , 218: (2): S679–S691.e4. |
[14] | Sovio U, Smith GCS. The effect of customization and use of a fetal growth standard on the association between birthweight percentile and adverse perinatal outcome. American Journal of Obstetrics & Gynecology, (2018) : S0002937817323281. |
[15] | Anderson NH, Sadler LC, Mckinlay CJD, et al. INTERGROWTH-21st vs customized birthweight standards foridentification of perinatal mortality and morbidity. American Journal of Obstetrics & Gynecology, (2016) , 214: (4): 509.e1–509.e7. |
[16] | Sovio U, Smith GCS. Comparison of estimated fetal weight percentiles near term for predicting extremes of birth weight percentile. American Journal of Obstetrics and Gynecology, (2020) . |


