
Prediction and follow-up of risk factors for severe SARS-CoV-2 pneumonia and application of CT visual scoring
Abstract
BACKGROUND:
The SARS-CoV-2 pneumonia infection is associated with high rates of hospitalization and mortality and this has placed healthcare systems under strain. Our study provides a novel method for the progress prediction, clinical treatment and prognosis of NCP, and has important clinical value for timely treatment of severe NCP patients.
OBJECTIVE:
To summarize the clinical features and severe illness risk factors of the patients with novel coronavirus pneumonia (NCP), in order to provide support for the progression prediction, clinical treatment and prognosis of NCP patients.
MATERIALS AND METHODS:
A total of 196 NCP patients treated in our hospital from January 25, 2020 to June 21, 2020 were divided into the severe group and the mild group. The clinical features of the two groups were analyzed and compared. The risk factors were explored by using multivariate logistic regression, and the receiver operating characteristic (ROC) curve was obtained. The correlations of the risk factors with the prognosis of NCP were investigated combined with the lung function test.
RESULTS:
The primary clinical symptoms of 196 cases of NCP included fever in 167 cases (85.2%) and cough in 121 cases (61.73%). The chest computed tomography (CT) scans of the 178 cases (90.81%) showed a typical ground-glass opacification. In 149 cases, the lymphocyte count was decreased, while the levels of creatine kinase (CK), lactate dehydrogenase (LDH), c-reactive protein (CRP), erythrocyte sedimentation rate (ESR) and D-dimer (D-D) increased. 44 cases (22.45%) were found to be severely ill. The multivariate logistic regression analysis demonstrated that age, underlying disease, length of hospital stay, body mass index (BMI), LDH, chest CT visual score, absolute lymphocyte count (ALC) and CRP were risk factors for severe
| illness. The most valuable indicator for the prediction of severe NCP was the chest CT visual score. With a CT visual score of |
|
The primary symptoms of NCP were fever and dry cough, followed by a rapid disease progression. The chest CT visual score was found to exhibit a key role in the prediction of severe illness and prognosis, and served as an early warning indicator of severe NCP. The CT visual score opens up a new window for pre-critical research of NCP. |
| Keywords: Novel coronavirus, COVID-19, pneumonia, CT visual scoring, risk factors, prognosis |
1.Introduction
Since a large-scale pneumonia outbreak of unknown etiology in Wuhan, China in December 2019, the Wuhan Institute of Virology, Chinese Academy of Sciences successfully isolated a new type of coronavirus from the culture of secretions of novel coronavirus pneumonia (NCP) patients and identified its genome sequence on January 7, 2020. The sequence of this virus is homologous to the severe acute respiratory syndrome (SARS) and Middle East respiratory syndrome (MERS). The virus has a round or elliptic envelope, often pleomorphic form, with a diameter of 60–140 nm [1, 2, 3]. On February 11, 2020 the World Health Organization (WHO) named it SARS-CoV-2. The virus caused multiple system infections in various animal species, and mainly respiratory infections in humans. The NCP caused by SARS-CoV-2 is highly contagious, and it has spread rapidly to 212 countries including the United States, Brazil, and Italy. Currently, the cumulative number of infections runs above 13.5 million, and the death toll is over 600,000. The SARS-CoV-2 quickly triggered the global public health emergencies and has caused a heavy health and economic burden on the world [4, 5].
There have been more than 300 reports reporting the imaging features, clinical features and treatment options of NCP on PubMed. The literature mostly summarized the imaging diagnosis, disease development and clinical outcomes of NCP, and rarely analyzed its risk factors, thus providing limited guidance to clinical treatment [6, 7]. In this pursuit, the present study explored the imaging and clinical data of 196 cases of NCP, and added the CT visual score to multivariate logistic regression for the first time and obtained encouraging research results. We successfully predicted the risk factors for severe NCP, including the length of hospital stay, body mass index (BMI), and chest CT visual score. Finally, in combination with the receiver operating characteristic (ROC) curve, we obtained the cut-off value for the CT visual score, and confirmed that the CT score was negatively correlated with the lung function indicators like forced vital capacity (FVC)%, total lung capacity (TLC)%, and diffusing capacity of lung for carbon monoxide (DLCO)%. Our study provides a novel method for the progress prediction, clinical treatment and prognosis of NCP, and has important clinical value for timely treatment of severe NCP patients.
2.Materials and methods
2.1General information
The clinical, serum biochemical tests and imaging data of 196 subjects of laboratory-confirmed NCP with positive SARS-CoV-2 nucleic acid tested by RT-PCR were collected in our hospital from January 25, 2020 to June 21, 2020. There were 137 cases (69.89%) with positive nucleic acid results for the first round of screening, and 59 cases (30.11%) with positive results for the second or further round. The age range of patients was 19
The clinical diagnosis and classification criteria were made according to the Novel Coronavirus Pneumonia Diagnosis and Treatment Plan (6
2.2Imaging and lung function test
The CT scans were conducted with a Siemens SOMATOM Force 64-slice spiral CT, and the spiral scans were conducted from the apex to the base of the lung, when the patient was asked to hold breath after maximum inspiration. The tube voltage was 120 kV, the tube current was 200 mA, the slice thickness was 5 mm, and the pitch was of 3.0. The image window width was 1000
Table 1
System for scoring the ground-glass opacity, interstitial opacity on thin-section CT scans
| Score | Definition |
|---|---|
| 0 | None |
| 1 | |
| 2 | 5–25% of the lobe |
| 3 | 26–49% of the lobe |
| 4 | 50–75% of the lobe |
| 5 |
The Minato AS-507 spirometer (Japan) was used to measure the following indicators for 192 recovered patients: the percentage of forced expiratory volume in one second to the predicted volume (FEV1.0%), the percentage of forced vital capacity to the predicted value (FVC%), and the percentage of total lung capacity to the predicted value (TLC%), and the percentage of single-breath diffusing capacity to the predicted value (DLCO%).
2.3Statistical analysis
The symmetric distributed measurement data was represented by the mean
3.Results
3.1Primary symptoms
There were 167 cases of fever with a temperature of 37.3–39
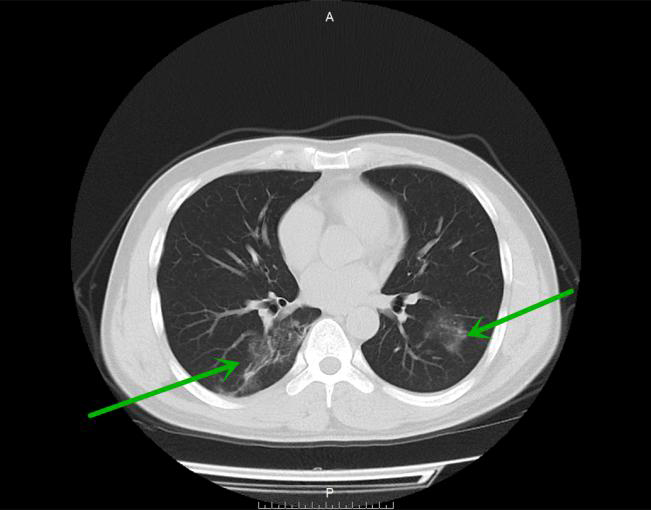
Figure 1.
Bilateral ground glass opacities with fuzzy edge in the lower lobes in a 35-year old woman (mild group).
3.2General clinical data analysis
There were 178 cases (90.81%) with typical multiple patch shadows and ground-glass opacities in the first chest CT scan (Figs 1–3). The NCP laboratory test results were as follows: 30 cases were found to be with reduced white blood cells (WBC) (15.3%), 110 cases with reduced lymphocytes (LY) (55.6%), 80 cases with reduced hemoglobin (40.82%), 51 cases with increased alanine aminotransferase (ALT) (26.02%), 86 cases with increased creatine kinase (CK) (43.88%), 96 cases with increased lactate dehydrogenase (LDH) (48.98%); 141 cases with increased c-reactive protein (CRP) (71.94%), 122 cases with increased erythrocyte sedimentation rate (ESR) (62.24%), and 59 cases with increased procalcitonin (PCT) (30.1%).
Figure 2.
Bilateral patchy infiltrates in the lower lung lobes in a 55-year old man (severe symptom group).
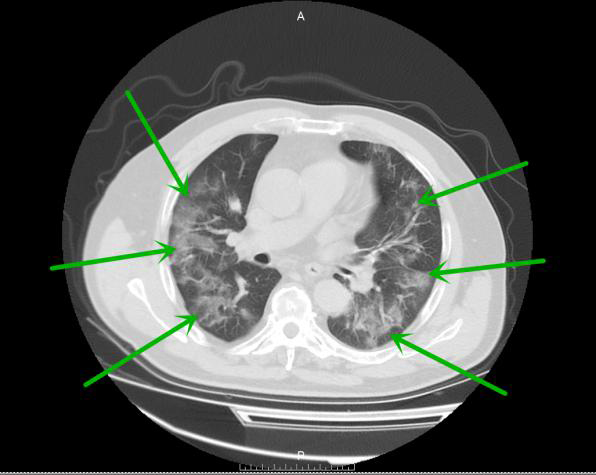
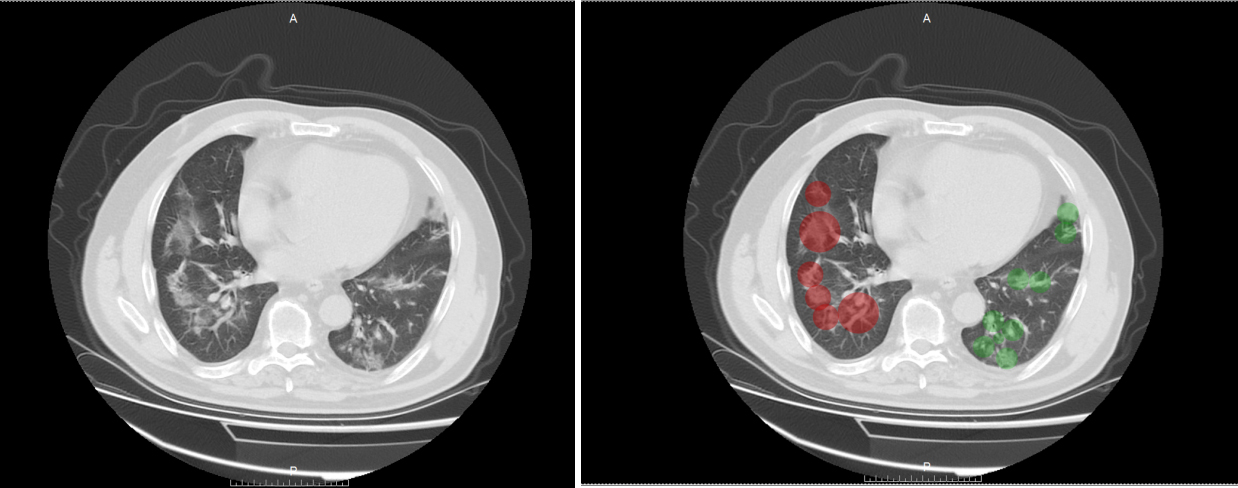
Figure 3.
CT visual score of severe COVID-19 pneumonia.
3.3Clinical data analysis between the severe symptom group and the mild group
There were 44 cases of severe illness and 152 cases of mild illness. There were significant differences in factors like age, gender, combined underlying disease, features of chest CT, WBC, LY, ESR, CRP, albumin, ALT, CK, LDH, and D-dimer (D-D) between these two groups (
Table 2
Clinical data analysis between the severe symptom group and the mild group
| General information | All cases ( | Severe group ( | Mild group ( | t/X | |
|---|---|---|---|---|---|
| Age | 51.7 | 60.18 | 49.24 | ||
| Gender | 5.76 | 0.0164 | |||
| Male | 107 | 31 | 76 | ||
| Female | 89 | 13 | 76 | ||
| BMI | 22.23 | 23.34 | 21.92 | 3.185 | 0.002 |
| First nucleic acid test | 12.81 | ||||
| Positive | 127 | 34 | 71 | ||
| Negative | 69 | 10 | 81 | ||
| Epidemiology | 0.0085 | 0.926 | |||
| Yes | 117 | 26 | 91 | ||
| No | 79 | 18 | 61 | ||
| Smoking history | 2.83 | 0.092 | |||
| Yes | 29 | 10 | 19 | ||
| No | 167 | 34 | 133 | ||
| Underlying disease | 9.916 | 0.00164 | |||
| Yes | 80 | 27 | 53 | ||
| No | 116 | 17 | 99 | ||
| Clinical symptoms | |||||
| Fever | 0.0605 | 0.80569 | |||
| Yes | 167 | 38 | 129 | ||
| No | 6 | 23 | |||
| Cough | 0.485 | 0.317 | |||
| Yes | 121 | 29 | 92 | ||
| No | 75 | 15 | 60 | ||
| Fatigue and myalgia | 0.0794 | 0.778 | |||
| Yes | 59 | 14 | 45 | ||
| No | 137 | 30 | 107 | ||
| Diarrhea | 0.0073 | 0.931 | |||
| Yes | 15 | 3 | 12 | ||
| No | 137 | 41 | 140 | ||
| Anorexia | 0.0832 | 0.773 | |||
| Yes | 20 | 5 | 15 | ||
| No | 176 | 39 | 137 | ||
| Chest CT findings | 4.41 | 0.035 | |||
| No | 18 | 0 | 18 | ||
| Yes | 178 | 44 | 135 | ||
| Laboratory examination | |||||
| WBC | 6.45 | 7.85 | 6.04 | 3.212 | 0.002 |
| LC | 0.72 | 0.49 | 0.78 | ||
| HB | 125.27 | 123.89 | 125.66 | 0.323 | |
| PLT | 169.56 | 177.7 | 167.71 | 1.418 | 0.158 |
| ALB | 37.76 | 35.56 | 38.39 | 0.001 | |
| TB | 8.85 | 9.43 | 8.68 | 1.271 | 0.205 |
| ALT | 30.28 | 39.09 | 27.74 | 3.187 | 0.03 |
| AST | 43.28 | 33.03 | 41.04 | 6.133 | 0.65 |
| CK | 299.49 | 344.18 | 297.16 | 2.072 | 0.04 |
| LDH | 288.71 | 314.75 | 281.17 | 2.412 | 0.019 |
| CRP | 20.54 | 38.01 | 15.48 | 11.563 | |
| Creatinine | 70.01 | 72.18 | 69.38 | 0.97 | 0.33 |
| K | 3.93 | 3.88 | 3.95 | 0.353 | |
| NA | 139.38 | 138.06 | 139.77 | 0.103 | |
| CL | 105.19 | 104.83 | 105.30 | 0.519 | |
| HCO3 | 24.39 | 24.769 | 24.27 | 0.937 | 0.35 |
| ESR | 30.03 | 35.45 | 28.45 | 2.287 | 0.026 |
| PT | 10.38 | 10.56 | 10.33 | 1.184 | 0.238 |
| APTT | 30.82 | 31.73 | 30.56 | 1.275 | 0.204 |
| PCT | 0.78 | 0.074 | 0.079 | 0.768 | |
| D-D | 0.62 | 1.03 | 0.50 | 5.445 |
Note:
Table 3
Analysis of risk factors in the severe symptom group
| Variable quantity | Single-factor regression analysis | Multi-factor regression analysis | ||
|---|---|---|---|---|
| (95% CI) | (95% CI) | |||
| Age | 0.924 (0.893–0.955) | 0.961 (0.778–0.952) | 0.004 | |
| Gender | 0.419 (0.204–0.863) | 0.018 | 3.549 (0.453–27.804) | 0.228 |
| BMI | 0.748 (0.639–0.875) | 0.624 (0.409–0.950) | 0.028 | |
| First nucleic acid test | 0.464 (0.213–1.008) | 0.052 | ||
| Epidemiology | 1.033 (0.522–2.045) | 0.926 | ||
| Smoking history | 0.486 (0.207–1.140) | 0.097 | ||
| Underlying disease | 0.337 (0.169–0.674) | 0.002 | 4.172 (1.271–13.691) | 0.019 |
| Clinical symptoms | ||||
| Fever | 0.886 (0.336–2.333) | 0.806 | ||
| Cough | 0.793 (0.939–1.602) | 0.518 | ||
| Fatigue and myalgia | 0.901 (0.437–1.858) | 0.778 | ||
| Diarrhea | 1.171 (0.315–4.351) | 0.813 | ||
| Anorexia | 0.854 (0.292–2.497) | 0.773 | ||
| Hospital stay | 1.193 (0.944–1.212) | 0.011 | 0.893 (0.902–1.302) | 0.003 |
| Chest CT findings | 2.170 (2.831–3.452) | 1.005 (0.673–1.143) | 0.002 | |
| Laboratory examination | ||||
| WBC | 0.722 (0.64–0.816) | 0.001 | 1.25 (0.883–1.770) | 0.208 |
| LC | 5.739 (43.26–260.18) | 8.901 (2.352–33.693) | 0.002 | |
| HB | 1.018 (0.983–1.053) | 0.32 | ||
| PLT | 0.995 (0.987–1.002) | 0.159 | ||
| ALB | 1.091 (1.021–1.166) | 0.01 | 1.017 (0.871–1.1188) | 0.828 |
| TB | 1.223 (0.928–1.033) | 0.189 | ||
| ALT | 0.953 (0.931–0.976) | 0.003 | 0.984 (0.925–1.047) | 0.606 |
| AST | 0.986 (0.959–1.013) | 0.314 | ||
| CK | 0.997 (0.994–1.000) | 0.029 | 0.996 (0.987–1.004) | 0.298 |
| LDH | 0.993 (0.988–0.998) | 0.007 | 1.007 (0.901–1.018) | 0.026 |
| CRP | 0.201 (0.111–0.362) | 0.001 | 0.866 (0.790–0.948) | 0.002 |
| Creatinine | 0.955 (0.782–1.166) | 0.651 | ||
| K | 1.441 (0.663–3.11) | 0.352 | ||
| NA | 1.043 (0.991–1.098) | 0.108 | ||
| CL | 1.026 (0.950–1.107) | 0.519 | ||
| HCO3 | 0.949 (0.849–1.059) | 0.349 | ||
| ESR | 0.967 (0.945–0.990) | 0.004 | 0.974 (0.919–1.032) | 0.370 |
| PT | 0.847 (0.642–1.117) | 0.24 | ||
| APTT | 0.960 (0.901–1.023) | 0.204 | ||
| PCT | 1.953 (0.023–166.598) | 0.768 | ||
| D-D | 0.979 (0.959–0.999) | 0.039 | 0.536 (0.138–2.081) | 0.368 |
| CT visual score | 0.997 (0.994–1.000) | 0.029 | 0.996 (0.987–1.004) | 0.298 |
| TGGO | 0.993 (0.988–0.998) | 0.007 | 1.007 (0.901–1.018) | 0.265 |
| IOF | 1.043 (0.991–1.098) | 0.108 | ||
Note:
3.4Analysis of risk factors for severe illness
The univariate analysis indicated that age, gender, BMI, combined underlying diseases, chest CT features, CT visual score, WBC, absolute lymphocyte count (ALC), albumin, ALT, CK, LDH, CRP, ESR and D-D were the risk factors of severe illness. The multivariate logistic regression analysis revealed that age, underlying disease, length of hospital stay, BMI, LDH, chest CT visual score, ALC, and CRP were risk factors for severe illness (Table 3). The ROC curve demonstrated that the chest CT visual score was the most valuable indicator for predicting severe illness. With a CT visual score of
Table 4
Results of ROC curve of clinical imaging parameters in the severe symptom group
| Indexes | Area under curve | Critical value | Sensitivity (%) | Specificity (%) |
|---|---|---|---|---|
| CT visual score | 0.912 | 8.97 | 93.22 | 71.53 |
| TGGO | 0.892 | 3.591 | 86.90 | 53.10 |
| Chest CT findings | 0.772 | 2.155 | 85.10 | 35.60 |
| CRP | 0.622 | 3.625 | 78.10 | 38.10 |
| LC | 0.552 | 1.445 | 50.60 | 71.20 |
| Underlying disease | 0.432 | 0.745 | 53.80 | 64.50 |
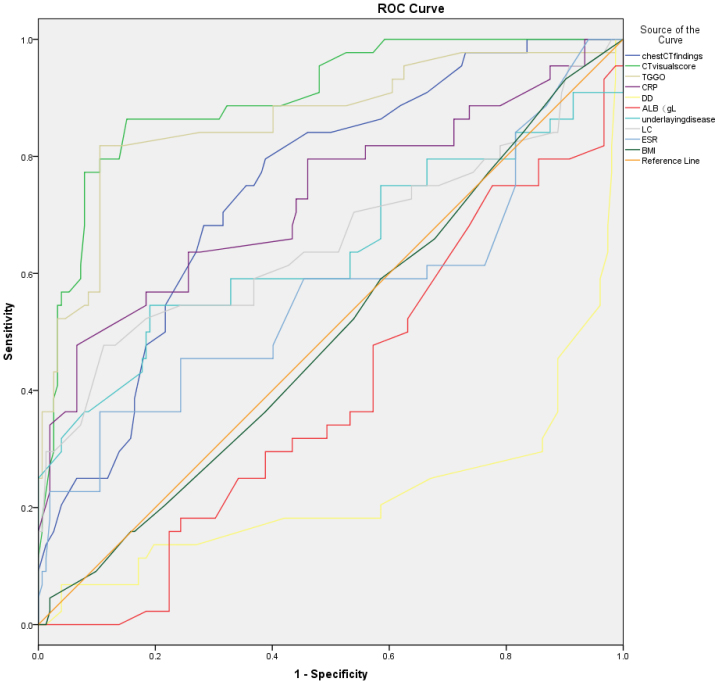
Figure 4.
Results of the ROC curve of the risk factors of the Severe SARS-CoV-2 Pneumonia; The results of this study also show that “CT visual score” is the largest area under the ROC curve of the prognosis of pneumonia, and its diagnostic value of predicting EA fetus is the highest. The sensitivity was 93.22% and the specificity was 71.53%.
3.5Follow-up of recovered patients
We followed up 192 recovered patients for 1
Table 5
Correlation between the CT visual score and FVC%, TLC%, DLCO% (correlation coefficent: r)
| FVC% | TLC% | DLCO% | |
|---|---|---|---|
| TGGO | |||
| IOF | |||
| CT visual score |
4.Discussion
SARS-CoV-2 is a novel coronavirus of the
Among the 196 cases of NCP in this study, there were 107 males and 89 females (1.2:1). The ratio of male to female, BMI, and age of the severe group were greater than those of the mild group (31 vs. 13, 23.34
The CT results of 178 cases (90.82%) of NCP were positive, therefore, the chest CT was highly sensitive to SARS-Cov-2 pneumonia [21, 22]. In addition, we newly introduced a CT visual scoring mechanism to evaluate the progress of disease and obtain good results. At the same time, multivariate analysis confirmed that CT score was an important parameter related to the prognosis of NCP. The CT signs of NCP are ground-glass opacifications and interstitial shadows (including interlobular septal thickening, subpleural curvilinear shadow, and irregular cords). Nevertheless, the lung fiber cord shadows, interlobular septal thickening, subpleural curvilinear shadow generally do not appear alone, but on the top of ground-glass opacifications. The ground-glass opacifications in the mild group were gradually absorbed and became lighter, especially for those with lesions involving less than two lung lobes, lung segments and low-density lesions. While a small portion of the ground-glass consolidations, cord shadows and subpleural curvilinear shadows could be absorbed too in the severe group. However, it was difficult for the dense cord shadows to be absorbed and showing no changes in the lesions even at the 3-month follow-up. The results were good to quantify the difference between the two groups with CT visual score, with significantly bigger scores in the severe group than in the mild group (8.53
According to reports, lung parenchyma, irregular interface signs, and traction bronchiectasis are the signs of fibrosis, which are related to the patient’s age and gender, i.e. the elderly male patients are more likely to have persistent fibrotic lesions in the lungs [26, 27, 28]. In the present study, it was found that the ground-glass shadows and reticular shadows were common in survivors with severe NCP. The peak value of LDH indicated the degree of tissue damage. The high peak values of LDH were also seen in the patients with higher visual scores of residual lung lesions. The more residual shadows in the lungs, the bigger declines in TLC% and DLCO% in the lung function follow-up examinations. The residual lung lesions were negatively correlated with DLCO%. The CT visual score strikingly quantified the relationship between these two, and the image performance and the recovery of lung function were closely related to the clinical manifestations [29, 30, 31].
5.Conclusions
In the follow-up after NCP recovery, it was shown that the lung CT features were closely related to its clinical manifestations, laboratory tests and lung function. There was a gradual improvement in the residual lung lesions and lung function, but the absorption of the interstitial shadows was slow. CT is able to demonstrate even the minute changes in the lungs, thus is an ideal examination method for monitoring residual lesions in lungs. Pulmonary function test is of great significance in evaluating the prognosis and quality of life of patients. Nevertheless, a longer follow-up is expected to check the recovery of residual lesions in lungs, especially the interstitial shadows in the NCP survivors, and the imaging performance of NCP needs to be further explored and studied.
Acknowledgments
This work was supported by grants from Hubei Province Health and Family Planning Scientific Research Project (No. WJ2019F096 and No. WJ2019F092), the Scientific Research Project of Hubei University of Medicine (Xiangyang No. 1 People’s Hospital): Application of Comparative Imaging Combined with Problem-based Learning (PBL) in Medical Imaging Theory Teaching (Zhibing He); the Study on the Diagnostic Value of Digital Mammography and DCE-MRI Combined with Serum-related Tumor Marker Detection in Clinical Palpation-negative Breast Cancer (Zhibing He); and Comparison of the Composition of Intestinal Microbiota between Patients with Colon Adenoma and Colon Cancer by High-throughput Sequencing (Yingjian Ye).
Conflict of interest
The authors declare no conflict of interest.
Abbreviations
| CK | creatine kinase |
| LDH | lactate dehydrogenase |
| CRP | C-reactive protein |
| ALT | Alanine aminotransferase |
| AST | Aspartate aminotransferase |
| WBC | white blood cell |
| HB | hemoglobin |
| PLT | platelet |
| ALB | albumin |
| TB | total bilirubin |
| ESR | erythrocyte sedimentation rate |
| PT | prothrombin time |
| APTT | Activated partial thromboplastin time |
| PCT | Procalcitonin |
| D-D | D-Dimer |
References
[1] | Van Caeseele P, Bailey D, Forgie SE, Dingle TC, Krajden M. SARS-CoV-2 (COVID-19) serology: implications for clinical practice, laboratory medicine and public health [published online ahead of print, 2020 Aug 3]. CMAJ. (2020) ; cmaj.201588. doi: 10.1503/cmaj.201588. |
[2] | Tan CS, Yeoh SF, Long CM. COVID-19: critical role of angiotensin 1–7 in ACE2 modulation. Ann Acad Med Singapore. (2020) Jun; 49: (6): 398–400. PMID: 32712639. |
[3] | Lu R, Zhao X, Li J, et al. Genomic characterisation and epidemiology of 2019 novel coronavirus: implications for virus origins and receptor binding. Lancet. (2020) ; 395: (10224): 565–574. doi: 10.1016/S0140-6736(20)30251-8. |
[4] | World Health Organization. WHO Coronavirus Disease (COVID-19) Dashboard (https://www.who.int.opensinnewtab). |
[5] | World Health Organization. Coronavirus disease (COVID-19) outbreak (https://www.who.int.opensinnewtab). |
[6] | Ai T, Yang Z, Hou H, Zhan C, Chen C, Lv W, et al. Correlation of chest CT and RT-PCR testing for coronavirus disease 2019 (COVID-19) in China: a report of 1014 cases. Radiology. (2020) Aug; 296: (2): E32–E40. doi: 10.1148/radiol.2020200642. Epub 2020 Feb 26. PMID: 32101510; PMCID: PMC7233399. |
[7] | Antonio GE, Wong KT, Hui DS, et al. Thin-section CT in patients with severe acute respiratory syndrome following hospital discharge: preliminary experience. Radiology. (2003) ; 228: (3): 810–815. doi: 10.1148/radiol.2283030726. |
[8] | General Office of the National Health and Health Commission. Notice on Issuing a New Coronavirus Pneumonia Diagnosis and Treatment Plan (Trial Implementation of Revised Fifth Edition). National Health Office Medical Letter [2020] No. 117. 2020. http://www.nhc.gov.cn/yzygj/s7653p/202002/3b09b894ac9b4204a79db5b8912d4440.shtml. |
[9] | Goh KJ, Choong MC, Cheong EH, Kalimuddin S, Duu Wen S, Phua GC, et al. Rapid progression to acute respiratory distress syndrome: review of current understanding of critical illness from COVID-19 infection. Ann Acad Med Singapore. (2020) Mar 16; 49: (3): 108–118. PMID: 32200400. |
[10] | Abu-Raya B, Gantt S, Sadarangani M. Challenges in evaluating SARS-CoV-2 vaccines during the COVID-19 pandemic [published online ahead of print, 2020 Jul 9]. CMAJ. (2020) ; cmaj.201237. doi: 10.1503/cmaj.201237. |
[11] | Xu Z, Shi L, Wang Y, Zhang J, Huang L, Zhang C, et al. Pathological findings of COVID-19 associated with acute respiratory distress syndrome. Lancet Respir Med. (2020) Apr; 8: (4): 420–422. doi: 10.1016/S2213-2600(20)30076-X. Epub 2020 Feb 18. Erratum in: Lancet Respir Med. 2020 Feb 25; PMID: 32085846; PMCID: PMC7164771. |
[12] | Ye Z, Rochwerg B, Wang Y, et al. Treatment of patients with nonsevere and severe coronavirus disease 2019: an evidence-based guideline. CMAJ. (2020) ; 192: (20): E536–E545. doi: 10.1503/cmaj.200648. |
[13] | Frost DW, Shah R, Melvin L, et al. Principles for clinical care of patients with COVID-19 on medical units. CMAJ. (2020) ; 192: (26): E720–E726. doi: 10.1503/cmaj.200855. |
[14] | Parhar KKS, Lequier L, Blackwood J, Zuege DJ, Singh G. Optimizing provision of extracorporeal life support during the COVID-19 pandemic: practical considerations for Canadian jurisdictions. CMAJ. (2020) ; 192: (14): E372–E374. doi: 10.1503/cmaj.200448. |
[15] | Cheng MP, Lee TC, Tan DHS, Murthy S. Generating randomized trial evidence to optimize treatment in the COVID-19 pandemic. CMAJ. (2020) ; 192: (15): E405–E407. doi: 10.1503/cmaj.200438. |
[16] | Bhandari S, Sharma S, Bhargava A, Keswani P, Sharma R, Shekhawat A. Inflammatory markers in COVID-19. Ann Acad Med Singapore. (2020) Jun; 49: (6): 393–397. PMID: 32712638. |
[17] | Kumar DS, O’Neill SB, Johnston JC, Grant JM, Sweet DD. SARS-CoV-2 infection in a 76-year-old man with initially negative nasopharyngeal swabs. CMAJ. (2020) ; 192: (20): E546–E549. doi: 10.1503/cmaj.200641. |
[18] | An P, Ye Y, Chen M, Chen Y, Fan W, Wang Y. Management strategy of novel coronavirus (COVID-19) pneumonia in the radiology department: a Chinese experience. Diagn Interv Radiol. (2020) May; 26: (3): 200–203. doi: 10.5152/dir.2020.20167. PMID: 32209526; PMCID: PMC7239366. |
[19] | Nicholls JM, Poon LL, Lee KC, Ng WF, Lai ST, Leung CY, et al. Lung pathology of fatal severe acute respiratory syndrome. Lancet. (2003) May 24; 361: (9371): 1773–8. doi: 10.1016/s0140-6736(03)13413-7. PMID: 12781536; PMCID: PMC7112492. |
[20] | Johkoh T, Müller NL, Taniguchi H, Kondoh Y, Akira M, Ichikado K, et al. Acute interstitial pneumonia: thin-section CT findings in 36 patients. Radiology. (1999) Jun; 211: (3): 859–63. doi: 10.1148/radiology.211.3.r99jn04859. PMID: 10352616. |
[21] | An P, Wood BJ, Li W, Zhang M, Ye Y. Postpartum exacerbation of antenatal COVID-19 pneumonia in 3 women. CMAJ. (2020) ; 192: (22): E603–E606. doi: 10.1503/cmaj.200553. |
[22] | An P, Liu B. Computed tomography manifestations of COVID-19 pneumonia. Br J Hosp Med (Lond). (2020) ; 81: (4): 1–2. doi: 10.12968/hmed.2020.0104. |
[23] | An P, Song P, Lian K, Wang Y. CT manifestations of novel coronavirus pneumonia: a case report. Balkan Med J. (2020) ; 37: (3): 163–165. doi: 10.4274/balkanmedj.galenos.2020.2020.2.15. |
[24] | An P, Zhang M. Novel coronavirus SARS-CoV-2: familial spread resulting in COVID-19 pneumonia in a pediatric patient. Diagn Interv Radiol. (2020) ; 26: (3): 262–263. doi: 10.5152/dir.2020.20157. |
[25] | An P, Song P, Wang Y, Liu B. Asymptomatic patients with novel coronavirus disease (COVID-19). Balkan Med J. (2020) ; 37: (4): 229–230. doi: 10.4274/balkanmedj.galenos.2020.2020.4.20. |
[26] | Juurlink DN. Safety considerations with chloroquine, hydroxychloroquine and azithromycin in the management of SARS-CoV-2 infection. CMAJ. (2020) ; 192: (17): E450–E453. doi: 10.1503/cmaj.200528. |
[27] | Rohailla S, Ahmed N, Gough K. SARS-CoV-2 infection associated with spontaneous pneumothorax. CMAJ. (2020) ; 192: (19): E510. doi: 10.1503/cmaj.200609. |
[28] | Kirtsman M, Diambomba Y, Poutanen SM, et al. Probable congenital SARS-CoV-2 infection in a neonate born to a woman with active SARS-CoV-2 infection. CMAJ. (2020) ; 192: (24): E647–E650. doi: 10.1503/cmaj.200821. |
[29] | Arya A, Buchman S, Gagnon B, Downar J. Pandemic palliative care: beyond ventilators and saving lives. CMAJ. (2020) ; 192: (15): E400–E404. doi: 10.1503/cmaj.200465. |
[30] | Ng-Kamstra J, Stelfox HT, Fiest K, Conly J, Leigh JP. Perspectives on personal protective equipment in acute care facilities during the COVID-19 pandemic. CMAJ. (2020) ; 192: (28): E805–E809. doi: 10.1503/cmaj.200575. |
[31] | Mahammedi A, Saba L, Vagal A, et al. Imaging in Neurological Disease of Hospitalized COVID-19 Patients: An Italian Multicenter Retrospective Observational Study [published online ahead of print, 2020 May 21]. Radiology. (2020) ; 201933. doi: 10.1148/radiol.2020201933. |


