
A method for enhancing speech and warning signals based on parallel convolutional neural networks in a noisy environment
Abstract
BACKGROUND:
Digital hearing aids are based on technology that amplifies sound and removes noise according to the frequency of hearing loss in hearing loss patients. However, within the noise removed is a warning sound that alert the listener; the listener may be exposed to danger because the warning sound is not recognized.
OBJECTIVE:
In this paper, a deep learning model was used to improve these limits and propose a method to distinguish the warning sound in speech signals mixed with noise. In addition, the improved speech and warning sound were derived by removing noise present in the classification sound signals.
METHODS:
To classify the sound dataset, an adaptive convolution filter that changes according to two signals is proposed. The proposed convolution filter is applied to the PCNNs model to analyze the characteristics of the time and frequency domains of the dataset and classify the presence or absence of warning sound. In addition, the CEDN model was used to improve the intelligibility of the warning and the speech in the signal based on the warning sound classification from the proposed PCNNs model.
RESULTS:
Experimental results show that the PCNNs model using the proposed multiplicative filters is efficient for analyzing sound signals with complex frequencies. In addition, the CEDN model was used to improve the intelligibility of the warning and the speech in the signal based on the warning sound classification from the proposed PCNNs model.
CONVLUSION:
We confirmed that the PCNN model with the proposed filter showed the highest training rate, lowest error rate, and the most stable results. In addition, the CEDN model confirmed that speech and warning sounds were recognized, but it was confirmed that there was a limitation in clearly recognizing speech as the noise ratio increased.
1.Introduction
Digital hearing aids include various digital signal processing techniques to provide optimal gain and speech intelligibility for the hearing impaired. The technology that amplifies sound and removes noise according to the degree of hearing loss by frequency is reflected in the device design [1]. However, there are limitations to this conventional method, within the noise removed is a warning sound that alert the listener; the listener may be exposed to danger because the warning sound is not recognized. To solve this problem various speech enhancement methods and noise cancellation methods have been studied, including the application of a deep learning system [2, 3, 4, 5, 6, 7, 8, 9].
The deep learning system used a sound classification method and a speech enhancement method. Piczak [6] and Seo [7] proposed a deep learning model that effectively analyzes and classifies the characteristics of various sound signals based on a large quantity of sound databases. The proposed method has excellent performance when classifying various types of sound signals by training the characteristics of these signals. The method proposed by Piczak was to classify sounds by applying the Urbansound8K database to the convolutional neural network (CNN) model, and it was confirmed that the training accuracy was 73.1%. Similarly, the method proposed by Seo was to classify sounds by applying the Urbansound8K database to the CNN+LSTM model, and it was confirmed that the training accuracy was 96.4%. However, because this method analyzes and classifies the characteristics of a sound signal only with a noise signal without speech and noise mixing, there is a limit to obtaining meaningful data in an environment where speech and noise exist. In addition, Xu [8] and Park [9] proposed a speech enhancement deep learning method that compares the characteristics of a noisy speech signal with a clean speech signal and reduces the error rate of both signals to obtain a high recognition rate for speech. The method proposed by the Xu is to use the DNN model to improve the speech in a noisy environment with a signal to noise ratio (SNR) of
In this paper, a new method is proposed based on a deep learning model to overcome the limitations of the sound recognition method through deep learning signal processing. The proposed method uses a deep learning model that distinguishes the presence or absence of warning sound in a noisy environment and another deep learning model that removes noise present in the classified sound signals. This method improves the intelligibility of speech and warning sound and alerts listeners to dangerous situations.
The convolution filter of the general CNN model alone has difficulty in characterizing noise environments with complex frequency bands. Therefore, to classify sound dataset, an adaptive convolution filter that changes according to two signals is proposed. The proposed convolution filter is applied to the parallel convolutional neural networks (PCNNs) model to analyze the characteristics of the time and frequency domains of the dataset and classify the presence or absence of warning sound. In addition, the CEDN model was used to improve the intelligibility of the warning and the speech in the signal based on the warning sound classification from the proposed PCNNs model. The CEDN proposed method compares the error between the noisy signal and the original clean signal and removes noise close to the original clean signal. To verify the validity of the method data characteristics were trained by mixing sound signal data with an SNR ranging from
2.Method
2.1Summary of the proposed method
Conventional noise reduction and speech enhancement methods are limited in the accurate characterization and classification of sound data that is required for hearing in various noise environments with various frequency bands. To improve these limitations, the frequency components of a noisy environment were analyzed and the results used to classify noise, warning sound, and speech.
The convolution filter used in the existing CNN model has limitations in analyzing the characteristics of complex noise environments. To overcome these limitations, an adaptive convolution filter was changed according to two types of signals appearing in a sound signal. This convolution filter was applied to the PCNNs model to analyze the time and frequency characteristics of the sound signal. In addition, the presence or absence of warning sound was classified according to the analyzed characteristics. Finally, a method was proposed to improve the intelligibility of warning sound and speech in signals classified as the presence or absence of warning sound using the CEDN model.
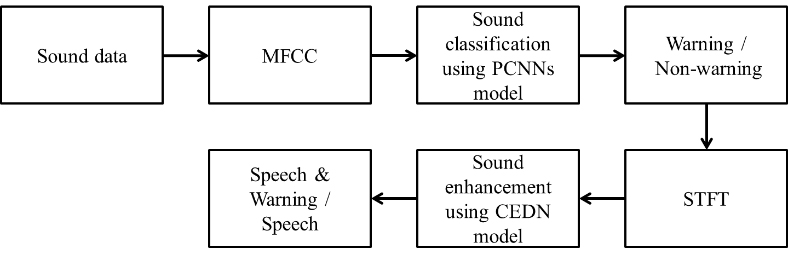
Figure 1 shows the overall flow of the proposed warning sound signal classification and sound signal enhancement algorithm. As shown in Fig. 1, the proposed method has a preprocessing stage that transforms the input data into spectrograms and a classifier stage that can classify it as noise and warning sound in a model that has trained the characteristics of the preprocessed data. The classified results are then applied to the codec based sound signal enhancement model once again through preprocessing, with the improvement of the intelligibility of warning sound and speech.
Figure 1.
Proposed warning sound signal classification and sound signal enhancement algorithm flowchart.
2.2The proposed warning sound classification method
The CNN model has low information resolution because it analyzes the characteristics of the input data using only one domain with one convolution filter layer, and it is difficult to analyze a large amount of information simultaneously because of this low information resolution. Therefore, the analyses of the spectrogram of the noise mixed sound signal with a complex frequency band using only the conventional method are limited. To improve these limitations, an adaptive convolution filter that changes in two directions according to the signal region was proposed. In addition, a PCNNs model that can analyze and classify the proposed convolution filter at the same time was used.
Figure 2.
A PCNNs model structure using the proposed convolution filter.
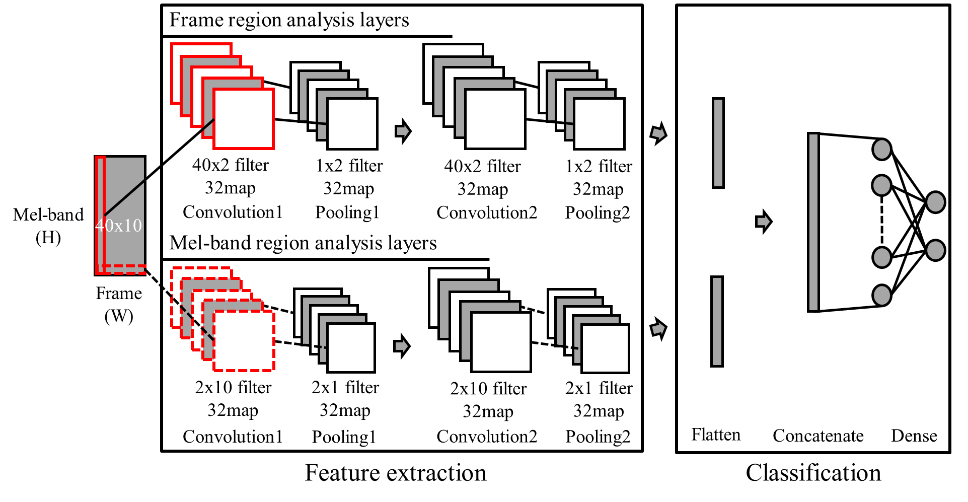
Figure 2 shows the structure of the PCNNs model where the proposed convolution filter is applied. As shown in Fig. 2, the proposed convolution filter has a feature extraction section consisting of two convolution filter layers, the max pooling layer, and two fully connected layers. In addition, it is composed of one part having an activation function (softmax function) in the output layer to classify the presence or absence of a warning sound. The dataset used to classify a warning sound was constructed from data of a mixture of noise and speech with and without a warning sound. The time series data of the constructed sound signal dataset was applied to the neural network model to analyze the features. However, it is difficult to recognize sound patterns where frequencies are complicated by noise. To solve this problem, time series data are applied to neural network models by simplifying each frequency band in the frequency domain and preprocessing it with spectrograms representing the magnitude of energy in each band [10].
To analyze the unique characteristics of the sound data, the mel frequency central coefficient (MFCC) method was used [11]. MFCC is a technique for analyzing spectrogram for each frame and extracting characteristics by dividing the entire sound signal data into short frames rather than analyzing the characteristics of the entire sound signal data. In this paper, the entire sound signal data is applied to window function and divided into 10 frames in the block unit. The sound signal of each frame is then converted to a frequency domain using a Fast Fourier transform (FFT) of size 512. In addition, the frequency band was divided into 40 filter banks to obtain energy from each bank. MFCC was acquired by taking log values for each energy and performing a discrete cosine transformation (DCT). Therefore, data preprocessed with size 40
Previously, to train the input data preprocessed with the spectrogram, a feature map of the input data was extracted by applying a convolution filter to the input data as shown in Eq. (1) [12].
(1)
Where
Figure 3 shows the feature map extraction method using a general convolution filter. As shown in Fig. 3, a convolution filter having a size of
Table 1
Training result of applying the convolution filter size variable to the CNN model
| Accuracy | Loss | |||||
|---|---|---|---|---|---|---|
| Filter size | 3 | 4 | 5 | 3 | 4 | 5 |
| Result | 0.862 | 0.875 | 0.886 | 0.313 | 0.289 | 0.269 |
Figure 3.
Feature map extraction method using general convolution filter.
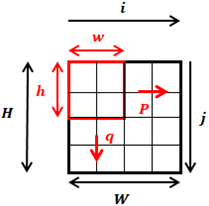
Table 1 shows the results of training according to the size variations of the convolution filter. As shown in Table 1, the larger the size of the convolution filter, the higher the training accuracy of analyzing and classifying the spectrogram features, and the lower the error of classifying and misinterpreting the features.
The general CNN model has a single domain and takes a long time to analyze the entire data as it locally analyzes the characteristics of the input data with a limited convolution filter size. In addition, it was not efficient to locally analyze the point where the signal is rapidly increasing in a short period of time. Therefore, to improve the limitations of the CNN model, a convolution filter that adjusts the filter size according to the purpose of using the height (
(2)
Where
(3)
Where
Finally, the frame features and the mel band features analyzed in the two convolutional layers were transferred to the fully connected layer to classify the data. Since the fully connected layer is a layer that analyzes and classifies one dimensional data, the two dimensional data extracted from the convolutional layer is converted into one dimensional data and applied to the feature classification neural network. The feature classification neural network consisted of two layers, the input layer consisted of data obtained from the prefixed layer, a concealed layer with 256 perceptrons, and an output layer with two perceptrons to classify the presence of warning sound.
Figure 4.
Feature map extraction method using the proposed multiplication filter.
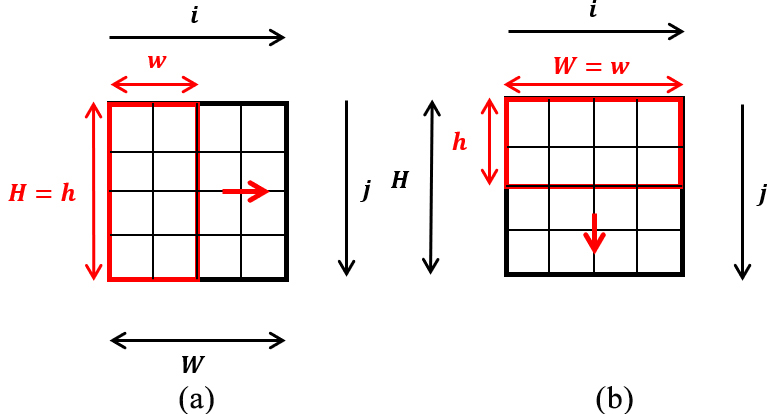
Figure 5.
The input dataset applied to each model. (a) A sound signal with mixed speech and noise and (b) A sound signal with mixed speech, warning sound, and noise.
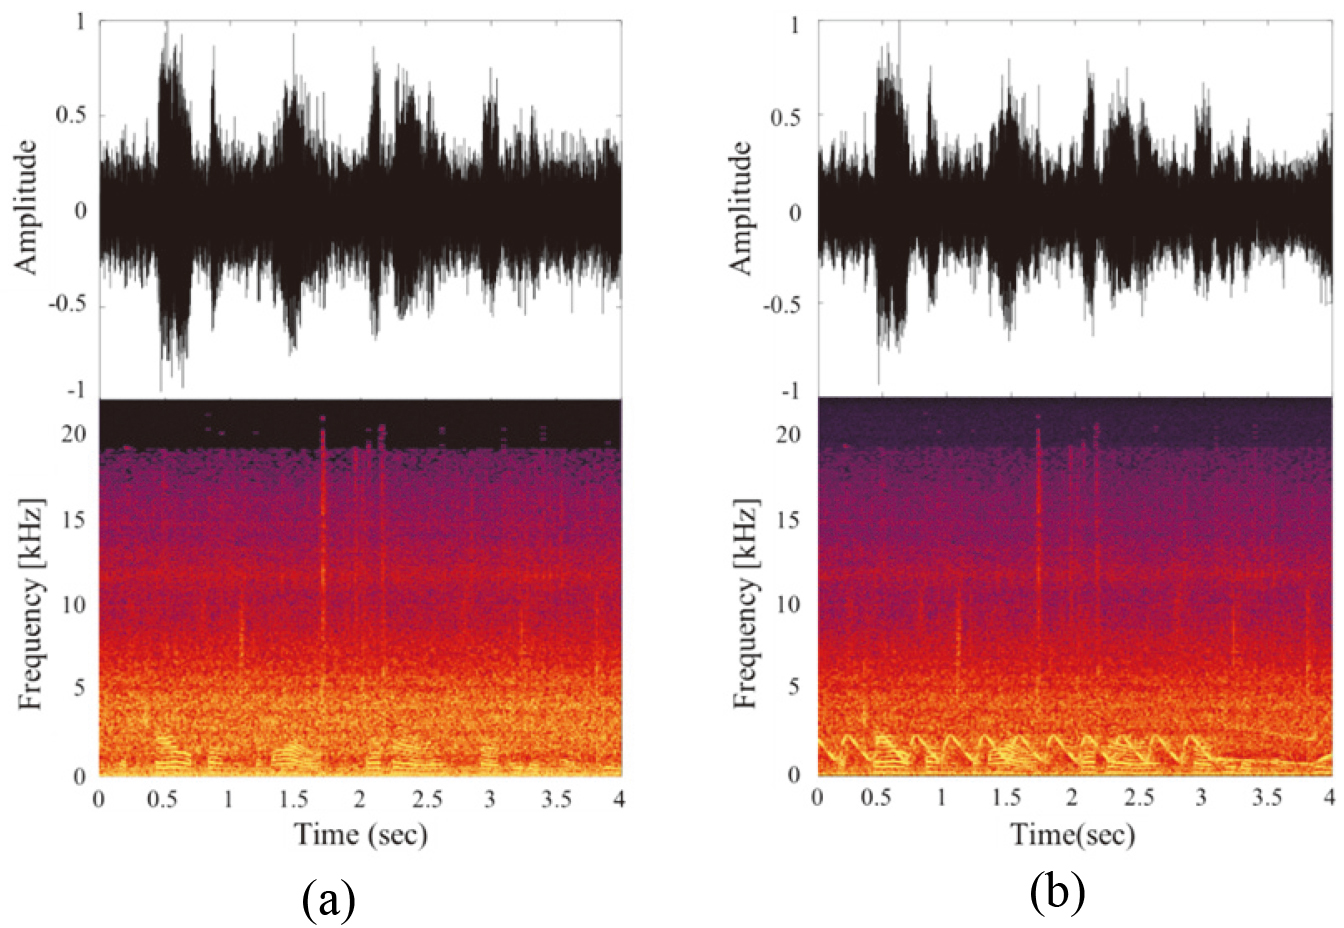
Figure 6.
The output dataset to be compared with each input dataset. (a) A speech signal and (b) A sound signal with a mix of speech and warning sound.
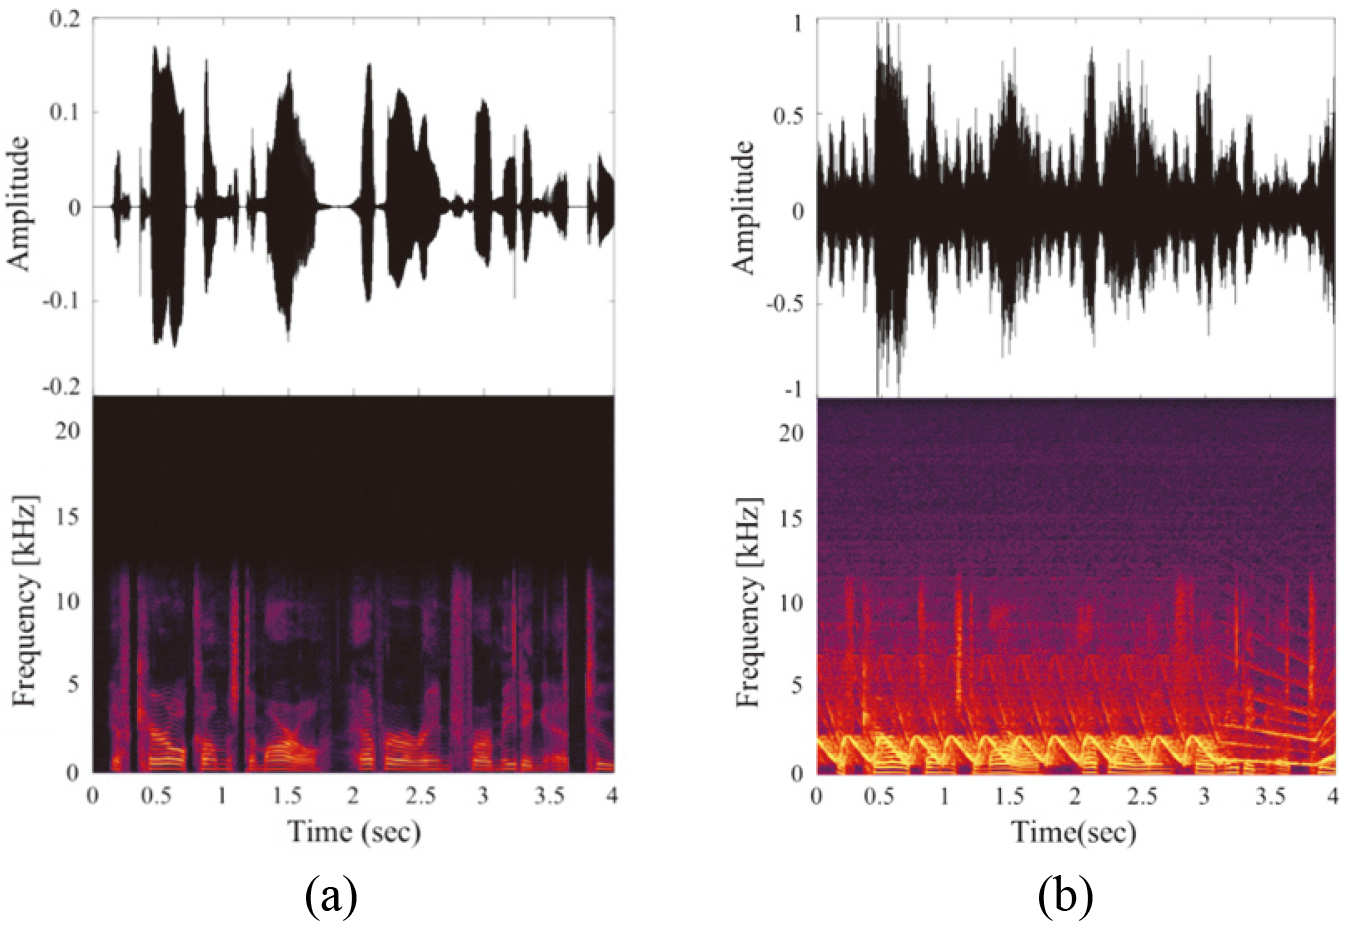
Figure 4 shows the feature map extraction method using the proposed convolution filter. As shown in Fig. 4a, a convolution filter with
2.3The proposed speech and warning sound enhancement method
In this paper, two CEDN models were constructed to remove the noise present in the two datasets classified above [9].
Figure 5 shows the characteristics of noise present in the two classified dataset and used as input data of a CEDN model. A dataset was constructed to apply a sound signal with a mixture of speech and noise as input data for a CEDN model as shown in Fig. 5a. In addition, a dataset was constructed to apply a sound signal with a mixture of speech, warning, and noise as input data for a CEDN model as shown in Fig. 5b.
Figure 6 shows the output dataset to be compared with each input dataset and shows the characteristics of the original signal without noise in the two classified datasets. A speech signal dataset was constructed, which is the original signal without noise in the dataset and non-warning sound, as shown in Fig. 6a. In addition, a sound signal dataset was constructed of a mixture of speech and warning sound, which is the original signal without noise in the dataset with warning sound, as shown in Fig. 6b.
To apply the constructed dataset to the CEDN model, data having a time domain was preprocessed with a spectrogram using a short time Fourier transform (STFT) of size 128. In addition, the time axis of the estimated spectrogram was divided into 8 frames to produce a spectrogram with a size of 128
Among the dataset preprocessed with a spectrogram, a noisy dataset was applied as input data of a CEDN model to extract features. Then, the extracted data value was compared with the original signal dataset without noise to reduce the error rate; Training was repeatedly performed until it became similar to the original signal.
3.Results
3.1The experiment result of proposed warning sound classification method
The dataset used for the proposed method of classifying the warning sound was constructed using TIMIT [13], which is a speech signal dataset, and UrbanSound8K [14], a noise signal dataset generated in everyday cities. TIMIT Corpus was used because it was designed to provide speech data for the development and evaluation of acoustic speech research in automatic speech recognition systems. In addition, the Urbansound8K dataset was used because it was a data set that collected various noise environments and warning sound environments with sound data generated in 10 cities. The Urbansound8K data set consists of 10 types of sound data created in everyday cities, and 8,732 data about 4 seconds long. In the Urbansound8K data set, car horn, dog barking, gun shot, and siren were classified as warning sound. In addition, air conditioner, children playing, drilling, engine idling, jackhammer and street music were classified as noise. A total of 5,542 noise data coefficients are used except for the warning sound. And the data set is constructed by mixing with the TIMIT data set for each dB.
To generate a speech and warning dataset including a noisy environment, TIMIT and UrabanSound8k were mixed using MATLAB R2018. In addition, when mixing speech and noise, 5,542 data were constructed for each dB by applying an SNR of
In the generated data sets, the data sets for training the proposed model, and the test data sets for predicting the trained data sets were constructed. In addition, the K-fold cross-validation method was used to verify the accuracy of the test data sets. The K-fold cross-verification method is a method of producing and cross-verifying K-folds, where K is 5. The ReLu function was used as the activation function applied to the neural network, and stochastic gradient descent (SGD), which is commonly used to train the neural network model, was used as an optimization method of parameters. The batch size used to train the model was 128, and a total of 1,000 epochs were performed.
Table 2 shows the results of training the data used in the proposed PCNNs model by changing the size of the convolution filter on the existing model, and the training result of the proposed PCNNs model method. As Table 2 shows, the larger the size of the convolution filter, the higher the training accuracy. And the proposed method, PCNNs model training accuracy is 99%, which is more accurate than the existing method. Thus, it was possible to confirm that the PCNNs model, which can analyze and train the overall flow in a specific part, had better performance than other models.
Table 2
Existing model, changing the size of the convolution filter on the existing model, and proposed model train result
| Accuracy | ||||
|---|---|---|---|---|
| Method | Training existing model using proposed data | Proposed | ||
| CNN [6] | CNN (3 | CNN (4 | CNN (5 | PCNNs |
| Result | 0.855 | 0.868 | 0.879 | 0.993 |
| CNN+LSTM [7] | CNN (3 | CNN (4 | CNN (5 | PCNNs |
| Result | 0.753 | 0.796 | 0.840 | 0.993 |
Table 3
CNN and PCNNs model test result
| Model | CNN | PCNNs | ||
|---|---|---|---|---|
| Filter size | 3 | 4 | 5 | Proposed |
| Test result | 0.907 | 0.914 | 0.915 | 0.985 |
The result of testing the model trained on the size variable of the filter in the CNN model and the result of testing the model trained on the PCNNs model are shown in Table 3. The performance of the PCNNs model applying the proposed convolution filter is approximately 98%, which confirms that the performance is improved by approximately 8% compared with the existing CNN model that analyzes data locally.
3.2The experiment result of proposed speech and warning sound enhancement method
To remove the noise present in the sound signal classified by the presence or absence of the warning sound, data was trained using two models. The ReLu function was used as the activation function applied to the model, the batch size used to train the model was 64, and a total of 10 epochs were performed.
Figure 7.
The comparison result of the dataset without a warning sound and original signal dataset without noise before applying it to the sound enhancement model. (a) The comparison result of the dataset without a warning sound and original signal dataset without noise before applying to the sound enhancement model and (b) The comparison result of the dataset without a warning sound and original signal dataset without noise applied to the sound enhancement model.
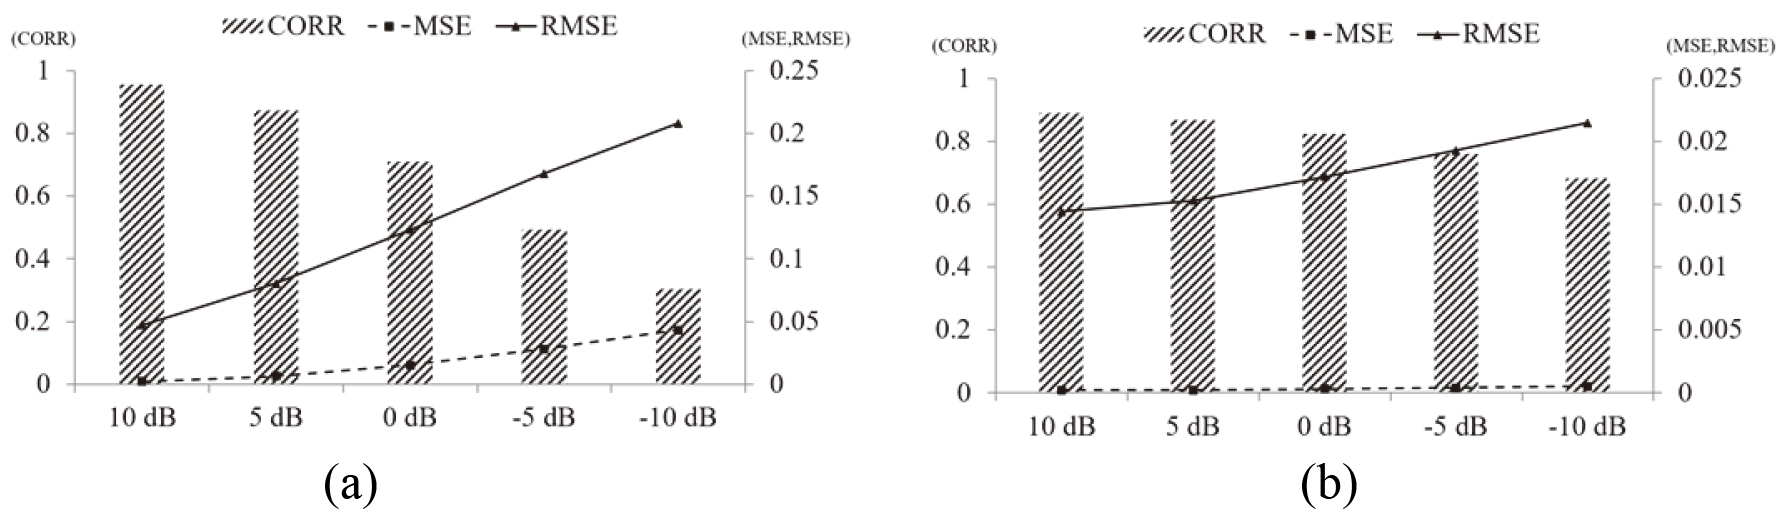
Figure 7 shows the result of comparing the dataset without warning sound and the original signal dataset without noise. The result of comparing the dataset without warning sound and the original signal dataset without noise before applying this to the sound enhancement model is shown in Fig. 7a. This demonstrates that as the noise intensity increases, the error with the original signal dataset increases. The result of comparing the dataset without warning sound and the original signal dataset without noise applied to the sound enhancement model is shown in Fig. 7b.
Figure 8.
The comparison result of the dataset with a warning sound and original signal dataset without noise before applying it to the sound enhancement model. (a) The comparison result of the dataset with a warning sound and original signal dataset without noise before applying to the sound enhancement model and (b) The comparison result of the dataset with a warning sound and original signal dataset without noise applied to the sound enhancement model.
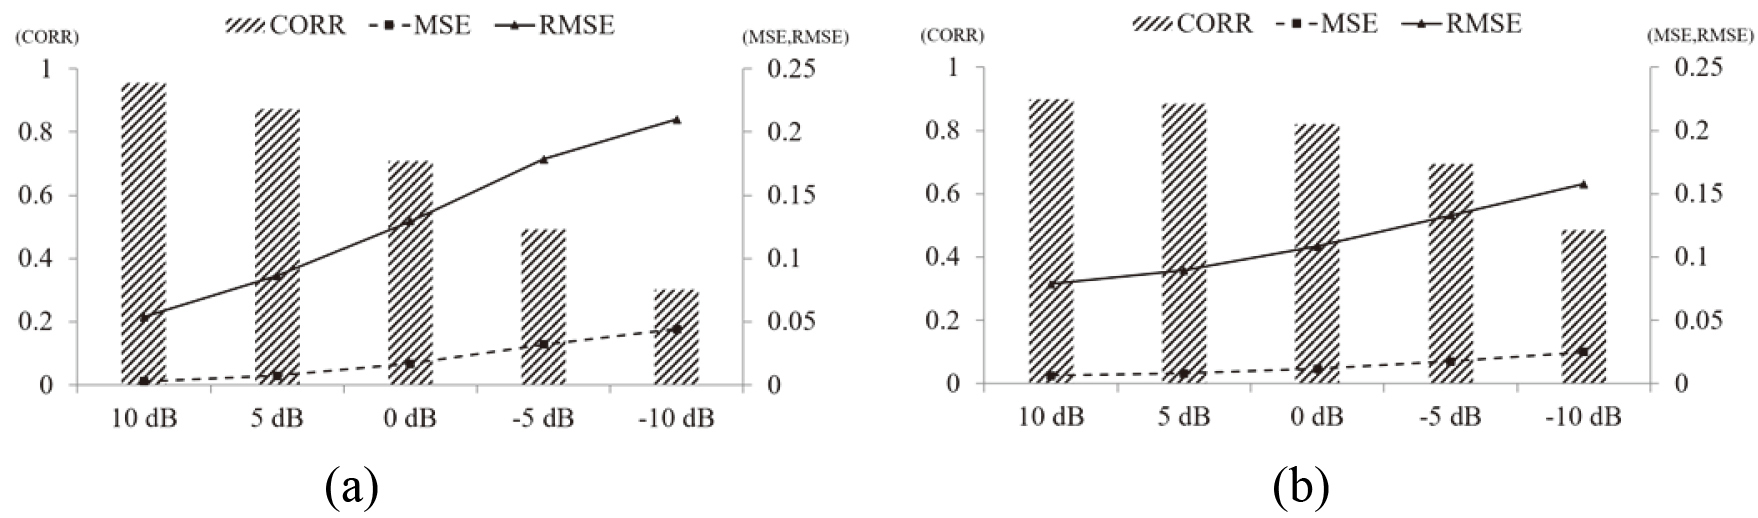
Figure 8 shows the result of comparing the dataset with warning sound and the original signal dataset without noise. The result of comparing the dataset with a warning sound and the original signal dataset without noise before applying it to the sound enhancement model is shown in Fig. 8a. This demonstrates that as the noise intensity increases, the error with the original signal dataset increases. The comparison of the dataset with a warning sound and the original signal dataset without noise applied to the sound enhancement model is shown in Fig. 8b.
Figure 9.
The comparison between the results before applying to the sound enhancement model and the results applied to the sound enhancement model. (a) The comparison of results before and after applying a non-warning sound dataset to the sound improvement model and (b) The comparison of the results before and after applying a warning sound dataset to the sound enhancement model.
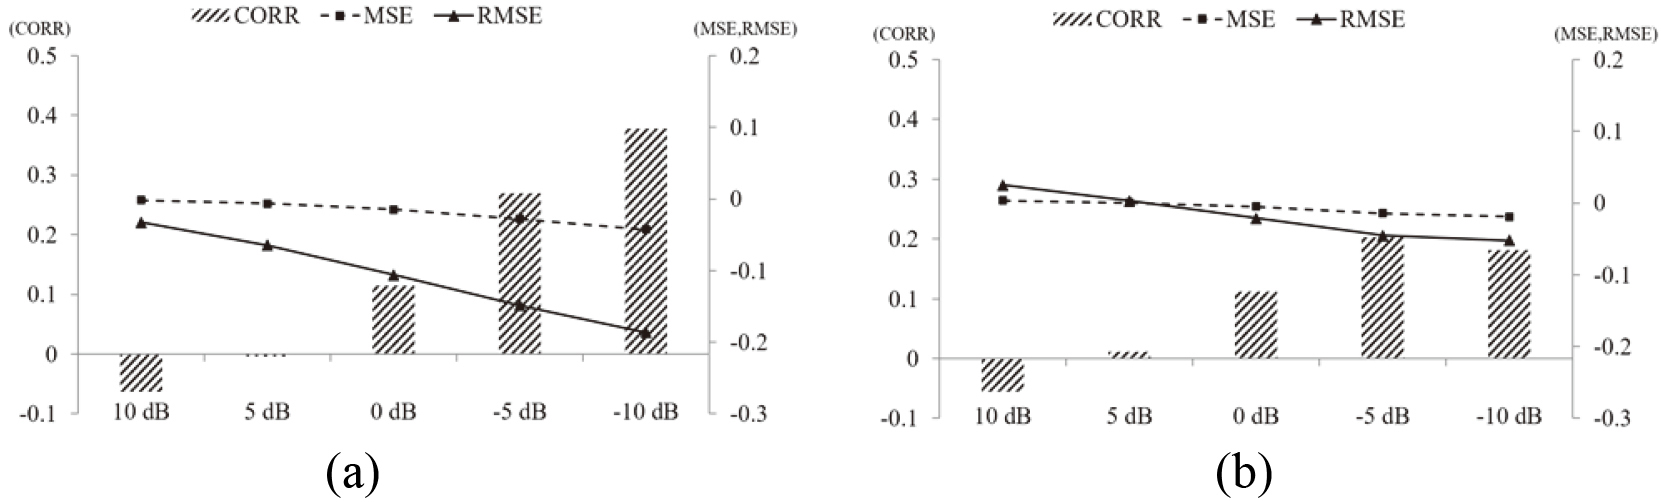
Figure 9 shows the comparison between the results before applying to the sound enhancement model and the results applied to the sound enhancement model. The comparison of results before and after applying a non-warning sound dataset to the sound improvement model is shown in Fig. 9a. The comparison of the results before and after applying a warning sound dataset to the sound enhancement model is shown in Fig. 9b. Figure 9a shows that the enhancement is lower in 10 dB and 5 dB with relatively low noise intensity, but higher in 0,
4.Conclusion
In this paper, we proposed a method of classification whether a warning sound is generated from a speech signal mixed with noise in order to overcome for problems occurring in a speech recognition method through a conventional signal processing using a deep learning model. In addition, a method was proposed of recognizing a dangerous situation by transmitting an improved speech and warning sound to a listener using a deep learning method that removes noise existing in a classified sound signal.
To construct an environment similar to the real environment, a dataset was created where a speech and noise signal without warning sound were mixed, and a dataset where a speech signal and noise with warning sound were mixed. There is a limit to the analyses of the characteristics of a noise environment with a complex frequency band, such as the generated dataset, using only the convolution filter of a general CNN model. Therefore, an adaptive convolution filter that varies according to the characteristics of the sound signal was proposed. The proposed convolution filters were applied to the PCNNs model to analyze the time and frequency domain characteristics of the dataset simultaneously. Based on this, the presence or absence of warning sound was classified. Additionally, as a result of the PCNNs model that the proposed filter was applied to, a CEDN model was used to improve the intelligibility of warning sound and speech in the classified signals with or with warning sound. To verify the proposed method data characteristics were trained by mixing sound signal data with an SNR ranging from
Based on the comparison of the training accuracy and the error rate for quantitative evaluation of the model performance, we confirmed that the PCNNs model that the proposed filter was applied to showed the highest training rate, the lowest error rate, and the most stable results. In addition, the proposed filter is used the CEDN model to improve the intelligibility of the warning sound and speech in the classified signal with or without a warning sound. Although it was confirmed that the speech and the warning sound were clearly recognized, it was confirmed that there was a limit in clearly recognizing the speech as the noise ratio increased.
In the future, the method proposed in this paper is expected to be used as a tool for efficient communication by recognizing the warning sound, which is generally removed from hearing aids through the improvement of speech information loss and experiments in a real time environment.
Acknowledgments
This study was supported by the National Research Foundation of Korea (NRF) grant funded by the Korean government (MSIP) (No. NRF-2017M3A9E2065284, NRF-2018R1A2B2001434, NRF-2019R1C1C1009013).
Conflict of interest
None to report.
References
[1] | Lee KW, Lee JH. Recent trends in hearing aid technologies. Korean Journal of Audiology. (2004) ; 8: (2): 98–103. |
[2] | Park CS, Took CC, Senog JK. Machine learning in biomedical engineering. Journal of Biomedical Engineering Letters. (2018) ; 8: (1): 1–3. |
[3] | Park SW, Kim JC, Kim DY. A study on classification performance analysis of convolutional neural network using ensemble learning algorithm. Korea Journal of Multimedia Society. (2019) ; 22: (6): 665–675. |
[4] | Sujadevi VG, Mohan N, Kumar SS, Akshay S, Soman KP. A hybrid method for fundamental heart sound segmentation using group-sparsity denoising and variational mode decomposition. Journal of Biomedical Engineering Letters. (2019) ; 9: (4): 413–424. |
[5] | Lee SG, Lee SM. Data augmentation for DNN-based speech enhancement. Korea Journal of Multimedia Society. (2019) ; 22: (7): 749–758. |
[6] | Piczak KJ. Environmental sound classification with convolutional neural networks In 2015 IEEE 25th International Workshop on Machine Learning for Signal Processing (MLSP). (2015) . pp. 17–20. |
[7] | Seo SW, Suh HW, Yu HJ, Seon WY, Park SJ. Hazardous sound classification for the hearing-impaired using deep neural networks. In Korean Institute of Information Scientists and Engineers 2017 Korea Software Congress Conference. (2017) . pp. 799–801. |
[8] | Young XU, Jun DU, Dai LR, Lee CH. A regression approach to speech enhancement based on deep neural networks. IEEE/ACM Transactions on Audio, Speech, and Language Processing. (2014) ; 23: (1): 7–19. |
[9] | Park SR, Lee JW. A fully convolutional neural network for speech enhancement. arXiv preprint arXiv:1609.07132, (2016) . |
[10] | CCEI Local Startup Hub [homepage on the internet]. Deep Learning Sound Event Detection; 2017 [updated 2017 September 29; cited 2020 May 20]. Available from: https://ccei.creativekorea.or.kr/json/common/fileDown.download?uuid=2017092917012708d89501-2982-4a0a-a4fe-372b769a6976. |
[11] | Practical Cryptography [homepage on the internet]. Mel Frequency Cepstral Coefficient (MFCC) Tutorial; 2013 [cited 2020 May 20]. Available from: http://practicalcryptography.com/miscellaneous/machine-learning/guide-mel-frequency-cepstral-coefficients-mfccs/. |
[12] | Lee DG. Classification of trucks using convolutional neural network. Journal of Convergence for Information Technology. (2018) ; 8: (6): 375–380. |
[13] | Linguistic Data Consortium [homepage on the internet]. TIMIT Acoustic-Phonetic Continuous Speech Corpus; 1993 [cited 2020 May 20]. Available: https://catalog.ldc.upenn.edu/LDC93S1. |
[14] | Urban Sound Datasets [homepage on the internet]. Urbansound8K Dataset; 2014 [cited 2020 May 20]. Available: https://urbansounddataset.weebly.com/urbansound8k.html. |


