
The roles of metastasis-related proteins in the development of giant cell tumor of bone, osteosarcoma and Ewing’s sarcoma
Abstract
BACKGROUND:
Giant cell tumor of bone (GC), osteosarcoma (OS) and Ewing’s sarcoma (ES) are three different types of bone cancer with common and specific pathology features.
OBJECTIVE:
The purpose of the study was to examine the relationship and differences of the three bone tumors using clinical samples.
METHODS:
Through screening the profiles of clinical samples from GC, OS and ES patients using a humanoncology array, we found 26, 25 and 15 tumorigenesis factors significantly increased in GS, OS and ES tissues compared to normal individuals. eNOS, endostatin, HIF-1
RESULTS:
The results showed levels of MCP1, MCP2, MCP3 or IL-6 in the GS, OS and ES significantly increased, and the expression levels of angiogenesis and anti-angiogenesis factors containing eNOS, endostatin, HIF-1
CONCLUSIONS:
Our results suggest that eNOS, endostatin, HIF-1
1.Introduction
Giant cell tumor (GC) of bone, Osteosarcoma (OS) and Ewing Sarcoma (ES) are three different types of cancers that occur in bone. Majority of high-risk group suffering GC, OS and ES aged below 50 years old [1]. Especially, as the most common primary bone tumors, OS and ES usually occur in children, adolescents and young adults, and the 5-year overall survival rates have not been improved for patients with localized forms [2]. However, it is still difficult to distinguish OS from ES just by imaging examination methods. GC of bone usually occurs in patients with mature bone, and the patient mainly distributed in the 20 to 50-year age population. Therefore, there is an urgent need to identify the relationship between them.
GC is classified as an intermediate, rarely metastasizing tumor, and characterized by local destruction in bone that leads to significant osteolysis that accounting for approximately 6% of all primary bone tumors [3]. The giant cells are osteoclast-like cells that occasionally presented a cellular structural similarity, and expressed many characteristic factors of osteoclasts [4]. The neoplastic cells recruit reactive cells to the tumor stroma from bone marrow-derived monocytic cells and release specific cytokines to the tumor stroma. Additionally, numerous members of matrix metalloproteinase (MMP) family were identified in GC, which were expressed by giant cells or stromal cells [5], but there is little actual evidence mentioning any specific roles in tumor. OS is one of the most often suffering cancers in dogs, and an altered pro- and anti-inflammatory immunologic profile was determined in OS dogs, and have a high expression of insulin growth factor receptor type 2 [6]. Data show that cancer-associated fibroblasts alter the expression of pro-angiogenic and migratory factors in OS cell lines [7]. IL-6 involved in the proliferation of OS cells, and TGF
The aim of the present study was to investigate the cancer-associated factors in GC, ES and OS tissues. We could try to find out those factors which are widely associated with different types of bone cancer, and which may just correlated with specific type of bone cancer. Our study will provide new insight for the mechanism research of GC, ES and OS.
2.Materials and methods
2.1Clinical samples information
A total of 28 bone tumor patients diagnosed with GC, OS or ES at Changzheng Hospital (Shanghai, China) from Dec. 2014 to Mar. 2016 were enrolled in the study. The number of GC, OS and ES samples is 14, 8 and 6, respectively. The patients included 16 males and 9 females, with an average age of 37.2
2.2Proteome profiling analysis
Forty cancer-associated cytokines in clinical samples were detected by a human XL oncology array kit (ARY026, R&D Systems, Millipore, USA). According to the instruction, clinical tumor tissues were preprocessed. The membrane was blocked with BSA for 1 h and then incubated with tissue protein mixed with a biotinylated detection antibody. Streptavidin-HRP and chemiluminescence were used to detect the primary antibodies. The binding to membranes were finally visualized and quantified with by ImageJ software version 1.51 (National Institutes of Health, Bethesda, MD, USA).
2.3Western blotting analysis
Total protein extracted from clinical samples were homogenized with RIPA buffer (Sigma-Aldrich, USA) containing 1% protease inhibitor cocktail (Sigma-Aldrich, USA) and 0.5% phenylmethanesulfonyl fluoride (PMSF) (Sigma-Aldrich, USA). The protein concentration was detected by BCA protein assay kit (Merck Millipore, Germany). The protein lysate were boiled at 95
2.4Statistical analysis
All values are presented as means
Figure 1.
The expression of oncology genes in GS, OS and ES clinical tissues. A. Graphical representation of genes expressions in GC, OS and ES. The arrows indicate the factors involved in the metastasis with a significant change
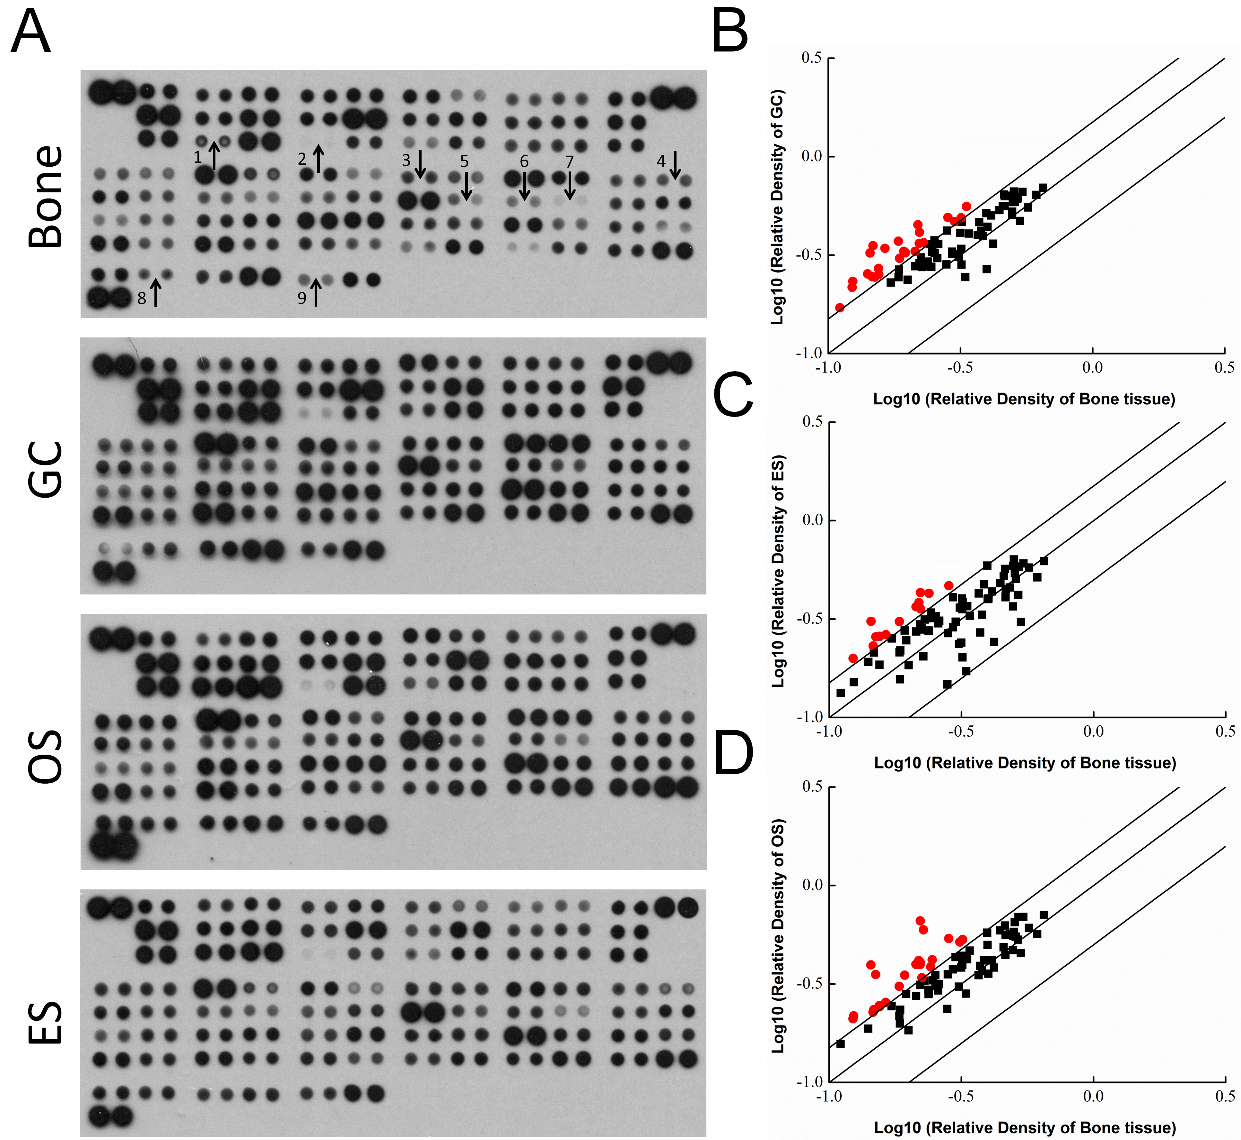
Table 1
The quantitative outcome of proteome profiling analysis
| Coordinate and target | Human bone cancer | ||||||||
|---|---|---|---|---|---|---|---|---|---|
| Pixel density | Pixel density | Pixel density | |||||||
| Bone | GC | Fold | Bone | OS | Fold | Bone | ES | Fold | |
| 0.5315 | 0.4710 | 0.8861 | 0.5315 | 0.4532 | 0.8527 | 0.5315 | 0.3052 | 0.5742 | |
| Amphiregulin | 0.2799 | 0.2833 | 1.0122 | 0.2799 | 0.2362 | 0.8438 | 0.2799 | 0.1470 | 0.5253 |
| Angiopoietin-1 | 0.4206 | 0.3612 | 0.8588 | 0.4206 | 0.3826 | 0.9097 | 0.4206 | 0.2418 | 0.5749 |
| Angiopoietin-like 4 | 0.2940 | 0.3199 | 1.0881 | 0.2940 | 0.3752 | 1.2764 | 0.2940 | 0.2867 | 0.9753 |
| ENPP-2/Autotaxin | 0.3787 | 0.4206 | 1.1105 | 0.3787 | 0.3667 | 0.9683 | 0.3787 | 0.3324 | 0.8778 |
| Axl | 0.3725 | 0.4648 | 1.2478 | 0.3725 | 0.3906 | 1.0487 | 0.3725 | 0.2698 | 0.7242 |
| BCL-x | 0.1549 | 0.2706 | 1.7477 | 0.1549 | 0.2456 | 1.5858 | 0.1549 | 0.1854 | 1.1970 |
| CA125/MUC16 | 0.1853 | 0.2668 | 1.4401 | 0.1853 | 0.1989 | 1.0735 | 0.1853 | 0.1563 | 0.8433 |
| E-Cadherin | 0.1998 | 0.2369 | 1.1859 | 0.1998 | 0.1837 | 0.9196 | 0.1998 | 0.1842 | 0.9222 |
| VE-Cadherin | 0.4004 | 0.4407 | 1.1005 | 0.4004 | 0.3562 | 0.8895 | 0.4004 | 0.4023 | 1.0047 |
| CapG | 0.6496 | 0.6951 | 1.0700 | 0.6496 | 0.7081 | 1.0901 | 0.6496 | 0.6221 | 0.9577 |
| Carbonic Anhydrase IX | 0.3400 | 0.4066 | 1.1959 | 0.3400 | 0.4670 | 1.3737 | 0.3400 | 0.3287 | 0.9668 |
| Cathepsin B | 0.4652 | 0.6291 | 1.3522 | 0.4652 | 0.5599 | 1.2034 | 0.4652 | 0.4500 | 0.9674 |
| Cathepsin D | 0.3159 | 0.4098 | 1.2969 | 0.3159 | 0.3828 | 1.2116 | 0.3159 | 0.2396 | 0.7585 |
| Cathepsin S | 0.6129 | 0.6389 | 1.0423 | 0.6129 | 0.5664 | 0.9242 | 0.6129 | 0.5147 | 0.8398 |
| CEACAM-5 | 0.3299 | 0.2445 | 0.7411 | 0.3299 | 0.2824 | 0.8559 | 0.3299 | 0.1717 | 0.5204 |
| Decorin | 0.4444 | 0.5346 | 1.2029 | 0.4444 | 0.5913 | 1.3305 | 0.4444 | 0.4810 | 1.0823 |
| Dkk-1 | 0.3194 | 0.2831 | 0.8864 | 0.3194 | 0.3948 | 1.2361 | 0.3194 | 0.2019 | 0.6322 |
| DLL1 | 0.3098 | 0.3190 | 1.0297 | 0.3098 | 0.3061 | 0.9882 | 0.3098 | 0.2360 | 0.7617 |
| EGF R/ErbB1 | 0.4644 | 0.5608 | 1.2076 | 0.4644 | 0.4435 | 0.9552 | 0.4644 | 0.4071 | 0.8766 |
| Endoglin/CD105 | 0.5034 | 0.6648 | 1.3207 | 0.5034 | 0.6510 | 1.2932 | 0.5034 | 0.5398 | 1.0723 |
| Endostatin | 0.2211 | 0.4132 | 1.8686 | 0.2211 | 0.6611 | 2.9901 | 0.2211 | 0.4305 | 1.9471 |
| Enolase 2 | 0.5429 | 0.6614 | 1.2183 | 0.5429 | 0.6916 | 1.2738 | 0.5429 | 0.6056 | 1.1154 |
| eNOS | 0.0152 | 0.0485 | 3.1989 | 0.0152 | 0.0390 | 2.5731 | 0.0152 | 0.0167 | 1.1017 |
| EpCAM/TROP1 | 0.2271 | 0.2748 | 1.2103 | 0.2271 | 0.5950 | 2.6202 | 0.2271 | 0.2043 | 0.8995 |
| ER | 0.1106 | 0.1709 | 1.5458 | 0.1106 | 0.1569 | 1.4191 | 0.1106 | 0.1333 | 1.2051 |
| ErbB2 | 0.2423 | 0.3591 | 1.4819 | 0.2423 | 0.3866 | 1.5955 | 0.2423 | 0.3409 | 1.4067 |
| ErbB3/Her3 | 0.2214 | 0.2869 | 1.2959 | 0.2214 | 0.3128 | 1.4132 | 0.2214 | 0.2798 | 1.2638 |
| ErbB4 | 0.2374 | 0.2831 | 1.1925 | 0.2374 | 0.2951 | 1.2428 | 0.2374 | 0.2766 | 1.1651 |
| FGF basic | 0.2939 | 0.3293 | 1.1205 | 0.2939 | 0.3750 | 1.2757 | 0.2939 | 0.4072 | 1.3855 |
| FoxC2 | 0.2454 | 0.2758 | 1.1238 | 0.2454 | 0.4201 | 1.7116 | 0.2454 | 0.3193 | 1.3009 |
| FoxO1/FKHR | 0.2212 | 0.2819 | 1.2741 | 0.2212 | 0.4061 | 1.8355 | 0.2212 | 0.3569 | 1.6132 |
| Galectin-3 | 0.5207 | 0.6192 | 1.1893 | 0.5207 | 0.6902 | 1.3255 | 0.5207 | 0.5839 | 1.1214 |
| GM-CSF | 0.2207 | 0.3628 | 1.6439 | 0.2207 | 0.3970 | 1.7990 | 0.2207 | 0.2968 | 1.3450 |
| CG | 0.3179 | 0.4892 | 1.5386 | 0.3179 | 0.4394 | 1.3821 | 0.3179 | 0.4020 | 1.2645 |
| HGF R/c-Met | 0.1238 | 0.2326 | 1.8787 | 0.1238 | 0.2180 | 1.7613 | 0.1238 | 0.1511 | 1.2209 |
| HIF-1 | 0.2130 | 0.3309 | 1.5537 | 0.2130 | 0.3975 | 1.8665 | 0.2130 | 0.3650 | 1.7138 |
| HNF-3 | 0.1931 | 0.3310 | 1.7147 | 0.1931 | 0.3502 | 1.8141 | 0.1931 | 0.2764 | 1.4316 |
| HO-1/HMOX1 | 0.4575 | 0.5601 | 1.2242 | 0.4575 | 0.4856 | 1.0614 | 0.4575 | 0.5229 | 1.1429 |
| ICAM-1/CD54 | 0.3331 | 0.5586 | 1.6771 | 0.3331 | 0.4221 | 1.2671 | 0.3331 | 0.3671 | 1.1020 |
| IL-2 R | 0.1475 | 0.3530 | 2.3926 | 0.1475 | 0.2347 | 1.5908 | 0.1475 | 0.2134 | 1.4461 |
| IL-6 | 0.1231 | 0.2172 | 1.7644 | 0.1231 | 0.2108 | 1.7120 | 0.1231 | 0.1995 | 1.6203 |
| CXCL8/IL-8 | 0.3853 | 0.3955 | 1.0264 | 0.3853 | 0.4165 | 1.0809 | 0.3853 | 0.4737 | 1.2293 |
| IL-18 BPa | 0.2475 | 0.3282 | 1.3261 | 0.2475 | 0.3300 | 1.3334 | 0.2475 | 0.3256 | 1.3158 |
| Kallikrein 3/PSA | 0.1958 | 0.3248 | 1.6589 | 0.1958 | 0.2810 | 1.4352 | 0.1958 | 0.2466 | 1.2594 |
| Kallikrein 5 | 0.1406 | 0.2541 | 1.8066 | 0.1406 | 0.1873 | 1.3318 | 0.1406 | 0.1915 | 1.3616 |
| Kallikrien 6 | 0.1859 | 0.3047 | 1.6386 | 0.1859 | 0.2338 | 1.2572 | 0.1859 | 0.2189 | 1.1775 |
| Leptin | 0.2610 | 0.3607 | 1.3822 | 0.2610 | 0.3159 | 1.2104 | 0.2610 | 0.3096 | 1.1863 |
| Lumican | 0.4997 | 0.5868 | 1.1743 | 0.4997 | 0.5816 | 1.1638 | 0.4997 | 0.6347 | 1.2700 |
| CCL2/MCP-1 | 0.1551 | 0.2527 | 1.6290 | 0.1551 | 0.2423 | 1.5620 | 0.1551 | 0.2584 | 1.6655 |
| CCL8/MCP-2 | 0.1841 | 0.3724 | 2.0226 | 0.1841 | 0.3079 | 1.6723 | 0.1841 | 0.3072 | 1.6687 |
|
Table 1, continued | |||||||||
|---|---|---|---|---|---|---|---|---|---|
| Coordinate and target | Human bone cancer | ||||||||
| Pixel density | Pixel density | Pixel density | |||||||
| Bone | GC | Fold | Bone | OS | Fold | Bone | ES | Fold | |
| CCL7/MCP-3 | 0.0838 | 0.2445 | 2.9168 | 0.0838 | 0.1640 | 1.9571 | 0.0838 | 0.1544 | 1.8417 |
| M-CSF | 0.2811 | 0.4209 | 1.4975 | 0.2811 | 0.3534 | 1.2573 | 0.2811 | 0.2680 | 0.9535 |
| Mesothelin | 0.3187 | 0.3405 | 1.0682 | 0.3187 | 0.4094 | 1.2846 | 0.3187 | 0.3544 | 1.1121 |
| CCL3/MIP-1 | 0.1725 | 0.2294 | 1.3298 | 0.1725 | 0.2438 | 1.4134 | 0.1725 | 0.2516 | 1.4585 |
| CCL20/MIP-3 | 0.2383 | 0.2796 | 1.1731 | 0.2383 | 0.2870 | 1.2040 | 0.2383 | 0.4270 | 1.7916 |
| MMP-2 | 0.3197 | 0.4665 | 1.4589 | 0.3197 | 0.5317 | 1.6629 | 0.3197 | 0.3846 | 1.2027 |
| MMP-3 | 0.3680 | 0.4005 | 1.0885 | 0.3680 | 0.3500 | 0.9511 | 0.3680 | 0.4258 | 1.1572 |
| MMP-9 | 0.4959 | 0.5057 | 1.0197 | 0.4959 | 0.4692 | 0.9461 | .4959 | 0.3664 | 0.7389 |
| MSP/MST1 | 0.4966 | 0.5255 | 1.0582 | 0.4966 | 0.5536 | 1.1148 | 0.4966 | 0.5881 | 1.1843 |
| MUC-1 | 0.2525 | 0.3246 | 1.2854 | 0.2525 | 0.3097 | 1.2264 | 0.2525 | 0.3265 | 1.2931 |
| Nectin-4 | 0.2297 | 0.3655 | 1.5914 | 0.2297 | 0.3287 | 1.4312 | 0.2297 | 0.3139 | 1.3667 |
| Osteopontin (OPN) | 0.4624 | 0.6422 | 1.3887 | 0.4624 | 0.6254 | 1.3524 | 0.4624 | 0.5678 | 1.2278 |
| p27/Kip1 | 0.2184 | 0.4515 | 2.0675 | 0.2184 | 0.4161 | 1.9055 | 0.2184 | 0.3832 | 1.7550 |
| p53 | 0.2524 | 0.3758 | 1.4886 | 0.2524 | 0.3504 | 1.3881 | 0.2524 | 0.3261 | 1.2918 |
| PDGF-AA | 0.1638 | 0.3425 | 2.0908 | 0.1638 | 0.2551 | 1.5572 | 0.1638 | 0.2637 | 1.6102 |
| CD31/PECAM-1 | 0.5083 | 0.5883 | 1.1573 | 0.5083 | 0.5495 | 1.0810 | 0.5083 | 0.5050 | 0.9934 |
| Progesterone R/NR3C3 | 0.2136 | 0.2776 | 1.2997 | 0.2136 | 0.2748 | 1.2867 | 0.2136 | 0.2733 | 1.2798 |
| Progranulin | 0.4824 | 0.6325 | 1.3112 | 0.4824 | 0.5656 | 1.1725 | 0.4824 | 0.4572 | 0.9477 |
| Prolactin | 0.2379 | 0.2927 | 1.2301 | 0.2379 | 0.2806 | 1.1796 | 0.2379 | 0.2744 | 1.1532 |
| Prostasin/Prss8 | 0.2586 | 0.3054 | 1.1810 | 0.2586 | 0.2928 | 1.1325 | 0.2586 | 0.3003 | 1.1615 |
| E-Selectin/CD62E | 0.1844 | 0.2442 | 1.3242 | 0.1844 | 0.2179 | 1.1819 | 0.1844 | 0.2137 | 1.1591 |
| Serpin B5/Maspin | 0.1465 | 0.2456 | 1.6762 | 0.1465 | 0.2275 | 1.5525 | 0.1465 | 0.2309 | 1.5753 |
| Serpin E1/PAI-1 | 0.4135 | 0.5023 | 1.2148 | 0.4135 | 0.4162 | 1.0065 | .4135 | 0.4362 | 1.0550 |
| Snail | 0.1439 | 0.3246 | 2.2561 | 0.1439 | 0.3954 | 2.7479 | 0.1439 | 0.3078 | 2.1391 |
| SPARC | 0.2836 | 0.4913 | 1.7323 | 0.2836 | 0.5386 | 1.8991 | 0.2836 | 0.4668 | 1.6460 |
| Survivin | 0.3121 | 0.3099 | 0.9931 | 0.3121 | 0.5164 | 1.6548 | 0.3121 | 0.3616 | 1.1587 |
| Tenascin C | 0.5702 | 0.5517 | 0.9674 | 0.5702 | 0.6083 | 1.0668 | 0.5702 | 0.5771 | 1.0120 |
| Thrombospondin-1 | 0.3978 | 0.2685 | 0.6749 | 0.3978 | 0.4985 | 1.2532 | 0.3978 | 0.3991 | 1.0034 |
| Tie-2 | 0.2242 | 0.3077 | 1.3721 | 0.2242 | 0.3408 | 1.5196 | 0.2242 | 0.2826 | 1.2603 |
| Urokinase | 0.3009 | 0.4679 | 1.5550 | 0.3009 | 0.4330 | 1.4390 | 0.3009 | 0.3064 | 1.0181 |
| VCAM-1/CD106 | 0.5195 | 0.6079 | 1.1700 | 0.5195 | 0.5308 | 1.0216 | 0.5195 | 0.4191 | 0.8066 |
| VEGF | 0.1499 | 0.2448 | 1.6330 | 0.1499 | 0.3535 | 2.3582 | 0.1499 | 0.2572 | 1.7157 |
| Vimentin | 0.3964 | 0.5168 | 1.3037 | 0.3964 | 0.5758 | 1.4524 | 0.3964 | 0.5898 | 1.4878 |
3.Results
3.1Analysis of the expression levels of bone cancer-related protein in clinical samples
To systematically determine the potential factors that are relevant to carcinogenesis of bone, proteome profiling analysis was used to detect cancer-related protein levels on OS, GC and ES tissues (Fig. 1A). Compared with the normal bone tissues, the enhanced factors in OS, GC and ES were summarized in Table 1. As shown in Fig. 1B, compared with normal bone tissues, 26 factors significantly increased in GC tissues, and they were BCL-x, endostatin, eNOS, ER
Figure 2.
Higher levels of tumor-associated cytokines in GC, OS or ES clinical samples. A. MCP1, MCP2, MCP3 and IL-6 were determined by Western blot. MCP1 (B), MCP2 (C) and MCP3 (D) levels in GC, OS and ES are significantly higher than the bone samples, and IL-6 significantly increased in OS and ES (E). The data are shown as the means
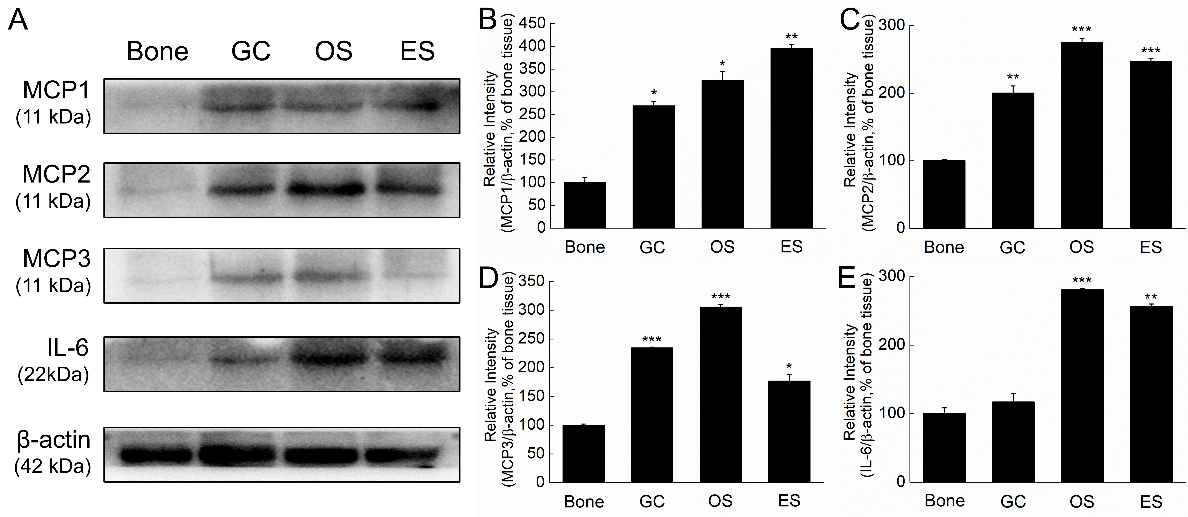
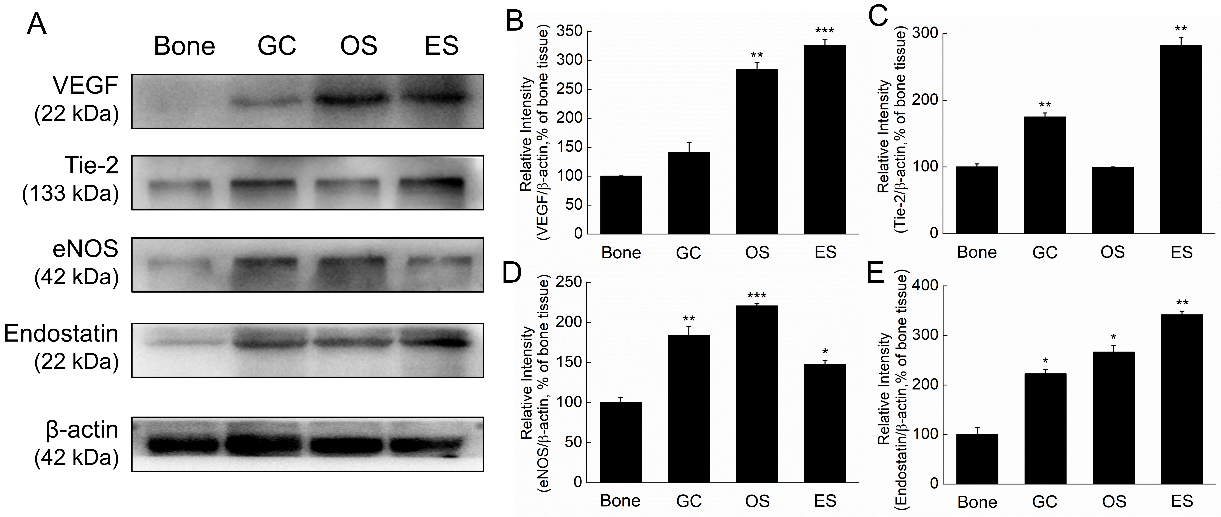
Figure 3.
Expression levels of angiogenesis and anti-angiogenesis protein in GC, OS and ES clinical tissues. A. VEGF, Tie-2, eNOS, endostatin and HIF-1
3.2Higher cytokines levels in GC, OS and ES clinical samples
Four cytokines including MCP1, MCP2, MCP3 and IL-6 in GC, OS and ES tissues were determined by western blot. Our results showed that MCP1, MCP2 and MCP3 levels were all significantly higher than the normal bone tissues (Fig. 2A). The data was consistent to the proteome profiling analysis. ES tissue expressed higher MCP1 than GC and OS, and OS expressed higher MCP2 and MCP3 than GC and ES. Different from the proteome profiling analysis, IL-6 levels only significantly increased in OS and ES samples, but not in GC (Fig. 2A). Expression of MCP1 level in ES was higher than GC and OS (Fig. 2B), and OS tissues expressed higher levels of MCP2, MCP3 and IL-6 (Fig. 2C and D). Comparing to OS and ES samples, GC expressed lowest MCP1, MCP2 and IL-6 (Fig. 2B, C and E).
3.3Expression of angiogenesis and anti-angiogenesis factors in GC, OS and ES clinical samples
To compare the metastasis ability between the three bone tumors, expression levels of pro-angiogenic and anti-angiogenic factors were further determined by Western blot (Figs 2A and 3A).
Among the three bone tumors, ES and OS tissues expressed significantly higher levels of VEGF than the normal samples, but no significant difference was observed between GC and the control (Fig. 3B). For Tie-2, higher levels in GC and ES tissue were observed, but no significantly difference was shown between OS and normal tissues (Fig. 3C). Additionally, both eNOS and endostatin levels in the three bone tumor samples were significantly higher than the normal tissues (Fig. 3D and E). However, no significant difference was determined between the three bone tumors and the normal tissues (Fig. 3F).
Based on the data, the pro-angiogenic factors containing VEGF, eNOS and Tie-2 increased in the bone tumor samples with the increase of anti-angiogenic factors endostatin. In GC sample, Tie-2, eNOS and endostatin levels were higher than the control, but not VEGF (Fig. 3B–E). In OS tissues, the expression levels of VEGF, eNOS and endostatin significantly increased, but not Tie-2 (Fig. 3B–E). In ES sample, the factors including VEGF, Tie-2, eNOS and endostatinwere all significantly enhanced (Fig. 3B–E).
4.Discussion and conclusion
Invasive tumor metastasis is based on angiogenesis which constitutes an important factor in cancer progression [11]. VEGF is a master regulator of angiogenesis which has many functions including stimulation of vasculogenesis, inflammation, and vascular permeability [12]. HIF-1
Other significantly increased molecules responsible for angiogenesis containing eNOS, endostatinand Tie-2 have been found in the bone tumor samples. Nitric oxide (NO) that is predominantly synthesized by eNOS in vascular endothelial cells promotes angiogenesis directly and functions both upstream and downstream of angiogenic stimuli [16]. On the contrary, endostatin is one of the most widely studied endogenous angiogenesis inhibitors [17]. Though recombinant human endostatin have been used as a drug treating non-small cell lung cancer, why tumors produce more endostatin and how tumor-derived endostatin act on tumor progression is still vague. Tie-2 also plays an important role in vascular development and maintenance and interacts with angiopoietins [18]. Overall, angiogenesis is tightly controlled by pro-angiogenic and anti-angiogenic regulators to maintain the dynamic homeostasis [19].
Tumor-associated inflammatory cytokines are closely associated with the progression of bone tumor, several cytokines were selected and further analyzed in GC, OS and ES clinical samples. Monocyte chemoattractant proteins (MCPs), all belong to CC chemokines, were initially identified as regulators of leukocyte trafficking, they play critical roles in numerous pathological process such as cancer progression [20]. MCP1, a member of MCPs also known as chemokine ligand 2 (CCL2), is an important proinflammatory cytokine involving a variety of inflammatory response and promoting tumor proliferation, invasion and metastasis. Blockage of MCP1 could attenuate the progression of multiply of cancers [21]. The invasion activity of prostate cancer cells co-cultured with monocyte-lineage cells increased by the MCP1 [22]. It has been reported that osteolysis mediated by OS could be inhibited by attenuation of tumor expression of MCP-1 and RANKL in vivo mouse model [23]. Similar to our results, it has been reported that MCP-1 are significantly increased in GC patients’ serum [24]. MCP2 induced the migration and invasion of tumor cells in vitro through NF-
Authors’ contributions
Guirong Zhang designed the study, BoDou, Tianrui Chen and Qiubo Chu performed the experiments and analyzed data, and Zhaoli Meng wrote and edited the manuscript. All authors read and approved the final manuscript.
Ethics approval and consent to participate
The research protocol was approved by the Ethics Committee of the Second Military Medical University, and written informed consent was obtained from all participants. All methods were performed in accordance with the relevant guidelines.
Acknowledgments
The study is supported by The National Natural Science Foundation of China (grant no. 81702849) and Jilin Province Science and Technology Department of Natural Science Project (no. 20200201605JC).
Conflict of interest
The authors confirm that they have no competing interest.
References
[1] | Palmerini E, Picci P, Reichardt P, Downey G. Malignancy in giant cell tumor of bone: a review of the literature. Technol Cancer Res Treat. (2019) ; 18: : 1533033819840000. doi: 10.1177/1533033819840000. |
[2] | Wu C, Wang Q, Li Y. Prediction and evaluation of neoadjuvant chemotherapy using the dual mechanisms of (99m)Tc-MIBI scintigraphy in patients with osteosarcoma. J Bone Oncol. (2019) ; 17: : 100250. doi: 10.1016/j.jbo.2019.100250. |
[3] | Gupta R, Seethalakshmi V, Jambhekar NA, Prabhudesai S, Merchant N, Puri A, et al. Clinicopathologic profile of 470 giant cell tumors of bone from a cancer hospital in western India. Ann Diagn Pathol. (2008) ; 12: (4): 239–48. doi: 10.1016/j.anndiagpath.2007.09.002. |
[4] | Lau YS, Sabokbar A, Gibbons CL, Giele H, Athanasou N. Phenotypic and molecular studies of giant-cell tumors of bone and soft tissue. Hum Pathol. (2005) ; 36: (9): 945–54. doi: 10.1016/j.humpath.2005.07.005. |
[5] | Kumta SM, Huang L, Cheng YY, Chow LTC, Lee KM, Zheng MH. Expression of VEGF and MMP-9 in giant cell tumor of bone and other osteolytic lesions. Life Sci. (2003) ; 73: (11): 1427–36. doi: 10.1016/s0024-3205(03)00434-x. |
[6] | Karkare S, Allen KJH, Jiao R, Malo ME, Dawicki W, Helal M, et al. Detection and targeting insulin growth factor receptor type 2 (IGF2R) in osteosarcoma PDX in mouse models and in canine osteosarcoma tumors. Sci Rep. (2019) ; 9: (1): 11476. doi: 10.1038/s41598-019-47808-y. |
[7] | Salvatore V, Focaroli S, Teti G, Mazzotti A, Falconi M. Changes in the gene expression of co-cultured human fibroblast cells and osteosarcoma cells: the role of microenvironment. Oncotarget. (2015) ; 6: (30): 28988–98. doi: 10.18632/oncotarget.4902. |
[8] | Zhou S. TGF-beta regulates beta-catenin signaling and osteoblast differentiation in human mesenchymal stem cells. J Cell Biochem. (2011) ; 112: (6): 1651–60. doi: 10.1002/jcb.23079. |
[9] | Iwamoto Y. Diagnosis and treatment of Ewing’s sarcoma. Jpn J Clin Oncol. (2007) ; 37: (2): 79–89. doi: 10.1093/jjco/hyl142. |
[10] | Zhu L, McManus MM, Hughes DP. Understanding the biology of bone sarcoma from early initiating events through late events in metastasis and disease progression. Front Oncol. (2013) ; 3: : 230. doi: 10.3389/fonc.2013.00230. |
[11] | Xie L, Ji T, Guo W. Anti-angiogenesis target therapy for advanced osteosarcoma (Review). Oncol Rep. (2017) ; 38: (2): 625–36. doi: 10.3892/or.2017.5735. |
[12] | Mazure NM, Chen EY, Yeh P, Laderoute KR, Giaccia AJ. Oncogenic transformation and hypoxia synergistically act to modulate vascular endothelial growth factor expression. Cancer Res. (1996) ; 56: (15): 3436–40. |
[13] | Kong D, Park EJ, Stephen AG, Calvani M, Cardellina JH, Monks A, et al. Echinomycin, a small-molecule inhibitor of hypoxia-inducible factor-1 DNA-binding activity. Cancer Res. (2005) ; 65: (19): 9047–55. doi: 10.1158/0008-5472. |
[14] | Liu Y, Zhang F, Zhang Z, Wang D, Cui B, Zeng F, et al. High expression levels of Cyr61 and VEGF are associated with poor prognosis in osteosarcoma. Pathol Res Pract. (2017) ; 213: (8): 895–9. doi: 10.1016/j.prp.2017.06.004. |
[15] | Wu Z, Yin H, Liu T, Yan W, Li Z, Chen J, et al. MiR-126-5p regulates osteoclast differentiation and bone resorption in giant cell tumor through inhibition of MMP-13. Biochem Bioph Res Co. (2014) ; 443: (3): 944–9. doi: 10.1016/j.bbrc.2013.12.075. |
[16] | Fukumura D, Kashiwagi S, Jain RK. The role of nitric oxide in tumour progression. Nat Rev Cancer. (2006) ; 6: (7): 521–34. doi: 10.1038/nrc1910. |
[17] | O’Reilly MS, Boehm T, Shing Y, Fukai N, Vasios G, Lane WS, et al. Endostatin: an endogenous inhibitor of angiogenesis and tumor growth. Cell. (1997) ; 88: (2): 277–85. doi: 10.1016/s0092-8674(00)81848-6. |
[18] | Hansen TM, Singh H, Tahir TA, Brindle NP. Effects of angiopoietins-1 and -2 on the receptor tyrosine kinase Tie2 are differentially regulated at the endothelial cell surface. Cell Signal. (2010) ; 22: (3): 527–32. doi: 10.1016/j.cellsig.2009.11.007. |
[19] | Ribatti D, Nico B, Crivellato E, Roccaro AM, Vacca A. The history of the angiogenic switch concept. Leukemia. (2007) ; 21: (1): 44–52. doi: 10.1038/sj.leu.2404402. |
[20] | Chen Q, Sun W, Liao Y, Zeng H, Shan L, Yin F, et al. Monocyte chemotactic protein-1 promotes the proliferation and invasion of osteosarcoma cells and upregulates the expression of AKT. Mol Med Rep. (2015) ; 12: (1): 219–25. doi: 10.3892/mmr.2015.3375. |
[21] | An J, Xue Y, Long M, Zhang G, Zhang J, Su H. Targeting CCR2 with its antagonist suppresses viability, motility and invasion by downregulating MMP-9 expression in non-small cell lung cancer cells. Oncotarget. (2017) ; 8: (24): 39230–40. doi: 10.18632/oncotarget.16837. |
[22] | Lindholm PF, Sivapurapu N, Jovanovic B, Kajdacsy-Balla A. Monocyte-induced prostate cancer cell invasion is mediated by chemokine ligand 2 and nuclear factor-kappab activity. J Clin Immunol. (2015) ; 6: (2). doi: 10.4172/2155-9899.1000308. |
[23] | Ohba T, Cole HA, Cates JM, Slosky DA, Haro H, Ando T, et al. Bisphosphonates inhibit osteosarcoma-mediated osteolysis via attenuation of tumor expression of MCP-1 and RANKL. J Bone Miner Res. (2014) ; 29: (6): 1431–45. doi: 10.1002/jbmr.2182. |
[24] | Xu L, Luo J, Jin R, Yue Z, Sun P, Yang Z, et al. Bortezomib inhibits giant cell tumor of bone through induction of cell apoptosis and inhibition of osteoclast recruitment, giant cell formation, and bone resorption. Mol Cancer Ther. (2016) ; 15: (5): 854–65. doi: 10.1158/1535-7163. |
[25] | Zhou J, Zheng S, Liu T, Liu Q, Chen Y, Tan D, et al. MCP2 activates NF-kappaB signaling pathway promoting the migration and invasion of ESCC cells. Cell Biol Int. (2018) ; 42: (3): 365–72. doi: 10.1002/cbin.10909. |
[26] | Murray Peter J, Allen Judith E, Biswas Subhra K, Fisher Edward A, Gilroy Derek W, Goerdt S, et al. Macrophage activation and polarization: nomenclature and experimental guidelines. Immunity. (2014) ; 41: (1): 14–20. doi: 10.1016/j.immuni.2014.06.008. |
[27] | Lee YS, Kim SY, Song SJ, Hong HK, Lee Y, Oh BY, et al. Crosstalk between CCL7 and CCR3 promotes metastasis of colon cancer cells via ERK-JNK signaling pathways. Oncotarget. (2016) ; 7: (24): 36842–53. doi: 10.18632/oncotarget.9209. |
[28] | Rose-John S. Interleukin-6 family cytokines. Csh Perspect Biol. (2018) ; 10: (2). doi: 10.1101/cshperspect.a028415. |
[29] | Huang Q, Duan L, Qian X, Fan J, Lv Z, Zhang X, et al. IL-17 promotes angiogenic factors IL-6, IL-8, and vegf production via stat1 in lung adenocarcinoma. Sci Rep. (2016) ; 6: : 36551. doi: 10.1038/srep36551. |
[30] | Kong G, Jiang Y, Sun X, Cao Z, Zhang G, Zhao Z, et al. Irisin reverses the IL-6 induced epithelial-mesenchymal transition in osteosarcoma cell migration and invasion through the STAT3/Snail signaling pathway. Oncol Rep. (2017) ; 38: (5): 2647–56. doi: 10.3892/or.2017.5973. |


