
The design of a lumped parameter model considering the stimulus path of round window
Abstract
BACKGROUND:
Sound normally enters the ear canal, passes through the middle ear, and stimulates the cochlea through the oval window. Alternatively, the cochlea can be stimulated in a reverse manner, namely round window stimulation. The reverse stimulation is not well understood, partly because in classic lumped-parameter models the path of reverse drive during the round window stimulation is usually not considered.
OBJECTIVE:
The study goal is to gain a better understanding of the hearing mechanism during round window stimulation.
METHODS:
A piezo actuator was coupled to the oval and round window of the guinea pigs. The auditory brainstem response produced by the forward and reverse stimulation at four frequencies was recorded.
RESULTS:
The results show that the input voltage of the actuator required at the hearing threshold in the round window drive was higher than that in the oval window drive. In order to understand the data, we designed a lumped-parameter cochlear model that can simulate both forward and reverse drive. The model-predicted results were consistent with the experimental results.
CONCLUSIONS:
The response of the auditory system to stimulus of oval window and round window was quantified through animal experimentation, and guinea pigs were used as experimental animals. When the same stimulus was applied to the oval window and round window of the cochlea, the ABR signals were compared. A lumped parameter model was designed to incorporate the sound transmission paths in both oval and round window stimulation. The simulated results are consistent with those of animal experiments. This model will be useful in understanding the inner-ear response in round window.
1.Introduction
Middle ear implantable hearing devices (MEIHDs) are gradually gaining attention as hearing aids for sensorineural hearing loss. Therefore, in order to overcome the limitations of conventional hearing aids such as feedback and occlusion effect, MEIHDs of various types are being studied [1, 2, 3]. In the ears with MEIHDS the vibration transducer is in general coupled to one of the ossicles and thereby stimulates the oval window in a manner similar to air conduction. However, it is difficult to stimulate the oval window when the transducer is difficult to implant due to abnormal ossicles and loss of ossicles [4, 5]. In those cases, the round window is the alternative location to anchor the transducer and couple the vibration to the cochlea. Recently, this method has been studied by several groups [6, 7, 8].
The performance of any middle ear implantable device has to be evaluated before putting into patients. For the oval window driving MEIHDs, performance evaluation standard is specified in ASTM standard F2504-05 [9]. In order to conduct performance evaluation of round window driving MEIHDs, the same standard has been used because it is assumed that the cochlear responses generated by oval window and round window stimuli are similar [10]. However, it is unclear whether the ASTM standard is an accurate criterion for evaluating the performance of the round window driving devices. Moreover, most existing parameter models did not consider the path of the round window stimulation because it was assumed that the cochlear response was the same when oval window was stimulated [11]. However, this theory needs to be tested by comparing the auditory neural response when the similar stimulus is applied to both oval window and round window. One way to quantify the auditory neural response is to measure the auditory brainstem response (ABR) [12].
The goal of the present study is to gain a better understanding of the hearing mechanism during round window stimulation. The ABRs evoked by oval window and round window stimulation at various levels were measured in the guinea pigs. A lumped-parameter model that included the stimulus path of round window as well as the stimulus path of the oval window was designed and analyzed. The model-predicted results were compared with the experimental data.
2.Method
2.1Animal experiments to measure ABR
In order to study the difference in the inner ear response between the oval and round window stimulation, ABRs in response to those two stimuli were measured in four guinea pigs. The experimental setup and the schematic diagram for ABR measurement are shown in Fig. 1. As shown in Fig. 1, a coupling rod was attached to the end of the piezoelectric transducer (PZT); vibration was applied to each of the oval and round window. The specifications of used PZT (Morgan Electro Ceramics, UK) and coupling rod are given in Table 1 [7]. As shown in Fig. 1a, the middle ear cavity was opened for insertion of the piezo actuator. In order to mechanically drive the oval and round window, the connection between the incus and the stapes was disrupted. The PZT actuator was coupled to the oval window through the stapes. In this case, the transmitting force to the stapes could be affected by the tip size and approaching angle. Therefore, round window niche was sufficiently drilled out for securing contact area and approaching angle between tip and round window was adjusted with micro-manipulator. As shown in Fig. 1b, the experiment environment consists of the TDT system 3 (Tucker-Davis Technologies, USA), three needle-electrode, the PZT, and the manipulator. In addition, the animal experiment was performed in a sound chamber that excluded external vibrations and noise. The three electrodes were attached at mastoid, left hind leg and crown of the head, which correspond to negative, ground, and positive terminals, respectively. The PZT was pressed gently against the oval and round window by using the micromanipulator. The tone-buster signal which is generated by the TDT system is applied to the PZT to generate a vibration stimulus. The initial voltage was set to 9 V due to the TDT equipment with a maximum output voltage of 10 V, a voltage which gradually decreases in 5 dB steps was applied to the PZT. The frequencies of the applied signal were 2, 4, 8 and 16 kHz. The same set of voltages was supplied to PZT in both oval-and round-window stimulations. Figure 2 shows the ABR waveforms in response to forward and reverse drive at various levels and frequencies measured in four guinea pigs.
Table 1
The specifications of PZT and coupling rod [7]
| Specification | PZT (sk4748-2) | Coupling rod |
|---|---|---|
| Value | Value | |
| Dimensions (mm) | 1.0 | 0.3 |
| Material | PZT506 (PXE55) | Titanium |
| Dielectric thickness ( | 20 | |
| Number of layers | 90 | – |
| Average capacitance (nF) | 27.5 (@ 120 Hz, 1.0 V, | – |
The ABR thresholds of the four guinea pigs differ depending on the frequency and the stimulus directions. Therefore, the ABR thresholds were discerned with the help of the ear, nose and throat (ENT) doctor. The voltage applied to PZT at the discerned ABR thresholds is shown in Table 2. The input voltages to the actuator at the hearing thresholds during round window stimulation were in general greater than those during the oval window stimulation.
Table 2
The voltage applied at the hearing threshold level for stimulus direction
| Measure | The voltage applied at the hearing threshold level (oval window stimulus) | The voltage applied at the hearing threshold level (round window stimulus) | ||||||
|---|---|---|---|---|---|---|---|---|
| 2 kHz | 4 kHz | 8 kHz | 16 kHz | 2 kHz | 4 kHz | 8 kHz | 16 kHz | |
| Guinea-pig I | 0.090 V | 0.051 V | 0.009 V | 0.051 V | 0.090 V | 0.160 V | 0.090 V | 0.285 V |
| Guinea-pig II | 0.051 V | 0.160 V | 0.090 V | 0.160 V | 0.506 V | 0.285 V | 0.160 V | 0.900 V |
| Guinea-pig III | 0.051 V | 0.016 V | 0.005 V | 0.051 V | 0.090 V | 0.028 V | 0.090 V | 0.900 V |
| Guinea-pig IV | 0.090 V | 0.009 V | 0.016 V | 0.285 V | 0.090 V | 0.160 V | 0.051 V | 1.600 V |
Figure 1.
(a) Schematic diagram for ABR measurement (b) Animal experimentation environment.
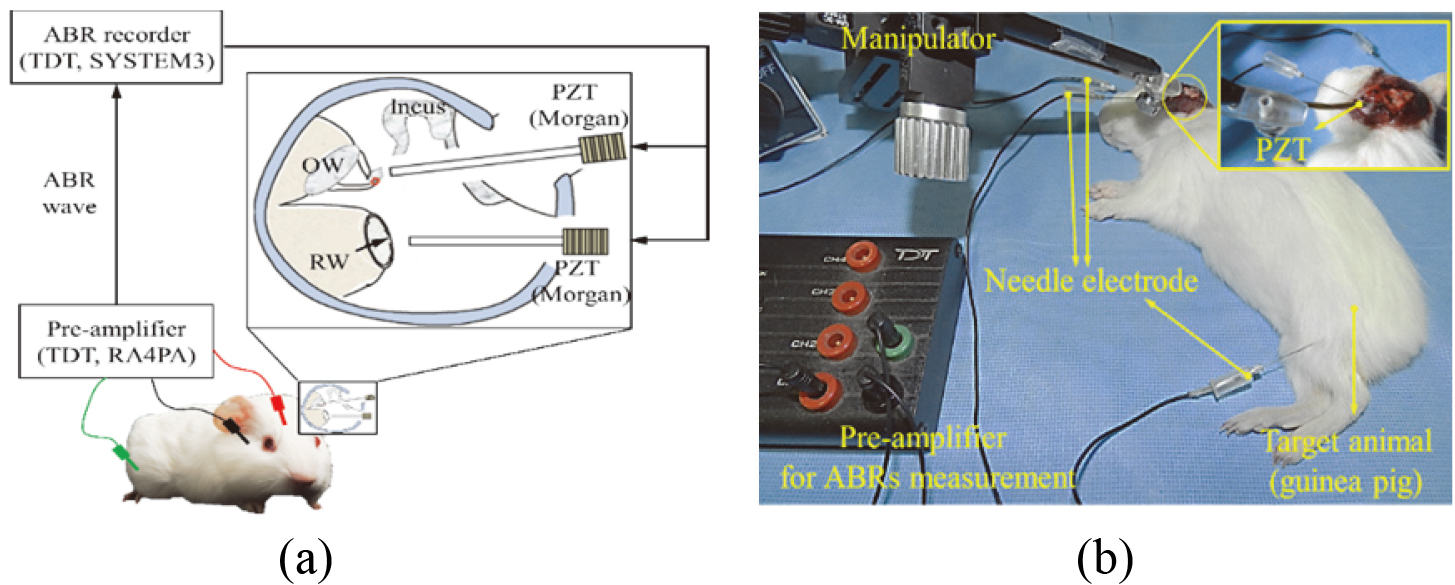
Figure 2.
Experimental results according to the stimulus direction.
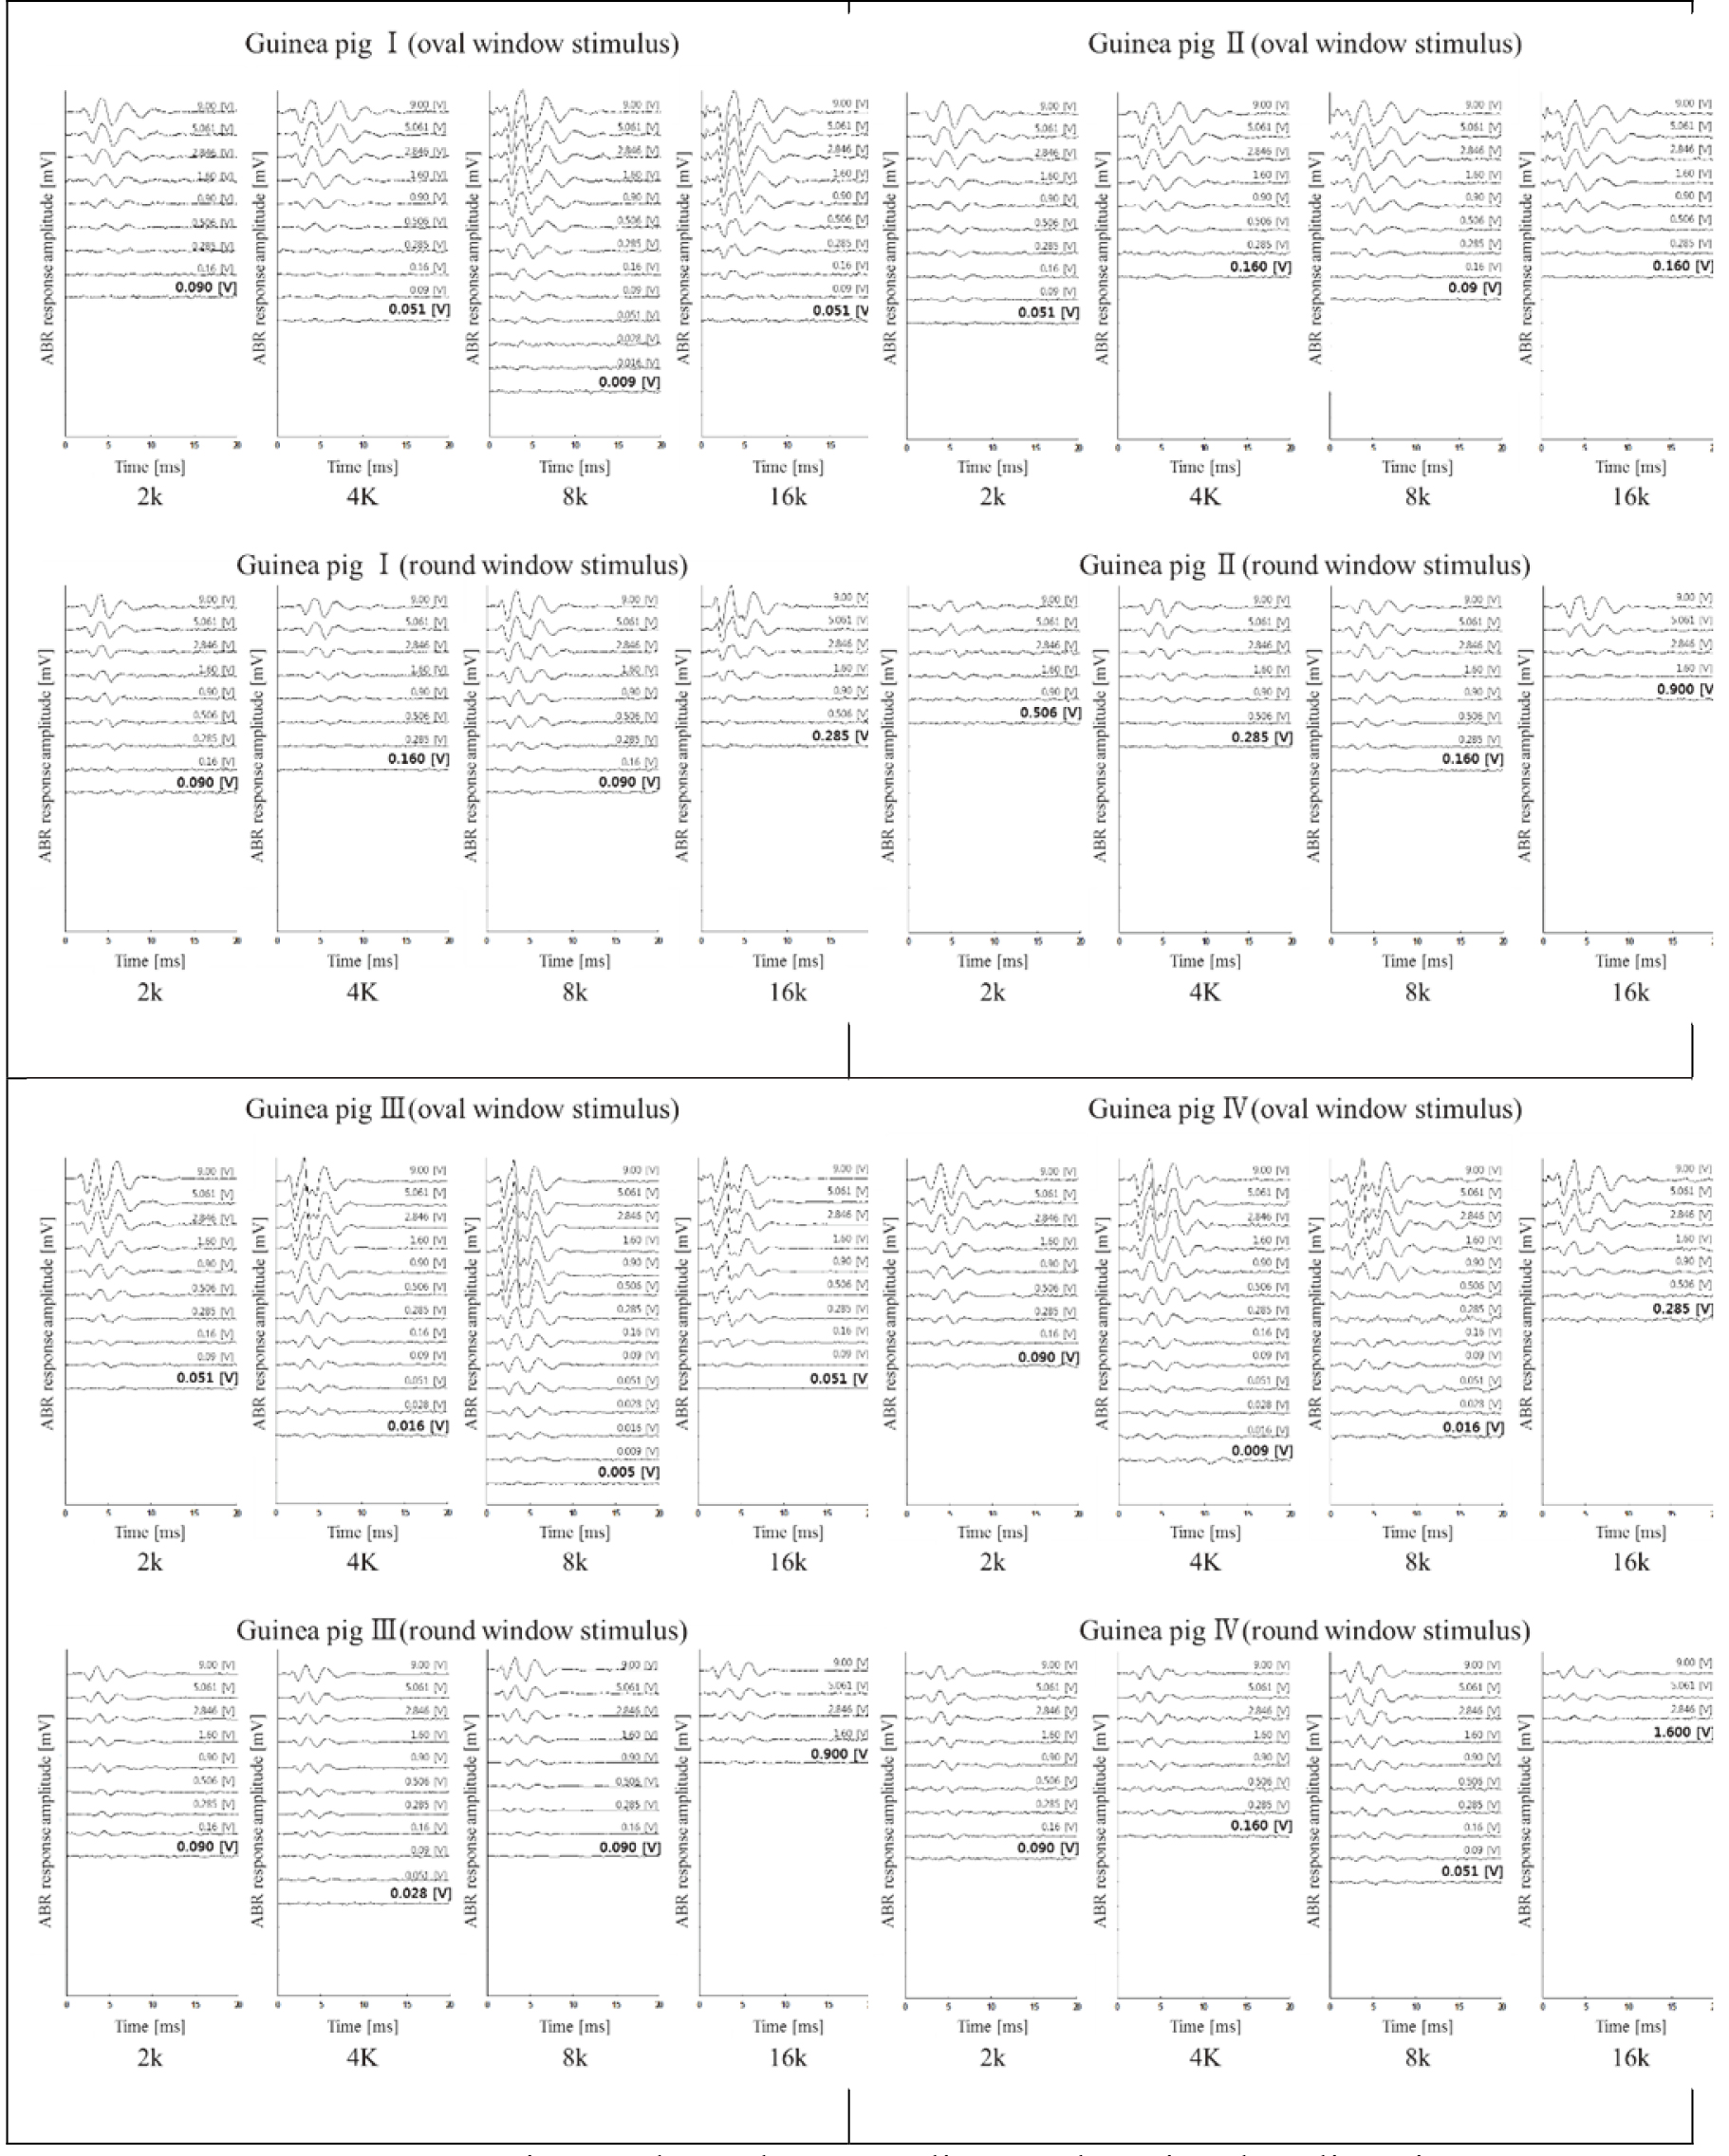
Table 3
The physical quantity corresponding to the mechanical and electrical system [14]
| Mechanical system | Electrical system |
|---|---|
| Force, | Voltage, V [V] |
| Velocity, | Current, I [A] |
| Viscous damping factor, | Resistance, R [ |
| Mass | Inductance, L [H] |
| Stiffness, | Reciprocal of capacitance, C |
Figure 3.
Input voltage at hearing threshold level for frequency.
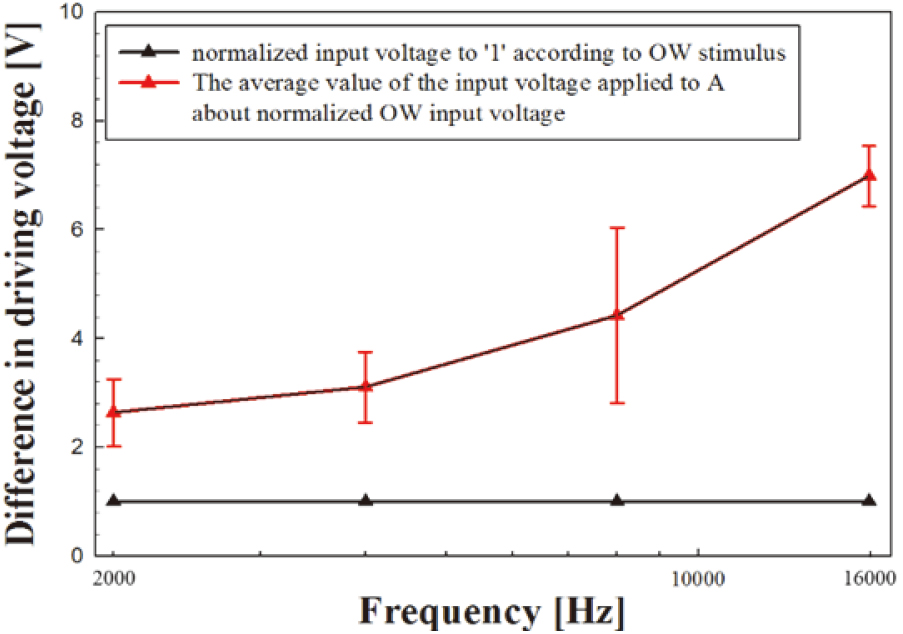
Figure 4.
The lumped parameter model that included oval window stimulus path and round window stimulus.
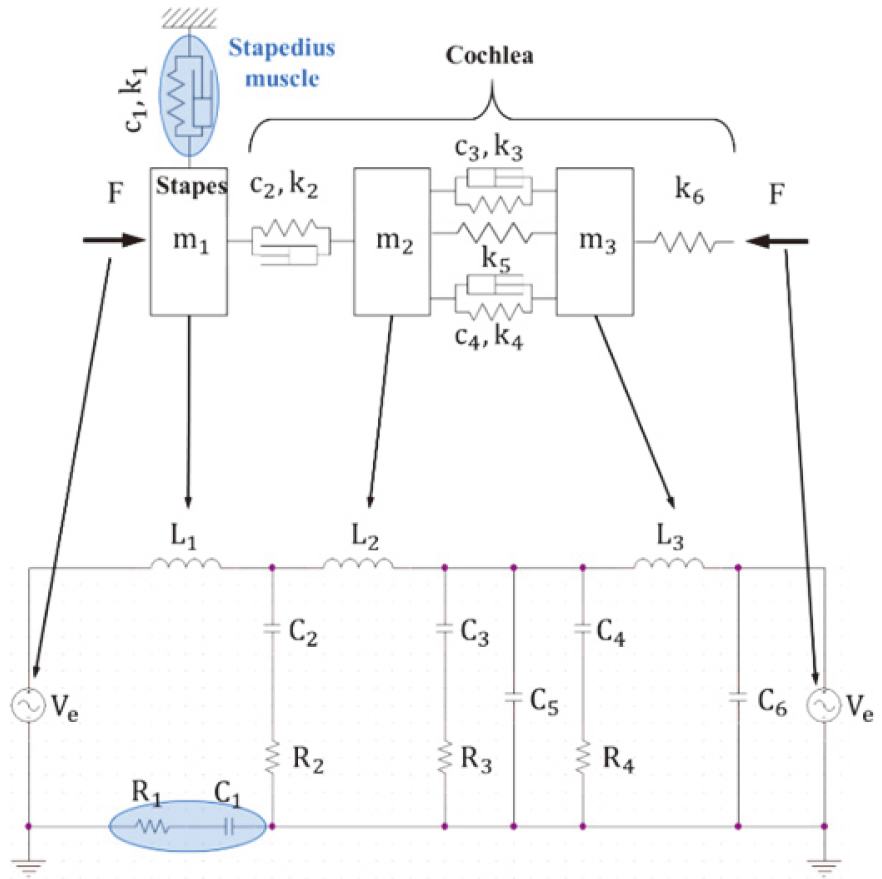
Table 4
The passive parameter values of the lumped parameter model which were produced through regression analysis (Ve
| Name | Symbol in circuit | Resistance | Capacitance [mF] | Inductance [ |
|---|---|---|---|---|
| Stapes | L1 | 4.35 | ||
| Stapedius muscle | R1, C1 | 5.46 | 1.90 | |
| Stapes annulus | R2, C2 | 2.10 | 30.00 | |
| Cochlear | ||||
| Basilar membrane | R3, C3 | 7.32 | 2.00 | |
| R4, C4 | 7.32 | 2.00 | ||
| Helicotrema | C5 | 5.42 | ||
| Scala vestibuli | L2 | 13.00 | ||
| Scala tympani | L3 | 12.80 | ||
| Round window | C6 | 10.80 |
Figure 5.
(a) Schematics of proposed lumped parameter model. (b) Simulation results according to stimulus direction based on the proposed lumped parameter model.
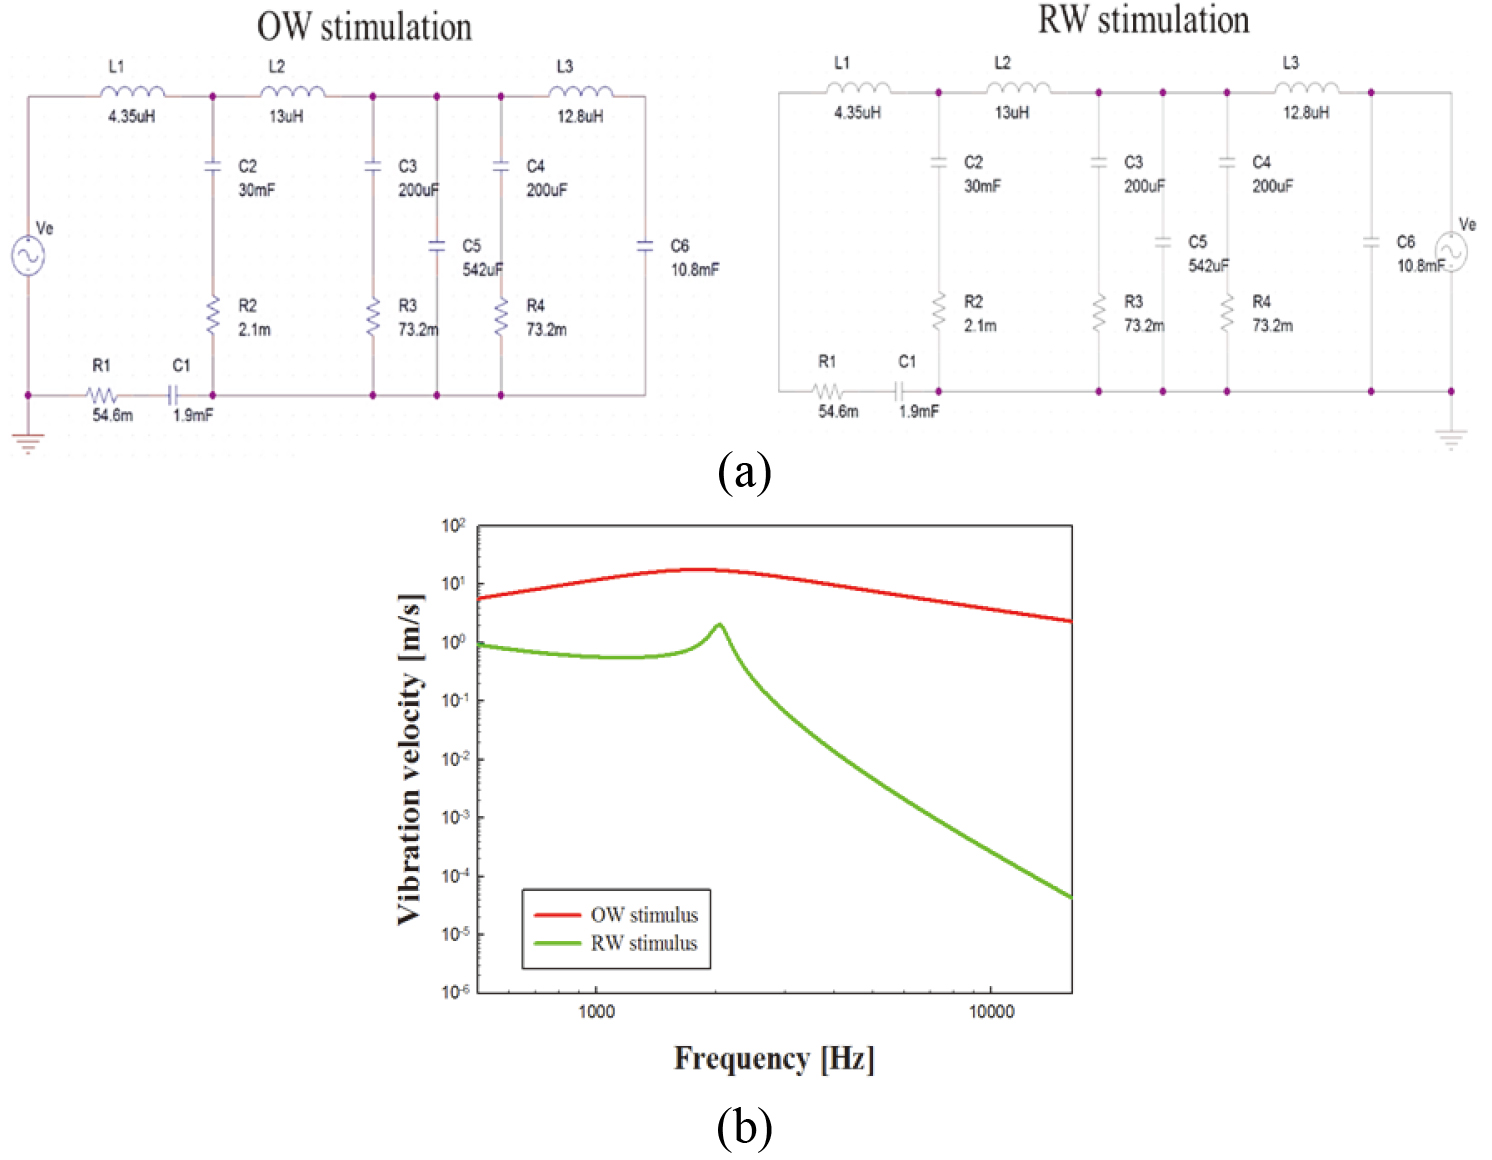
Figure 3 shows the normalized mean input voltages at the ABR thresholds across the tested frequencies during the oval (black line) and round window (red line) stimulation. The red line represents the mean voltage used in round window drive normalized to that in the oval window drive. The mean voltage in the oval window drive was normalized to 1 (black line in Fig. 3).
The input voltages of the two stimulations are related by
(1)
Where, RW
2.2Design of the lumped parameter model
Previously we proposed a lumped-element model of the ear for forward stimulation [13]. The anatomic structures in that model include the air mass of external auditory meatus, muscles, ligaments, ossicles, tympanic membrane and inner ear. However, the inner ear was non-phenomenological. In the present study, we modified the model so that it is capable of simulating both oval and round window drive (Fig. 4). The following modifications were made; the stimulus path for the round window drive was added; the basilar membrane and the helicotrema were taken into consideration for model design; the stapedius muscle was included. Table 3 shows the analogies between the mechanical system and the electrical system. The damping factor, stiffness, mass, velocity, and force in the mechanical model correspond to resistor, capacitor, inductor, current, and voltage in the electrical model, respectively [14].
3.Computer simulation and results
The parameter values of all the elements in the lumped parameter model are listed in Table 4. The parameter values of stapes, stapedius muscle, oval window and cochlear fluid were extracted from our previous model [13]. The parameter values of the basilar membrane, helicotrema, and round window were determined using the regression analysis performed in Multisim software.
Figure 5a show the equivalent model for oval and round window stimulation. Where, voltage source (Ve) is vibration stimulus. Figure 5b shows the model-predicted velocity of the stapes in oval (red line) and round window (green line) stimulation using the same source (Ve). The velocity of stapes in oval window drive is greater than that in round window drive. The difference in stapes velocity between those two stimulations generally increases with frequency. That is similar to what we observed in the experiments. Thus, velocity of the stapes and hearing threshold level depend on the direction of stimulation.
4.Conclusion
In this study, the responses of the auditory system to stimulus of oval and round window were compared with animal experimentation using four guinea pigs. In order to apply the identical vibration stimulus to oval and round window, round window niche was sufficiently drilled out for securing contact area and approaching angle between tip and round window was adjusted with micro-manipulator. After applying the same stimulus with oval and round window, the generated ABR signals were acquired, and the average value of the ABR threshold was compared. And then, the lumped parameter model was proposed that reflects the physical characteristics of the middle-ear and cochlear. In the case of the cochlear, the multi-layered membrane separating scala vestibuli and scala tympani was assumed to be a single membrane. In order to reflect the vibration characteristics of the reverse stimulus, the lumped parameter model was designed in consideration of the helicotrema. The simulated results showed similar to that of animal experiments. The stapes velocity induced to the oval window driving is higher than that in round window driving, and difference of the stapes velocity between oval window and round window increased as frequency increased. As the results of the experiment and simulation, it was confirmed that asymmetrical results were shown according to the stimulus direction. Therefore, the proposed lumped parameter model will be helpful in representing actual biometric characteristics. This model will be useful to understand the cochlear response in round window stimulation.
Acknowledgments
This research was supported by the National Research Foundation of Korea (NRF) grant funded by the Korean government (MSIP) (Nos NRF-2019R1A2C2004347 and NRF-2017R1D1A1B03031388).
Conflict of interest
None to report.
References
[1] | Dillon H. Hearing Aid. Sydeny: Boomerang Press; (2001) . |
[2] | Kroll K, Grant IL, Javel E. The envoy totally implantable hearing system, St. Croix Medical. Trends in Amplification. (2002) ; 6: (2): 73-80. |
[3] | Kim HH, Barrs DM. Hearing aids: a review of what’s new. Otolaryngology-Head and Neck Surgery. (2006) ; 134: (6): 1043-50. |
[4] | Goode RL. Current status and future of implantable electromagnetic hearing aids. The Otolaryngologic Clinics of North America. (1995) ; 28: (1): 141-6. |
[5] | Fisch U. Reconstruction of the ossicular chain. HNO, Berlin; (1978) . |
[6] | Arnold A, Kompis M, Candreia C, Pfiffner F, Hausler R, Sieger C. The floating mass transducer at the round window: direct transmission or bone conduction. Hearing Research. (2010) ; 263: (1-2): 120-7. |
[7] | Lee JH, Park HS, Wei Q, Kim MN, Cho JH. Difference of auditory brainstem responses by stimulating to round and oval window in animal experiments. Bioengineered. (2017) ; 8: (1): 8-13. |
[8] | Lee JW, Seong KW, Lee SH, Lee KY, Cho JH. Comparison of auditory responses determined by acoustic stimulation and by mechanical round window stimulation at equivalent stapes velocities. Hearing research. (2014) ; 314: : 65-71. |
[9] | ASTM. ASTM Standard F2504-05(2014) West Conshohocken, PA: 2014. Standard Practice for Describing System Output of Implantable Middle Ear Hearing Devices. |
[10] | Nakajima HH, Merchant SN, Rosowski JJ. Performance considerations of prosthetic actuators for round-window stimulation. Hearing Research. (2010) ; 263: (1-2): 114-9. |
[11] | Salcher R, Schwab B, Lenarz T, Maier H. Round window stimulation with the floating mass transducer at constant pretension. Hearing Research. (2014) ; 314: (1): 1-9. |
[12] | Eggermont JJ, Ponton CW. Auditory-evoked potential studies of cortical maturation in normal hearing and implanted children: correlations with changes in structure and speech perception. Acta Oto-laryngologica. (2003) ; 123: (2): 249-52. |
[13] | Seong KW, Jung ES, Lim HG, Lee JW, Kim MW, Woo SH, et al. Vibration analysis of human middle ear with differential floating mass transducer using electrical model. IEICE TRANSACTIONS on Information and Systems. (2009) ; 92: (10): 2156-8. |
[14] | Luce RD, Bush RR, Galanter E. Analysis of some auditory characteristics, Handbook of Mathematical Psychology. Wiley and Sons. (1965) ; 3-97. |


