
DNA methylation of AMHRII and INSR gene is associated with the pathogenesis of Polycystic Ovary Syndrome (PCOS)
Abstract
BACKGROUND:
Polycystic ovary syndrome (PCOS) is a common gynecologic endocrinopathy, characterized by menstrual disorders, ovulation disorders, polycystic ovary, hyperandrogen syndrome and insulin resistance. At present, the etiology and exact pathogenesis of PCOS are still unclear. Anti-Müllerian hormone is a local regulator secreted by ovarian granulosa cells, and participates in regulating the occurrence and development of PCOS. Insulin resistance is another important pathophysiological feature of PCOS. Although the expression of anti-müllerian hormone receptor (AMHR) and insulin receptor (INSR) in PCOS have been previously reported, the DNA methylation of the genes have not been well characterized.
OBJECTIVE:
To study AMHR II/INSR and its role in gene methylation in Ovarian and endometrial pathology of PCOS subjects.
METHODS:
We recruited seventy-five women with PCOS as cases and twenty healthy women as controls, using immunohistochemical method, study localization, distribution and expression of MHRII/INSR in ovary and endometrium and then discover the correlation of AMHRII/INSR gene methylation.
RESULTS:
Different clinical features in PCOS group AMHRII gene methylation level and insulin resistance relations have significant differences (
CONCLUSIONS:
The analysis of DNA methylation suggested that methylation of AMHRII and INSR genes was associated with basic clinical characteristics and insulin resistance of PCOS. These results provide evidence for AMHRII and INSR genes, and their methylation levels are intimately associated with the pathogenesis of PCOS.

1.Introduction
Polycystic ovary syndrome (PCOS) is a common endocrine disorder, characterized by menstrual disorders, anovulation, polycystic ovaries, hyperandrogenism and hyperinsulinemia [1], and affects 6%–8% of adolescent women [2]. PCOS has various clinical manifestations, showing high heterogeneity and familial aggregation phenomenon. Although the etiology and pathogenesis of PCOS is still unclear exactly, it is believed that genetic factors play an important role in the PCOS etiology. In recent years, many researchers have focused on the two major secretary characteristics of hyperandrogenism and hyperinsulinemia caused by PCOS [3], and the PCOS-related genes [4], but the epigenetics of PCOS disease is rarely studied. Anti-müllerian hormone (AMH), a member of the transforming growth factor-
Hyperinsulinemia is another important pathophysiologic feature of PCOS, mainly manifesting clinical insulin resistance (IR). Recent studies have proved that IR existed in both local ovary and endometrium of patients with PCOS [8]. The mechanism of IR was regarded to be associated with the number and function of insulin receptor (INSR), thus INSR has become an important target for IR in recent literature. A previous study has also suggested that INSR was one of the susceptibility genes in PCOS patients [9, 10].
With the development of molecular genetics, especially the field of epigenetics research, many scholars tried to find genes associated with the typical pathological characteristics of PCOS patients, and then investigated epigenetic changes of PCOS-related genes to explain the high heterogeneity and familial aggregation phenomenon. In the present study, we analyzed clinical characteristics of PCOS, and investigated the expression and regional distribution of AMHRII and INSR receptors in ovary and endometrium. What’s more, analysis of DNA methylation, as one of common methods for examining epigenetics, was used to determine DNA methylation levels of PCOS-related genes for exploring possible causes of the pathogenesis of PCOS.
2.Materials and methods
2.1Subjects and phenotyping
Seventy-five women with PCOS aged between 20 to 39 years and hospitalized in Family Planning Specialized Hospital of Guangdong Province from March 2014 to December 2014 were selected as case study objects. PCOS was diagnosed based on the European Society for Human Reproduction and Embryology/American Society for Reproductive Medicine Rotterdam criteria. All patients enrolled in the study were required to provide comprehensive general information and register their age, blood pressure, height, weight, hair distribution or other indexes. The position and volume of the uterus, endometrial and ovarian, antral follicle count, and pelvic situation were recorded based on the results that the physician detailed inspected the uterus and bilateral attachment of the subjects. None of the patients had had hormonal therapy for at least 3 months.
Twenty healthy women as controls were randomly enrolled during a reproductive health examination between September 2014 and December 2014. These women were carefully screened to rule out other diseases. They must have normal reproductive systems, sexual hormone levels, immune antibody and chromosome, and should not have taken hormonal therapy for at least 3 months prior to testing.
All subjects who met the inclusion criteria and agreed to participate in the study will sign the informed consent to authorize the use of all clinical data and blood samples for our research, and the study was performed following approval and supervision from the ethics committee of Family Planning Specialized Hospital of Guangdong Province.
2.2Reproductive hormone analysis
All patients’ blood was collected 2–4 days after onset of the menstrual cycle, and the serum levels of estradiol (E2), progesterone (P), testosterone (T), luteinizing hormone (LH) and follicle stimulating hormone (FSH) were measured using ELISA method. The FSH/LH ratio was calculated to determine whether endocrine diseases such as PCOS, hyperandrogenism (T
2.3Hematoxylin and eosin (HE) staining
Twenty paraffin specimens of PCOS ovaries for ovarian wedge resection and twenty paraffin specimens of normal ovarian tissue obtained from part of the ovary for surgical removal of nest cyst and ovarian benign fibroma were as research group and control group, respectively. Twenty paraffin specimens of endometrium tissue from PCOS infertility patients undergoing hysteroscopy examination for repeated failure of in vitro fertilization and embryo transfer (IVF-ET) were obtained as research group, and twenty paraffin specimens of normal proliferative endometrium were collected as control group. These paraffin specimens were cut into 4
2.4Quantitative RT-PCR
Total RNAs were extracted using the RNeasy mini kit (Qiagen, GmbH, Hilden, Germany) and reverse transcription was performed in a total volume of 20
2.5Western blot analysis
Tissue samples collected were homogenized in ice-cold tissue lysate buffer and proteins were extracted according to the manufacturer’s instructions (Beyotime, Haimen, China). The total protein concentration of the supernatant was determined using the BCA protein assay kit (Pierce Chemical Co., Rockford, IL). One hundred micrograms of proteins were loaded on SDS-PAGE (Bio-Rad, Laboratories, Inc., California) and transferred onto a nitrocellulose membrane (Bio-Rad, Laboratories, Inc., California). The membrane was blocked at 37
2.6Immunohistochemistry of AMHRII and INSR
The specimens of ovary and endometrium from seventy five PCOS patients and twenty control women were collected and then cut into 4
2.7DNA methylation of AMHRII and INSR genes
2.7.1Genomic DNA extraction
Whole blood from seventy five PCOS patients and twenty female donors were used for genomic DNA extraction. AMHRII and INSR genes that are associated with the pathogenesis of PCOS were selected for DNA methylation analysis in all samples. Genomic DNA from whole blood was extracted by the phenol-chloroform method [11], with some modifications due to the different volumes of whole blood used. All DNA extracts were stored at
2.7.2Bisulfite treatment
Each DNA extract was dissolved in bisulfite solution and then diluted with 800
Table 1
Reaction reagents for bisulfite treatment
| Reagents | Volume ( |
|---|---|
| DNA solution (1–500 ng) | Variable |
| RNase-free water | Variable |
| Bisulfite solution | 85 |
| DNA protection solution | 15 |
| Total volume | 140 |
Table 2
Primers directed to bisulfite-treated DNA
| Primer name | Primer sequence (5’ to 3’) | 5’Modification |
|---|---|---|
| AMHRII-F | GTTAATTAGGGAGGTAGAGTTTGTAGTGA | |
| AMHRII-R | AATCTAACTCCAAAATCCAAATTCT | 5’ Biotin |
| AMHRII-S | GGTAGAGTTTGTAGTGAG | |
| INSR-F | GGTTGGTTTGTTGAAAATTAGAGA | |
| INSR-R | ATATCTCACTCCCCTTTCCTCAATCC | 5’ Biotin |
| INSR-S | AGGTGTTATTTTTTTAATTTGAAT |
2.7.3PCR of bisulfite-treated DNA
Primers (Table 2) directed to bisulfite-treated DNA were designed by PyroMark Assay Design 2.0 (Qiagen, Hilden, Germany) and then synthesized by Beijing Genomics Institute (Beijing, China). Bisulfite-treated DNA was amplified at 95
2.7.4Pyrosequencing detection
40
2.8Data analysis
SPSS21 software and EpiData3.0 software were applied to analyze statistics and create database, respectively. Chi-square test and
Table 3
Comparison basic clinical features between PCOS and control group (Mean
| Control group ( | PCOS group ( |
|
| |||
|---|---|---|---|---|---|---|
| Age (year) | 28.14 | 27.55 | 0.44 | 0.66 | ||
| Menstrual cycle (day) | 30.1 | 59.53 | 0.000 | |||
| Weight (kg) | 54.22 | 56.41 | 0.29 | |||
| BMI (kg/m | 23.90 | 21.57 | 0.076 | |||
| FSH (mIU/ml) | 5.20 | 5.18 | 0.000 | |||
| LH (mIU/ml) | 4.56 | 7.99 | 0.000 | |||
| LH/FSH | 4.56 | 7.99 | 0.000 | |||
| E2 (pmmol/L) | 134.29 | 343.03 | 0.52 | |||
| PRL (mIU/L) | 368.81 | 0.75 | 0.64 | |||
| T (nmol/L) | 1.52 | 3.09 | 0.000 | |||
| AMH (pg/ml) | 4.80 | 8.10 | 0.000 | |||
| HOMA_IR | 1.65 | 4.99 | 0.02 | |||
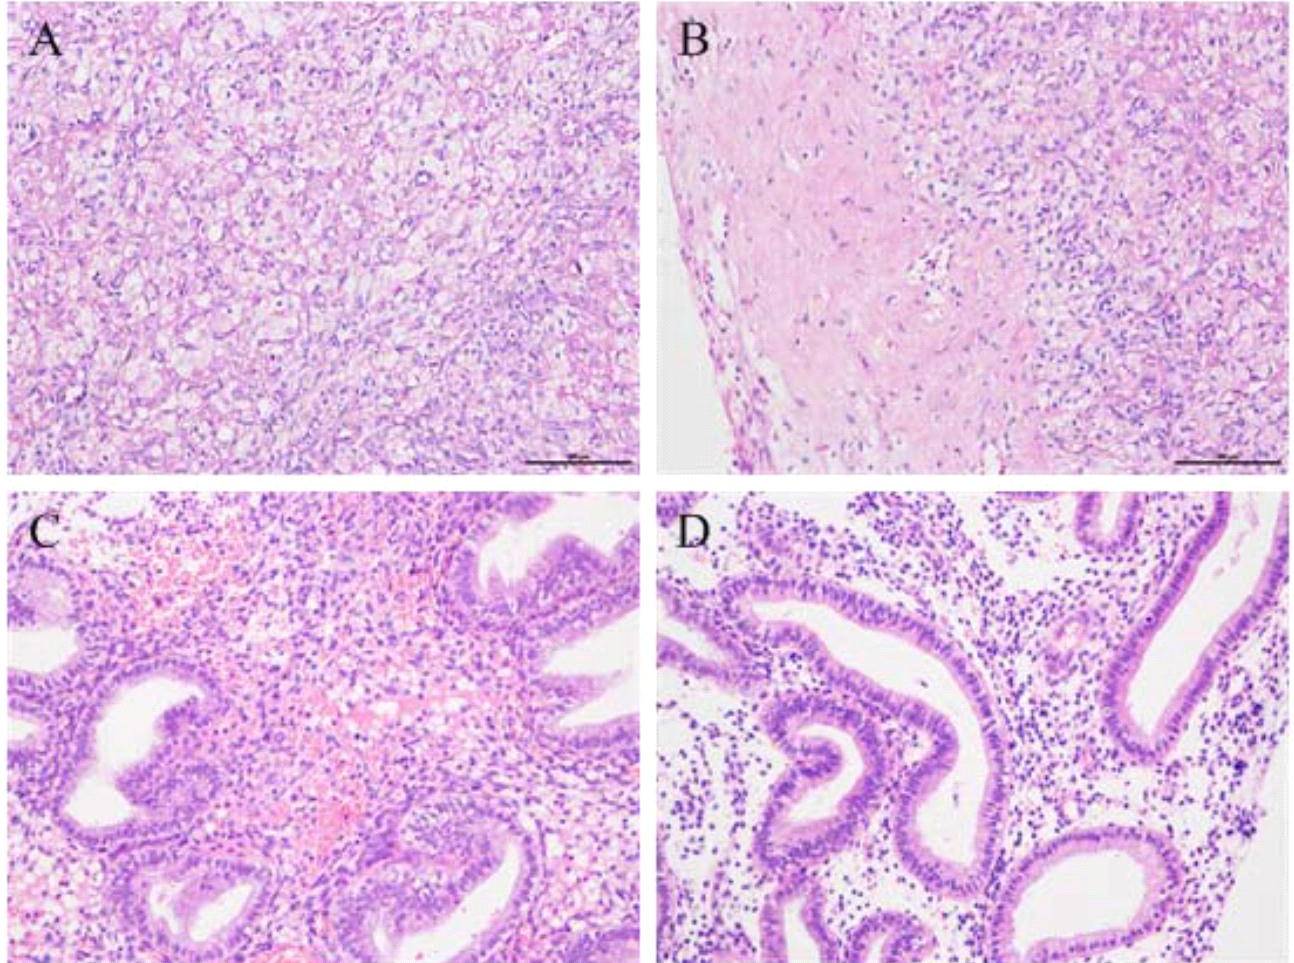
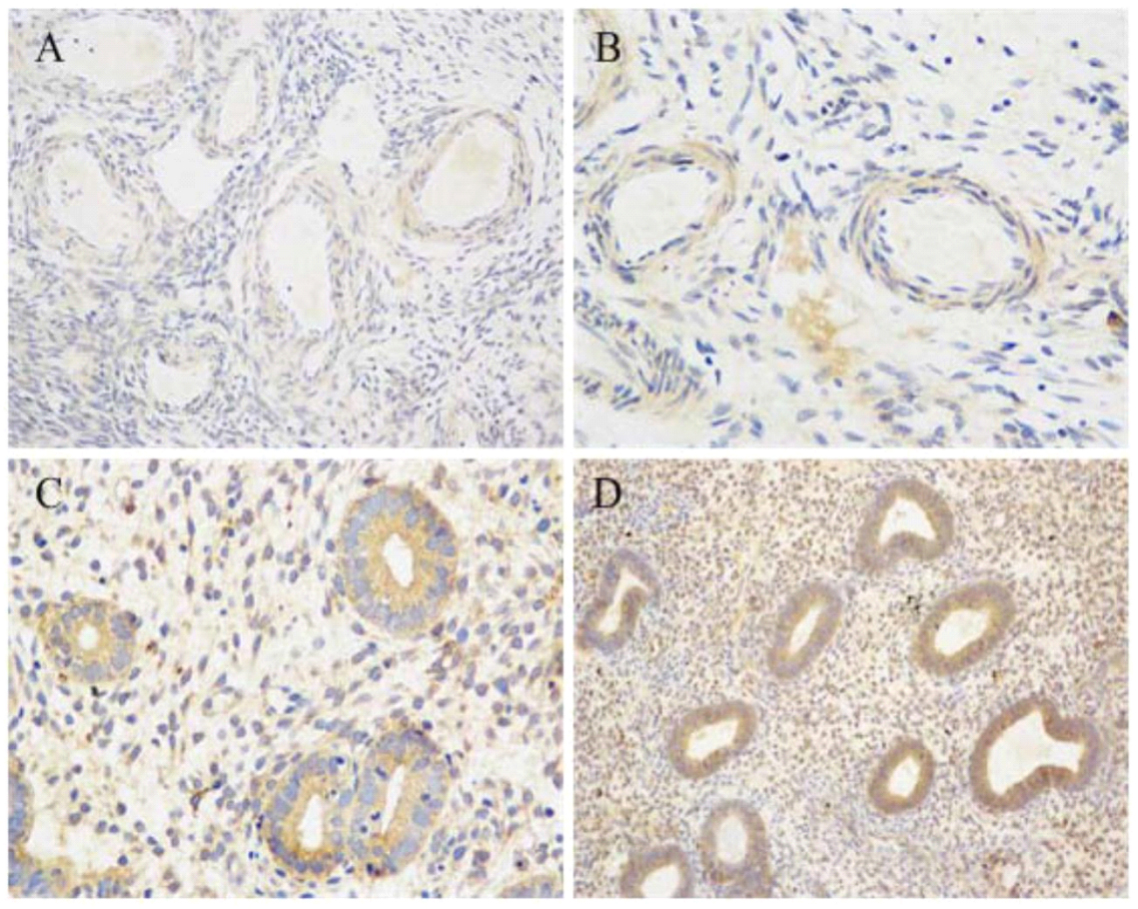
Figure 1.
HE staining for pathological morphology of the ovarian and endometrial tissues. A: control ovarian tissues; B: ovarian tissues of PCOS patients, showing thickening of the tunica albuginea and fiber hyperplasia; C: control endometrial tissues; D: endometrial tissues of PCOS patients, presenting simple hyperplasia, unequal in gland size, irregular shape and less obvious polarity of the gland epithelial cells. Original magnification
3.Results
3.1Clinical characteristics of PCOS patients
Seventy-five cases of PCOS and twenty cases of control group, aged 20 to 39 years, were selected as research subjects. Compared with the control group, the 75 cases of PCOS patients exhibited diverse clinical characteristics, which included 57 cases of oligomenorrhea, accounting for 76%; 54 cases of polycystic ovary changes, accounting for 72%; 53 cases of hyperandrogenism, accounting for 70.7%; 48 cases of IR, accounting for 64%. Comparison between PCOS and control group showed that PCOS patients with longer menstrual cycle, lower FSH, higher LH, LH/FSH, T and HOMA_IR (
3.2HE analysis of pathological morphology
The histopathology from ovarian tissues of PCOS patients revealed expansion of multiple vesicles, decrease of granule cell layers, lack of mature luteal and ovarian stromal hyperplasia, while control ovarian tissues showed normal follicles at different developmental stages, relatively thick granule cell layer and presence of mature luteal (Fig. 1A and B). The histopathology from endometrial tissues of PCOS patients exhibited endometrial thickening, glandular epithelial cell hyperplasia, glandular distortion and endometrial stromal hyperplasia, while control endometrial tissues showed no obvious hyperplasia (Fig. 1C and D).
Table 4
The expression of AMHIIR and INSR genes in endometriun and ovary of PCOS and control groups by RT-PCR
| AMHRII/ | INSR/ | |||||
|---|---|---|---|---|---|---|
| PCOS | Conuol |
| PCOS | Control |
| |
| Endometrium | 0.370 | 0.369 | 0.976 | 0.680 | 0.892 | 0.036 |
| Ovary | 0.670 | 0.415 | 0.002 | 0.287 | 0.298 | 0.828 |
Figure 2.
Western blot analysis of AMHRII and INSR proteins. A: ovary of PCOS; B: ovary of control; C: endometrium of PCOS; D: endometrium of control.
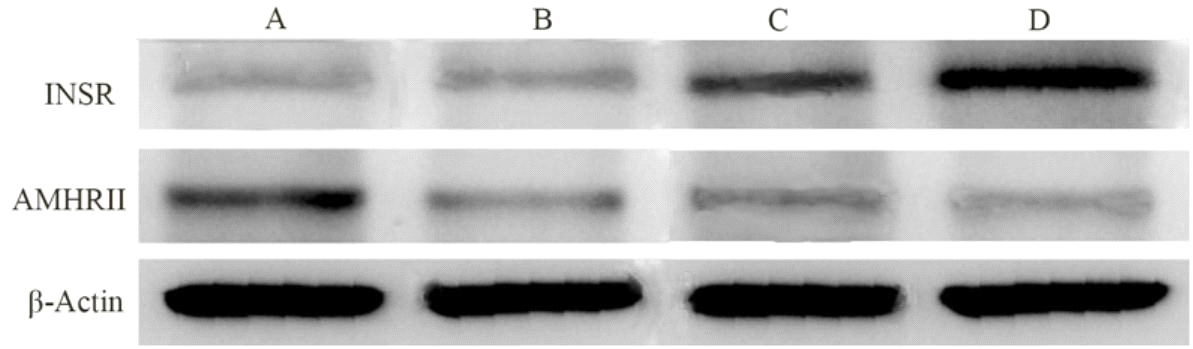
Figure 3.
Average relative gray of AMHRII and INSR proteins to
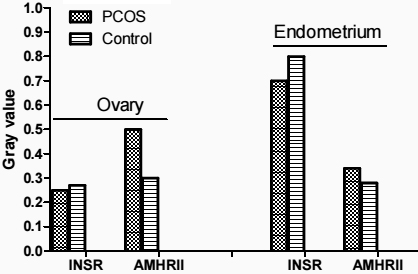
Figure 4.
Immunohistochemical analysis of AMHRII receptor in ovarian and endometrial tissues. A: control ovarian tissues (original magnification
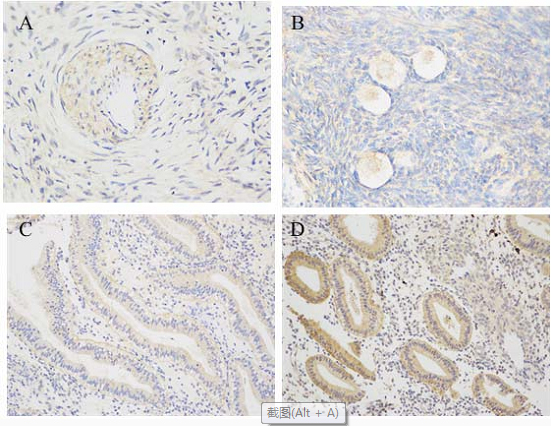
Figure 5.
Immunohistochemical analysis of INSR receptor in ovarian and endometrial tissues. A: control ovarian tissues (original magnification
3.3mRNA and protein expression analyses of AMHRII and INSR
AMHRII gene expression was significantly higher in ovary of PCOS patients than control group (
Western blot analysis confirmed an increased amount of AMHRII protein in in ovary of PCOS patients compared with control, and a decreased concentration of INSR protein in endometrium of PCOS patients compared with control (Figs 2 and 3).
3.4Immunohistochemical analysis of AMHRII and INSR
As is shown in Figs 4 and 5, immunohistochemical analysis displayed that AMHRII and INSR were expressed in ovarian and endometrial tissues of PCOS patients and control group. In patients with PCOS, INSR was expressed in ovarian granulosa and stromal cells, and AMHRII was more obviously expressed in granular cells and had a small amount of distribution in ovarian stromal. In the control group, INSR and AMHRII were mainly expressed in immature ovarian granulosa cells, and a small amount of their expression was found in ovarian stromal. Semi-quantitative analysis of immunohistochemistry showed that a strong expression of INSR in the endometrium of patients with PCOS was significantly higher than that in the control group, and the expression of AMHRII in the endometrium of PCOS patients was slightly higher than that in the control group (Table 5).
Table 5
Average optical density values of INSR and AMHRII in different tissue
| INSR | AMHRII | |||||
|---|---|---|---|---|---|---|
| PCOS | Conuol |
| PCOS | Control |
| |
| Ovary | 0.252 | 0.268 | 0.069 | 0.329 | 0.317 | 0.132 |
| Endometrium | 0.657 | 0.426 | 0.031 | 0.355 | 0.304 | 0.05 |
3.5Quantitative analysis of DNA methylation (I prefer to put the important information in more prominent position, just after the clinical characteristics)
Methylation analysis of AMHRII and INSR genes. DNA methylation of AMHRII and INSR genes was assayed in PCOS group and control group, and four methylation sites of each gene were selected for DNA methylation analysis. There were significant differences of their Pos.3 and Pos.4 between PCOS patients and control group (Tables 6 and 7).
Table 6
Four methylation sites analysis of AMHRII gene
| Pos.1 | Pos.2 | Pos.3 | Pos.4 | |
|---|---|---|---|---|
| Control | 0.4637 | 0.6045 | 0.5245 | 0.1844 |
| PCOS | 0.4951 | 0.5615 | 0.3664 | 0.4076 |
|
| 1.44 | 1.98 | ||
|
| 0.08 | 0.16 | 0.05 | 0.00 |
Table 7
Four methylation sites analysis of INSR gene
| Pos.1 | Pos.2 | Pos.3 | Pos.4 | |
|---|---|---|---|---|
| Control | 0.2588 | 0.7167 | 0.1511 | 0.5499 |
| PCOS | 0.1726 | 0.6391 | 0.2131 | 0.2047 |
|
| 1.88 | 0.73 | 4.06 | |
|
| 0.08 | 0.47 | 0.00 | 0.00 |
DNA methylation was detected in the blood genomic DNA of the PCOS group and the control group. Choose 4 sites for analysis of AMHRII and INSR genes, the basic situation is shown in Figs 6 and 7.
Figure 6.
AMHR2 gene DNA methylation sequencing diagram (BSP method).
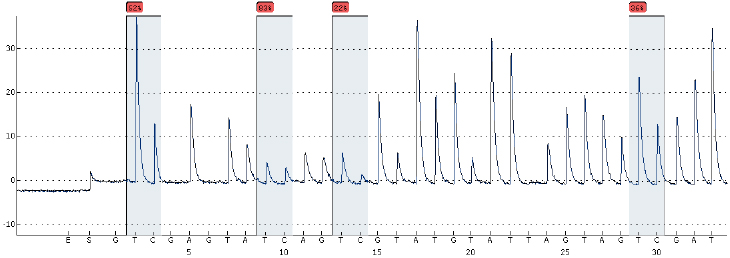
Figure 7.
INSR gene DNA methylation sequencing diagram (BSP method).
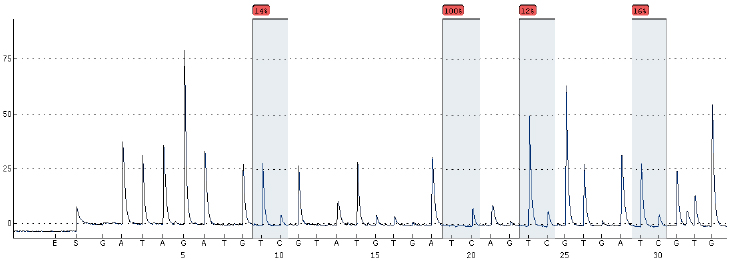
Figure 8.
Correlation between methylation of AMHRII gene and IR.
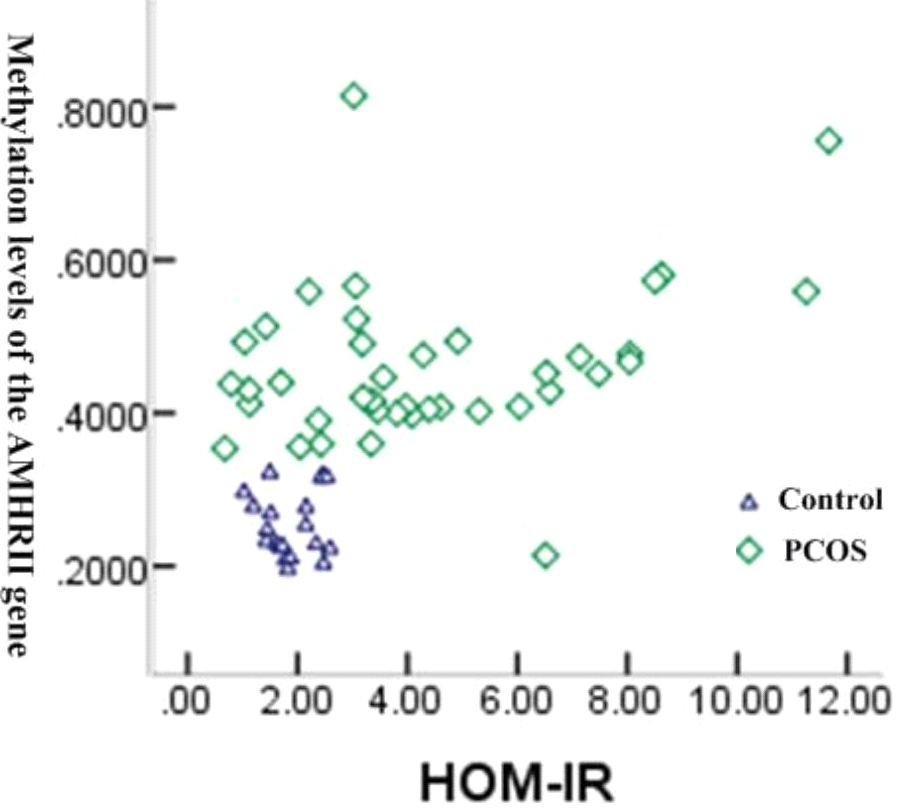
Figure 9.
Correlation between methylation of INSR gene and IR.
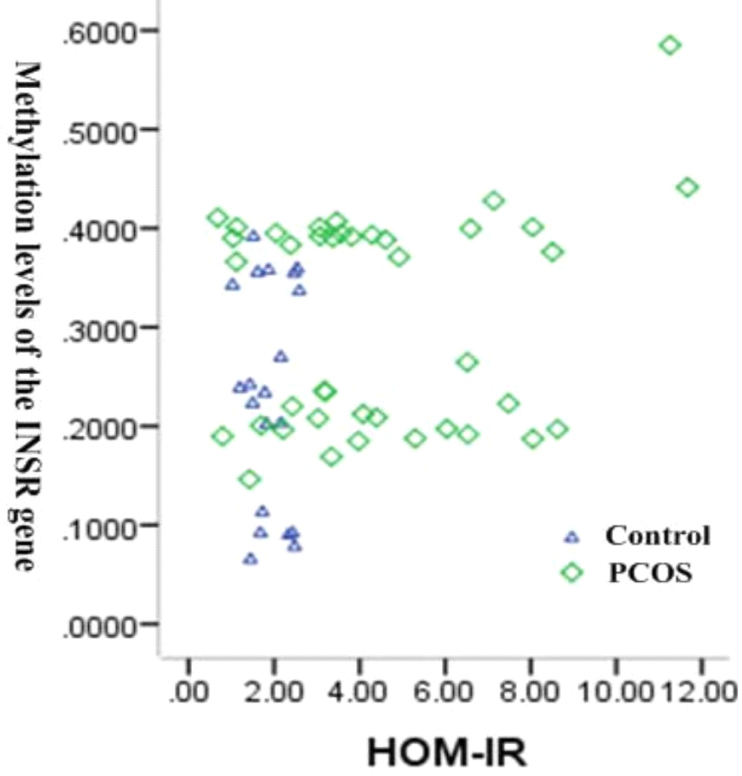
The correlation between DNA methylation of AMHRII gene and IR, and between DNA methylation of INSR gene and IR was analyzed in the PCOS patients and control group. As is shown in Figs 8 and 9, there was significant correlation between methylation of AMHRII gene and IR (
4.Discussion
Clinical characteristics of PCOS show high heterogeneity and pathogenesis of PCOS is very complex. It has been recognized that PCOS is a disease involving endocrine, metabolic and genetic factors [3]. AMH exerted biological function mainly through AMHRII and has been considered a major factor in the development of polycystic ovarian follicles [5]. In fact, there were different experimental points in the protein level of AMHRII expression and its relationship with PCOS.
In this study, the serum AMH concentration in the PCOS group was significantly higher than that in the control group, which was consistent with many studies [12]. In ovarian immunohistochemical sections, it was found that AMHRII was expressed in preantral follicles and antral follicles, and a small amount of positive expression was also found in follicular membrane cells and stroma. Western blot analysis confirmed that the content of AMHRII protein in the ovaries of PCOS patients increased; immunohistochemical results showed that AMHRII was significantly expressed in granulosa cells, but there was no significant difference between the PCOS group and the control group. It is speculated that the increase of preantral follicles and immature follicles such as antral follicles in PCOS increases the concentration of AMH in the serum, and the increase in AMH secretion up-regulates the expression of AMHRII, thereby enhancing its biological effects. Although there was no significant difference in the distribution and expression of AMHRII in ovarian tissue compared with the control group, the results of DNA methylation detection at four sites of the AMHR2 gene were analyzed, and there was no significant difference between the P1 and P2 groups; the PCOS group was significantly lower degree of methylation in P3 and higher in P4 (
Recent studies have shown that IR is also an important factor led to a series of pathophysiological changes in PCOS patients [3, 8, 14]. In the present research, we found expression of INSR in granulosa cell and ovarian stroma, and especially in stromal vascular epithelial, suggesting that INSR may play a role in regulation of ovarian function and occurrence of polycystic ovarian changes. However, semi-quantitative analysis of immunohistochemical images shown no statistical difference between two groups, which was consistent with a previous report [15]. It was illustrated that the mechanism of IR in PCOS patents may be due to the defects of INSR receptor functional or post receptor.
Existing research [16] has shown that PCOS patients not only exerted ovarian dysfunction induced by endocrine, but also corresponding pathological changes of endometrium which mainly manifested as different degrees of endometrial hyperplasia and even endometrial cancer. In this study, different degrees of epithelial cell hyperplasia and a small amount of stromal hyperplasia were also observed in HE staining of endometrium from PCOS patients. Therefore, the risk of endometrial cancer in PCOS patients might be significantly higher than that in normal women.
Recent studies have found that the number of INSRs in the endometrium of PCOS has increased significantly. It was believed that high levels of insulin in PCOS can directly regulate INSR. The immunohistochemical results of this study show that the distribution and expression of INSR in the endometrium of PCOS is stronger than that of the control group. The decrease in the content of INSR protein in the endometrium of the PCOS group may be related to abnormal methylation of INSR, which may lead to abnormal function of INSR gene and affect the expression of INSR protein; low expression of INSR protein further aggravates insulin resistance. In this study, it was found that INSR is mainly expressed in endometrial glandular epithelial cells, as well as in the endometrial stroma. Gray-scale analysis of immunohistochemical sections showed that the positive expression intensity of glandular and interstitial INSR in the PCOS group was higher than that in the control group, indicating that INSR may be involved in the local pathological changes of the PCOS endometrium. Zhu found from an epigenetic point of view that the IR of PCOS not only occurs at the post-receptor level, the INSR itself also has functional abnormalities, manifested by abnormal methylation of the INSR gene. In this study, we conducted a study on the methylation of INSR gene between the PCOS group and the control group, and the results of DNA methylation at the four sites of the INSR gene showed that there was no significant difference between P1 and P2; the PCOS group was significantly higher degree of methylation in P3 and lower in P4 (
IR is closely related to androgen excess and ovulation dysfunction [18]. IR promotes the occurrence of hyperandrogenemia through hyperinsulinemia, inhibits the growth of follicles, and ultimately promotes the increase of serum AMH concentration in PCOS patients. Fonseca [19] found that PCOS patients with IR had a higher serum AMH concentration, suggesting that AMH and IR may have a close relationship. In this study, the correlation analysis of IR with AMHRII and INSR gene methylation were found that the relationship between AMHRII and INSR gene methylation degree with IR were significantly different (
Recent studies found that PCOS was associated with the result of the common action of genetic factors and environmental factors [20]. Epigenetics has generally been regarded as the most reasonable explanation for PCOS, and DNA methylation has become a hot research focus in epigenetic studies. However, there are still no relevant reports about the relationship between epigenetic aspects of DNA methylation of AMHRII gene and pathogenesis of PCOS, and studies on the methylation of INSR gene in PCOS are rarely reported. Zhu [21] found that the abnormal methylation status of INSR gene was occurred in PCOS patients. In the present study, four methylation sites of AMHRII and INSR genes were detected in 40 cases of PCOS patients and 20 cases of control group, which shown no significant differences in Pos.1 and Pos.2 of each gene, but significant differences in Pos.3 and Pos.4 of each gene between PCOS patients and control group. It was illustrated that there was correlation between PCOS and DNA methylation of two genes. In addition, the correlation between DNA methylation of two genes and IR was analyzed in 75 cases of PCOS patients with different clinical characteristics, which shown there was significant correlation between methylation of AMHRII gene and IR, and between methylation of INSR gene and IR.
However, we could not analyze methylation levels in ovarian and endometrial tissues due to the difficulties in collecting fresh ovarian and endometrial tissues, which was a defect of this study. At the same time, whether there is an interaction between AMHR2 and INSR gene DNA methylation that continuous research is still needed in the future.
Acknowledgments
We thank all people who participated in this study. This work was supported by the Guangzhou Science and Technology Innovation Project (Grant number: 201804010003).
Conflict of interest
None to report.
References
[1] | Norman RJ, Dewailly D, Legro RS, Hickey TE. Polycystic ovary syndrome. Lancet. (2007) ; 370: (9588): 685–697. doi: 10.1016/S0140-6736(07)61345-2. |
[2] | Azziz R, Woods KS, Reyna R, Key TJ, Knochenhauer ES, Yildiz BO. The prevalence and features of the polycystic ovary syndrome in an unselected population. J Clin Endocrinol Metab. (2004) ; 89: (6): 2745–2749. doi: 10.1210/jc.2003-032046. |
[3] | Di Sarra D, Tosi F, Bonin C, et al. Metabolic inflexibility is a feature of women with polycystic ovary syndrome and is associated with both insulin resistance and hyperandrogenism. J Clin Endocrinol Metab. (2013) ; 98: (6): 2581–2588. doi: 10.1210/jc.2013-1161. |
[4] | Sproul K, Jones MR, Mathur R, Azziz R, Goodarzi MO. Association study of four key folliculogenesis genes in polycystic ovary syndrome. BJOG. (2010) ; 117: (6): 756–760. doi: 10.1111/j.1471-0528.2010.02527.x. |
[5] | Josso N, di Clemente N, Gouédard L. Anti-müllerian hormone and its receptors. Mol Cell Endocrinol. (2001) ; 179: (1–2): 25–32. doi: 10.1016/s0303-7207(01)00467-1. |
[6] | Visser JA, de Jong FH, Laven JS, Themmen AP. Anti-müllerian hormone: a new marker for ovarian function. Reproduction. (2006) ; 131: (1): 1–9. doi: 10.1530/rep.1.00529. |
[7] | Du DF, Li XL, Fang F, Du MR. Expression of anti-müllerian hormone in letrozole rat model of polycystic ovary syndrome. Gynecol Endocrinol. (2014) ; 30: (12): 885–889. doi: 10.3109/09513590.2014.943723. |
[8] | Iatrakis G, Tsionis C, Adonakis G, et al. Polycystic ovarian syndrome, insulin resistance and thickness of the endometrium. Eur J Obstet Gynecol Reprod Biol. (2006) ; 127: (2): 218–221. doi: 10.1016/j.ejogrb.2006.01.023. |
[9] | Unsal T, Konac E, Yesilkaya E, et al. Genetic polymorphisms of FSHR, CYP17, CYP1A1, CAPN10, INSR, SERPINE1 genes in adolescent girls with polycystic ovary syndrome. J Assist Reprod Genet. (2009) ; 26: (4): 205–216. doi: 10.1007/s10815-009-9308-8. |
[10] | Siegel S, Futterweit W, Davies TF, et al. A C/T single nucleotide polymorphism at the tyrosine kinase domain of the insulin receptor gene is associated with polycystic ovary syndrome. Fertil Steril. (2002) ; 78: (6): 1240–1243. doi: 10.1016/s0015-0282(02)04241-3. |
[11] | Di Pietro F, Ortenzi F, Tilio M, Concetti F, Napolioni V. Genomic DNA extraction from whole blood stored from 15- to 30-years at -20∘C by rapid phenol-chloroform protocol: a useful tool for genetic epidemiology studies. Mol Cell Probes. (2011) ; 25: (1): 44–48. doi: 10.1016/j.mcp.2010.10.003. |
[12] | Dursun F, Güven A, Yıldız M. Assessment of anti-müllerian hormone level in management of adolescents with polycystic ovary syndrome. J Clin Res Pediatr Endocrinol. (2016) ; 8: (1): 55–60. doi: 10.4274/jcrpe.2338. |
[13] | Kevenaar ME, Laven JS, Fong SL, et al. A functional anti-mullerian hormone gene polymorphism is associated with follicle number and androgen levels in polycystic ovary syndrome patients. J Clin Endocrinol Metab. (2008) ; 93: (4): 1310–1316. doi: 10.1210/jc.2007-2205. |
[14] | Chakraborty P, Ghosh S, Goswami SK, Kabir SN, Chakravarty B, Jana K. Altered trace mineral milieu might play an aetiological role in the pathogenesis of polycystic ovary syndrome. Biol Trace Elem Res. (2013) ; 152: (1): 9–15. doi: 10.1007/s12011-012-9592-5. |
[15] | Xiao YL, Gui YZ, Shi HZ. Expression of insulin, insulin-like growth factors and their receptors in patients with polycystic ovarian syndrome. Reproduction & Contraception. (2004) , 24. |
[16] | Hardiman P, Pillay OC, Atiomo W. Polycystic ovary syndrome and endometrial carcinoma [published correction appears in Lancet. 2003 Sep 27; 362(9389): 1082]. Lancet. (2003) ; 361: (9371): 1810–1812. doi: 10.1016/s0140-6736(03)13409-5. |
[17] | Zhong XM, Sun XH, Wei XC, et al. Analysis of correlation of AMH expression and insulin resistance degree in PCOS rats. Chinese Journal of Immunology. (2014) ; 30: (3): 307–311. |
[18] | Dale PO, Tanbo T, Haug E, Abyholm T. The impact of insulin resistance on the outcome of ovulation induction with low-dose follicle stimulating hormone in women with polycystic ovary syndrome. Hum Reprod. (1998) ; 13: (3): 567–570. doi: 10.1093/humrep/13.3.567. |
[19] | Fonseca HP, Brondi RS, Piovesan FX, Miklos TG, Aldrighi JM. Anti-mullerian hormone and insulin resistance in polycystic ovary syndrome. Gynecol Endocrinol. (2014) ; 30: (9): 667–670. doi: 10.3109/09513590.2014.920004. |
[20] | Brower MA, Jones MR, Rotter JI, et al. Further investigation in europeans of susceptibility variants for polycystic ovary syndrome discovered in genome-wide association studies of Chinese individuals. J Clin Endocrinol Metab. (2015) ; 100: (1): E182–E186. doi: 10.1210/jc.2014-2689. |
[21] | Zhu L, Xing F, Quan S. The study of LHR, INSR, AR genes’ methylation states in PCOS animal model. Fertility and Sterility. (2008) ; 90: : S137. |


